Abstract
Phenolic compounds have a positive effect on obesity, diabetes, and cardiovascular diseases because of their antioxidant and anti-inflammatory capacity. The prevalence of these diseases has increased in the last years in the Mexican population. Therefore, the Mexican diet must be assessed as provider of phenolic compounds. To assess this, a survey of phenolic compound intake was validated and applicated to 973 adults (798 females) between 18 and 79 years old. We compared the phenolic compound intake of 324 participants with more diseases (239 females) and 649 participants with healthier condition (559 females). The groups differed in sex, age, and scholarship. Males, older participants, and those with lower schooling reported suffering from more diseases. Regarding phenolic compound intake analyses, the participants with healthier conditions displayed a higher phenolic compound intake than the other group in all foods assessed. In addition, the regression model showed that the phenolic compounds intake of Mexican dishes, such as arroz con frijol or enchiladas, positively affected health status, suggesting that this traditional food is beneficial for the participant’s health condition. However, the weight effect of PCI was different for each disease. We conclude that, although PCI of Mexican food positively affects health conditions, this effect depends on sex, age, and participants’ diseases.
1. Introduction
In recent years, nutrition science has focused on counteracting nutrient deficiency and some diseases by identifying active-food components. Diet offers the possibility to improve the subject’s health conditions by using these components or functional food [1]. Functional food is part of a habitual diet, but it has special biological properties, such as phenolic compounds (PC). PCs are a diverse group of plant micronutrients [1], some of which modulate physiological and molecular pathways involved in energy metabolism [2]. They can act by different mechanisms, the most important of them are conducted by anti-inflammatory, antioxidant activities, and antiallergic [3]. The anti-inflammatory activity entails the activation of sirtuins; induction of Nrf2 via inhibition of microglial activation; and suppression of proinflammatory mediators (TNF-α, prostaglandins, C-reactive protein levels, interleukins IL-1α, IL-1β, IL6, IL8, and intercellular adhesion molecule-1), while the antioxidant activity captures unpaired electrons present in free radicals, interruption of autoxidation chain reactions, deactivation of singlet oxygen, mitigation of nitrosative stress, activation of antioxidant enzymes, or inhibition of oxidative enzymes [1]. PCs can be divided into flavonoid and non-flavonoid derivatives [2,4]. Flavonoid is the most important PC class and includes more than 5000 compounds [5] that seem to impact human health positively. Multiple authors have explained the underlying mechanism of PC effect on human health. Oxidative stress (OS) and inflammation triggered by increased OS are the cause of many chronic diseases in reactive-oxygen species (ROS) [6]. Although OS is part of normal cellular conditions (e.g., mitochondrial respiratory chain), this could damage other biological molecules [7]. Therefore, the human body must trigger antioxidant mechanisms to prevent cellular injury. Interestingly, flavonoids have a protective effect because they counteract OS by using at least four mechanisms; (1) reduction of free radical formation, (2) protection of α-tocopherol in Low Density Lipoprotein (LDL) from oxidation, (3) regeneration of oxidized α -tocopherol, and (4) chelation of metal ions such as Fe and Cu, preventing the consequent production of new free radical [1].
Moreover, recent studies explain how PC positively affect certain illnesses, such as obesity, diabetes, cardiovascular diseases, thrombocytopenia, or metabolic syndrome [1,8,9]. Several common features characterize these pathologies; among them, we can highlight the redox balance and a notable inflammatory response that strongly alters the biochemical and functional characteristics of the affected tissues.
Regarding obesity, it results from energy imbalance, increasing adipose tissue [10,11]. PC intake reduce the weight gain by reducing adipose tissue using lipolysis [1,10,11,12,13,14]. Others studies report that subjects with obesity show a low level of antioxidant enzymes (e.g., catalase, glutathione peroxidase, and glutathione reductase), which generates lower antioxidant capacity [11,13,15,16]. Therefore, PC intake might also increase their antioxidant capacity through free-radical scavenging activity.
Significant evidence from epidemiological investigations showed that dietary PCs might manage and prevent type 2 diabetes (T2D) [1]. T2D disease consists of metabolism disturbances characterized by chronic hyperglycemia or impairment of insulin secretion or action [17]. Hyperglycemia increases ROS production by glucose auto-oxidation and nonenzymatic glycation processes, affecting the normal function of proteins and lipids. Therefore, high PC intake has been highly recommended for this disease management to counteract ROS [1]. In addition, PCs from coffee, guava tea, whortleberry, olive oil, propolis, chocolate, red wine, grape seed, and cocoa have been reported to show antidiabetic effects in T2D patients through increasing glucose metabolism and improving vascular function, as well as reducing insulin resistance and the HbA1c level [1].
On the other hand, cardiovascular diseases entail problems in the heart and blood vessels. Patients frequently show increased blood pressure, evidencing a disorder in the circulatory system [18]. PC intake improves endothelial dysfunction [19,20], decreases vascular OS [20,21], inhibits platelet aggregation and the oxidation of LDL, and reduces blood pressure, evidencing their counteracting capacity on cardiovascular disease symptoms [19,21].
Most interventions for these diseases have been focused on changing the patient’s diet, but they have failed to conform to eating habits associated with culture. It is well known that there are multiple dietary habits worldwide, many of which have been described as a good source of PC. For example, in the Western diet, fruit, vegetables, tea, wine, and cocoa products provide a mean intake of flavonoids of around 250 mg/d for the United States (US) adults [4,22]. Greek and Korean populations have similar flavonoid intake to the US population, with a mean between 250 and 320 mg/d. In contrast, the British population has a PC intake greater than other countries because they consume around 1000 mg/d [22,23,24]. However, there is no data about the PC intake of Latino American populations, even when these have outstanding gastronomic richness.
Traditional Mexican food is characterized by using grains, tubers, legumes, vegetables, and spices [25,26], most of which are rich in PC [27]. However, the Mexican diet has changed over the last decades because traditional food has been replaced with ultra-processed food with high-caloric values [28,29]. Moreover, some vegetables and fruits are preferably consumed after some kind of processing, affecting the quantity, quality, and bioavailability of the PCs [1]. Along with changes, diseases associated with eating habits have increased by more than 27% in the Mexican population [24,30]. Over the last two years, the National Health and Nutrition Survey reports that 72.2% of the Mexican population is overweight or obese [28,29]. In a posterior survey, they added that 30.2% of the adults have hypertension, and 15.6% suffer from diabetes. In addition, there is a high prevalence of dyslipidemia diseases, with 49% of the adult population suffering from high levels of triglycerides and 54.3% with high cholesterol levels [24,30]. Health reports have also correlated the increased prevalence of these diseases with a decreased intake of fruits and vegetables.
In this study, we expected to find a better health condition in participants with higher PC intake. Given that traditional Mexican food is not ultra-processed, and this seems to contain high levels of PC [25,26], we would expect that participants with a higher intake of beverages or Mexican dishes would show better health conditions than those with a lower intake.
2. Materials and Methods
2.1. Participants
Nine hundred and seventy-three adults (798 females; 175 males) between 18 and 79 years old were enrolled in this study. They were ethnic Mexican and native Spanish speakers and had at least nine years of education. In this study, health condition was obtained from volunteers through a survey; therefore, they were not explored by a physician. All participants were informed of their rights and provided written informed consent for participation in the study. This research was carried out ethically and was approved by the Benemérita Universidad Autónoma de Puebla.
2.2. Procedure
This is a cross-sectional study with a non-probabilistic sample. We obtained the data from a self-administered food consumption survey, which was directed at the open public. In the survey, we requested the food intake frequency with a high level of phenolic compound [1].
2.2.1. Survey of Food Consumption with a High Level of Phenolic Compounds
The survey assesses participants’ intake of food and health condition. This entails one hundred and twenty-four items distributed in nine sections: (1) identification data; (2) anthropometric data; (3) medical records; and (4) food intake frequency with a high level of PCs in the last month: fruits, vegetables, cereals, legumes, spices, beverages, and Mexican dishes (See Table A1). The survey was posted on social media (i.e., Facebook) or via WhatsApp or email.
2.2.2. Validation
The survey was applied to the pilot group of 32 subjects, who reported a complete understanding of the items. They also reported being comfortable with all items and completion times. The pilot group responded to 100% of the questions. The statistical analysis for the survey’s validation was performed using a chi-square test. The factor analysis technique assessed the items with an orthogonal rotation “Varimax”. In this analysis, the factor weight of each item was at least 0.4 for all items. We also measured internal consistency of each item for each factor, exploring their reliability using Cronbach’s alpha (0.96).
2.3. Data Analysis Methods
2.3.1. Clustering Analysis
A K-means clustering was performed to determine the participant’s health-condition level. The variables included were the body mass index (BMI); number of diseases (diabetes, hypertension, hypercholesterolemia, hypertriglyceridemia, kidney disease, and fatty liver); and number of gastrointestinal symptoms or illnesses: constipation, gastritis, irritable bowel syndrome (IBS), peptic ulcer, bacterial overgrowth syndrome (BOS), and ulcerative colitis (UC). The clustering analyses resulted in 649 participants with less diseases (LD) and 324 with more diseases (MD).
2.3.2. Comparisons between LD and MD Groups
Demographic data. A chi-square test was used to compare groups for sex and age distribution. The groups were also compared for the scholarship, BMI, number of dietary supplements, number of diseases, and number of gastrointestinal symptoms or illnesses using independent t-tests.
Phenolic compounds intake. We calculated the frequency of PC intake for each participant. For food intake frequency, we considered the number of times the food was consumed and its grams in the last month. We calculated the frequency of phenolic-compounds intake (PCI) using the food biochemistry composition reported in multiple papers (See Table 1), and selected only papers describing total phenolic compounds (TPC) mg gallic acid equivalent (GAE)/100 g. Given that TPC’s composition varies by multiple conditions, we computed the TPC’s average for each food, considering the variations (i.e., fruits, vegetables, cereals, legumes, seeds, spices, and beverages). Then, for each participant as follows:
PCI = [(food-intake frequency × TPC)/participant’s BMI].

Table 1.
Total phenolic compounds (TPC) of each food.
For Mexican dishes, we added the TPC of each recipe’s ingredient, then recalculated TPC for an individual portion of each recipe (TPCr). Given that some recipes of Mexican dishes are varied, we averaged the TPC of individual portions between recipes (See Table A2). For the analyses, we calculated phenolic compounds intake of recipe (PCIr) for each participant as follows:
PCIr = [(food-intake frequency × Average of TPCr)/participant’s BMI].
ANOVAs were performed for each nutritional group (i.e., fruits, vegetables, cereals, seeds, spices, beverages, and Mexican dishes), and the sex or age category was considered as a between-subject factor, while PCI/PCIr was included as a within-subjects factor.
Two-way ANOVAs were performed for each nutritional group. Group (i.e., LD and MD) and the sex or age category was considered as a between-subject factor to observe the sex and age category effects, and PCI or PCIr was included as a within-subjects factor. Data were analyzed using SPSS Statistics 21. Greenhouse–Geisser corrections were made for violations of sphericity when the numerator was greater than 1, p-values resulting from a set of comparisons were corrected by the false discovery rate method (FDR). We report results surviving FDR correction (p values < 0.05).
2.3.3. Risk of Developing Disease
Regression analyses were performed to identify the association between the participant’ diseases, PCI or PCr, and other variables. Linear regression was performed using as a dependent variable our cluster (i.e., LD and MD groups), and PCI, PCIr, sex, age, and scholarship were also included as independent variables. Linear regression was also performed per disease (i.e., diabetes, hypertension, hypercholesterolemia, hypertriglyceridemia, kidney disease, fatty liver, and obesity), including as the dependent variable the presence or absence of disease, and PCI, PCIr, sex, age, scholarship as independent variables. The linear regression analyses include multiple linear backward regressions to find a reduced model that best explains the data. A p-value < 0.05 was considered statistically significant in all analyses.
3. Results
3.1. Demographic Results
Differences between groups were also observed in the sex (Xi (1) 22.4, p < 0.001) and age category distributions (Xi (4) 34.2, p < 0.001). The men’s distribution was greater than expected in the MD group (See Table 2). In contrast, in the age category, the groups differed in the subset of participants between 18 and 29 years old. A greater number of participants than the expected count was observed for the LD group, while the inverse pattern was observed for the MD group.
Table 2.
Sex and age range of participants.
The groups were significantly different in scholarship (t (971) 3.7, p < 0.001). The LD group had greater years of schooling than the MD group (LD, Mean (M) = 15.4; MD, M = 16.0; Cohen’s d = 0.2). They also differ in BMI (t (971) −32.3, p < 0.001), with the LD group displaying lower BMI than the other group (LD, M = 22.4; MD, M = 30.1; Cohen’s d = −2.2). In addition, the groups did not differ in the number of dietary supplements consumed (t (971) 1.7, p = 0.1; LD, M = 0.8; MD, M = 0.7).
As we expected, the MD group also showed greater numbers of diseases than the LD group (t(971) −7.1, p < 0.001, Cohen’s d = −0.4; LD, M = 0.1; MD, M = 0.4). However, they did not differ in the number of gastrointestinal diseases or symptoms (t (971) 1.2, p = 0.2) (See Table 3).
Table 3.
Distribution of diseases in the LD and MD groups.
3.2. Phenolic Compounds Intake Results
Regardless of the level of the health condition, participants had a greater intake of apples (67.2%), oranges (56.7%), tomatoes (86.7%), white onions (79.9%), chilies (71.5%), carrots (71.5%), lettuce (70.3%), nopal (58.2%), potatoes (57.7%), corn (74.2%), rice (67.8%), oatmeal (56.5%), and beans (65.9%). The beverages more frequently consumed were coffee (65.1%) and hibiscus water (54.6%), while the Mexican dishes more consumed were salsas verdes (61.9%), followed by salsas rojas (57.5%) (see Figure 1A).
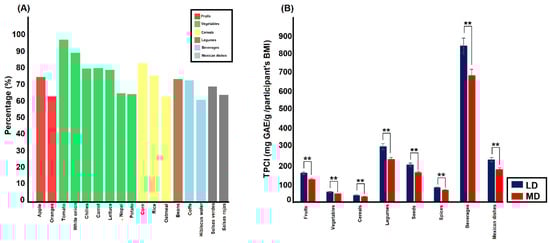
Figure 1.
Bar graph (A) shows food more frequently consumed in this Mexican sample, while bar graph (B) illustrates differences in the total phenolic compounds intake (PCI) of all food groups between LD and MD groups. ** p < 0.001.
The sex groups differed in PCI of some foods. Females had a higher PCI of cereals, legumes, seeds, and beverages than males, while males showed a higher PCI of fruits. The age groups also differed in PCI. The participants between 40 and 49 years of age had a higher PCI of vegetables, those between 18 and 29 years old showed higher PCI of legumes, while the participants between 50 and 59 years of age had a higher PCI of spices than the other groups (see Table 4).
Table 4.
Distribution of phenolic compounds intake by sex and age.
3.2.1. Phenolic Compounds Intake: Group and Sex Distribution
Fruits. The groups were different in PCI of fruits, and a main effect of the group was found (F (1, 960) = 82.6, p < 0.001, η2p = 0.08, ε = 0.07); this evidenced a higher PCI of fruits for LD than MD groups (Mean difference, (Md) = 30.1, p < 0.001; LD, M = 139.3, MD, M = 109.2). A significant group by fruit interaction was also observed (F (15, 960) = 51.0, p < 0.001, η2p = 0.05, ε = 0.07). The post-hoc tests confirmed that the LD group had a higher PCI of each fruit than the MD group (Each fruit, p < 0.01). No significant group by fruits by sex interaction was found (See Figure 1B).
Vegetables. A main effect of the group was found (F (1, 960) = 77.6, p < 0.001, η2p = 0.07, ε = 0.07). The LD group showed higher PCI of vegetables than the MD group (Md = 9.2, p < 0.001; LD, M = 45.62, MD, M = 36.45). A significant group by vegetable interaction was also found (F (17, 960) = 43.9, p < 0.001, η2p = 0.04, ε = 0.06). The post-hoc tests revealed that the LD group had a higher PCI of each vegetable than the MD group (each vegetable, p < 0.001). A significant group by vegetables by sex was also observed (F (17, 960) = 4.46, p = 0.03, η2p = 0.005, ε = 0.06). However, the post-hoc test showed that female or male groups did not differ in PCI of vegetables between LD and MD groups (See Figure 1B).
Cereals. As is shown in Figure 1B, a main effect of group in PCI of cereals (F (1, 960) = 107.5, p < 0.001, η2p = 0.1, ε = 0.4) was observed. As we hypothesized the LD group had a higher PCI of cereals than the MD group (Md = 7.25, p < 0.001; LD, M = 35.69, MD, M = 28.44). A significant group by cereal interaction was observed (F (6, 960) = 59.22, p < 0.001, η2p = 0.06, ε = 0.4). The post-hoc tests confirmed a higher PCI for each cereal for LD than the MD group (Each cereal, p < 0.001). We also found a significant group by cereal by sex interaction (F (6, 960) = 5.68, p < 0.001, η2p = 0.006, ε = 0.4). Although, the pair comparisons showed that PCIs of cereals differed between LD and MD groups, with a greater PCIs for women that belonged to the LD group. The men’s subgroups, the LD and MD groups, did not show differences in PCIs of flaxseed, wheat, and millet (Flaxseed, Md = 4.8, p = 0.1; wheat, Md = 0.8, p = 0.2; millet, Md = 0.2, p = 1.0).
Legumes. The groups were also different in the PCI of this nutritional group. A significant main effect of group (F (1, 960) = 150.4, p < 0.001, η2p = 0.1, ε = 0.6) evinced that LD group showed a higher PCI of legumes than the MD group (Md = 62.0, p < 0.001; LD, M = 268.6, MD, M = 206.5) (See Figure 1B). We also found a significant group by legume interaction (F (3, 960) = 88.3, p < 0.001, η2p = 0.08, ε = 0.6). The LD group showed a higher PCI of all legumes than the other group (Each legume, p < 0.001). In addition, a significant group by legume by sex was also observed (F (3, 960) = 3.6, p = 0.03, η2p = 0.004, ε = 0.6). Although the comparisons favored the LD group for the female subgroup, only for the male subgroup, the PCI of soybeans was not different between groups with a different health condition (Soybean, Md = 2.2, p = 0.1).
Seeds. A main effect of the group was also found in this nutritional group (F (1, 960) = 104.8, p < 0.001, η2p = 1.0, ε = 0.3). The LD group showed a higher PCI of seeds than the other group (Md = 38.6, p < 0.001; LD, M = 180.7, MD, M = 142.1) (See Figure 1B). A significant group by seed was also observed (F (4, 960) = 70.6, p < 0.001, η2p = 0.07, ε = 0.3). The post-hoc tests evidenced that the LD group displayed higher PCI of seeds than the MD group (Each seed, p < 0.001). No significant group by seed by sex interaction was found.
Spices. The groups were different in the PCI of spices (F (1, 960) = 62.3, p < 0.001, η2p = 0.06, ε = 0.1). The LD group had a higher PCI of spices than the MD group (Md = 12.3, p < 0.001; LD, M = 67.8, MD, M = 55.6) (See Figure 1B). A significant group by spice interaction confirmed that the LD group had a higher PCI than the other group in each spice [F (19, 960) = 14.5, p < 0.001, η2p = 0.01, ε = 0.1]. In addition, a significant group by spices by sex interaction was also observed (F (19, 960) = 5.0, p = 0.002, η2p = 0.05, ε = 0.1). Only for male group multiple PCI of spices were no different between the LD and MD groups (Marjoram, Md = 13.0, p = 0.5; achiote (annatto), Md = 0.6, p = 0.1; Chaya, Md = 0.1, p = 1.0; fennel, Md = −0.2, p = 0.7; linden, Md = 2.0, p = 0.8; saffron, Md = 1.7, p = 0.7; Mexican pepper leaf, Md = 4.9, p = 0.06; papalo, Md = 6.2, p = 0.2). The remaining comparisons were significant in favor of the LD group regardless of sex.
Beverages. The groups with different health condition differed in PCI of beverages (F (1, 960) = 111.46, p < 0.001, η2p = 0.3, ε = 0.1). The LD groups showed a higher PCI of beverages than the other group (Md = 145.24, p < 0.001; LD, M = 759.26, MD, M = 614.01) (See Figure 1B). A significant group by beverages was also found (F (4, 960) = 45.94, p < 0.001, η2p = 0.3, ε = 0.5). The post-hoc tests evidenced that the LD group had a greater PCI in all beverages than the MD group (p < 0.01). No significant group by beverage by sex was observed.
Mexican dishes. A main effect of the group was observed (F (1, 960) = 196.6, p < 0.001, η2p = 0.2, ε = 0.4). The LD group displayed a greater PCI of Mexican dishes than the other group (Md = 47.7, p < 0.001; LD, M = 204.6, MD, M = 156.9) (See Figure 1B). A significant group by Mexican dishes interaction (F (12, 960) = 47.6, p < 0.001, η2p = 0.04, ε = 0.4) confirmed that the LD group had a higher PCI of each Mexican dish (p < 0.001). No significant group by beverage by sex was observed.
3.2.2. Phenolic Compounds Intake: Group and Age Distribution
Although, no significant group by age category interaction was observed for any comparison, but a significant main effect of group (i.e., LD vs. MD) was observed for each comparison with LD showed higher PCI than MD group: fruits (F (4, 954) = 55.02, p < 0.001, η2p = 0.05, ε = 0.07 (Md = 28,57, p < 0.001; LD, M = 134.43, MD, M = 105.85)), vegetables (F (4, 954) = 108.44, p < 0.001, η2p = 0.10, ε = 0.06 (Md = 12.26, p < 0.001; LD, M = 48.90, MD, M = 36.64)), cereals (F (4, 954) = 87.35, p < 0.001, η2p = 0.08, ε = 0.41 (Md = 7.56, p < 0.001; LD, M = 34.97, MD, M = 27.41)), legumes (F (4, 954) = 129.57, p < 0.001, η2p = 0.12, ε = 0.56 (Md = 66.51, p < 0.001; LD, M = 270.57, MD, M = 204.06)), seeds (F (4, 954) = 104.59, p < 0.001, η2p = 0.10, ε = 0.33 (Md = 44.40, p < 0.001; LD, M = 186.51, MD, M = 142.11)), spices (F (4, 954) = 16.58, p < 0.001, η2p = 0.07, ε = 0.15 (Md = 15.21, p < 0.001; LD, M = 71.43, MD, M = 56.22)), beverages (F (4, 954) = 97.46, p < 0.001, η2p = 0.3, ε = 0.9 (Md = 156.30, p < 0.001; LD, M = 767.05, MD, M = 610.75)), and Mexican dishes spices (F (4, 954) = 156.49, p < 0.001, η2p = 0.14, ε = 0.37 (Md = 49.15, p < 0.001; LD, M = 204.92, MD, M = 155.76)).
3.3. Risk of Developing Diseases
As shown in Table 5, two regression models displayed an R2 higher than 0.4, the remaining regressions had a R2 of 0.1 (See Table A3). The stronger regressions included as independent variables our cluster (i.e., LD and MD groups) and obesity disease. In the regression model, which included our cluster, we found that high PCI of tomato, garlic, lettuce, corn, grape, wine, romeritos, arroz con frijoles, and scholarship predicted a smaller number of diseases. In contrast, older age and higher PCI of wheat and cranberry predicted a higher likelihood of suffering from a disease (See Figure 2). In the regression model, which included obesity as an independent variable, PCI of tomato, corn, garlic, chamomile tea, coffee, grape, Swiss chard, enchiladas, and wine predicted the absence of obesity, while the PCI of plum and oregano predicted the presence of this disease (For further information see Table A4 and Table A5).
Table 5.
Regression analyses of diseases and PCI.
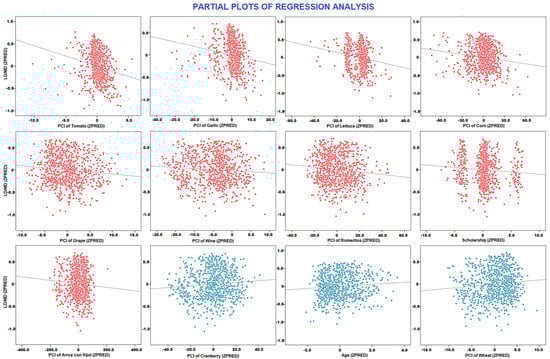
Figure 2.
The scatter plots illustrate the relationship between LD and MD groups and predictor variables in the regression model. Negative associations are in red, and the positive ones are in blue.
4. Discussion
This study examined the PCI and how the Mexican diet was associated with participants’ health condition. We expected to find more diseases in participants with lower PCI based on previous literature. Given that traditional Mexican food is not ultra-processed and contains high levels of PC [25,26], we expected better health condition in participants with a higher intake of beverages or Mexican dishes. Our hypotheses partially agreed with our results because food with high PC was associated with better health condition; however, the consumption of beverages and Mexican dishes is lower than our expectations.
4.1. Demographic Data
Our statistical analyses revealed that sex, age, and scholarship variables seem to play a role in the presence or absence of diseases in our Mexican cohort. Males suffer more diseases than females even when we had more participation from females in our sample However, this result matched previous studies reporting that males have lower life expectancy than females in Mexico [123]. A recent study explained that males do not usually go to the doctor when they have symptoms of illness, making them a vulnerable population to develop multiple diseases. As the prior literature has reported, our participants over 29 years had more diseases than their younger pairs. This result confirmed that older age increases the likelihood of suffering a disease due to the natural deterioration of the human body [124]. The scholarship also seems to influence disease development; those participants with higher scholarship reporting less illnesses. Jun et al. (2016) described that participants with higher scholarship usually include dietary supplements. In our study, even when we did not explore the relationship between scholarship and number of dietary supplements, we suggest that our participants with high scholarships could have nutritional habits such as Jun et al.’s participants. In addition, our demographic interpretations should be carried out carefully because our sample is not representative of the Mexican population.
4.2. Frequency of Food Consumption
Mexican eating habits of fruits matched the US and Korean populations in apple and orange consumption [24,30], and it was also consistent with the eating habits of Asian populations, mainly in chilies and rice consumption [24], our sample’s data also matched European Union in wheat and potato intake [125]. We suggest that Mexican’s eating habits match other populations because of the increased influence of other countries via social media and economic globalization.
Previous studies reported that the Mexican population has lower consumption of without or low sugar beverages and traditional Mexican dishes than those described in the last decades [28,29], suggesting higher consumption of fast or ultra-preprocessed food. In our study, more than 50% of our sample consumed only two traditional Mexican dishes (i.e., salsas verdes and salsas rojas), and the most consumed beverage was not autochthonous from Mexico (e.g., coffee). Moreover, their consumption was similar to the eating habits of Latin American and Asian populations [1]. We could suggest that our data confirm the alarming changes previously reported in the Mexican diet. However, we also found that beans, corn (mainly tortilla), and nopal intake remained preserved in the Mexican eating habits, with a higher intake than in other countries [1]. These foods are essential in other autochthonous Mexican dishes such as “tacos”. Therefore, we would suggest exploring other Mexican dishes in future studies.
4.3. Comparisons between LD and MD Groups
The LD and MD differed in the PCI of all food groups, with LD showing a higher PCI than MD groups. These results matched our hypothesis and previous studies reporting a positive effect of PC on different diseases [22,23,24]. Vegetables and fruits have been considered great providers of PC [1]. Then, we expected a higher intake for LD group. The vegetables consumed more frequently by our sample, such as tomato and lettuce, were good predictors of a smaller number of diseases, which matched our hypothesis. However, even when the PCI of fruits was higher for the LD group, we found that low percentage of our sample consumed fruits. Moreover, the fruits consumed by more than 50% of our sample were not variables predictors in the regression analyses (See Figure 2). The lower PCI of fruits observed in this sample might be part of the problem in the health status of the Mexican population; we suggest that they might be replacing fruit with high-caloric snacks. Given that, in this study, we did not explore that kind of food, this statement would require further research.
We also found that cereals were consumed more by LD than MD groups. Corn is the most consumed by our sample; this cereal contains PC, which seems to decrease the risk of developing a chronic illness, such as diabetes, and cardiovascular diseases. Corn contains a molecule called lignin, which is the main component of dietary fiber. In addition, it has two functions: (1) inhibits enzymatic activity associated with the production of radical anion superoxide and (2) blocks the growth and viability of cancerogenic cells [126]. Then, cereals, particularly corn consumption, seems to affect health status positively. This statement is consistent with the regression analysis results, in which high corn intake was associated with a lower number of diseases in our sample.
Our statistical analyses also showed that LD had a higher PCI of legumes than MD groups. Previous study report that the legumes have a high biologic value because they contain essential amino acids and PC. These can modify the basal physiological function within the intestinal microenvironment affecting the microbiota and epithelial barrier, improving metabolic and gastrointestinal health, enhancing resistance to colonization by pathogens, and exerting an impact on the gut microbiota. They regulate metabolic stability and membrane transport in the intestine, thus improving bioavailability. These actions decrease the severity of diseases associated with the intestine due to their chemopreventive effects [127]. In our study, the analyses revealed no differences between LD and MD groups in gastrointestinal symptoms and diseases. We suggest that the positive effect of legumes on the digestive system might have been hampered by the poor variety of legumes consumed by our sample. They mainly consumed beans. On the other hand, legumes also contribute to glycemic control and protein anabolism [127]. LD and MD differed in the presence of diseases, between them diabetes mellitus. Interestingly, the Mexican dish “Arroz con frijoles” contains as a main ingredient bean, and its high intake was associated with fewer diseases. A recent study reported that beans improve postprandial glycemic response and glycated hemoglobin (HbA1c) by inhibiting α-amylase, and maltase. Therefore, beans have been considered an ideal food for managing blood glucose and insulin resistance [128]. Our results suggest that a high bean intake positively affects glycemic control in our sample.
We also found that LD and MD groups differed in the PCI of seeds, with a higher PCI for LD group. The seeds are food groups that contain PC and modulator molecules, such as essential fatty acids, which protect the digestive tract and allow appropriate maintaining in lipid metabolism (i.e., a decrease of triglycerides, LDL, cholesterol, very low density lipoprotein (VLDL), regulation of markers of platelets such as a reduction of endothelial adhesion, platelet aggregation, decrease of inflammation markers related to arachidonic acid, modulating the production of prostaglandins, leukotrienes, decrease of cyclooxygenases, reduction of oxidation of molecules such as LDL, deoxyribonucleic acid (DNA), reduce the production of ROS, increase reduced glutathione (GSH), glutathione peroxidase (GSH-Px), and plasma antioxidant capacity) [129]. In our study, the seeds were not consumed by more than 50% of our sample, which might be explained by their high cost and scarce availability in the market. This fact might justify that PCI of any seed was a predictor variable in our regression model, suggesting that this food did not reach a significant effect on health status because of its low consumption. A similar situation was found in the PCI of spices, even when they have many properties such as digestive stimulant action, antimicrobial, anti-inflammatory, antimutagenic, anticarcinogenic potential, and antioxidant capacities [130]. They were not consumed by more than 50% of our sample; therefore, they did not reach a place between predictor variables. We suggest that most of the participants in our study did not know whether their meals had spices. The participants’ report might be biased by their lack of knowledge of the dish’s ingredients.
As we expected the PCI of beverages were higher for LD than MD groups. Particularly, coffee was the beverage more consumed by our participants. This beverage contains chlorogenic acids (CGA), which have several effects on health conditions; between them, they are hypoglycemic, antiviral, and hepatoprotective and have antispasmodic activities [131]. In addition, a daily coffee intake of 2.5 cups has beneficial effects on endothelial function and vascular smooth muscle function in patients with hypertension [1], while another study reported that the level of coffee intake was not associated with gastrointestinal diseases and gastric cancer [1]. Moreover, in prior meta-analyses, the effect of coffee intake on obesity and chronic diseases is still controversial. However, a positive association between coffee intake, BMI, and abdominal obesity has been reported, suggesting several biological mechanisms against obesity triggered by biologically active compounds in coffee, such as CGA, caffeine, trigonelline, and magnesium [1]. In a study using an animal model, they reported that supplementation with CGA was associated with a body-weight reduction, a decrease of visceral fat mass, and lower triglyceride content in adipose tissue in high-fat-fed mice [1].In an in vitro study, trigonelline inhibited adipocyte proliferation and lipid accumulation in differentiating adipocytes [132]. In our study, the PCI of coffee was a predictor variable, that is, high PCI of coffee was associated with less number of diseases and the absence of suffering obesity disease, which matched previously described [1].
Although wine consumption was low in our sample, we found a relationship between fewer diseases or healthier weight status and wine intake. This result might be supported by recent studies describing the beneficial effects of wine compounds on health status. Verajano and Lujan-Corro (2022) explain that red wine contains at least two kinds of PC: flavonoids (anthocyanins, flavanols, and flavonols) and non-flavonoids (stilbenes, phenolic acids, among others); these PCs are attributed with antioxidant activity by increasing the activity of the catalase, superoxide dismutase (SOD), and glutathione reductase (GR) enzymes, or by enhancing the production of nitric oxide (NO), with a consequent lower cardiovascular risk. In particular, wine quercetin and resveratrol compounds can bind to LDL through glycosidic bonds lowering their levels and increasing levels of high-density lipoprotein protecting them against free radicals and reducing oxidation induced by metal ions [1]. In addition, these compounds together with tannic acid, and malvidin may also improve endothelial NO production, reducing platelet aggregation and vascular inflammation, while anthocyanins seem to reduce LDL levels in patients with dyslipidemia [1]. In this study, our findings suggest that wine prevents multiple mechanisms associated with the occurrence of diseases, which might explain our results [1].
In this study, chamomile tea showed a positive effect on the health status. Prior studies have described that chamomile flower head has several flavonoids such as apigenin, quercetin, patuletin, and luteolin. Moreover, the chamomile hot water extract and its major components (esculetin and quercetin) show moderate sucrase inhibition, suggesting that this influences the prevention of hyperglycemia in diabetics patients [133]. In addition, an animal model study reports that chamomile has a potent anti-inflammatory action, antimutagenic and cholesterol-lowering activities, and antispasmodic and anxiolytic effects [1]. Given that chamomile was a predictor variable for a smaller number of diseases. These properties attributed to chamomile might support the results observed in this study.
We expected that PCI of Mexican dishes would be higher for LD than MD participants, and our data matched our hypothesis. However, the most consumed dishes (i.e., salsas rojas and salsas verdes) were not predictor variables in our regression model. Instead, Arroz con frijoles was associated with a smaller number of diseases. As we mentioned, the beans are part of the Arroz con frijoles’ recipe. We suppose that the bean cooked in the traditional way might promote better health conditions in our Mexican sample [128].
PCI of enchiladas was also a predictor variable, which was associated with the absence of suffering from obesity. We suggest that this dish has beneficial properties on health conditions because its main ingredients are tortillas of corn and tomato. Previous studies have described that corn mainly entails ferulic acid, followed by p-coumaric acid, which are highly copious in their conjugated forms [1]. In an animal model was verified that dietary ferulic acid supplementation suppresses blood glucose elevation, body and hepatic lipid accumulation, body weight gain, and inflammatory cytokines (IL-6 and TNF-α) in high-fat diet-induced obese mice, suggesting that ferulic acid could be helpful in lowering the risk of high fat-diet induced obesity and obesity-related metabolic syndromes [1]. In Mexico, white maize is the most consumed, and this is processed as tortillas. This food implies nixtamalization process, which entails the hydrolysis of the ester linkage between the ferulic acid and the cell wall components, which triggers the soluble fraction to be higher in nixtamalized maize products relative to that found in the whole grain—that is, ferulic acid increases 26% [1]. Therefore, tortillas intake might have a positive effect on health condition of Mexican population. On the other hand, a recent study reports that tomato has multiple properties; between them, this improves the antioxidant defense and plasma lipid peroxidation products, the lipid profile, and HbA1c levels [134,135]. Therefore, both ingredients help to prevent the development of abnormal weight status and other diseases.
5. Conclusions
We conclude that PCI positively affects health conditions and supports the hypothesis that specific nutritional foods have a particular effect on certain diseases. For example, higher PCI of arroz con frijoles was associated with lower number of diseases. In contrast, a higher PCI of enchiladas was associated with a lower likelihood of suffering from diabetes. Therefore, the specific effects of Traditional Mexican food will need further research.
As expected, the most consumed foods in our cohort positively affected the health conditions (e.g., tomatoes, lettuce, or corn), suggesting that the feeding habits of our Mexican sample promote a greater health status. On the other hand, it is essential to highlight that the foods less consumed had a solid effect to consider them as predictor variables (e.g., garlic, grapes, Swiss chard, or wine). Therefore, these foods must have specific properties which should be studied deeply. In addition, our findings suggest that the PCI effect also depends on sex, age, and local feeding habits. Therefore, a more controlled study should be performed to describe these effects precisely.
6. Limitations
There are inherent limitations in the present study. This is cross-sectional study, which may not support interpretations of causality between PCI and diseases. In addition, given that a physician did not explore our participants because the survey was applied during the pandemic virus (COVID-19). The participants might suffer from other health conditions. Therefore, interpretations should be carried out carefully. In addition, we did not use the traditional daily intake survey, anthropometric measures, or biochemical indices to assess the participants; these might provide more nuanced metrics for studies examining the impact of PCI on diseases. The PCI is not a precise measurement, because our calculus was not performed considering the culinary technique for each Mexican dish. This fact may affect the amount of PC in each personal portion. In addition, we did not assess all Mexican dishes. Therefore, our conclusions are limited to the more common dishes.
Author Contributions
J.M.A.-C., R.C.-L. and G.C.A.-C. contributed to the conception and design of the study. J.M.A.-C., R.C.-L., G.C.A.-C. and L.J.P.-E. organized the database and applied the survey. G.C.A.-C. and J.M.A.-C. performed the statistical analysis. Y.O.S.-S. and A.N.-V. reviewed and edited the manuscript. All authors have read and agreed to the published version of the manuscript.
Funding
This research was funded by Instituto de Ciencias, Benemérita Universidad Autónoma de Puebla.
Institutional Review Board Statement
The study was conducted in accordance with the Declaration of Helsinki and approved by the Institutional Review Board (or Ethics Committee) of Benemérita Universidad Autónoma de Puebla (Project identification code: 046. April 2021).
Informed Consent Statement
Informed consent was obtained from all subjects involved in the study.
Data Availability Statement
The data presented in this study are available on request from the corresponding author. The data are not publicly available, because they contain sensitive patient information.
Acknowledgments
We thank CONACYT-Estancias Posdoctorales por México para la Formación y consolidación de las y los Investigadores por México for the Postdoctoral fellowship awarded to J.M.A.-C. We thank José Manuel Gutiérrez Cortés for the technical support. We are especially grateful to all the participants in this study.
Conflicts of Interest
The authors declare no conflict of interest, and the funders had no role in the design of the study; in the collection, analyses, or interpretation of the data; in the writing of the manuscript; or in the decision to publish the results.
Appendix A
Table A1 illustrates the survey of food consumption with a high level of phenolic compounds. We included all items applied to our participants. Table A2 contains the total phenolic compounds of each ingredient for each Mexican recipe. Table A3 describes the regression models, which did not reach an R2 lower than 0.4. Table A4 shows comparisons of PCIs of all foods between weight status and the LD and MD groups, and regardless the LD and MD groups. Table A5. Illustrates correlations between the BMI and number of diseases and BMI and PCI of each food.
Table A1.
Survey of phenolic compound intake.
Table A1.
Survey of phenolic compound intake.
| Items | Answer Choices |
|---|---|
| Identification data (Datos de identificación) | |
| Age (Edad) | 18–29/30–39/40–40/50–40/>59 |
| Sex (Sexo) | Male (hombre)/Female (mujer) |
| Marital status (Estado civil) | Single (Soltero (a)) Married (Casada(a)) Free union (Unión libre) Divorced (Divorciado (a)) Widow (Viudo (a)) |
| Occupation (Ocupación) | |
| Scholarship (Escolaridad) | |
| Residencie’ place (Lugar de residencia) | |
| Anthropometric data (Datos antropométricos) | |
| Height(m) (Estatura) | |
| Weight (kg) (Peso) | |
| Medical records (Datos clínicos) | |
| Have you had the following gastrointestinal diseases? Indicate which one. (Seleccione sí presenta las siguientes enfermedades gastrointestinales) | Constipation (Estreñimiento) Gastritis Irritable bowel syndrome (IBS) (Síndrome de intestino irritable) Peptic ulcer (Úlcera péptica) Bacterial overgrowth Syndrome (BOS) (Síndrome de Sobrecrecimiento Bacteriano) Ulcerative colitis (UC) (Colitis ulcerativa CUCI) None (Ninguna) |
| Have you had the following chronic diseases? Indicate which one. (Seleccione sí presenta alguna de las siguientes enfermedades crónicas) | Diabetes Hypertension (Hipertensión) Hypercholesterolemia (Hipercolesterolemia) Hypertriglyceridemia (Hipertrigliceridemia) Kidney diseases (Enfermedades renales) Fatty liver (Hígado graso) None (Ninguna) |
| Do you suffer from insomnia? (¿Usted padece insomnio?) | Yes/No (Si/No) |
| Have you recently had medical treatment? Indicate which one. (¿Ha tenido tratamiento médico recientemente?, en caso afirmativo, ¿cuál?) | Yes/No (Si/No) |
| Have you been doing any physical activity in the last 3 months? Indicate which type and duration (¿En los últimos 3 meses, usted está realizando alguna actividad física? Mencione tipo y tiempo | Yes/No (Si/No) |
| Do you smoke? (¿Usted fuma?) | Yes/No (Si/No) |
| Do you consume alcoholic beverages? Indicate quantity and frequency (¿Usted consume bebidas alcohólicas? De ser así mencione tipo, cantidad y frecuencia) | Yes/No (Si/No) |
| Food intake frequency (frecuencia de consumo de alimentos) | |
| Indicate how often you have consumed the following foods in the last month (¿En el último mes, con qué frecuencia ha consumido los siguientes alimentos? | |
| Fruits (frutas) | |
| Grape (Uva) Plum (Ciruela) Cranberry (Arándano) Peach (Durazno) Raspberry (Frambuesa) Blueberry (Mora azul) Prickly pear (Tuna) Apple (Manzana) Pink grapefruit (Toronja) Kiwi Orange (Naranja) Guava (Guayaba) Strawberry (Fresa) Pomegranate (Granada) Cherry (Cereza) Pear (Pera) | Frequently (Frecuentemente) Sometimes (A veces) By season (Por temporada) Never (Nunca) |
| Vegetables (Vegetales) | |
| Huitlacoche Cambray onion (Cebollita cambray) Mushroom (Fungi) (Champiñón) Peppers (Pimientos) Carrot (Zanahoria) Beetroot (Betabel) Swiss chard (Acelga) Tomato (Jitomate) Chilies (Chiles (variedades)) Lettuce (Lechuga) Celery (Apio) Brussels sprouts (Col de Bruselas) Prickly pear cactus (Nopal) Radish (Rábano) Broccoli (Brócoli) White onion (Cebolla blanca) Purple onion (Cebolla morada) Potato (Papa) | Frequently (Frecuentemente) Sometimes (A veces) By season (Por temporada) Never (Nunca) |
| Cereals (Cereales) | |
| Rice (Arroz) Oatmeal (Avena) Barley (Cebada) Flaxseed (Linaza) Wheat (Trigo) Corn (Maíz) Millet (Mijo) Sorghum (Sorgo) | Frequently (Frecuentemente) Sometimes (A veces) By season (Por temporada) Never (Nunca) |
| Legumes (Leguminosas) | |
| Soybean (Soya) Beans (Frijol) Bread beans (Haba) Lentil (Lenteja) | Frequently (Frecuentemente) Sometimes (A veces) By season (Por temporada) Never (Nunca) |
| Seeds (Semillas) | |
| Cocoa (Cacao) Almont (Almendra) Nut (Nuez) Peanut (Cacahuate) Linseed (Chía) | Frequently (Frecuentemente) Sometimes (A veces) By season (Por temporada) Never (Nunca) |
| Spices (Especias) | |
| Parsley (Perejil) Coriander (Cilantro) Oregano Epazote Garlic (Ajo) Clove (Clavo) Paprika Marjoram (Mejorana) Eucalyptus (Eucalipto) Annatto (Achiote) Sesame Seed (Ajonjolí) Ginger (Jengibre) Black pepper (Pimienta) Chaya Fennel (Hinojo) Linden (Tila) Saffron (Azafrán) Anise (Anís) Mexican pepper leaf (Hoja santa) Papalo | Frequently (Frecuentemente) Sometimes (A veces) By season (Por temporada) Never (Nunca) |
| Beverages (Bebidas) | |
| Coffee (Café) Green tea (Té verde) Wine (Vino) Hibiscus water (Jamaica) Chamomile tea (Manzanilla) | Frequently (Frecuentemente) Sometimes (A veces) By season (Por temporada) Never (Nunca) |
| Mexican dishes (Platillos Mexicanos) | |
| Mole Arroz con frijol Enfrijoladas Enchiladas Salsas rojas Salsas verdes Cochinita pibil Huazontles Quintoniles Pipian Romeritos Verdolagas Ensalada con espinacas | Frequently (Frecuentemente) Sometimes (A veces) By season (Por temporada) Never (Nunca) |
Table A2.
Phenolic compounds in Mexican dishes.
Table A2.
Phenolic compounds in Mexican dishes.
| Mexican Dish | Ingredients | Grams Per person | TPC mg GAE/100g | References |
|---|---|---|---|---|
| Mole rojo | Turkey | 100 | 6.6 | [98] |
| Tomato | 20 | 15.3 | [27] | |
| Chipotle chilies | 3.3 | 715.1 | [27] | |
| Ancho chilies | 6.6 | 3591.8 | [27] | |
| Mulato chilies | 16.7 | 41.1 | [27] | |
| Pasilla chilies | 2.1 | 20.4 | [27] | |
| Almond | 8.3 | 315.02 | [72] | |
| Sesame seed | 1.2 | 0.12 | [85] | |
| Garlic | 0.2 | 0.48 | [80] | |
| Cinnamon | 0.8 | 10.92 | [99] | |
| Anise | 0.5 | 1.49 | [81] | |
| Pepper | 0.2 | 0.009 | [87] | |
| Clove | 0.2 | 44.38 | [81] | |
| Coriander seed | 0.2 | 0.2 | [100] | |
| Bread | 1.5 | 3.99 | [102] | |
| Corn | 0.4 | 2.69 | [59] | |
| Chocolate | 4.5 | 62.19 | [71] | |
| Vegetal oil | 15 | 2.85 | [71] | |
| Sugar | 0.2 | ND | ||
| Mole verde | Pork shank | 100 | 70.2 | [101] |
| Green bean | 12.6 | 37.08 | [103] | |
| Squash (Chayote) | 35 | 100.45 | [27] | |
| Tomatillo | 50 | 262.0 | [27] | |
| Serrano chilies | 3.3 | 8.03 | [27] | |
| Corn | 4.5 | 30.2 | [59] | |
| Onion | 20 | 4.86 | [59] | |
| Garlic | 3 | 7.2 | [80] | |
| Mexican Pepper leaf | 3 | 11.9 | [91] | |
| Epazote | 2 | 23.9 | [79] | |
| Parsley | 2 | 4.3 | [76] | |
| Vegetal oil | 6 | 1.14 | [71] | |
| Mole poblano | Turkey | 100 | 6.6 | [98] |
| Mulato chilies | 6.7 | 16.5 | [27] | |
| Ancho chilies | 6.7 | 3646.2 | [27] | |
| Pasilla chilies | 1.7 | 16.5 | [27] | |
| Chipotle chilies | 1.6 | 346.7 | [27] | |
| Tomato | 20 | 15.3 | [27] | |
| Sesame seed | 1.7 | 0.18 | [85] | |
| Raisin | 1.7 | 7.7 | [104] | |
| Peanut | 1.7 | 6.4 | [73] | |
| Bread | 1 | 2.6 | [102] | |
| Pimiento | 5 | 4.2 | [27] | |
| Clove | 0.03 | 6.6 | [81] | |
| Anise | 0.03 | 0.08 | [81] | |
| Cinnamon | 0.8 | 10.9 | [99] | |
| Onion | 20 | 4.8 | [59] | |
| Tortilla | 0.4 | 0.2 | [105] | |
| Garlic | 0.7 | 1.6 | [80] | |
| Chocolate | 1.5 | 20.7 | [71] | |
| Vegetal oil | 10 | 1.9 | [71] | |
| Sugar | 0.5 | ND | ||
| Mole de olla | Beef shank | 100 | ND | |
| Corn dough | 20 | 134.5 | [59] | |
| Pasilla chilies | 6.6 | 64.3 | [27] | |
| Ancho chilies | 6.6 | 3591.8 | [27] | |
| Tomato | 90 | 68.8 | [27] | |
| Corn | 240 | 1614.1 | [59] | |
| Green beans | 4.6 | 13.5 | [103] | |
| Xoconostle | 33.2 | 68.7 | [106] | |
| Onion | 20 | 4.8 | [59] | |
| Garlic | 6 | 14.4 | [80] | |
| Black pepper | 0.5 | 0.02 | [87] | |
| Clove | 0.2 | 44.4 | [81] | |
| Epazote | 4 | 47.9 | [79] | |
| Arroz con frijol | Rice | 100 | 23.8 | [61] |
| Bean | 100 | 1368.48 | [68] | |
| Carrot | 33 | 23.1 | [51] | |
| Onion | 66.6 | 16.2 | [59] | |
| Epazote | 13.3 | 159.4 | [79] | |
| Butter | 10 | ND | ||
| Enfrijoladas | Tortilla | 92 | 54.57 | [105] |
| Bean | 100 | 1368.48 | [68] | |
| Chicken | 100 | 6.6 | [98] | |
| Onion | 33 | 8.01 | [59] | |
| Sour cream | 16.7 | 0.01 | [107] | |
| Fresh cheese | 33 | ND | ||
| Epazote | 13 | 155.8 | [79] | |
| Red sauce | 33.3 | 25.5 | [27] | |
| Enchiladas rojas | Corn tortilla | 92 | 54.57 | [105] |
| Guajillo chilies | 33 | 33.2 | [108] | |
| Ancho chilies | 20 | 10,884.4 | [27] | |
| Garlic | 6 | 14.43 | [80] | |
| White onion | 50 | 12.1 | [59] | |
| Cumin | 5 | 107.2 | [109] | |
| Oregan | 0.4 | 1.7 | [78] | |
| Pepper | 0.4 | 0.02 | [87] | |
| Vegetal oil | 16.7 | 3.1 | [71] | |
| Enchiladas verdes | Chicken breast | 100 | 6.6 | [98] |
| Corn tortilla | 92 | 54.6 | [105] | |
| Coriander | 13.3 | 18.3 | [77] | |
| Tomatillo | 141.7 | 742.5 | [27] | |
| Garlic | 10 | 24.1 | [80] | |
| Serrano chilies | 3.3 | 8.03 | [27] | |
| Onion | 33.3 | 8.1 | [59] | |
| Vegetal oil | 16.7 | 3.1 | [71] | |
| Sour cream | 15 | 0.01 | [107] | |
| Enchiladas de Olla | Corn tortilla | 92 | 54.6 | [105] |
| Corn dough | 100 | 672.5 | [59] | |
| Ancho chilies | 1.6 | 870.7 | [27] | |
| Poblano chilies | 1.6 | 3.9 | [27] | |
| Cheese | 30 | ND | ||
| Lettuce | 30 | 0.93 | [54] | |
| Vegetal oil | 5 | 0.95 | [71] | |
| Enchiladas Suizas | Corn tortilla | 92 | 54.6 | [105] |
| Tomatillo | 100 | 524 | [27] | |
| Cream cheese | 21 | 0.01 | [107] | |
| Serrano chilies | 8.5 | 20.7 | [27] | |
| Garlic | 3.2 | 7.7 | [80] | |
| Onion | 21 | 5.1 | [59] | |
| Coriander | 4.2 | 5.7 | [77] | |
| Black pepper | 2.1 | 0.1 | [87] | |
| Vegetal oil | 10.7 | 2.0 | [71] | |
| Enchiladas de requeson y verdolagas | Corn tortilla | 92 | 54.6 | [105] |
| Cheese | 19.6 | ND | ||
| Requesón (fresh cheese) | 106.9 | 31.8 | [110] | |
| Tomatillo | 100 | 524 | [27] | |
| Serrano chilies | 2.1 | 5.1 | [27] | |
| Onion | 41 | 10 | [59] | |
| Coriander/Epazote | 3.2 | 38.3 | [79] | |
| Black pepper | 1 | 0.04 | [87] | |
| Garlic | 11.8 | 28.3 | [80] | |
| Purslane | 274.5 | 3129.3 | [111] | |
| Sour cream | 9.8 | 0.007 | [107] | |
| Vegetal oil | 3.2 | 0.6 | [71] | |
| Salsa taquera | Tomato | 100 | 76.5 | [27] |
| Tomatillo | 56.7 | 297.1 | [27] | |
| Garlic | 10 | 24 | [80] | |
| Onion | 44.4 | 10.8 | [59] | |
| Arbol chilies | 50 | 210.5 | [27] | |
| Salsa de chile habanero con tomate | Tomatillo | 100 | 76.5 | [27] |
| Habanero chilies | 1.8 | 2.2 | [27] | |
| Garlic | 5 | 12 | [80] | |
| Onion | 10 | 2.4 | [59] | |
| Vegetal oil | 5 | 0.95 | [71] | |
| Salsa ranchera roja | Tomato | 100 | 76.5 | [27] |
| Jalapeño Chilies | 6.7 | 16.2 | [27] | |
| Garlic | 5 | 12 | [80] | |
| Onion | 15 | 3.6 | [113] | |
| Salsa de chile morita | Tomato | 100 | 76.5 | [27] |
| Morita chilies | 2.8 | 606.7 | [27] | |
| Onion | 13.3 | 3.23 | [59] | |
| Garlic | 2 | 4.8 | [80] | |
| Thyme | 0.7 | 5.6 | [112] | |
| Marjoram | 0.7 | 19.4 | [82] | |
| Black pepper | 0.7 | 0.03 | [87] | |
| Salsa de chile piquín | Chiltepín chilies | 30 | 4374 | [113] |
| Cumin | 3.7 | 79.3 | [109] | |
| Oregan | 7.5 | 33.1 | [78] | |
| Black pepper | 3.7 | 0.17 | [87] | |
| Onion | 66.7 | 16.2 | [59] | |
| Garlic | 5 | 12 | [80] | |
| Vegetal oil | 15 | 2.8 | [71] | |
| Vinegar | 7.5 | ND | ||
| Salsas verdes | Tomatillo | 255 | 1336.2 | [27] |
| Serrano chilies | 30 | 73.1 | [27] | |
| Jalapeño chilies | 20 | 48.5 | [27] | |
| Onion | 45 | 10.9 | [59] | |
| Garlic | 15 | 36.1 | [80] | |
| Cochinita pibil | Pork leg | 100 | 70.2 | [101] |
| Achiote (Annato) | 1.5 | 1.1 | [84] | |
| Garlic | 1 | 2.4 | [80] | |
| Orange juice | 46 | 1069.5 | [43] | |
| Tabasco pepper (Pimenta dioica L. Merrill) | 0.6 | 33.1 | [114] | |
| Oregan | 0.0002 | 0.0008 | [78] | |
| Clove | 0.0001 | 0.02 | [81] | |
| Bay leaf (Laurus nobilis L. leaves) | 0.0002 | 0.01 | [115] | |
| Banana leaf | 0.05 | 0.7 | [116] | |
| Huazontles | Huazontles | 100 | 432.9 | [117] |
| Cheese | 25 | ND | ||
| Flour | 15 | 25.8 | [71] | |
| Egg | 21.9 | ND | ||
| Corn oil | 25 | 4.75 | [71] | |
| Onion | 30 | 7.29 | [59] | |
| Tomatillo | 75 | 393.0 | [27] | |
| Garlic | 0.7 | 1.7 | [80] | |
| Jalapeño chilies | 6 | 14.6 | [27] | |
| Quintoniles | Turkey | 100 | 6.6 | [98] |
| Tomatillo | 25 | 131.0 | [27] | |
| Serrano chilies | 2.5 | 6.1 | [27] | |
| Onion | 5 | 1.2 | [59] | |
| Garlic | 1.5 | 3.6 | [80] | |
| Quintoniles | 200 | 763.5 | [117] | |
| Pipian con hojas santa | Turkey or Chicken | 100 | 6.6 | [98] |
| Chilies | 3 | 8.6 | [27] | |
| Pumpkin seed | 18 | 24.2 | [118] | |
| Toasted bread | 6.2 | 0.4 | [119] | |
| Cinnamon | 2.5 | 34.1 | [99] | |
| Clove | 0.05 | 11.1 | [81] | |
| Black pepper | 0.05 | 0.002 | [87] | |
| Raisin | 1.2 | 5.5 | [104] | |
| Jalapeño chilies | 3 | 7.2 | [27] | |
| Olive | 2.5 | 1.8 | [71] | |
| Sesame seed | 6.2 | 0.6 | [85] | |
| Almond | 6.2 | 235.3 | [72] | |
| Mexican pepper leaf | 2.5 | 10 | [91] | |
| Romeritos | Dry shrimp | 20 | ND | |
| Potato | 100 | 13.8 | [60] | |
| Romeritos | 200 | 346.0 | [117] | |
| Baking soda | 1 | ND | ||
| Mole in paste | 50 | 2058.1 | [27,59,71,73,80,81,85,98,99,102,104,105] | |
| Nopal | 50 | 8.5 | [57] | |
| Vegetal oil | 3 | 0.6 | [71] | |
| Espinazo con verdolagas | Pork backbone | 100 | 70.2 | [101] |
| Purslane | 200 | 2280.0 | [111] | |
| Mexican pepper | 1 | 4 | [91] | |
| Bay leaf (Laurus nobilis L. leaves) | 0.0004 | 0.02 | [115] | |
| Clove | 0.1 | 22.2 | [81] | |
| Thyme | 0.1 | 0.8 | [112] | |
| Onion | 40 | 9.7 | [59] | |
| Ancho chilies | 6.6 | 3591.8 | [27] | |
| Guajillo chilies | 9.9 | 10 | [108] | |
| Garlic | 3 | 7.2 | [80] | |
| Tomato | 210 | 160.6 | [27] | |
| Cumin | 0.0004 | 0.008 | [109] | |
| Black pepper | 0.0004 | 0.00002 | [87] | |
| Verdolagas en salsa | Purslane | 100 | 1140.0 | [111] |
| Onion | 20 | 4.86 | [59] | |
| Aji | 0.7 | 0.4 | [120] | |
| Pepper | 0.004 | 0.0002 | [87] | |
| Parsley | 10 | 21.5 | [76] | |
| Pimiento | 30 | 25.2 | [27] | |
| Carrot | 25 | 17.5 | [51] | |
| Celery | 5 | 232.0 | [55] | |
| Garlic | 1.5 | 3.6 | [80] | |
| Tomato puree | 12.5 | 9.5 | [27] | |
| Espinacas ensalada | Spinach | 100 | 1060.0 | [121] |
| Nuts | 12 | 166.0 | [73] | |
| Balsamic vinegar | 12 | ND | ||
| Mexican lime | 16 | 98.5 | [122] | |
| Pepper | 0.0004 | 0.00001 | [87] | |
| Goat Cheese | 20 | 5.96 | [110] | |
| Olive oil | 12 | 8.82 | [71] |
Note: TPC = Total of phenolic compounds; GAE = gallic acid equivalent; ND = no data.
Table A3.
Regression analyses of diseases and PCI.
Table A3.
Regression analyses of diseases and PCI.
| Disease | Predictor Variables | Coefficient Standardized | Model | ANOVA | |||
|---|---|---|---|---|---|---|---|
| β | t | p-Value | R2 | F | p-Value | ||
| Diabetes | Age | 0.2 | 7.4 | <0.001 | 0.1 | 23.3 | <0.001 |
| White onion | −0.2 | −3.5 | 0.001 | ||||
| Tomato | 0.2 | 3.2 | 0.001 | ||||
| Carrot | −0.1 | −2.3 | 0.02 | ||||
| Hypertension | Age | 0.2 | 7.0 | <0.001 | 0.1 | 18.8 | <0.001 |
| Strawberry | −0.1 | −3.2 | 0.001 | ||||
| Potato | −0.1 | −2.9 | 0.004 | ||||
| Scholarship | −0.1 | −2.4 | 0.01 | ||||
| Apple | 0.1 | 2.8 | 0.004 | ||||
| Chilies | −0.1 | −2.4 | 0.02 | ||||
| Hypercholesterolemia | Age | 0.2 | 7.9 | <0.001 | 0.1 | 32.4 | <0.001 |
| Chilies | −0.1 | −2.8 | 0.004 | ||||
| Grape | −0.1 | −2.7 | 0.004 | ||||
| Hypertriglyceridemia | Age | 0.2 | 6.2 | <0.001 | 0.1 | 16.6 | <0.001 |
| Chilies | −0.1 | −3.8 | <0.001 | ||||
| Beetroot | −0.1 | −3.2 | 0.001 | ||||
| Mexican pepper leaf | 0.1 | 3.2 | 0.001 | ||||
| Pipian | −0.1 | −2.6 | 0.008 | ||||
| Soybean | 0.1 | 2.3 | 0.02 | ||||
Table A4.
Comparisons of PCIs of all foods between weight status and the LD and MD groups and regardless the LD and MD groups.
Table A4.
Comparisons of PCIs of all foods between weight status and the LD and MD groups and regardless the LD and MD groups.
| Weight Status | Participants (n) | ANOVA Main Effect of Group | ||
| PCI Comparisons of All Foods (M) | F | p-Value | ||
| Underweight (BMI < 18.5) | LD (25) MD (0) | LD (177.61) MD (ND) | ||
| Normal weight (BMI: 18.5–24.9) | LD (501) MD (0) | LD (152.07) MD (ND) | ||
| Overweight (BMI: 25.0–29.9) | LD (114) MD (192) | LD (133.19) MD (124.08) | 11.44 | <0.001 |
| Obesity (BMI: 30.0–39.9) | LD (0) MD (102) | LD (ND) MD (108.43) | ||
| Extreme obesity (BMI > 40.0) | LD (0) MD (30) | LD (ND) MD (87.98) | ||
| ANOVA Main Effect of Group | ||||
| PCI Comparisons of All Foods Regardless of LD and MD (M) | F | p-Value | ||
| Underweight (BMI < 18.5) | 25 | 177.61 | 160.56 | <0.001 |
| Normal weight (BMI: 18.5–24.9) | 501 | 150.10 | ||
| Overweight (BMI: 25.0–29.9) | 306 | 127.47 | ||
| Obesity (BMI: 30.0–39.9) | –102 | 108.43 | ||
| Extreme obesity (BMI > 40.0) | 30 | 87.98 | ||
n = number of participants; LD = less diseases; MD = more diseases; M = mean; ND = no data.
Table A5.
Illustrates correlations between the BMI and number of diseases and BMI and PCI of each food.
Table A5.
Illustrates correlations between the BMI and number of diseases and BMI and PCI of each food.
| Variables Correlated (n = 964) | Pearson Correlation | p | |
|---|---|---|---|
| BMI | Number of diseases | 0.25 | <0.001 |
| BMI | Fruits | ||
| Grape | −0.44 | <0.001 | |
| Plum | −0.31 | <0.001 | |
| Cranberry | −0.36 | <0.001 | |
| Peach | −0.4 | <0.001 | |
| Raspberry | −0.32 | <0.001 | |
| Blueberry | −0.3 | <0.001 | |
| Prickly pear | −35 | <0.001 | |
| Apple | −0.66 | <0.001 | |
| Pink grapefruit | −0.27 | <0.001 | |
| Kiwi | −0.35 | <0.001 | |
| Orange | −0.57 | <0.001 | |
| Guava | −0.44 | <0.001 | |
| Strawberry | −0.52 | <0.001 | |
| Pomegranate | −0.31 | <0.001 | |
| Cherry | −0.25 | <0.001 | |
| Pear | −0.41 | <0.001 | |
| Vegetables | |||
| BMI | Huitlacoche | −0.24 | <0.001 |
| Spring onion | −0.38 | <0.001 | |
| Mushroom (Fungi) | −0.46 | <0.001 | |
| Peppers | −0.5 | <0.001 | |
| Carrot | −0.69 | <0.001 | |
| Beetroot | −0.4 | <0.001 | |
| Swiss chard | −0.37 | <0.001 | |
| Tomato | −0.79 | <0.001 | |
| Chilies | −0.58 | <0.001 | |
| Lettuce | −0.71 | <0.001 | |
| Celery | −0.37 | <0.001 | |
| Brussels sprouts | −0.24 | <0.001 | |
| Nopal (Prickly pear cactus) | −0.51 | <0.001 | |
| Red Radish | −0.29 | <0.001 | |
| Broccoli | −0.56 | <0.001 | |
| White onion | −0.68 | <0.001 | |
| Purple onion | −0.41 | <0.001 | |
| Potato | −0.57 | <0.001 | |
| BMI | Cereals | ||
| Rice cooked | −0.64 | <0.001 | |
| Oatmeal | −0.56 | <0.001 | |
| Barley | −0.28 | <0.001 | |
| Flaxseed | −0.28 | <0.001 | |
| Wheat | −0.37 | <0.001 | |
| Corn | −0.69 | <0.001 | |
| Millet | −0.18 | <0.001 | |
| Sorghum | −0.29 | <0.001 | |
| BMI | Legumes | ||
| Soybean | −0.64 | <0.001 | |
| Beans | −0.33 | <0.001 | |
| Haba | −0.33 | <0.001 | |
| Lentil | −0.49 | <0.001 | |
| BMI | Seeds | ||
| Almont | −0.51 | <0.001 | |
| Nut | −0.51 | <0.001 | |
| Peanut | −0.54 | <0.001 | |
| Chia | −0.36 | <0.001 | |
| Flaxseed | −0.28 | <0.001 | |
| Spices | |||
| Parsley | −0.47 | <0.001 | |
| Coriander | −0.69 | <0.001 | |
| Oregano | −0.57 | <0.001 | |
| Epazote | −0.37 | <0.001 | |
| Garlic | −0.73 | <0.001 | |
| Clove | −0.4 | <0.001 | |
| Paprika | −0.35 | <0.001 | |
| Marjoram | −0.27 | <0.001 | |
| Eucalyptus | −0.21 | <0.001 | |
| Achiote (Annatto) | −0.27 | <0.001 | |
| Sesame Seed | −0.43 | <0.001 | |
| Ginger | −0.29 | <0.001 | |
| Black pepper | −0.56 | <0.001 | |
| Chaya | −0.17 | <0.001 | |
| Fennel | −0.22 | <0.001 | |
| Linden | −0.25 | <0.001 | |
| Saffron | −0.23 | <0.001 | |
| Anise | −0.23 | <0.001 | |
| Mexican pepper leaf | −0.21 | <0.001 | |
| Papalo | −0.16 | <0.001 | |
| BMI | Beverages | ||
| Coffee | −0.47 | <0.001 | |
| Green tea | −0.39 | <0.001 | |
| Wine | −0.39 | <0.001 | |
| Hibiscus water | −0.59 | <0.001 | |
| Chamomile tea | −0.55 | <0.001 | |
| BMI | Mexican dishes | ||
| Mole | −0.32 | <0.001 | |
| Arroz con frijol | −0.49 | <0.001 | |
| Enfrijoladas | −0.53 | <0.001 | |
| Enchiladas | −0.59 | <0.001 | |
| Salsas rojas | −0.55 | <0.001 | |
| Salsas verdes | −0.57 | <0.001 | |
| Cochinita pibil | −0.32 | <0.001 | |
| Huazontles | −0.25 | <0.001 | |
| Quintoniles | −0.24 | <0.001 | |
| Pipián | −0.23 | <0.001 | |
| Romeritos | −0.24 | <0.001 | |
| Verdolagas | −0.30 | <0.001 | |
| Ensalada con espinacas | −0.45 | <0.001 | |
n = number of participants; BMI = body mass index; PCI = phenolic compounds intake.
References
- Hasler, C.M. Functional foods: Benefits, concerns and challenges—A position paper from the American Council on Science and Health. J. Nutr. 2002, 132, 3772–3781. [Google Scholar] [CrossRef]
- Del Rio, D.; Rodriguez-Mateos, A.; Spencer, J.P.E.; Tognolini, M.; Borges, G.; Crozier, A. Dietary (poly)phenolics in human health: Structures, bioavailability, and evidence of protective effects against chronic diseases. Antioxid. Redox Signal. 2013, 18, 1818–1892. [Google Scholar] [CrossRef]
- Rakha, A.; Umar, N.; Rabail, R.; Butt, M.S.; Kieliszek, M.; Hassoun, A.; Aadil, R.M. Anti-inflammatory and anti-allergic potential of dietary flavonoids: A review. Biomed. Pharm. 2022, 156, 113945. [Google Scholar] [CrossRef]
- Redan, B.W.; Buhman, K.K.; Novotny, J.A.; Ferruzzi, M.G. Altered transport and metabolism of phenolic compounds in obesity and diabetes: Implications for functional food development and assessment. Adv. Nutr. 2016, 7, 1090–1104. [Google Scholar] [CrossRef]
- Bravo, L. Polyphenols: Chemistry, dietary sources, metabolism, and nutritional significance. Nutr. Rev. 1998, 56, 317–333. [Google Scholar] [CrossRef]
- Bucciantini, M.; Leri, M.; Nardiello, P.; Casamenti, F.; Stefani, M. Olive Polyphenols: Antioxidant and Anti-Inflammatory Properties. Antioxidants 2021, 10, 1044. [Google Scholar] [CrossRef]
- Lin, D.; Xiao, M.; Zhao, J.; Li, Z.; Xing, B.; Li, X.; Kong, M.; Li, L.; Zhang, Q.; Liu, Y.; et al. An overview of plant phenolic compounds and their importance in human nutrition and management of type 2 diabetes. Molecules 2016, 21, 1374. [Google Scholar] [CrossRef]
- Rizvi, M.K.; Rabail, R.; Munir, S.; Inam-Ur-Raheem, M.; Qayyum, M.M.N.; Kieliszek, M.; Hassoun, A.; Aadil, R.M. Astounding Health Benefits of Jamun (Syzygium cumini) toward Metabolic Syndrome. Molecules 2022, 27, 7184. [Google Scholar] [CrossRef]
- Munir, S.; Liu, Z.-W.; Tariq, T.; Rabail, R.; Kowalczewski, P.Ł.; Lewandowicz, J.; Blecharczyk, A.; Abid, M.; Inam-Ur-Raheem, M.; Aadil, R.M. Delving into the Therapeutic Potential of Carica papaya Leaf against Thrombocytopenia. Molecules 2022, 27, 2760. [Google Scholar] [CrossRef]
- Saltiel, A.R.; Olefsky, J.M. Inflammatory mechanisms linking obesity and metabolic disease. J. Clin. Investig. 2017, 127, 1–4. [Google Scholar] [CrossRef]
- Silvester, A.J.; Aseer, K.R.; Yun, J.W. Dietary polyphenols and their roles in fat browning. J. Nutr. Biochem. 2019, 64, 1–12. [Google Scholar] [PubMed]
- Boström, P.; Wu, J.; Jedrychowski, M.P.; Korde, A.; Ye, L.; Lo, J.C.; Rasbach, K.A.; Boström, E.A.; Choi, J.H.; Long, J.Z.; et al. A PGC1-α-dependent myokine that drives brown-fat-like development of white fat and thermogenesis. Nature 2012, 481, 463–468. [Google Scholar] [PubMed]
- Hsu, C.L.; Yen, G.C. Phenolic compounds: Evidence for inhibitory effects against obesity and their underlying molecular signaling mechanisms. Mol. Nutr. Food Res. 2008, 52, 53–61. [Google Scholar] [CrossRef] [PubMed]
- Mele, L.; Bidault, G.; Mena, P.; Crozier, A.; Brighenti, F.; Vidal-Puig, A.; Del Rio, D. Dietary (poly)phenols, brown adipose tissue activation, and energy expenditure: A narrative review. Adv. Nutr. 2017, 8, 694–704. [Google Scholar] [PubMed]
- Asayama, K.; Nakane, T.; Dobashi, K.; Kodera, K.; Hayashibe, H.; Uchida, N.; Nakazawa, S. Effect of obesity and troglitazone on expression of two glutathione peroxidases: Cellular and extracellular types in serum, kidney and adipose tissue. Free Radic. Res. 2001, 34, 337–347. [Google Scholar]
- Carmiel-Haggai, M.; Cederbaum, A.I.; Nieto, N. A high-fat diet leads to the progression of non-alcoholic fatty liver disease in obese rats. FASEB J. 2005, 19, 136–138. [Google Scholar]
- Kerner, W.; Brückel, J. Definition, Classification and Diagnosis of Diabetes Mellitus. Exp. Clin. Endocrinol. Diabetes 2014, 122, 384–386. [Google Scholar]
- Francula-Zaninovic, S.; Nola, I.A. Management of Measurable Variable Cardiovascular Disease’ Risk Factors. Curr. Cardiol. Rev. 2018, 14, 153–163. [Google Scholar] [CrossRef]
- Behl, T.; Bungau, S.; Kumar, K.; Zengin, G.; Khan, F.; Kumar, A.; Kaur, R.; Venkatachalam, T.; Tit, D.M.; Vesa, C.M.; et al. Pleotropic Effects of Polyphenols in Cardiovascular System. Biomed. Pharm. 2020, 130, 110714. [Google Scholar]
- Yousefian, M.; Shakour, N.; Hosseinzadeh, H.; Hayes, A.W.; Hadizadeh, F.; Karimi, G. The natural phenolic compounds as modulators of NADPH oxidases in hypertension. Phytomedicine 2019, 55, 200–213. [Google Scholar]
- Saavedra, O.M.; Nahúm, E.; Vázquez, J.; Roberto, M.; Guapillo, B.; Manuel, G.; Reyes, C.; Bolaina, E.M. Radicales libres y su papel en las enfermedades. Rev. Med. UV 2010, 1, 29–32. [Google Scholar]
- Sebastian, R.S.; Enns, C.W.; Goldman, J.D.; Martin, C.L.; Steinfeldt, L.C.; Murayi, T.; Moshfegh, A.J. A new database facilitates characterization of flavonoid intake, sources, and positive associations with diet quality among US adults. J. Nutr. 2015, 145, 1239–1248. [Google Scholar] [CrossRef] [PubMed]
- Zamora-Ros, R.; Knaze, V.; Rothwell, J.A.; Hémon, B.; Overvad, K.; Tjønneland, A.; Kyrø, C.; Fagherazzi, G.; Boutron-ruault, C.; Touillaud, M.; et al. Europe PMC Funders Group Dietary polyphenol intake in Europe: The European Prospective Investigation into Cancer and Nutrition ( EPIC ) study. Eur. J. Nutr. 2018, 55, 1359–1375. [Google Scholar] [CrossRef] [PubMed]
- Jun, S.; Shin, S.; Joung, H. Estimation of dietary flavonoid intake and major food sources of Korean adults. Br. J. Nutr. 2016, 115, 480–489. [Google Scholar] [CrossRef] [PubMed]
- Valerino-Perea, S.; Lara-Castor, L.; Armstrong, M.E.G.; Papadaki, A. Definition of the traditional mexican diet and its role in health: A systematic review. Nutrients 2019, 11, 2803. [Google Scholar] [CrossRef]
- Mercado-Mercado, G.; de la Rosa Carrillo, L.; Wall-Medrano, A.; Díaz, J.A.L.; Parrilla, J.Á. Compuestos polifenólicos y capacidad antioxidante de especias típicas consumidas en México. Nutr. Hosp. 2013, 28, 36–46. [Google Scholar]
- Gómez-Maqueo, A.; Escobedo-Avellaneda, Z.; Welti-Chanes, J. Phenolic compounds in mesoamerican fruits—Characterization, health potential and processing with innovative technologies. Int. J. Mol. Sci. 2020, 21, 8357. [Google Scholar] [CrossRef]
- Barquera, S.; Hernández-Barrera, L.; Trejo-Valdivia, B.; Shamah, T.; Campos-Nonato, I.; Rivera-Dommarco, J. Obesidad en México, prevalencia y tendencias en adultos. Ensanut 2018–19. Salud Publica Mex. 2020, 62, 682–692. [Google Scholar] [CrossRef]
- Himmelgreen, D.; Romero-Daza, N.; Heuer, J.; Lucas, W.; Salinas-Miranda, A.A.; Stoddard, T. Using syndemic theory to understand food insecurity and diet-related chronic diseases. Soc. Sci. Med. 2022, 295, 113124. [Google Scholar] [CrossRef]
- Rivera, J.A.; Barquera, S.; González-Cossío, T.; Olaiz, G.; Sepúlveda, J. Nutrition transition in Mexico and in other Latin American countries. Nutr. Rev. 2004, 62, S149–S157. [Google Scholar] [CrossRef]
- Bin, D. Phenolic content and antioxidant activity of wine grapes and table grapes. J. Med. Plants Res. 2012, 6, 3381–3387. [Google Scholar] [CrossRef]
- Cosmulescu, S.; Trandafir, I.; Nour, V.; Botu, M. Total Phenolic, Flavonoid Distribution and Antioxidant Capacity in Skin, Pulp and Fruit Extracts of Plum Cultivars. J. Food Biochem. 2015, 39, 64–69. [Google Scholar] [CrossRef]
- Pap, N.; Fidelis, M.; Azevedo, L.; do Carmo, M.A.V.; Wang, D.; Mocan, A.; Pereira, E.P.R.; Xavier-Santos, D.; Sant’Ana, A.S.; Yang, B.; et al. Berry polyphenols and human health: Evidence of antioxidant, anti-inflammatory, microbiota modulation, and cell-protecting effects. Curr. Opin. Food Sci. 2021, 42, 167–186. [Google Scholar] [CrossRef]
- Aguayo-Rojas, J.; Mora-Rochín, S.; Tovar-Jiménez, X.; Rochín-Medina, J.J.; Navarro-Cortez, R.O. Fitoquímicos y propiedades nutraceúticas de durazno (Prunus persica L.) cultivado en Zacatecas. Polibotánica 2022, 53, 151–166. [Google Scholar] [CrossRef]
- Frías-Moreno, M.N.; Parra-Quezada, R.Á.; Ruíz-Carrizales, J.; González-Aguilar, G.A.; Sepulveda, D.; Molina-Corral, F.J.; Jacobo-Cuellar, J.L.; Olivas, G.I. Quality, bioactive compounds and antioxidant capacity of raspberries cultivated in northern Mexico. Int. J. Food Prop. 2021, 24, 603–614. [Google Scholar] [CrossRef]
- Alba-Jimenez, J.E.; Chavez-Servia, J.L.; Verdalet-Guzman, I.; Jesus, M.-A.; Aquino-Bolanos, E.N. Betalains, polyphenols and antioxidant activity in minimally processed red prickly pear stored in controlled atmospheres. Gayana Bot. 2014, 71, 222–226. [Google Scholar]
- Albano, C.; Negro, C.; Tommasi, N.; Gerardi, C.; Mita, G.; Miceli, A.; de Bellis, L.; Blando, F. Betalains, phenols and antioxidant capacity in cactus pear [opuntia ficus-indica (L.) mill.] fruits from Apulia (South Italy) genotypes. Antioxidants 2015, 4, 269–280. [Google Scholar] [CrossRef]
- Cardador-Martínez, A.; Jiménez-Martínez, C.; Sandoval, G. Revalorization of cactus pear (Opuntia spp.) wastes as a source of antioxidants. Food Sci. Technol. 2011, 31, 782–788. [Google Scholar] [CrossRef]
- Chang, S.-F.; Hsieh, C.-L.; Yen, G.-C. The protective effect of Opuntia dillenii Haw fruit against low-density lipoprotein peroxidation and its active compounds. Food Chem. 2008, 106, 569–575. [Google Scholar] [CrossRef]
- Wolfe, K.; Wu, X.; Liu, R.H. Antioxidant activity of apple peels. J. Agric. Food Chem. 2003, 51, 609–614. [Google Scholar] [CrossRef]
- Sir Elkhatim, K.A.; Elagib, R.A.A.; Hassan, A.B. Content of phenolic compounds and vitamin C and antioxidant activity in wasted parts of Sudanese citrus fruits. Food Sci. Nutr. 2018, 6, 1214–1219. [Google Scholar] [CrossRef]
- Zhu, C.; Chou, O.; Lee, F.Y.; Wang, Z.; Barrow, C.J.; Dunshea, F.R.; Suleria, H.A.R. Characterization of phenolics in rejected kiwifruit and their antioxidant potential. Processes 2021, 9, 781. [Google Scholar] [CrossRef]
- Ghasemi, K.; Ghasemi, Y.; Ebrahimzadeh, M.A. Antioxidant activity, phenol and flavonoid contents of 13 citrus species peels and tissues. Pak. J. Pharm. Sci. 2009, 22, 277–281. [Google Scholar]
- Rekika, D.; Khanizadeh, S.; Deschênes, M.; Levasseur, A.; Charles, M.T.; Tsao, R.; Yang, R. Antioxidant capacity and phenolic content of selected strawberry genotypes. HortScience 2005, 40, 1777–1781. [Google Scholar] [CrossRef]
- Hernández-Escarcega, G.; Sánchez-Chávez, E.; Pérez-Álvarez, S.; Soto-Caballero, M.; Soto-Parra, J.M.; Flores-Córdova, M.A.; Salas-Salazar, N.A.; Ojeda-Barrios, D.L. Determination of antioxidant phenolic, nutritional quality and volatiles in pomegranates (Punica granatum L.) cultivated in Mexico. Int. J. Food Prop. 2020, 23, 979–991. [Google Scholar] [CrossRef]
- Hu, T.; Subbiah, V.; Wu, H.; BK, A.; Rauf, A.; Alhumaydhi, F.A.; Suleria, H.A.R. Determination and Characterization of Phenolic Compounds from Australia-Grown Sweet Cherries (Prunus avium L.) and Their Potential Antioxidant Properties. ACS Omega 2022, 7, 9086. [Google Scholar] [CrossRef]
- Wang, Z.; Barrow, C.J.; Dunshea, F.R.; Suleria, H.A.R. A comparative investigation on phenolic composition, characterization and antioxidant potentials of five different australian grown pear varieties. Antioxidants 2021, 10, 151. [Google Scholar] [CrossRef]
- Beas, R.; Loarca, G.; Guzmán, S.H.; Rodriguez, M.G.; Vasco, N.L.; Guevara, F. Potencial nutracéutico de componentes bioactivos presentes en huitlacoche de la zona centro de México. Rev. Mex. Cienc. Farm. 2011, 42, 36–44. [Google Scholar]
- Aslam, Z.; Akhtar, S.; Imran, M.; Nadeem, M.; Gilani, S.; Elnashar, M.; Ahmed, E. Antioxidant Activity, Anti-Inflammatory Activities, Anti-Cancer and Chemical Composition of Spring Onion (Allium Fistolisum) Extracts. Res. J. Pharm. Biol. Chem. Sci. 2018, 8, 1880–1890. [Google Scholar]
- Valchev, N. Nutritional and amino acid content of stem and cap of agaricus bisporus, Bulgaria. Bulg. J. Agric. Sci. 2020, 26, 192–201. [Google Scholar]
- Zhang, D.; Hamauzu, Y. Phenolic compounds and their antioxidant properties in different tissues of carrots (Daucus carota L.). Int. J. Food, Agric. Environ. 1985, 2, 332. [Google Scholar]
- Guiné, R.P.F.; Correia, P.M.D.R.; Ferrão, A.C.; Gonçalves, F.; Lerat, C.; El-Idrissi, T.; Rodrigo, E. Evaluation of phenolic and antioxidant properties of strawberry as a function of extraction conditions. Braz. J. Food Technol. 2020, 23, 1–11. [Google Scholar] [CrossRef]
- Zein, H.; El-Moneim, A.; Hashish, S.; Ismaiel, G.H.H. The antioxidant and Anticancer Activities of Swiss Chard and Red Beetroot Leaves. Curr. Sci. Int. 2015, 4, 491–498. [Google Scholar]
- Jiménez-Aguilar, D.M.; Grusak, M.A. Evaluation of Minerals, Phytochemical Compounds and Antioxidant Activity of Mexican, Central American, and African Green Leafy Vegetables. Plant Foods Hum. Nutr. 2015, 70, 357–364. [Google Scholar] [CrossRef]
- Jung, W.; Chung, I.; Kim, H.; Kim, M.Y.; Ahmad, A.; Praveen, N. In vitro antioxidant activity, total phenolics and flavonoids from celery (Apium graveolens) leaves. J. Med. Plants Res. 2011, 5, 7022–7030. [Google Scholar]
- Zhou, X.; Li, M.; Li, L.; Zhang, Y.; Cui, J.; Liu, J.; Chen, C. The semantic system is involved in mathematical problem solving. Neuroimage 2018, 166, 360–370. [Google Scholar] [CrossRef]
- Guevara-Figueroa, T.; Jiménez-Islas, H.; Reyes-Escogido, M.L.; Mortensen, A.G.; Laursen, B.B.; Lin, L.W.; De León-Rodríguez, A.; Fomsgaard, I.S.; Barba de la Rosa, A.P. Proximate composition, phenolic acids, and flavonoids characterization of commercial and wild nopal (Opuntia spp.). J. Food Compos. Anal. 2010, 23, 525–532. [Google Scholar] [CrossRef]
- Li, Z.; Lee, H.W.; Liang, X.; Liang, D.; Wang, Q.; Huang, D.; Ong, C.N. Profiling of phenolic compounds and antioxidant activity of 12 cruciferous vegetables. Molecules 2018, 23, 1139. [Google Scholar] [CrossRef]
- Lopez-Martinez, L.X.; Oliart-Ros, R.M.; Valerio-Alfaro, G.; Lee, C.-H.; Parkin, K.L.; Garcia, H.S. Antioxidant activity, phenolic compounds and anthocyanins content of eighteen strains of Mexican maize. LWT-Food Sci. Technol. 2009, 42, 1187–1192. [Google Scholar] [CrossRef]
- Robles-Ramírez, M.D.C.; Monterrubio-López, R.; Mora-Escobedo, R.; Beltrán-Orozco, M.D.C. Evaluation of extracts from potato and tomato wastes as natural antioxidant additives. Arch. Latinoam. Nutr. 2016, 66, 66–73. [Google Scholar]
- Heuberger, A.L.; Lewis, M.R.; Chen, M.H.; Brick, M.A.; Leach, J.E.; Ryan, E.P. Metabolomic and functional genomic analyses reveal varietal differences in bioactive compounds of cooked rice. PLoS ONE 2010, 5, e12915. [Google Scholar] [CrossRef]
- Jian, G.X.; Cheng, R.T.; Qing, P.H.; Ji, Y.L.; Xiang, D.W.; Xiang, D.T. Dynamic changes in phenolic compounds and antioxidant activity in oats (Avena nuda L.) during steeping and germination. J. Agric. Food Chem. 2009, 57, 10392–10398. [Google Scholar]
- Horvat, D.; Šimić, G.; Drezner, G.; Lalić, A.; Ledenčan, T.; Tucak, M.; Plavšić, H.; Andrić, L.; Zdunić, Z. Phenolic acid profiles and antioxidant activity of major cereal crops. Antioxidants 2020, 9, 527. [Google Scholar] [CrossRef]
- Alu’datt, M.H.; Rababah, T.; Ereifej, K.; Alli, I. Distribution, antioxidant and characterisation of phenolic compounds in soybeans, flaxseed and olives. Food Chem. 2013, 139, 93–99. [Google Scholar] [CrossRef]
- Belman-Ramirez, I.J.; Sosa-Morales, M.E.; Ceron-Garcia, A. Evaluacion de componentes bioactivos y compuestos antinutricionales en semillas de mijo perla (Pennisetum glaucum). Jovenes en la Cienc. 2016, 2, 1172–1176. [Google Scholar]
- Flores-Naveda, A.; Díaz-Vázquez, F.; Ruiz-Torres, N.A.; Vázquez-Badillo, M.E.; Niño-Medina, G.; Camposeco-Montejo, N.; Rodríquez-Salinas, P.; García-López, J.I. Compuestos fenólicos y actividad antioxidante en líneas experimentales de sorgo pigmentado cultivado en Coahuila México. Inf. Tec. Econ. Agrar. 2021, 117, 478–493. [Google Scholar] [CrossRef]
- Xu, B.J.; Chang, S.K.C. A comparative study on phenolic profiles and antioxidant activities of legumes as affected by extraction solvents. J. Food Sci. 2007, 72, S159–S166. [Google Scholar] [CrossRef]
- Perez-Hernandez, L.M.; Hernández-Álvarez, A.J.; Morgan, M.; Boesch, C.; Orfila, C. Polyphenol bioaccessibility and anti-inflammatory activity of Mexican common beans (Phaseolus vulgaris L.) with diverse seed colour. CYTA-J. Food 2021, 19, 682–690. [Google Scholar] [CrossRef]
- Ortiz-López, M.; Delgado-Alvarado, A.; Herrera-Cabrera, B.E.; Árevalo-Galarza, M.D.L.; Barrera-Rodríguez, A.I. Efecto de dos métodos de secado en los compuestos fenólicos totales, L-DOPA y la actividad antioxidante de Vicia faba L. Nov. Sci. 2019, 11, 198–219. [Google Scholar]
- Zou, Y.; Chang, S.K.C.; Gu, Y.; Qian, S.Y. Antioxidant Activity and Phenolic Compositions of Lentil (Lens culinaris var. Morton) Extract and Its Fractions. J. Agric. Food Chem. 2011, 59, 2268–2276. [Google Scholar] [CrossRef]
- Li, W.; Beta, T. Food Sources of Phenolics Compounds. In Natural Products 2013; Springer: Berlin/Heidelberg, Germany, 2013; pp. 2527–2558. [Google Scholar]
- Dhingra, N.; Kar, A.; Sharma, R.; Bhasin, S. In-vitro antioxidative potential of different fractions from Prunus dulcis seeds: Vis a vis antiproliferative and antibacterial activities of active compounds. S. Afr. J. Bot. 2017, 108, 184–192. [Google Scholar] [CrossRef]
- Rosales-Martínez, P.; Arellano-Cárdenas, S.; Dorantes-Álvarez, L.; García-Ochoa, F.; López-Cortez, M.D.S. Comparison between antioxidant activities of phenolic extracts from mexican peanuts, peanuts skins, nuts and pistachios. J. Mex. Chem. Soc. 2014, 58, 185–193. [Google Scholar]
- Oliveira-Alves, S.C.; Vendramini-Costa, D.B.; Betim Cazarin, C.B.; Maróstica Júnior, M.R.; Borges Ferreira, J.P.; Silva, A.B.; Prado, M.A.; Bronze, M.R. Characterization of phenolic compounds in chia (Salvia hispanica L.) seeds, fiber flour and oil. Food Chem. 2017, 232, 295–305. [Google Scholar] [CrossRef]
- Anwar, F.; Przybylski, R. Effect of solvents extraction on total phenolics and antioxidant activity of extracts from flaxseed (Linum usitatissimum L.). Acta Sci. Pol. Technol. Aliment. 2012, 11, 293–302. [Google Scholar]
- Andrei, S.; Bunea, A.; Bele, C.; Tudor, C.; Pintea, A. Bioactive Compounds and Antioxidant Activity in Some Fresh and Canned Aromatic Herbs. Bull. UASVM Food Sci. Technol. 2018, 75, 180. [Google Scholar] [CrossRef]
- Muñiz-Márquez, D.B.; Rodríguez, R.; Balagurusamy, N.; Carrillo, M.L.; Belmares, R.; Contreras, J.C.; Nevárez, G.V.; Aguilar, C.N. Phenolic content and antioxidant capacity of extracts of Laurus nobilis L., Coriandrum sativum L. and Amaranthus hybridus L. CYTA-J. Food 2014, 12, 271–276. [Google Scholar] [CrossRef]
- Cortés-Chitala, M.D.C.; Flores-Martínez, H.; Orozco-ávila, I.; León-Campos, C.; Suárez-Jacobo, Á.; Estarrón-Espinosa, M.; López-Muraira, I. Identification and quantification of phenolic compounds from mexican oregano (Lippia graveolens hbk) hydroethanolic extracts and evaluation of its antioxidant capacity. Molecules 2021, 26, 702. [Google Scholar] [CrossRef]
- Flores-Flores, J.; López-Rodríguez, B.; Hernández-López, D.; Guzmán-Maldonado, S.H. Caracterización fenólica y capacidad antioxidante de plantas de uso medicinal. Investig. Desarro Cienc. Tecnol. Aliment. Determ. 2019, 4, 834–840. [Google Scholar]
- Beato, V.M.; Orgaz, F.; Mansilla, F.; Montaño, A. Changes in Phenolic Compounds in Garlic (Allium sativum L.) Owing to the Cultivar and Location of Growth. Plant Foods Hum. Nutr. 2011, 66, 218–223. [Google Scholar] [CrossRef]
- Torres-Aguirre, G.; Muñoz-Bernal, Ó.; Álvarez-Parrilla, E.; Núñez-Gastélum, J.; Wall-Medrano, A.; Sáyago-Ayerdi, S. Optimization of the extraction and identification of polyphenolic compounds in aniseed (Pimpinella anisum), clove (Syzygium aromaticum) and coriander (Coriandrum sativum) through HPLC coupled to mass spectrometry. TIP Rev. Espec. En Cienc. Químico-Biológicas 2018, 21, 103–115. [Google Scholar]
- Chrpová, D.; Kourimská, L.; Gordon, M.H.; Hermanová, V.; Roubícková, I.; Pánek, J. Antioxidant activity of selected phenols and herbs used in diets for medical conditions. Czech. J. Food Sci. 2010, 28, 317–325. [Google Scholar] [CrossRef]
- Wong-Paz, J.E.; Muñiz-Márquez, D.B.; Aguilar-Zárate, P.; Rodríguez-Herrera, R.; Aguilar, C.N. Microplate quantification of total phenolic content from plant extracts obtained by conventional and ultrasound methods. Phytochem. Anal. 2014, 25, 439–444. [Google Scholar] [CrossRef]
- Viuda-Martos, M.; Ciro-Gómez, G.L.; Ruiz-Navajas, Y.; Zapata-Montoya, J.E.; Sendra, E.; Pérez-Álvarez, J.A.; Fernández-López, J. In vitro Antioxidant and Antibacterial Activities of Extracts from Annatto (Bixa orellana L.) Leaves and Seeds. J. Food Saf. 2012, 32, 399–406. [Google Scholar] [CrossRef]
- Kouighat, M.; Nabloussi, A.; Adiba, A.; El Fechtali, M.; Hanine, H. First Study of Improved Nutritional Properties and Anti-Oxidant Activity in Novel Sesame Mutant Lines as Compared to Their Wild-Types. Plants 2022, 11, 1099. [Google Scholar] [CrossRef]
- Valadez-Villarreal ALópez-Hernandez EGarcía-Jiménez, R. Investigación y Desarrollo en Ciencia y Tecnología de Alimentos Comparación de dos técnicas de extracción de jengibre (Zingiber officinale Roscoe) y cuantificación de fenólicos totales y capacidad antioxidante Investigación y Desarrollo en Ciencia y Tec. Investig. Desarro. Cienc. Tecnol. Aliment. 2019, 4, 813–817. [Google Scholar]
- Gülçin, I. The antioxidant and radical scavenging activities of black pepper (Piper nigrum) seeds. Int. J. Food Sci. Nutr. 2005, 56, 491–499. [Google Scholar] [CrossRef]
- Kuri-García, A.; Chávez-Servín, J.L.; Guzmán-Maldonado, S. Phenolic profile and antioxidant capacity of Cnidoscolus chayamansa and Cnidoscolus aconitifolius: A review. J. Med. Plants Res. 2017, 11, 713–727. [Google Scholar]
- De Marino, S.; Gala, F.; Borbone, N.; Zollo, F.; Vitalini, S.; Visioli, F.; Iorizzi, M. Phenolic glycosides from Foeniculum vulgare fruit and evaluation of antioxidative activity. Phytochemistry 2007, 68, 1805–1812. [Google Scholar] [CrossRef]
- Cittan, M.; Altuntaş, E.; Çelik, A. Evaluation of antioxidant capacities and phenolic profiles in Tilia cordata fruit extracts: A comparative study to determine the efficiency of traditional hot water infusion method. Ind. Crops Prod. 2018, 122, 553–558. [Google Scholar] [CrossRef]
- Conde-Hernández, L.A.; Guerrero-Beltrán, J.Á. Total phenolics and antioxidant activity of piper auritum and porophyllum ruderale. Food Chem. 2014, 142, 455–460. [Google Scholar] [CrossRef]
- Antonietti, S.; Silva, A.M.; Simões, C.; Almeida, D.; Félix, L.M.; Papetti, A.; Nunes, F.M. Chemical Composition and Potential Biological Activity of Melanoidins From Instant Soluble Coffee and Instant Soluble Barley: A Comparative Study. Front. Nutr. 2022, 9, 34. [Google Scholar] [CrossRef]
- Moraes-de-Souza, R.A.; Oldoni, T.L.C.; Regitano-d’Arce, M.A.B.; Alencar, S.M. Actividad Antioxidante Y Compuestos Fenólicos En Infusiones Herbarias Consumidas En Brasil. Cienc. Tecnol. 2008, 6, 41–47. [Google Scholar]
- Urías-Orona, V.; Martínez-Ávila, G.C.G.; Rojas-Molina, R.; Niño-Medina, G. Compuestos fenólicos y capacidad antioxidante en bebidas comerciales de consumo frecuente en términos de tamaño de porción. Temas. Cienc. y Tecnol. 2020, 24, 29–33. [Google Scholar]
- Taco-Sosapanta, R.E. Evaluación Del Efecto Antioxidante Del Extracto de Semillas de Uva y Estudio de Métodos Para Determinar el Envejecimiento Acelerado en Vinos Tintos; Escuela Agrícola Panamericana: Zamorano, Honduras, 2017. [Google Scholar]
- Cid-Ortega, S.; Guerrero-Beltrán, J. Propiedades funcionales de la jamaica (Hibiscus sabdariffa L.). Temas. Sel. Ing. Aliment. 2012, 2, 47–63. [Google Scholar]
- Catani, M.V.; Rinaldi, F.; Tullio, V.; Gasperi, V.; Savini, I. Comparative analysis of phenolic composition of six commercially available chamomile (Matricaria chamomilla l.) extracts: Potential biological implications. Int. J. Mol. Sci. 2021, 22, 10601. [Google Scholar] [CrossRef] [PubMed]
- Okarini, I.A.; Purnomo, H.; Aulanni’am; Radiati, L.E. Proximate, total phenolic, antioxidant activity and amino acids profile of Bali indigenous chicken, spent laying hen and broiler breast fillet. Int. J. Poult. Sci. 2013, 12, 415–420. [Google Scholar] [CrossRef]
- Muchuweti, M.; Kativu, E.; Mupure, C.H.; Chidewe, C.; Ndhlala, A.R.; Benhura, M.A.N. Phenolic composition and antioxidant properties of some spices. Am. J. Food Technol. 2007, 2, 414–420. [Google Scholar] [CrossRef]
- Msaada, K.; Taârit, M.; Hosni, K.; Nidhal, S.; Tammar, S.; Bettaieb, I.; Hammami, M.; Limam, F.; Marzouk, B. Comparison of Different Extraction Methods for the Determination of Essential oils and Related Compounds from Coriander (Coriandrum sativum L.). Acta Chim. Slov. 2012, 59, 803–813. [Google Scholar]
- Araújo, L.R.S.; Watanabe, P.H.; Fernandes, D.R.; de O Maia, I.R.; da Silva, E.C.; Pinheiro, R.R.S.; de Melo, M.C.A.; Dos Santos, E.O.; Owen, R.W.; Trevisan, M.T.S.; et al. Dietary ethanol extract of mango increases antioxidant activity of pork. Animal 2021, 15, 100099. [Google Scholar] [CrossRef]
- Wahyono, A.; Dewi, A.C.; Oktavia, S.; Jamilah, S.; Kang, W.W. Antioxidant activity and Total Phenolic Contents of Bread Enriched with Pumpkin Flour. IOP Conf. Ser. Earth Environ. Sci. 2020, 411, 012049. [Google Scholar] [CrossRef]
- Aquino-Bolaños, E.N.; Garzón-García, A.K.; Alba-Jiménez, J.E.; Chávez-Servia, J.L.; Vera-Guzmán, A.M.; Carrillo-Rodríguez, J.C.; Santos-Basurto, M.A. Physicochemical Characterization and Functional Potential of Phaseolus vulgaris L. and Phaseolus coccineus L. Landrace Green Beans. Agronomy 2021, 11, 803. [Google Scholar] [CrossRef]
- Meng, J.; Fang, Y.; Zhang, A.; Chen, S.; Xu, T.; Ren, Z.; Han, G.; Liu, J.; Li, H.; Zhang, Z.; et al. Phenolic content and antioxidant capacity of Chinese raisins produced in Xinjiang Province. Food Res. Int. 2011, 44, 2830–2836. [Google Scholar] [CrossRef]
- Salinas-Moreno, Y.; Hernandez-Martinez, V.; Trejo-Téllez, L.; Ramírez-Díaz, J.L.; Iñiguez-Gómez, O. Nutritional composition and bioactive compounds in tortillas of native populations of corn with blue/purple grain. Rev. Mex. Cienc. Agríc. 2017, 8, 1483–1496. [Google Scholar]
- Osorio-Esquivel, O.; Alicia-Ortiz-Moreno; Álvarez, V.B.; Dorantes-Álvarez, L.; Giusti, M.M. Phenolics, betacyanins and antioxidant activity in Opuntia joconostle fruits. Food Res. Int. 2011, 44, 2160–2168. [Google Scholar] [CrossRef]
- Tsen, S.Y.; Siew, J.; Lau, E.K.L.; Afiqah bte Roslee, F.; Chan, H.M.; Loke, W.M. Cow’s milk as a dietary source of equol and phenolic antioxidants: Differential distribution in the milk aqueous and lipid fractions. Dairy Sci. Technol. 2014, 94, 625–632. [Google Scholar] [CrossRef]
- Martinez-Damián, M.T.; Cruz-Alvarez, O.; Moreno-Perez, E.D.C.; Valle-Guadarrama, S. Intensidad de color y compuestos bioactivos en colectas de chile guajillo del norte de Mexico. Rev. Mex. Ciencias Agrícolas 2019, 10, 35–49. [Google Scholar] [CrossRef]
- Rebey, I.B.; Kefi, S.; Bourgou, S.; Ouerghemmi, I.; Ksouri, R.; Tounsi, M.S.; Marzouk, B. Ripening Stage and Extraction Method Effects on Physical Properties, Polyphenol Composition and Antioxidant Activities of Cumin (Cuminum cyminum L.) Seeds. Plant Foods Hum. Nutr. 2014, 69, 358–364. [Google Scholar] [CrossRef]
- Cuchillo-Hilario, M.; Delgadillo-Puga, C.; Navarro-Ocaña, A.; Pérez-Gil-Romo, F. Antioxidant activity, bioactive polyphenols in Mexican goats’ milk cheeses on summer grazing. J. Dairy Res. 2010, 77, 20–26. [Google Scholar] [CrossRef]
- del Pilar Fernández-Poyatos, M.; Llorent-Martínez, E.J.; Ruiz-Medina, A. Phytochemical Composition and Antioxidant Activity of Portulaca oleracea: Influence of the Steaming Cooking Process. Foods 2021, 10, 94. [Google Scholar] [CrossRef]
- Mohamed Hussein, R.H.; Mohamed Atef, S.; Khaled Abdel-Hamed, S.; Khalel Ibrahim, K. Evaluation of antioxidant activity, total phenols and phenolic compounds in thyme (Thymus vulgaris L.), sage (Salvia officinalis L.), and marjoram (Origanum majorana L.) extracts. Ind. Crops Prod. 2013, 43, 827–831. [Google Scholar]
- Moreno-Ramírez, Y.; Martínez-Ávila, G.; González-Hernández, V.; Castro-López, C.; Torres-Castillo, J. Free Radical-Scavenging Capacities, Phenolics and Capsaicinoids in Wild Piquin Chili (Capsicum annuum var. Glabriusculum). Molecules 2018, 23, 2655. [Google Scholar] [CrossRef]
- Vásquez-Hernández, S.; Cruz-Cruz, C.A.; Santiago-Santiago, M.; Bello-Bello, J.J. Evaluation of different antioxidants during in vitro establishment of allspice (Pimenta dioica L. Merrill): A recalcitrant species. Agro. Product 2021. Epub ahead of print. [Google Scholar] [CrossRef]
- Konovalov, D.A.; Alieva, N.M. Phenolic compounds of laurus nobilis (review). Pharm. Pharmacol. 2019, 7, 244–259. [Google Scholar] [CrossRef]
- Handayani, R.; Fans, K.; Mastuti, T.S.; Rosa, D. Comparison study of antioxidant activity from three banana leaves extracts. J. Teknol. dan Ind. Pangan 2021, 32, 92–97. [Google Scholar] [CrossRef]
- Román-Cortés, N.R.; García-Mateos, M.D.R.; Castillo-González, A.M.; Sahagún-Castellanos, J.; Jiménez-Arellanes, M.A. Caracteristicas nutricionales y nutraceuticas de hortalizas de uso ancestral en Mexico. Rev. Fitotec. Mex. 2018, 41, 245–253. [Google Scholar]
- Hussain, A.; Kausar, T.; Din, A.; Murtaza, M.A.; Jamil, M.A.; Noreen, S.; Rehman, H.U.; Shabbir, H.; Ramzan, M.A. Determination of total phenolic, flavonoid, carotenoid, and mineral contents in peel, flesh, and seeds of pumpkin (Cucurbita maxima). J. Food Process. Preserv. 2021, 45, e15542. [Google Scholar] [CrossRef]
- Abdel-Samea, R.R. Nutritional Evaluation Of Toast Bread Fortified With Mango Peels And Seed Kernels Powder. J. Home Econ. 2014, 24, 145–170. [Google Scholar]
- García-González, C.A.; Ayala-González, M.B.; Cedeño-Saritama, R.E.; Armijos-Aguilar, J.C. Determinación de Fenoles en Ají Gallinazo (Capsicum Frutescens)—Ají Rocoto Aplicando Espectrofotometría; UTMACH: Machala, Ecuador, 2018. [Google Scholar]
- Lutz, M.; Hernández, J.; Henríquez, C. Phenolic content and antioxidant capacity in fresh and dry fruits and vegetables grown in Chile. CYTA-J. Food 2015, 13, 541–547. [Google Scholar]
- Hijaz, F.; Al-Rimawi, F.; Manthey, J.A.; Killiny, N. Phenolics, flavonoids and antioxidant capacities in Citrus species with different degree of tolerance to Huanglongbing. Plant Signal. Behav. 2020, 15, 1752447. [Google Scholar] [CrossRef]
- Dávila-Cervantes, C.A.; Agudelo-Botero, M. Sex disparities in the epidemic of type 2 diabetes in Mexico: National and state level results based on the global burden of disease study, 1990–2017. Diabetes Metab. Syndr. Obes. Targets Ther. 2019, 12, 1023–1033. [Google Scholar] [CrossRef]
- WHO. Noncommunicable Diseases, Coutry Profiles 2018; World Health Organization: Geneva, Switzerland, 2018. [Google Scholar]
- FAO; IFAD; UNICEF; WFP; WHO. The State of Food Security and Nutrition in the World 2022. Repurposing Food and Agricultural Policies to Make Healthy Diets More Affordable; FAO: Rome, Italy, 2022. [Google Scholar] [CrossRef]
- Staniforth, V.; Huang, W.C.; Aravindaram, K.; Yang, N.S. Ferulic acid, a phenolic phytochemical, inhibits UVB-induced matrix metalloproteinases in mouse skin via posttranslational mechanisms. J. Nutr. Biochem. 2012, 23, 443–451. [Google Scholar] [CrossRef] [PubMed]
- Nicolás-García, M.; Jiménez-Martínez, C.; Perucini-Avendaño, M.; Hildeliza Camacho-Díaz, B.; Ruperto Jiménez-Aparicio, A.; Dávila-Ortiz, G. Phenolic Compounds in Legumes: Composition, Processing and Gut Health. In Legumes Research; IntechOpen: London, UK, 2021; Volume 2, pp. 25–240. [Google Scholar]
- Mullins, A.P.; Arjmandi, B.H. Health benefits of plant-based nutrition: Focus on beans in cardiometabolic diseases. Nutrients 2021, 13, 519. [Google Scholar] [CrossRef]
- Cicerale, S.; Lucas, L.; Keast, R. Biological Activities of Phenolic Compounds Present in Virgin Olive Oil. Int. J. Mol. Sci. 2010, 11, 458–479. [Google Scholar] [CrossRef]
- Lu, M.; Yuan, B.; Zeng, M.; Chen, J. Antioxidant capacity and major phenolic compounds of spices commonly consumed in China. Food Res. Int. 2011, 44, 530–536. [Google Scholar] [CrossRef]
- Farah, A.; Donangelo, C.M. Phenolic compounds in coffee. Braz. J. Plant Physiol. 2006, 18, 23–36. [Google Scholar] [CrossRef]
- Ilavenil, S.; Arasu, M.V.; Lee, J.-C.; Kim, D.H.; Roh, S.G.; Park, H.S.; Choi, G.J.; Mayakrishnan, V.; Choi, K.C. Trigonelline attenuates the adipocyte differentiation and lipid accumulation in 3T3-L1 cells. Phytomedicine 2014, 21, 758–765. [Google Scholar] [CrossRef]
- McKay, D.L.; Blumberg, J.B. A Review of the bioactivity and potential health benefits of chamomile tea (Matricaria recutita L.). Phyther. Res. 2006, 20, 519–530. [Google Scholar] [CrossRef]
- Collins, E.J.; Bowyer, C.; Tsouza, A.; Chopra, M. Tomatoes: An Extensive Review of the Associated Health Impacts of Tomatoes and Factors That Can Affect Their Cultivation. Biology 2022, 11, 239. [Google Scholar] [CrossRef]
- Imran, M.; Ghorat, F.; Ul-haq, I.; Ur-rehman, H.; Aslam, F.; Heydari, M.; Shariati, M.A.; Okuskhanova, E.; Yessimbekov, Z.; Thiruvengadam, M.; et al. Lycopene as a natural antioxidant used to prevent human health disorders. Antioxidants 2020, 9, 706. [Google Scholar] [CrossRef]


Disclaimer/Publisher’s Note: The statements, opinions and data contained in all publications are solely those of the individual author(s) and contributor(s) and not of MDPI and/or the editor(s). MDPI and/or the editor(s) disclaim responsibility for any injury to people or property resulting from any ideas, methods, instructions or products referred to in the content. |
© 2023 by the authors. Licensee MDPI, Basel, Switzerland. This article is an open access article distributed under the terms and conditions of the Creative Commons Attribution (CC BY) license (https://creativecommons.org/licenses/by/4.0/).