
Effect and Mechanism of Theaflavins on Fluoride Transport and Absorption in Caco-2 Cells

Abstract
:1. Introduction
2. Materials and Methods
2.1. Cell Culture
2.2. Model Evaluation
2.3. CCK-8 Viability Test
2.4. Fluoride (F−) Transport Experiment
2.5. Effects of TFs on F− Uptake by Caco-2 Cells
2.6. Fluoride Ion Fluorescence Probe Localization Characterization
2.7. Interaction and Structural Characterization of TFs with F−
2.8. Transcriptome Sequencing and Differentially Expressed Genes (DEGs) qRT-PCR Analysis
2.9. Statistical Analysis
3. Results
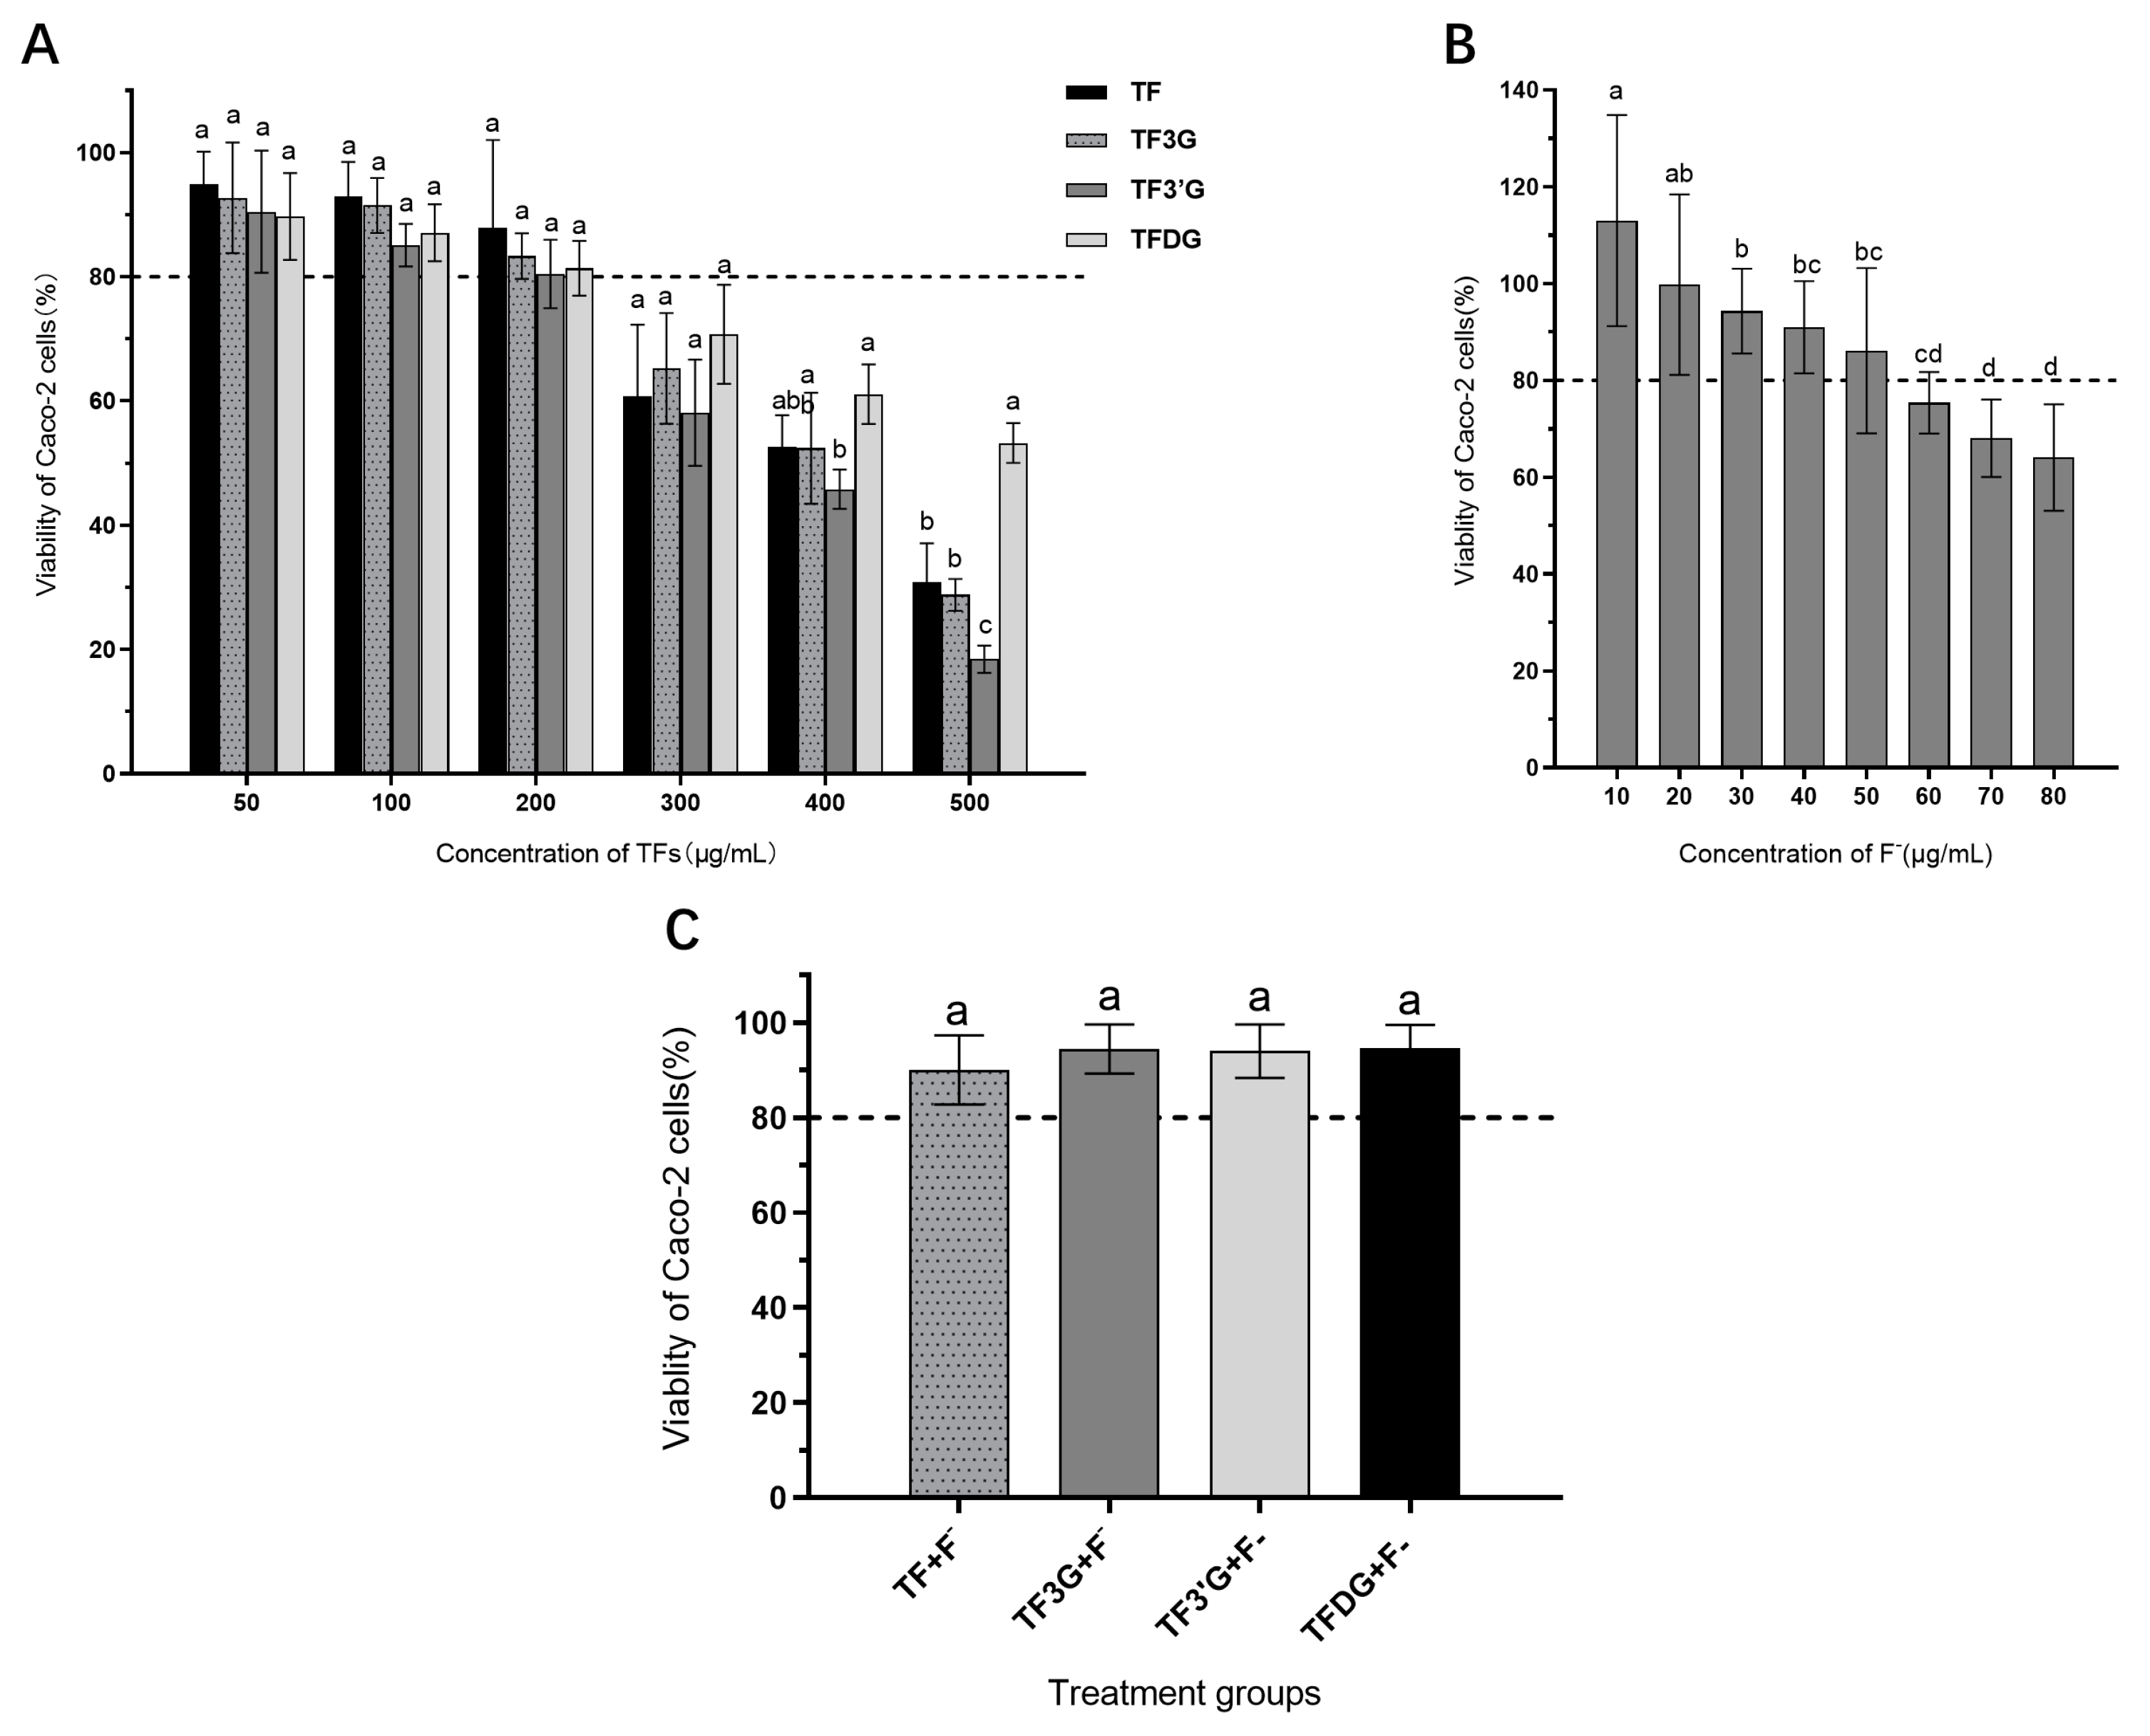
3.1. Effects of Test Substances on Viability of Caco-2 Cell
3.2. Regulation of TFs on F− Transport in Caco-2 Cells
3.2.1. Effects of TFs on F− Transport in Caco-2 Cells
3.2.2. Effects of TFs on F− Accumulation in Caco-2 Cells
3.2.3. Distribution Characteristics of F− in Caco-2 Cells
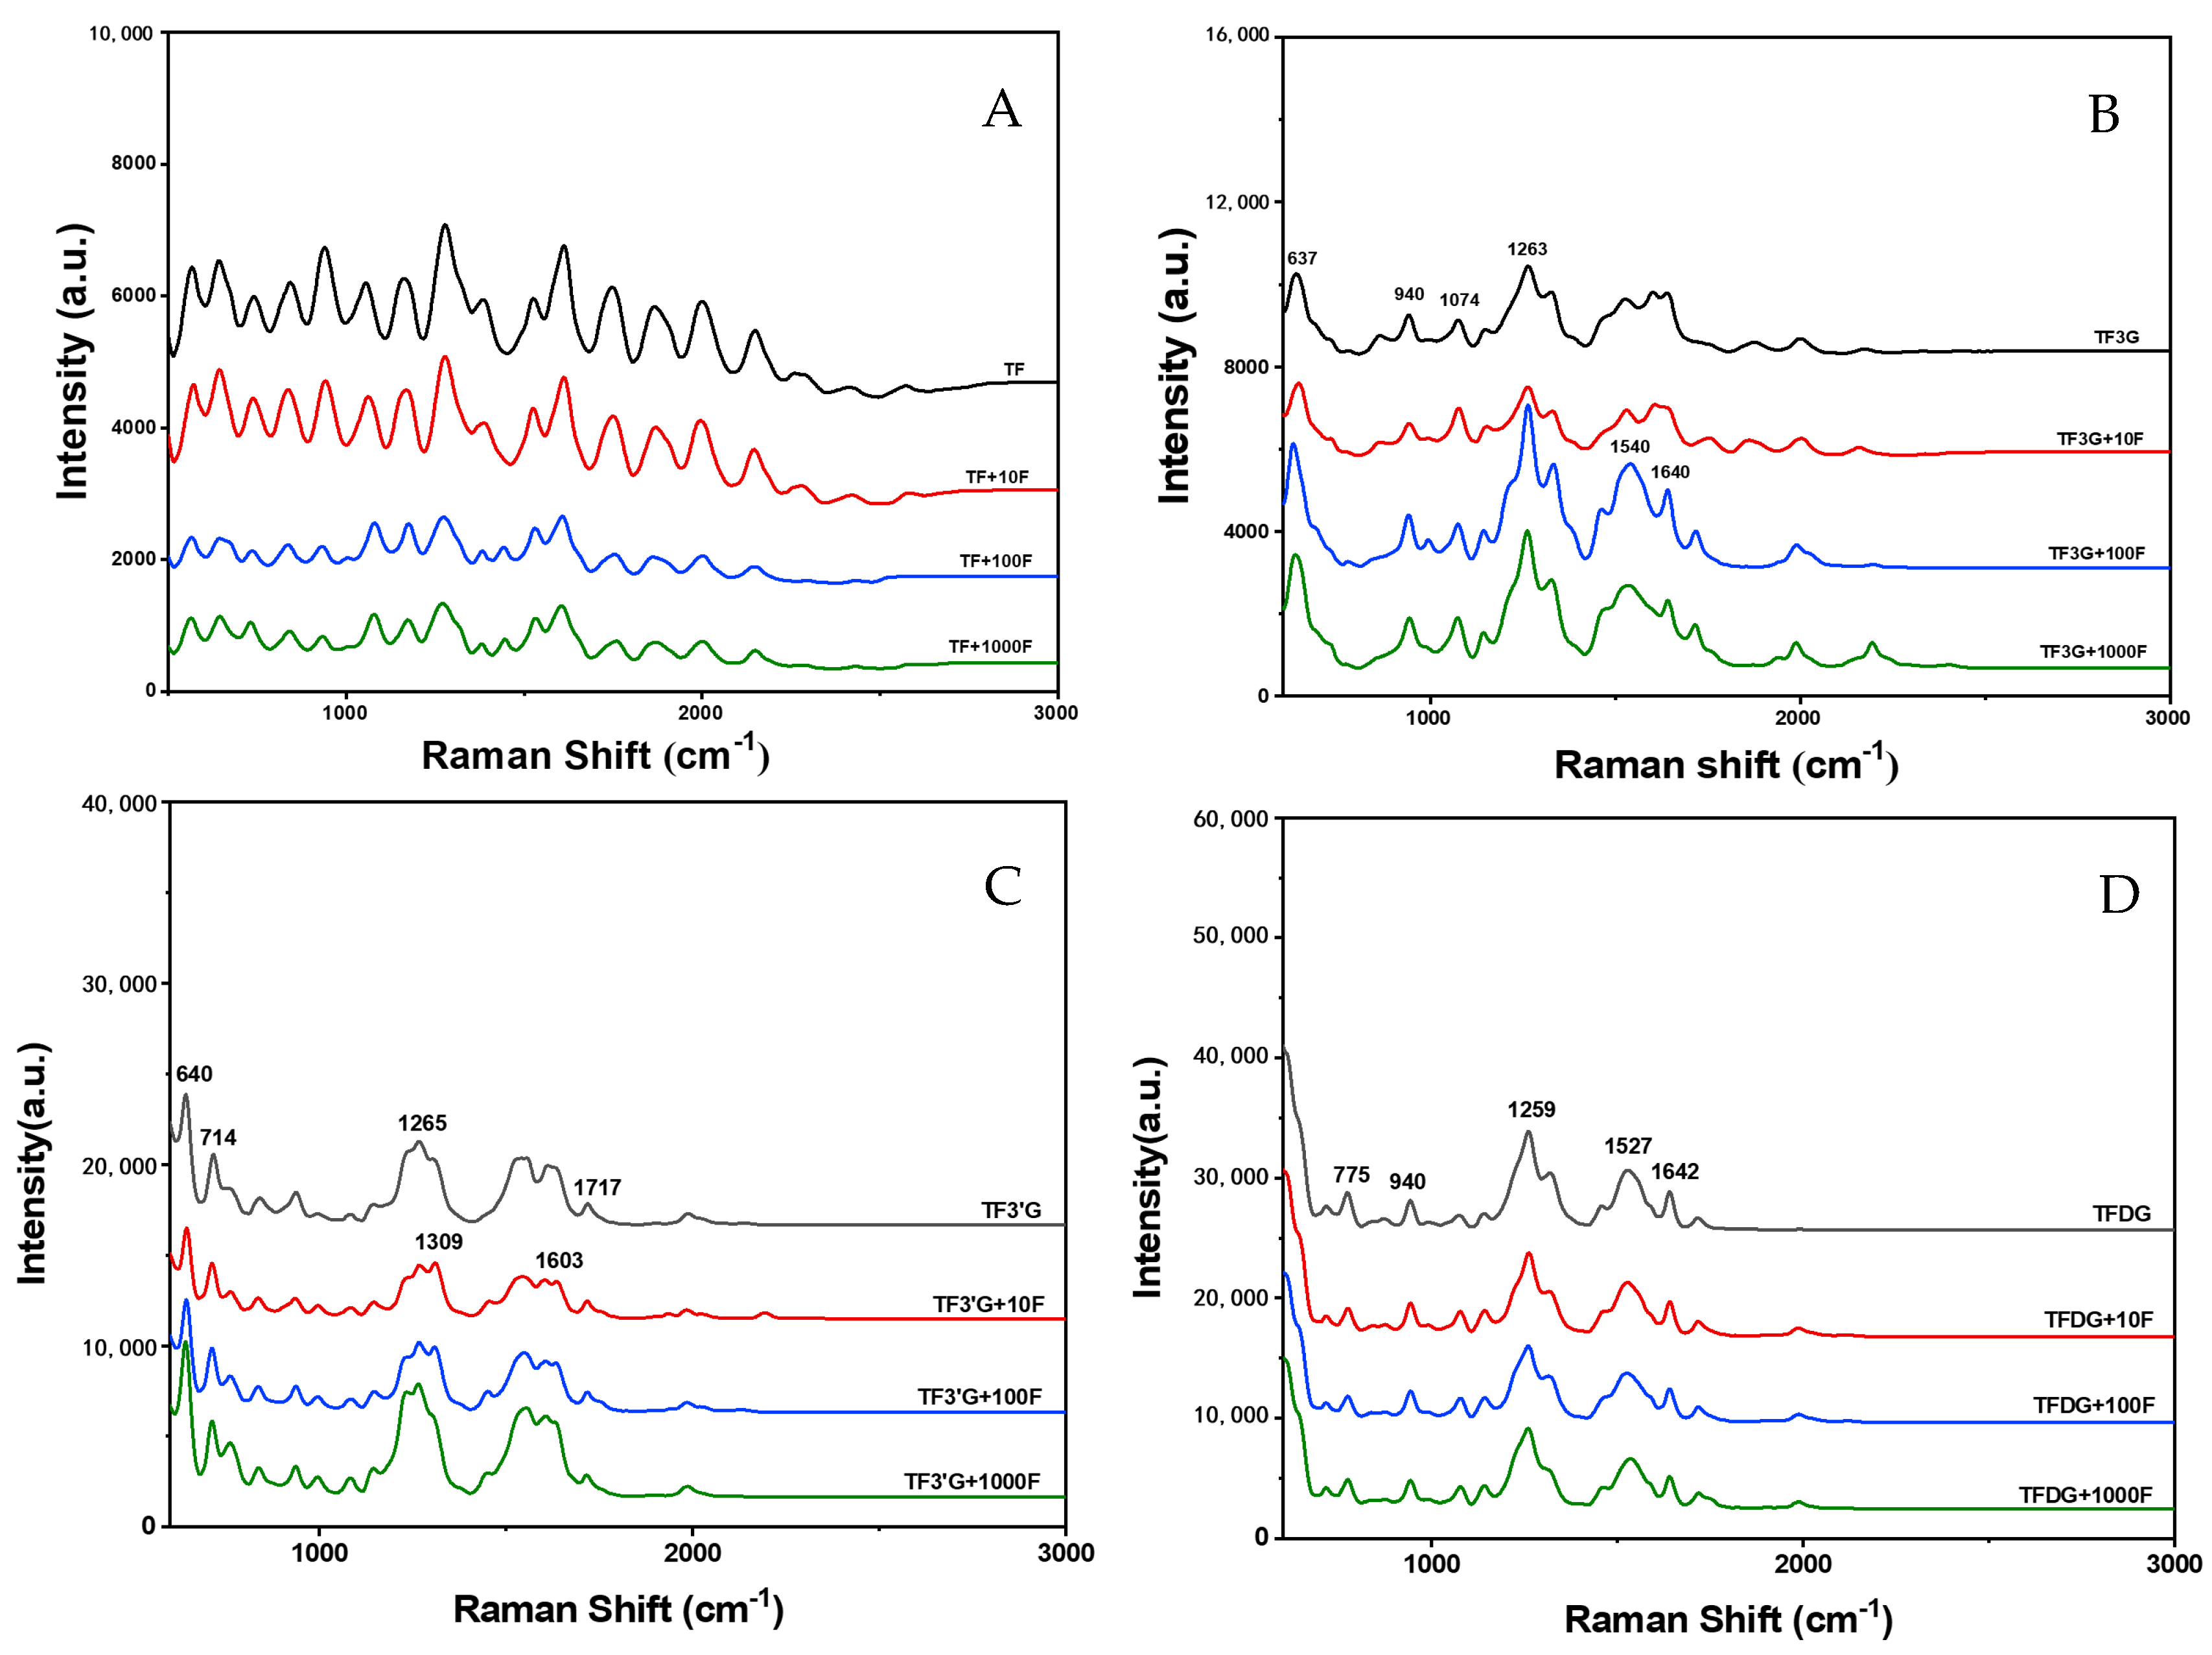
3.3. Interaction and Structural Characterization of TFs and F−
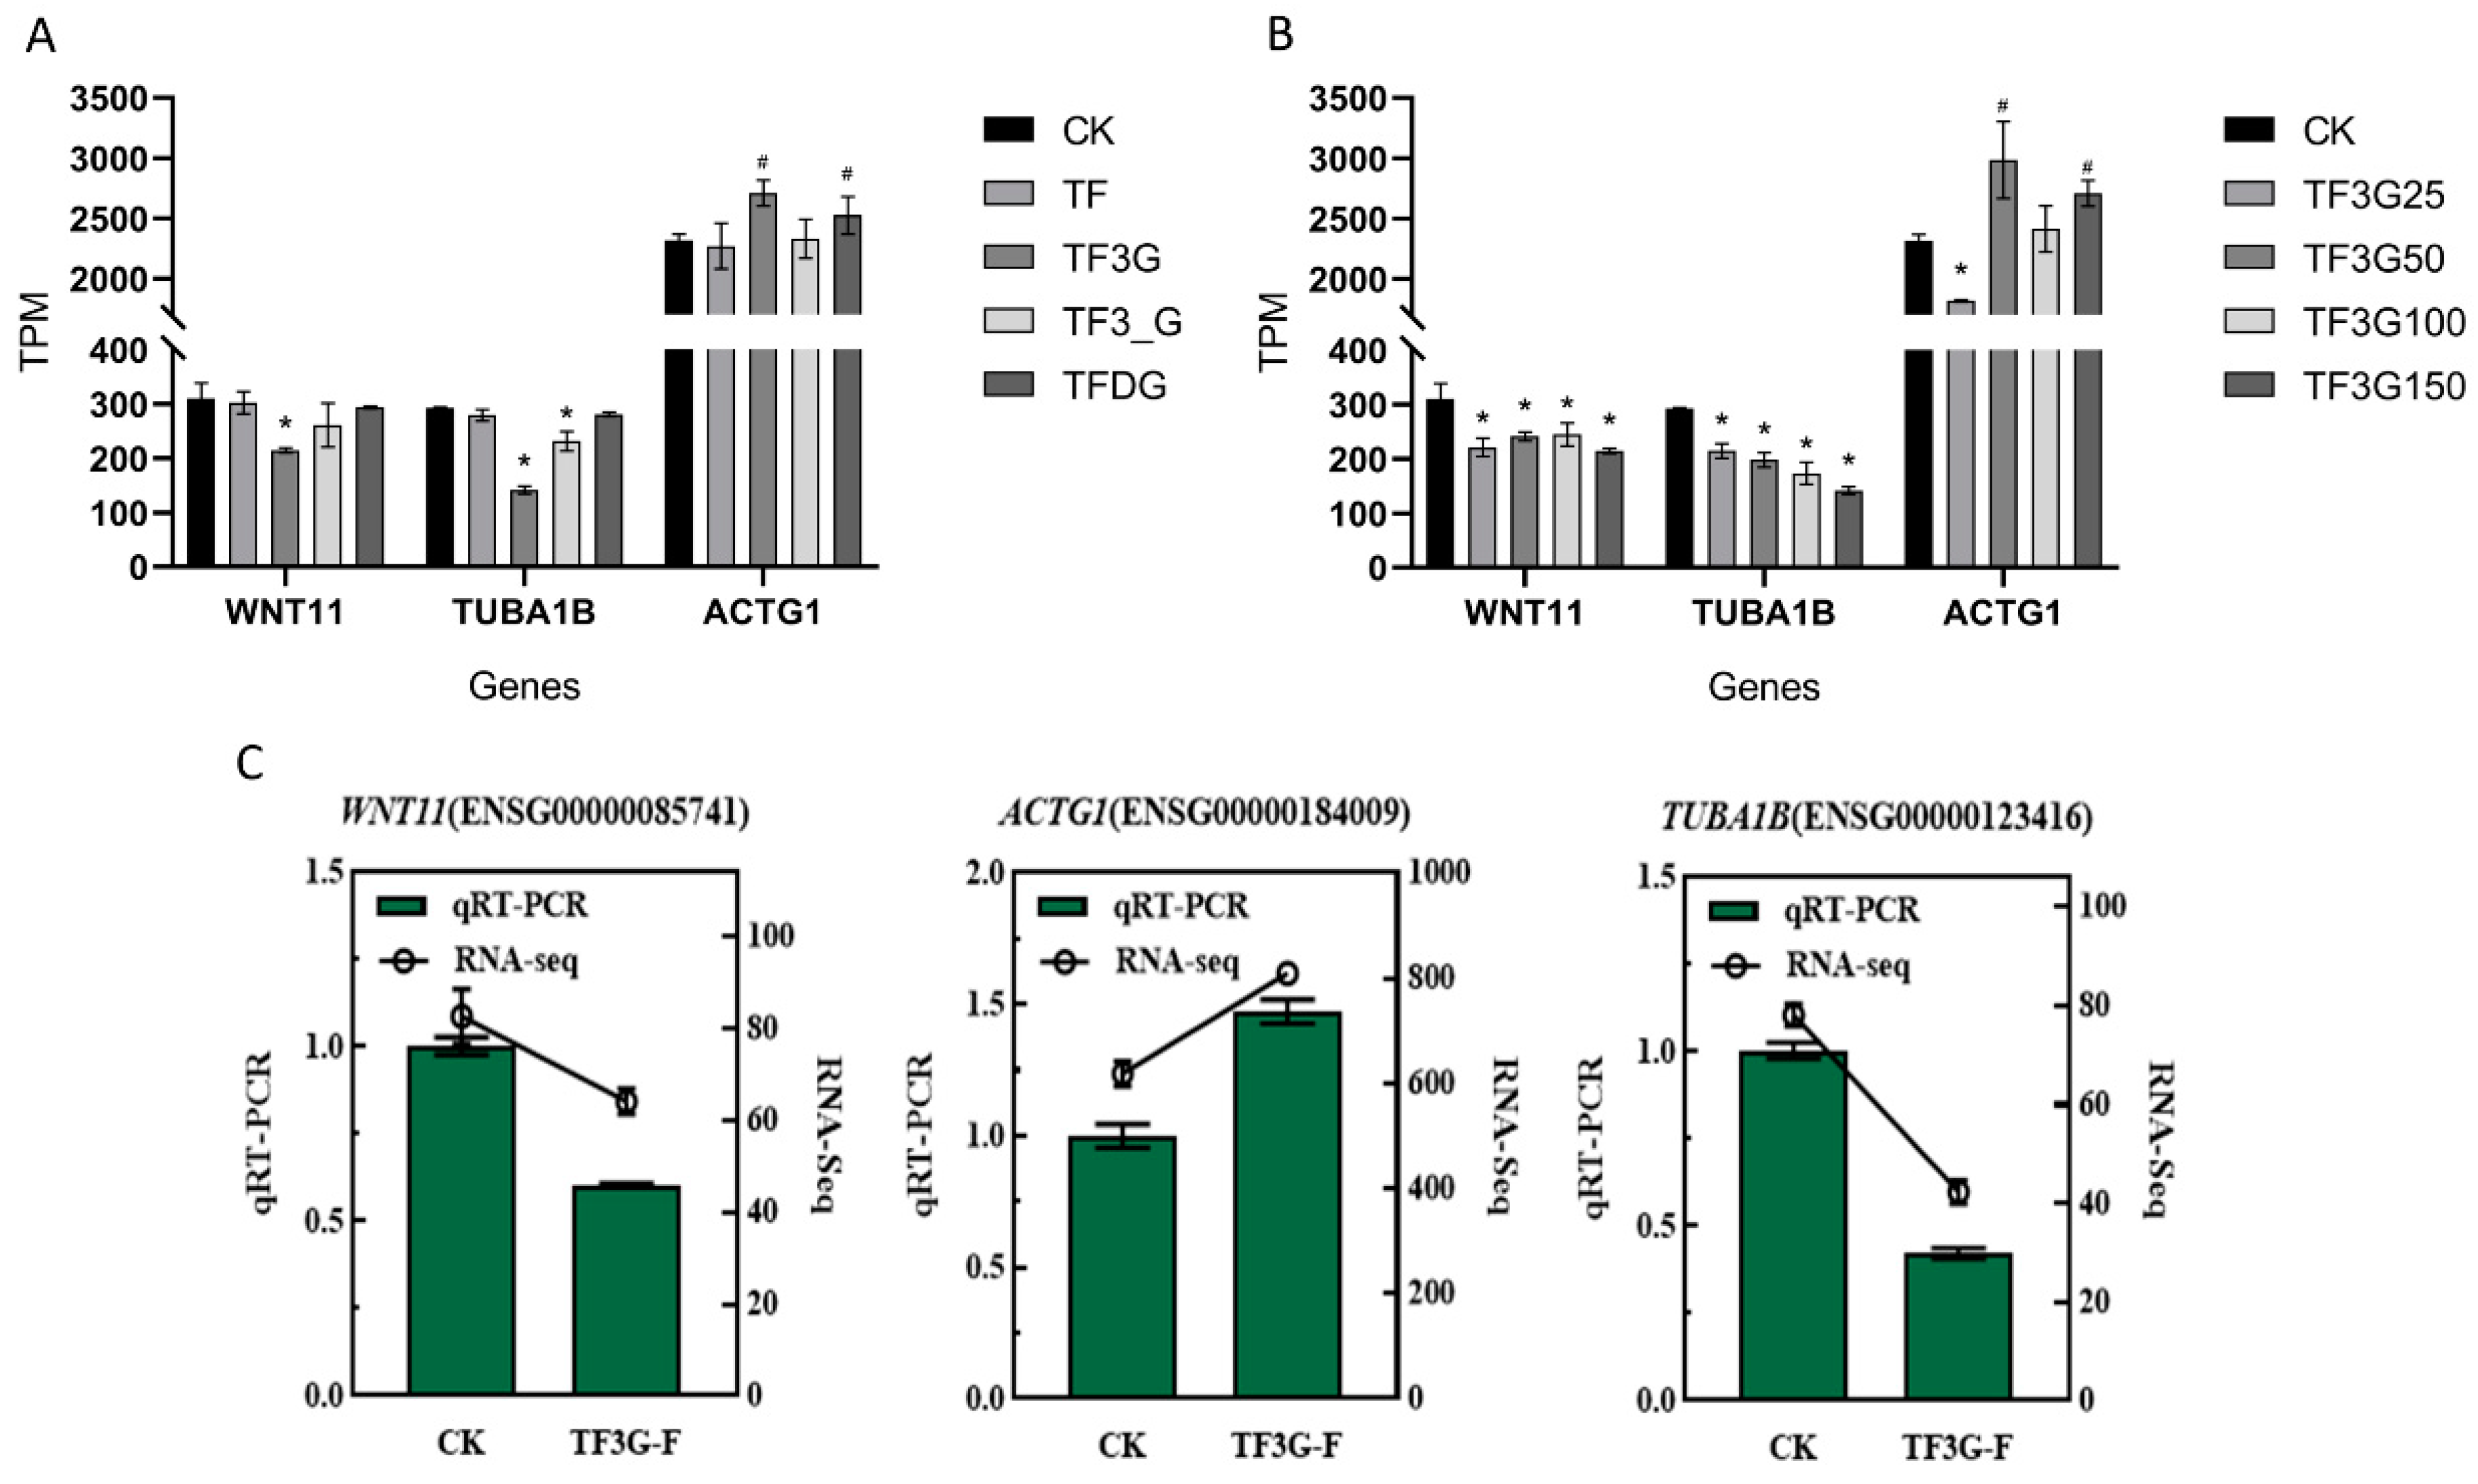
3.4. TFs Mediate F− Absorption and Transport by Regulating the Expression of Cell Monolayer Permeability-Related Genes
4. Discussion
Supplementary Materials
Author Contributions
Funding
Data Availability Statement
Acknowledgments
Conflicts of Interest
References
- Gazzano, E.; Bergandi, L.; Riganti, C.; Aldieri, E.; Doublier, S.; Costamagna, C.; Bosia, A.; Ghigo, D. Fluoride effects: The two faces of janus. Curr. Med. Chem. 2010, 17, 2431–2441. [Google Scholar] [CrossRef] [PubMed]
- Bergman, C.; Gray-Scott, D.; Chen, J.J.; Meacham, S. What is next for the Dietary Reference Intakes for bone metabolism related nutrients beyond calcium: Phosphorus, magnesium, vitamin D, and fluoride? Crit. Rev. Food Sci. Nutr. 2009, 49, 136–144. [Google Scholar] [CrossRef] [PubMed]
- Das, S.; de Oliveira, L.M.; Da, S.E.; Liu, Y.; Ma, L.Q. Fluoride concentrations in traditional and herbal teas: Health risk assessment. Environ. Pollut. 2017, 231, 779–784. [Google Scholar] [CrossRef] [PubMed]
- Zhang, R.; Zhang, H.; Chen, Q.; Luo, J.; Chai, Z.; Shen, J. Composition, distribution and risk of total fluorine, extractable organofluorine, and perfluorinated compounds in Chinese teas. Food Chem. 2017, 219, 496–502. [Google Scholar] [CrossRef]
- Dan, S.; Haojie, Z.; Xiaoju, W.; Wei, Z.; Zhi, Y.; Dejiang, N.; Yuqiong, C. Study on Bioavailability of Fluorine in Different Extracts of A Dark Tea. J. Tea Sci. 2021, 41, 843–853. [Google Scholar]
- Zhang, H.; Fan, Y.; Wen, X.; Ni, D.; Chen, Y. Absorption and Transport of Fluorine from Different Teas in a Caco-2 Cell Model. Fluoride 2021, 54, 219–240. [Google Scholar]
- He, H. Research progress on theaflavins: Efficacy, formation, and preparation. Food Nutr. Res. 2017, 61, 1344521–1344529. [Google Scholar] [CrossRef] [Green Version]
- Abudureheman, B.; Yu, X.; Fang, D.; Zhang, H. Enzymatic Oxidation of Tea Catechins and Its Mechanism. Molecules 2022, 27, 942. [Google Scholar] [CrossRef] [PubMed]
- Yang, Z.; Jie, G.; Dong, F.; Xu, Y.; Watanabe, N.; Tu, Y. Radical-scavenging abilities and antioxidant properties of theaflavins and their gallate esters in H2O2-mediated oxidative damage system in the HPF-1 cells. Toxicol. In Vitro 2008, 22, 1250–1256. [Google Scholar] [CrossRef]
- Koariková, K.; Jezovicová, M.; Kerestes, J.; Gbelcová, H.; Uracková, Z.; Itanová, I. Anticancer effect of black tea extract in human cancer cell lines. SpringerPlus 2015, 4, 127. [Google Scholar] [CrossRef] [Green Version]
- Wu, H.; Li, Q.; Zhou, X.; Kolosov, V.P.; Perelman, J.M. Theaflavins extracted from black tea inhibit airway mucous hypersecretion induced by cigarette smoke in rats. Inflammation 2012, 35, 271–279. [Google Scholar] [CrossRef]
- Sang, S.; Lambert, J.D.; Tian, S.; Hong, J.; Hou, Z.; Ryu, J.H.; Stark, R.E.; Rosen, R.T.; Huang, M.T.; Yang, C.S.; et al. Enzymatic synthesis of tea theaflavin derivatives and their anti-inflammatory and cytotoxic activities. Bioorg. Med. Chem. 2004, 12, 459–467. [Google Scholar] [CrossRef] [PubMed]
- Zu, M.; Yang, F.; Zhou, W.; Liu, A.; Du, G.; Zheng, L. In vitro anti-influenza virus and anti-inflammatory activities of theaflavin derivatives. Antivir. Res. 2012, 94, 217–224. [Google Scholar] [CrossRef] [PubMed]
- Sirotkin, A.V.; Kolesarova, A. The anti-obesity and health-promoting effects of tea and coffee. Physiol. Res. 2021, 70, 161–168. [Google Scholar] [CrossRef] [PubMed]
- Park, H.Y.; Kunitake, Y.; Hirasaki, N.; Tanaka, M.; Matsui, T. Theaflavins enhance intestinal barrier of Caco-2 Cell monolayers through the expression of AMP-activated protein kinase-mediated Occludin, Claudin-1, and ZO-1. Biosci. Biotechnol. Biochem. 2015, 79, 130–137. [Google Scholar] [CrossRef] [PubMed] [Green Version]
- Zucco, F.; Batto, A.F.; Bises, G.; Chambaz, J.; Chiusolo, A.; Consalvo, R.; Cross, H.; Dal Negro, G.; de Angelis, I.; Fabre, G.; et al. An inter-laboratory study to evaluate the effects of medium composition on the differentiation and barrier function of Caco-2 cell lines. Altern. Lab. Anim. 2005, 33, 603–618. [Google Scholar] [CrossRef]
- Sun, H.; Chow, E.C.; Liu, S.; Du, Y.; Pang, K.S. The Caco-2 cell monolayer: Usefulness and limitations. Expert Opin. Drug Metab. Toxicol. 2008, 4, 395–411. [Google Scholar] [CrossRef]
- Zhu, B.; Kan, H.; Liu, J.; Liu, H.; Wei, Q.; Du, B. A highly selective ratiometric visual and red-emitting fluorescent dual-channel probe for imaging fluoride anions in living cells. Biosens. Bioelectron. 2014, 52, 298–303. [Google Scholar] [CrossRef]
- Yang, C.Y.; Dantzig, A.H.; Pidgeon, C. Intestinal peptide transport systems and oral drug availability. Pharm. Res. 1999, 16, 1331–1343. [Google Scholar] [CrossRef]
- Sugano, K.; Kansy, M.; Artursson, P.; Avdeef, A.; Bendels, S.; Di, L.; Ecker, G.F.; Faller, B.; Fischer, H.; Gerebtzoff, G.; et al. Coexistence of passive and carrier-mediated processes in drug transport. Nat. Rev. Drug Discov. 2010, 9, 597–614. [Google Scholar] [CrossRef]
- Volpe, D.A. Advances in cell-based permeability assays to screen drugs for intestinal absorption. Expert Opin. Drug Dis. 2020, 15, 539–549. [Google Scholar] [CrossRef] [PubMed]
- Qu, F.; Ai, Z.; Liu, S.; Zhang, H.; Chen, Y.; Wang, Y.; Ni, D. Study on mechanism of low bioavailability of black tea theaflavins by using Caco-2 cell monolayer. Drug Deliv. 2021, 28, 1737–1747. [Google Scholar] [CrossRef] [PubMed]
- Ouko, L.; Ziegler, T.R.; Gu, L.H.; Eisenberg, L.M.; Yang, V.W. Wnt11 signaling promotes proliferation, transformation, and migration of IEC6 intestinal epithelial cells. J. Biol. Chem. 2004, 279, 26707–26715. [Google Scholar] [CrossRef] [PubMed] [Green Version]
- Ivanov, A.I.; Hunt, D.; Utech, M.; Nusrat, A.; Parkos, C.A. Differential roles for actin polymerization and a myosin II motor in assembly of the epithelial apical junctional complex. Mol. Biol. Cell 2005, 16, 2636–2650. [Google Scholar] [CrossRef] [PubMed] [Green Version]


| Time/h | 0.5 | 1 | 2 | 3 | 4 | ||||||||||
|---|---|---|---|---|---|---|---|---|---|---|---|---|---|---|---|
| Papp (×10−6 cm/s) | P-Ratio | Papp (×10−6 cm/s) | P-Ratio | Papp (×10−6 cm/s) | P-Ratio | Papp (×10−6 cm/s) | P-Ratio | Papp (×10−6 cm/s) | P-Ratio | ||||||
| AP-BL | BL-AP | AP-BL | BL-AP | AP-BL | BL-AP | AP-BL | BL-AP | AP-BL | BL-AP | ||||||
| F(CK) | 27.64 ± 1.95 e | 29.59 ± 2.09 d | 1.07 ± 0.01 b | 26.02 ± 1.96 b | 31.71 ± 1.60 b | 1.22 ± 0.03 c | 30.85 ± 1.15 a | 31.0 ± 0.60 a | 1.01 ± 0.02 b | 23.59 ± 0.56 a | 26.05 ± 0.38 a | 1.11 ± 0.02 b | 18.07 ± 0.83 a | 20.59 ± 0.82 a | 1.14 ± 0.03 b |
| TF + F | 58.23 ± 2.08 a | 46.77 ± 5.09 b | 0.80 ± 0.06 c | 43.27 ± 2.54 a | 35.74 ± 2.57 ab | 0.83 ± 0.03 d | 23.39 ± 1.40 c | 24.22 ± 1.26 c | 1.04 ± 0.01 b | 21.52 ± 1.00 b | 23.60 ± 0.94 b | 1.10 ± 0.04 b | 16.11 ± 0.46 b | 18.13 ± 0.31 b | 1.13 ± 0.01 b |
| TF3G + F | 39.79 ± 5.43 c | 42.12 ± 0.50 bc | 1.07 ± 0.13 b | 23.51 ± 2.57 bc | 33.45 ± 5.92 ab | 1.56 ± 0.15 b | 20.31 ± 1.82 c | 28.04 ± 2.25 b | 1.39 ± 0.13 a | 18.12 ± 0.84 c | 20.76 ± 0.86 c | 1.15 ± 0.01 b | 13.89 ± 0.77 c | 17.35 ± 1.37 b | 1.25 ± 0.03 a |
| TF3′G + F | 36.76 ± 0.65 c | 49.62 ± 3.40 ab | 1.35 ± 0.07 a | 20.62 ± 1.08 c | 39.09 ± 3.01 a | 1.90 ± 0.05 a | 23.58 ± 1.46 c | 26.13 ± 1.25 b | 1.11 ± 0.02 b | 18.58 ± 0.82 c | 23.47 ± 0.91 b | 1.26 ± 0.02 a | 14.70 ± 0.06 c | 18.16 ± 1.25 b | 1.24 ± 0.08 a |
| TFDG + F | 48.86 ± 1.91 b | 54.18 ± 2.05 a | 1.11 ± 0.01 b | 44.31 ± 5.67 a | 32.63 ± 4.86 b | 0.74 ± 0.01 d | 27.03 ± 2.55 b | 27.45 ± 0.74 b | 1.02 ± 0.07 b | 21.06 ± 0.59 b | 22.98 ± 1.11 b | 1.09 ± 0.02 b | 17.11 ± 0.81 ab | 17.52 ± 1.06 b | 1.02 ± 0.03 c |
| Concentration (μg/mL) | 25 | 50 | 100 | 150 | ||||||||
|---|---|---|---|---|---|---|---|---|---|---|---|---|
| Papp (×10−6 cm/s) | P-Ratio | Papp (×10−6 cm/s) | P-Ratio | Papp (×10−6 cm/s) | P-Ratio | Papp (×10−6 cm/s) | P-Ratio | |||||
| AP-BL | BL-AP | AP-BL | BL-AP | AP-BL | BL-AP | AP-BL | BL-AP | |||||
| F(CK) | 29.41 ± 0.65 b | 30.34 ± 0.59 a | 1.02 ± 0.01 a | 29.41 ± 0.65 a | 30.34 ± 0.59 ab | 1.02 ± 0.01 a | 29.41 ± 0.65 a | 30.34 ± 0.59 a | 1.02 ± 0.01 ab | 29.41 ± 0.65 a | 30.34 ± 0.59 a | 1.02 ± 0.01 b |
| TF + F | 31.71 ± 0.65 ab | 28.08 ± 4.32 ab | 0.88 ± 0.12 b | 29.18 ± 0.65 ab | 26.78 ± 0.63 cd | 0.93 ± 0.01 a | 26.94 ± 0.85 a | 26.66 ± 1.63 bc | 0.99 ± 0.03 b | 22.72 ± 1.37 c | 23.68 ± 1.24 c | 1.04 ± 0.01 b |
| TF3G + F | 28.43 ± 0.71 bc | 26.27 ± 0.22 b | 0.91 ± 0.00 b | 26.87 ± 1.35 b | 24.13 ± 1.43 de | 0.92 ± 0.03 a | 26.81 ± 1.25 a | 28.10 ± 1.02 ab | 1.08 ± 0.01 a | 19.71 ± 1.78 c | 27.44 ± 2.22 b | 1.40 ± 0.13 a |
| TF3′G + F | 28.89 ± 0.08 c | 25.99 ± 1.94 b | 0.93 ± 0.04 ab | 25.94 ± 1.43 b | 21.82 ± 0.54 e | 0.86 ± 0.02 a | 25.82 ± 0.28 b | 24.67 ± 1.38 c | 0.96 ± 0.04 b | 22.90 ± 1.42 c | 25.55 ± 1.23 bc | 1.12 ± 0.02 b |
| TFDG + F | 32.67 ± 1.55 a | 30.10 ± 0.01 a | 0.92 ± 0.04 b | 30.51 ± 3.48 a | 30.17 ± 1.09 bc | 0.99 ± 0.08 a | 26.64 ± 4.07 a | 28.04 ± 0.78 bc | 0.94 ± 0.07 b | 26.27 ± 2.49 b | 26.85 ± 0.72 b | 1.03 ± 0.07 b |
| F− Concentration (μg/mL) | 0.2 | 1 | 2 | 5 | ||||||||
|---|---|---|---|---|---|---|---|---|---|---|---|---|
| Papp (×10−6 cm/s) | P-Ratio | Papp (×10−6 cm/s) | P-Ratio | Papp (×10−6 cm/s) | P-Ratio | Papp (×10−6 cm/s) | P-Ratio | |||||
| AP-BL | BL-AP | AP-BL | BL-AP | AP-BL | BL-AP | AP-BL | BL-AP | |||||
| F(CK) | 23.26 ± 2.33 a | 11.22 ± 0.75 a | 0.53 ± 0.03 c | 11.90 ± 0.07 a | 12.05 ± 0.78 a | 1.01 ± 0.02 c | 10.52 ± 1.50 a | 14.61 ± 1.57 a | 1.29 ± 0.14 b | 29.41 ± 0.65 a | 30.34 ± 0.59 a | 1.02 ± 0.01 b |
| TF + F | 18.36 ± 1.22 b | 11.29 ± 0.84 a | 0.62 ± 0.01 ab | 8.05 ± 0.36 b | 10.35 ± 0.31 b | 1.29 ± 0.02 a | 7.88 ± 1.03 b | 10.70 ± 0.30 b | 1.37 ± 0.16 b | 22.72 ± 1.37 c | 23.68 ± 1.24 c | 1.04 ± 0.01 b |
| TF3G + F | 17.22 ± 1.56 bc | 10.70 ± 0.07 ab | 0.62 ± 0.05 a | 9.01 ± 0.58 b | 10.39 ± 0.73 b | 1.15 ± 0.01 b | 8.13 ± 0.38 b | 13.40 ± 0.69 a | 1.65 ± 0.03 a | 19.71 ± 1.78 c | 27.44 ± 2.22 B | 1.40 ± 0.13 a |
| TF3′G + F | 14.37 ± 0.96 c | 8.06 ± 0.28 b | 0.56 ± 0.02 bc | 5.92 ± 0.61 c | 7.28 ± 0.47 c | 1.23 ± 0.08 a | 6.82 ± 0.09 bc | 7.55 ± 0.58 c | 1.11 ± 0.08 c | 22.90 ± 1.42 c | 25.55 ± 1.23 bc | 1.12 ± 0.02 b |
| TFDG + F | 14.18 ± 0.83 c | 7.63 ± 0.08 b | 0.54 ± 0.03 c | 6.70 ± 0.28 c | 7.22 ± 0.34 c | 1.08 ± 0.01 c | 5.62 ± 0.43 c | 8.29 ± 0.23 c | 1.48 ± 0.07 ab | 26.27 ± 2.49 b | 26.85 ± 0.72 b | 1.03 ± 0.07 b |
| F−-TF | F−-TF3G | F−-TF3′G | F−-TFDG | |
|---|---|---|---|---|
| Ka (1/M) | 2.014 × 10² | 1.854 × 10³ | 3.262 × 101 | 1.732 × 10³ |
| ΔH (kJ/mol) | 266.3 | −5.251 | 102.5 | 13.44 |
| n | 0.023 | 0.744 | 0.866 | 0.645 |
| Kd (M) | 4.965 × 10⁻³ | 5.395 × 10⁻⁴ | 3.066 × 10⁻² | 5.772 × 10⁻⁴ |
| ΔS (J/mol⋅K) | 937.3 | 44.95 | 372.7 | 107.1 |
| ΔG (kJ/mol) | −13.156 | −18.653 | −8.621 | −18.492 |
Disclaimer/Publisher’s Note: The statements, opinions and data contained in all publications are solely those of the individual author(s) and contributor(s) and not of MDPI and/or the editor(s). MDPI and/or the editor(s) disclaim responsibility for any injury to people or property resulting from any ideas, methods, instructions or products referred to in the content. |
© 2023 by the authors. Licensee MDPI, Basel, Switzerland. This article is an open access article distributed under the terms and conditions of the Creative Commons Attribution (CC BY) license (https://creativecommons.org/licenses/by/4.0/).
Share and Cite
Fan, Y.; Lei, Z.; Huang, J.; Su, D.; Ni, D.; Chen, Y. Effect and Mechanism of Theaflavins on Fluoride Transport and Absorption in Caco-2 Cells. Foods 2023, 12, 1487. https://doi.org/10.3390/foods12071487
Fan Y, Lei Z, Huang J, Su D, Ni D, Chen Y. Effect and Mechanism of Theaflavins on Fluoride Transport and Absorption in Caco-2 Cells. Foods. 2023; 12(7):1487. https://doi.org/10.3390/foods12071487
Chicago/Turabian StyleFan, Yueqin, Zhendong Lei, Jiasheng Huang, Dan Su, Dejiang Ni, and Yuqiong Chen. 2023. "Effect and Mechanism of Theaflavins on Fluoride Transport and Absorption in Caco-2 Cells" Foods 12, no. 7: 1487. https://doi.org/10.3390/foods12071487