
Evaluation of a Proteinase K-Based Extraction Method to Detect Hepatitis A Virus, Hepatitis E Virus and Norovirus in Artificially Contaminated Dairy Products
 ,
,
Abstract
:1. Introduction
2. Materials and Methods
2.1. Viruses
2.2. Inoculation of Dairy Products
2.3. Viral Detection
2.4. Limits of Detection Values
2.5. Statistical Analysis
3. Results
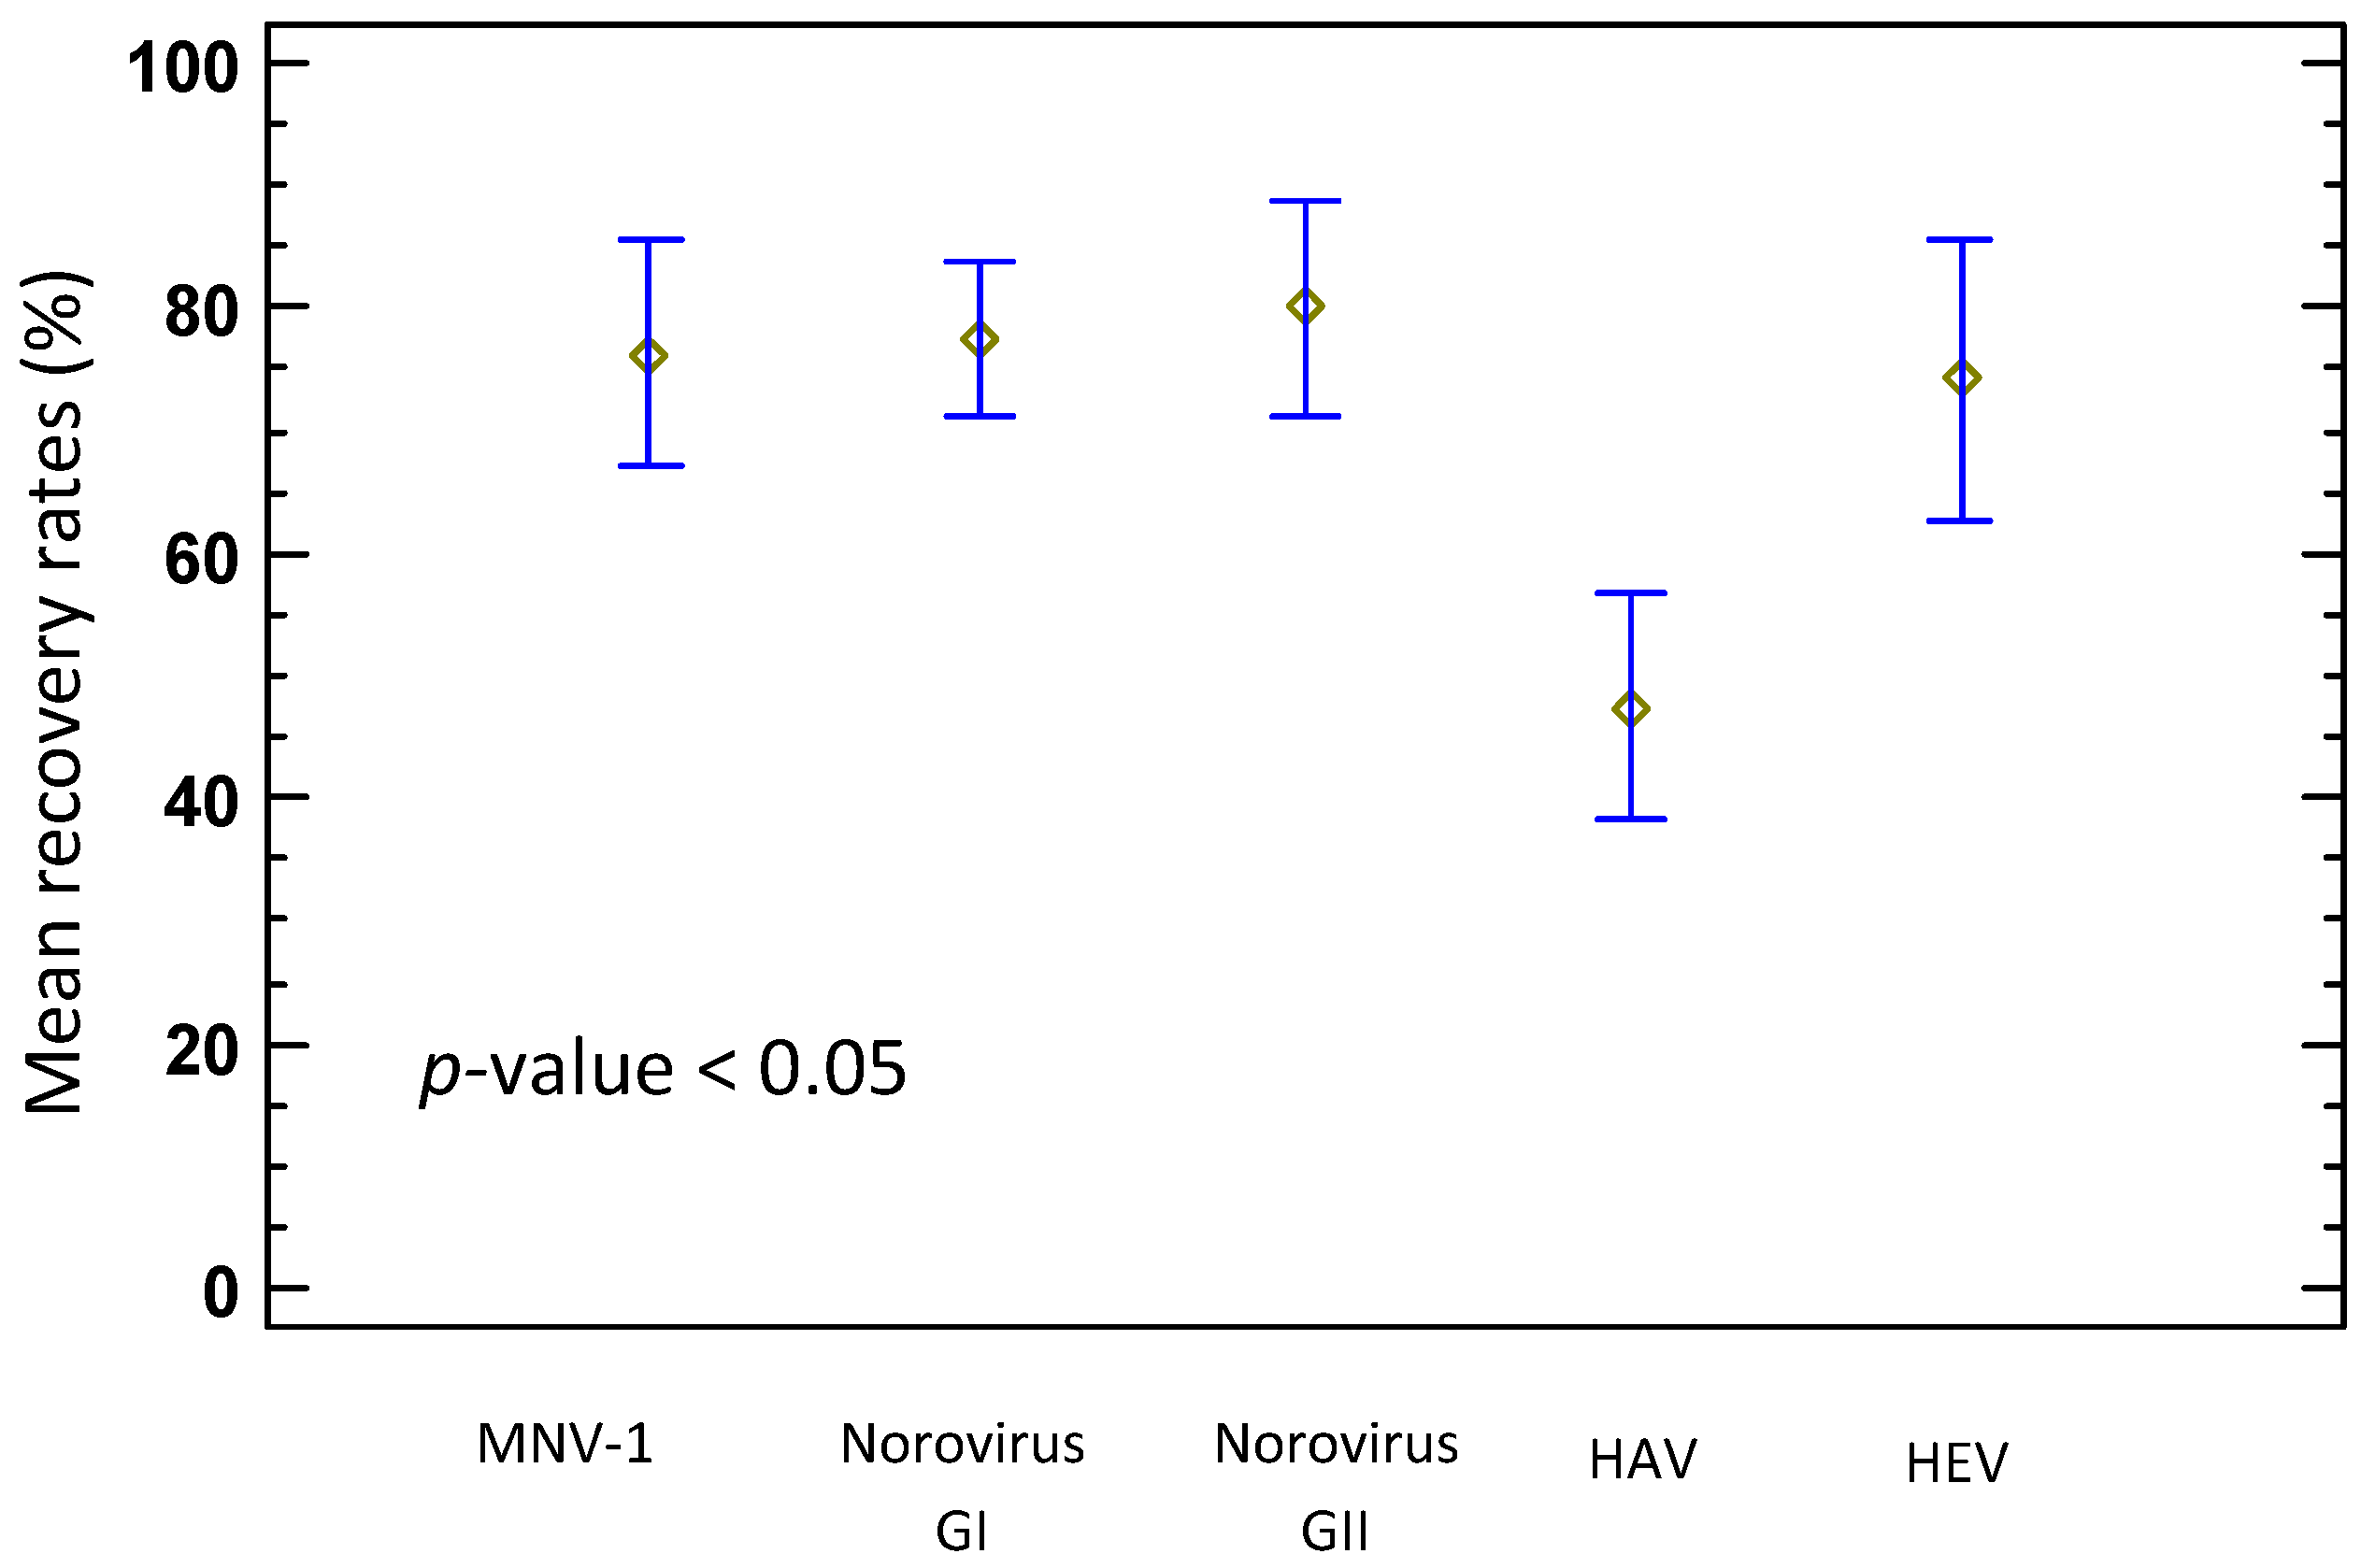
3.1. Mean Recoveries of HAV, HEV and Norovirus and Limits of Detection
3.2. MNV-1 and EAC Results
3.3. Experimental Factors on Virus Extraction Yield
4. Discussion
Author Contributions
Funding
Institutional Review Board Statement
Informed Consent Statement
Data Availability Statement
Acknowledgments
Conflicts of Interest
References
- EFSA. The European Union One Health 2019. Zoonoses Report. 2021. Available online: www.efsa.europa.eu/efsajournal (accessed on 27 February 2021).
- White, A.E.; Tillman, A.R.; Hedberg, C.; Bruce, B.B.; Batz, M.; Seys, S.A.; Dewey-Mattia, D.; Bazaco, M.C.; Walter, E.S. Foodborne illness outbreaks reported to National Surveillance, United States, 2009–2018. Emerg. Infect. Dis. 2022, 28, 1117–1127. [Google Scholar] [CrossRef]
- Colson, P.; Borentain, P.; Queyriaux, B.; Kaba, M.; Moal, V.; Gallian, P.; Heyries, L.; Raoult, D.; Gerolami, R. Pig liver sausage as a source of hepatitis E virus transmission to humans. J. Infect. Dis. 2010, 202, 825–834. [Google Scholar] [CrossRef] [Green Version]
- Grove, S.F.; Suriyanarayanan, A.; Puli, B.; Zhao, H.; Li, M.; Li, D.; Schaffner, D.W.; Lee, A. Norovirus cross-contamination during preparation of fresh produce. Int. J. Food Microbiol. 2015, 198, 43–49. [Google Scholar] [CrossRef]
- Matsuda, H.; Okada, K.; Takahashi, K.; Mishiro, S. Severe hepatitis E virus infection after ingestion of uncooked liver from a wild boar. J. Infect. Dis. 2003, 188, 944. [Google Scholar] [CrossRef] [Green Version]
- Somura, Y.; Nagano, M.; Kimoto, K.; Oda, M.; Mori, K.; Shinkai, T.; Sadamasu, K. Detection of norovirus in food samples collected during suspected food-handler-involved foodborne outbreaks in Tokyo. Lett. Appl. Microbiol. 2019, 69, 175–180. [Google Scholar] [CrossRef]
- Woods, J.W.; Calci, K.R.; Marchant-Tambone, J.G.; Burkhardt, W. Detection and molecular characterization of norovirus from oysters implicated in outbreaks in the US. Food Microbiol. 2016, 59, 76–84. [Google Scholar] [CrossRef]
- Patel, M.M.; Hall, A.J.; Vinje, J.; Parashar, U.D. Noroviruses: A comprehensive review. J. Clin. Virol. 2009, 44, 1–8. [Google Scholar] [CrossRef]
- Montagnaro, S.; De Martinis, C.; Sasso, S.; Ciarcia, R.; Damiano, S.; Auletta, L.; Iovane, V.; Zottola, T.; Pagnini, U. Viral and antibody prevalence of hepatitis E in European wild boars (Sus scrofa) and hunters at zoonotic risk in the Latium region. J. Comp. Pathol. 2015, 153, 1–8. [Google Scholar] [CrossRef]
- Fumian, T.M.; Ferreira, F.C.; de Andrade, J.D.S.R.; Canal, N.; Silva Gomes, G.; Teixeira, L.B.; Miagostovich, M.P. Norovirus foodborne outbreak associated with the consumption of ice pop; southern Brazil; 2020. Food Environ. Virol. 2021, 13, 553–559. [Google Scholar] [CrossRef]
- Le Guyader, F.S.; Krol, J.; Ambert-Balay, K.; Ruvoen-Clouet, N.; Desaubliaux, B.; Parnaudeau, S.; Le Saux, J.C.; Ponge, A.; Pothier, P.; Atmar, R.L.; et al. Comprehensive analysis of a norovirus-associated gastroenteritis outbreak, from the environment to the consumer. J. Clin. Microbiol. 2010, 48, 915–920. [Google Scholar] [CrossRef] [Green Version]
- Meghnath, K.; Hasselback, P.; McCormick, R.; Prystajecky, N.; Taylor, M.; McIntyre, L.; Man, S.; Whitfield, Y.; Warshawsky, B.; McKinley, M.; et al. Outbreaks of norovirus and acute gastroenteritis associated with British Columbia oysters; 2016–2017. Food Environ. Virol. 2019, 2, 138–148. [Google Scholar] [CrossRef]
- Nasheri, N.; Vester, A.; Petronella, N. Foodborne viral outbreaks associated with frozen produce. Epidemiol. Infect. 2019, 147, e291. [Google Scholar] [CrossRef] [Green Version]
- Walsh, K.A.; Bennett, S.D.; Mahovic, M.; Gould, L.H. Outbreaks associated with cantaloupe; watermelon; and honeydew in the United States; 1973–2011. Foodborne Pathog. Dis. 2014, 12, 45–52. [Google Scholar] [CrossRef] [Green Version]
- Hennechart-Collette, C.; Martin-Latil, S.; Fraisse, A.; Niveau, F.; Perelle, S. Virological analyses in collective catering outbreaks in France between 2012 and 2017. Food Microbiol. 2020, 91, 103546. [Google Scholar] [CrossRef]
- Murphy, W.J.; Petrie, L.M.; Work, S.D. Outbreak of infectious hepatitis, apparently milk-borne. Am. J. Public Health Nations Health 1946, 36, 169–173. [Google Scholar] [CrossRef]
- Raska, K.; Helcl, J.; Jezek, J.; Kubelka, Z.; Litov, M. A milk-borne infectious hepatitis epidemic. J. Hyg. Epidemiol. Microbiol. Immunol. 1966, 10, 413–428. [Google Scholar]
- Sun, Y.; Laird, D.T.; Shieh, Y.C. Temperature-dependent survival of hepatitis A virus during storage of contaminated onions. Appl. Environ. Microbiol. 2012, 78, 4976–4983. [Google Scholar] [CrossRef] [Green Version]
- Zaher, K.S.; Ahmed, W.M.; Syame, S.M.; El-Hewairy, H.M. Detection of health hazard-food borne viruses in animal products anticipated for human consumption. Glob. Vet. 2008, 2, 92–197. [Google Scholar]
- 2017 EN ISO 15216-1:2017; Microbiology of the Food Chain–Horizontal Method for Determination of Hepatitis a Virus and Norovirus Using Real-Time Rt-Pcr-Part1: Method for Quantification. International Organization for Standardization: Geneva, Switzerland, 2017.
- 2019 EN ISO 15216-2:2019; Microbiology of the Food Chain-Horizontal Method for Determination of Hepatitis a Virus and Norovirus Using Real-Time Rt-Pcr- Part2: Method for Detection. International Organization for Standardization: Geneva, Switzerland, 2019.
- Battistini, R.; Rossini, I.; Listorti, V.; Ercolini, C.; Maurella, C.; Serracca, L. HAV detection from milk-based products containing soft fruits: Comparison between four different extraction methods. Int. J. Food Microbiol. 2020, 328, 108661. [Google Scholar] [CrossRef]
- Dziedzinska, R.; Krzyzankova, M.; Bena, M.; Vasickova, P. Evidence of hepatitis E virus in goat and sheep milk. Viruses 2020, 12, 1429. [Google Scholar] [CrossRef]
- Hennechart-Collette, C.; Martin-Latil, S.; Fraisse, A.; Perelle, S. Comparison of three extraction methods to detect noroviruses in dairy products. Food Microbiol. 2017, 61, 113. [Google Scholar] [CrossRef] [PubMed]
- Sayed, I.M.; Elkhawaga, A.A.; El-Mokhtar, M.A. Circulation of hepatitis E virus (HEV) and/or HEV-like agent in non-mixed dairy farms could represent a potential source of infection for Egyptian people. Int. J. Food Microbiol. 2020, 16, 317. [Google Scholar] [CrossRef] [PubMed]
- Fumian, T.M.; Leite, J.P.; Marin, V.A.; Miagostovich, M.P. A rapid procedure for detecting noroviruses from cheese and fresh lettuce. J. Virol. Methods 2009, 155, 39–43. [Google Scholar] [CrossRef] [PubMed]
- Tung-Thompson, G.; Escudero-Abarca, B.I.; Outlaw, J.; Ganee, A.; Cassard, S.; Mabilat, C.; Jaykus, L.A. Evaluation of a surface sampling method for recovery of human noroviruses prior to detection using reverse transcription quantitative PCR. J. Food Prot. 2017, 80, 231–236. [Google Scholar] [CrossRef] [PubMed]
- Lee, K.B.; Lee, H.; Ha, S.D.; Cheon, D.S.; Choi, C. Comparative analysis of viral concentration methods for detecting the HAV genome using real-time RT-PCR amplification. Food Environ. Virol. 2012, 4, 68–72. [Google Scholar] [CrossRef]
- Maunula, L.; Kaupke, A.; Vasickova, P.; Soderberg, K.; Kozyra, I.; Lazic, S.; van der Poel, W.H.; Bouwknegt, M.; Rutjes, S.; Willems, K.A.; et al. Tracing enteric viruses in the European berry fruit supply chain. Int. J. Food Microbiol. 2013, 167, 177–185. [Google Scholar] [CrossRef]
- Suffredini, E.; Lanni, L.; Arcangeli, G.; Pepe, T.J.; Mazzette, R.; Ciccaglioni, G.; Croci, L. Qualitative and quantitative assessment of viral contamination in bivalve molluscs harvested in Italy. Int. J. Food Microbiol. 2014, 184, 21–26. [Google Scholar] [CrossRef]
- 2018: PR ISO/DIS 16140-4: 2018-01; Microbiology of the Food Chain-Method Validation-Part 4: Protocol for Single-Laboratory (In-House) Method Validation. International Organization for Standardization: Geneva, Switzerland, 2018.
- Hennechart-Collette, C.; Dehan, O.; Laurentie, M.; Fraisse, A.; Martin-Latil, S.; Perelle, S. Method for detecting norovirus, hepatitis A and hepatitis E viruses in tap and bottled drinking water. In.t J. Food Microbiol. 2022, 377, 109757. [Google Scholar] [CrossRef]
- Hennechart-Collette, C.; Dehan, O.; Laurentie, M.; Fraisse, A.; Martin-Latil, S.; Perelle, S. Detection of norovirus, hepatitis A and hepatitis E viruses in multicomponent foodstuffs. Int. J. Food Microbiol. 2021, 16, 337. [Google Scholar] [CrossRef]
- Wilrich, C.; Wilrich, P.T. Estimation of the POD function and the LOD of a qualitative microbiological measurement method. J. AOAC Int. 2009, 92, 1763–1772. [Google Scholar] [CrossRef] [Green Version]
- Van den Brom, R.; de Jong, A.; van Engelen, E.; Heuvelink, A.; Vellema, P. Zoonotic risks of pathogens from sheep and their milk borne transmission. Small Rumin. Res. 2020, 189, 106123. [Google Scholar] [CrossRef] [PubMed]
- Gould, L.H.; Mungai, E.; Behravesh, C.B. Outbreaks attributed to cheese: Differences between outbreaks caused by unpasteurized and pasteurized dairy products, United States, 1998–2011. Foodborne Pathog. Dis. 2014, 11, 545–551. [Google Scholar] [CrossRef] [PubMed]
- Bernard, H.; Faber, M.; Wilking, H.; Haller, S.; Hohle, M.; Schielke, A.; Ducomble, T.; Siffczyk, C.; Merbecks, S.S.; Fricke, G.; et al. Large multistate outbreak of norovirus gastroenteritis associated with frozen strawberries, Germany. Eurosurveillance 2014, 19, 20719–20727. [Google Scholar]
- Maunula, L.; Roivainen, M.; Keränen, M.; Mäkela, S.; Söderberg, K.; Summa, M.; von Bonsdorff, C.H.; Lappalainen, M.; Korhonen, T.; Kuusi, M.; et al. Detection of human norovirus from frozen raspberries in a cluster of gastroenteritis outbreaks. Eurosurveillance 2009, 14, 19435. [Google Scholar] [CrossRef]
- The Rapid Alert System for Food and Feed 2018 Annual Report. Available online: https://www.sirene-diffusion.fr/regia/000-rasff/00/2018-rasff_pub_annual-report.pdf (accessed on 16 September 2019).
- The Rapid Alert System for Food and Feed 2019 Annual Report. Available online: https://www.sirene-diffusion.fr/regia/000-rasff/00/2019-rasff_pub_annual-report.pdf (accessed on 9 October 2020).
- Sarvikivi, E.; Roivainen, M.; Maunula, L.; Niskanen, T.; Korhonen, T.; Lappalainen, M.; Kuusi, M. Multiple norovirus outbreaks linked to imported frozen raspberries. Epidemiol. Infect. 2012, 140, 260–267. [Google Scholar] [CrossRef] [Green Version]
- EFSA Panel on Biological Hazards (BIOHAZ); Ricci, A.; Allende, A.; Bolton, D.; Chemaly, M.; Davies, R.; Fernandez Escamez, P.S.; Herman, L.; Koutsoumanis, K.; Lindqvist, R.; et al. Scientific Opinion on the public health risks associated with hepatitis E virus (HEV) as a food-borne pathogen. EFSA 2017, 15, 4886–4889. [Google Scholar]
- Baechlein, C.; Becher, P. No evidence for zoonotic hepatitis E virus infection through dairy milk in Germany. Hepatology 2017, 65, 394–395. [Google Scholar] [CrossRef]
- Vercouter, A.S.; Sayed, I.M.; Lipkens, Z.; De Bleecker, K.; De Vliegher, S.; Colman, R.; Koppelman, M.; Supré, K.; Meuleman, P. Absence of zoonotic hepatitis E virus infection in Flemish dairy cows. Int. J. Food Microbiol. 2018, 81, 54–59. [Google Scholar] [CrossRef]
- Demirci, M.; Yiğin, A.; Ünlü, Ö.; Kılıç Altun, S. Detection of HEV RNA amounts and genotypes in raw milks obtained from different animals. Mikrobiyol. Bul. 2019, 53, 43–52. [Google Scholar] [CrossRef]
- El-Mokhtar, M.A.; Elkhawaga, A.A.; Sayed, I.M. Assessment of hepatitis E virus (HEV) in the edible goat products pointed out a risk for human infection in Upper Egypt. Int. J. Food Microbiol. 2020, 2, 330. [Google Scholar] [CrossRef]
- Geng, Y.; Zhao, C.; Huang, W.; Wang, X.; Xu, Y.; Wu, D.; Du, Y.; Liu, H.; Wang, Y. Hepatitis E virus was not detected in feces and milk of cows in Hebei province of China: No evidence for HEV prevalence in cows. Int. J. Food Microbiol. 2019, 291, 5–9. [Google Scholar] [CrossRef] [PubMed]
- Lee, G.H.; Tan, B.H.; Teo, E.C.; Lim, S.G.; Dan, Y.Y.; Wee, A.; Aw, P.P.; Zhu, Y.; Hibberd, M.L.; Tan, C.K.; et al. Chronic infection with camelid hepatitis E virus in a liver transplant recipient who regularly consumes camel meat and milk. Gastroenterology 2016, 150, 355–357. [Google Scholar] [CrossRef] [PubMed] [Green Version]
- Long, F.; Yu, W.; Yang, C.; Wang, J.; Li, Y.; Li, Y.; Huang, F. High prevalence of hepatitis E virus infection in goats. J. Med. Virol. 2017, 89, 1981–1987. [Google Scholar] [CrossRef] [PubMed]
- Huang, F.; Li, Y.; Yu, W.; Jing, S.; Wang, J.; Long, F.; He, Z.; Yang, C.; Bi, Y.; Cao, W.; et al. Excretion of infectious hepatitis E virus into milk in cows imposes high risks of zoonosis. Hepatology 2016, 64, 350–359. [Google Scholar] [CrossRef] [Green Version]
- Santos-Silva, S.; Gonçalves, H.M.R.; Rivero-Juarez, A.; Van der Poel, W.H.M.; Nascimento, M.S.J.; Mesquita, J.R. Detection of hepatitis E virus in milk: Current evidence for viral excretion in a wide range of mammalian hosts. Transbound Emerg. Dis. 2022, 69, 3173–3180. [Google Scholar] [CrossRef]
- Müller, I.; Althof, N.; Hoffmann, B.; Klaus, C.; Schilling-Loeffler, K.; Falkenhagen, A.; Johne, R. Comparison of Extraction Methods for the Detection of Tick-Borne Encephalitis Virus RNA in Goat Raw Milk and Cream Cheese. Food Environ. Virol. 2023, 1, 32–42. [Google Scholar] [CrossRef] [PubMed]
- Mormann, S.; Dabisch, M.; Becker, B. Effects of technological processes on the tenacity and inactivation of norovirus genogroup II in experimentally contaminated foods. Appl. Environ. Microbiol. 2010, 76, 536–545. [Google Scholar] [CrossRef] [Green Version]
- Fraisse, A.; Coudray-Meunier, C.; Martin-Latil, S.; Hennechart-Collette, C.; Delannoy, S.; Fach, P.; Perelle, S. Digital RT-PCR method for hepatitis A virus and norovirus quantification in soft berries. Int. J. Food Microbiol. 2017, 21, 36–45. [Google Scholar] [CrossRef]
- da Silva Luz, I.; Miagostovich, M.P. Comparison of viral elution-concentration methods for recovering noroviruses from deli meats. J. Virol. Methods 2018, 260, 49–55. [Google Scholar] [CrossRef]
- Scherer, K.; Johne, R.; Schrader, C.; Ellerbroek, L.; Jörg Schulenburg, J.; Klein, G. Comparison of two extraction methods for viruses in food and application in a norovirus gastroenteritis outbreak. J. Virol. Methods 2010, 169, 22–27. [Google Scholar] [CrossRef]
- Sayed, I.M.; Hammam, A.R.A.; Elfaruk, M.S.; Alsaleem, K.; Gaber, M.A.; Ezzat, A.A.; Salama, E.H.; Elkhawaga, A.A.; El-Mokhtar, M.A. Enhancement of the Molecular and Serological Assessment of Hepatitis E Virus in Milk Samples. Microorganisms 2020, 8, 1231. [Google Scholar] [CrossRef] [PubMed]
- Blaise-Boisseau, S.; Hennechart-Collette, C.; Guillier, L.; Perelle, S. Duplex real-time qRT-PCR for the detection of hepatitis A virus in water and raspberries using the MS2 bacteriophage as a process control. J. Virol. Methods 2010, 166, 48–53. [Google Scholar] [CrossRef] [PubMed]
- Yavarmanesh, M.; Abbaszadegan, M.; Alum, A.; Mortazavi, A.; Habibi Najafi, M.B.; Bassami, M.R.; Nassiri, M.R. Impact of milk components on recovery of viral RNA From MS2 bacteriophage. Food Environ. Virol. 2013, 5, 103–109. [Google Scholar] [CrossRef] [PubMed]
- Yavarmanesh, M.; Abbaszadegan, M.; Mortazavi, A.; Najafi, M.B.; Bassami, M.R.; Nassiri, M.R. Impact of milk components in recovery of the MS2 bacteriophage as an indicator of enteric viruses. J. Virol. Methods. 2010, 168, 103–107. [Google Scholar] [CrossRef] [PubMed]


| Forms of Dairy Products | Types of Dairy Products |
|---|---|
| Cheese | Goat’s cheese |
| Sheep’s cheese | |
| Camembert Raclette | |
| Emmental | |
| Cheddar Mozzarella Feta | |
| Milk | Pasteurised whole cow’s milk |
| Semi-skimmed cow’s milk Pasteurised goat’s milk | |
| Yoghurt and dessert cream | Vanilla dessert cream Raspberry pulp stirred yoghurt |
| Raspberry-flavoured yoghurt drink Raspberry-flavoured yoghurt Cottage cheese with fruit |
| Experiment Set | |||||
|---|---|---|---|---|---|
| Virus inoculum levels | R1 | R2 | R3 | R4 | |
| High | Pasteurised whole cow’s milk | Semi-skimmed cow’s milk | Cheddar cheese | Raspberry-flavoured yoghurt drink | |
| Medium | Goat’s cheese | Camembert | Pasteurised goat’s milk | Emmental cheese | |
| Low | Vanilla dessert cream | Raspberry yoghurt (blended) | Mozzarella cheese | Raspberry-flavoured yoghurt | |
| Very low | Sheep’s cheese | Feta | Cottage cheese with fruit | Raclette cheese | |
| Virus | Inoculum Level (Number of Genome Copies) | RNA Extract | Experiment Set R1 (%±SD) | (F) | Experiment Set R2 (%±SD) | (F) | Experiment Set R3 (%±SD) | (F) | Experiment Set R4 (%±SD) | (F) |
|---|---|---|---|---|---|---|---|---|---|---|
| HAV | 1.1 × 10⁵ | Pure | 36.95 ± 0.40 (2/2) | 1.63 | 33.09 ± 0.70 (2/2) | 1.35 | 70.06 ± 4.57 (2/2) | 1.13 | 74.71 ± 4.88 (2/2) | 0.93 |
| 10-fold diluted | 60.27 ± 4.52 (2/2) | 44.80 ± 20.87 (2/2) | 79.02 ± 12.39 (2/2) | 69.31 ± 9.60 (2/2) | ||||||
| 1.1 × 10⁴ | Pure | 59.23 ± 4.97 (2/2) | 0.33 | 40.41 ± 1.20 (2/2) | 0.70 | 66.72 ± 7.64 (2/2) | 0.16 | 76.40 ± 8.58 (2/2) | 0.46 | |
| 10-fold diluted | 19.38 ± 23.92 (2/2) | 28.31 ± 36.00 (2/2) | 10.45 (1/2) | 35.43 (1/2) | ||||||
| 1.1 × 10³ | Pure | 11.26 (1/2) | - | 5.76 ± 0.33 (2/2) | - | 10.77 ± 13.52 (2/2) | not detected | |||
| 10-fold diluted | not detected | 100.00 (1/2) | not detected | not detected | ||||||
| 1.1 × 10² | Pure | not detected | - | not detected | not detected | not detected | ||||
| 10-fold diluted | not detected | not detected | not detected | not detected | ||||||
| MNV-1 | MNV-1 | Pure | 90.52 ± 0.75 (4/4) | 36.83 ± 0.43 (4/4) | 81.68 ± 0.20 (4/4) | 100.00 (4/4) | ||||
| Nb of MNV-1 samples > 1% | 16/16 | |||||||||
| HEV | 1.0 × 10⁵ | Pure | 48.27 ± 11.94 (2/2) | 0.90 | 53.16 ± 3.72 (2/2) | 0.80 | 100.00 (2/2) | 1 | 56.46 ± 2.93 (2/2) | 0.1 |
| 10-fold diluted | 43.61 ± 1.63 (2/2) | 42.32 ± 15.30 (2/2) | 100.00 (2/2) | 5.63 ± 0.39 (2/2) | ||||||
| 1.0 × 10⁴ | Pure | 100.00 (2/2) | 1 | 100.00 (2/2) | 1 | 100.00 (2/2) | 1 | 100.00 (2/2) | - | |
| 10-fold diluted | 100.00 (2/2) | 100.00 (1/2) | 100.00 (1/2) | not detected | ||||||
| 1.0 × 10³ | Pure | not detected | - | not detected | - | not detected | - | 35.09 (1/2) | - | |
| 10-fold diluted | not detected | 100.00 (1/2) | not detected | not detected | ||||||
| 1.0 × 10² | Pure | 100.00 (1/2) | - | 100.00 (1/2) | - | not detected | - | not detected | - | |
| 10-fold diluted | not detected | not detected | not detected | not detected | ||||||
| MNV-1 | MNV-1 | Pure | 72.27 ± 0.50 (4/4) | 71.15 ± 0.49 (4/4) | 100.00 (4/4) | 100.00 (4/4) | ||||
| Nb of MNV-1 samples > 1% | 16/16 | |||||||||
| Norovirus GI | 2.90 × 10⁵ | Pure | 65.04 ± 7.72 (2/2) | 0.75 | 64.09 ± 1.46 (2/2) | 1.14 | 80.87 ± 13.86 (2/2) | 0.80 | 58.91 ± 6.14 (2/2) | 1.01 |
| 10-fold diluted | 48.75 ± 30.10 (2/2) | 73.22 ± 5.67 (2/2) | 65.22 ± 5.63 (2/2) | 59.72 ± 7.86 (2/2) | ||||||
| 2.90 × 10⁴ | Pure | 88.58 ± 3.18 (2/2) | 1.13 | 71.33 ± 5.78 (2/2) | 1.40 | 68.72 ± 1.94 (2/2) | 1.31 | 100.00 (2/2) | 1 | |
| 10-fold diluted | 100.00 (2/2) | 99.83 ± 12.87 (2/2) | 90.05 ± 7.02 (2/2) | 100.00 (2/2)) | ||||||
| 2.90 × 10³ | Pure | 25.09 (1/2) | - | 65.12 ± 1.54 (2/2) | 1.08 | 100.00 (2/2) | 1 | 100.00 (2/2) | 0.19 | |
| 10-fold diluted | not detected | 70.78 ± 7.43 (2/2) | 100.00 (2/2) | 19.48 ± 19.15 (2/2) | ||||||
| 2.90 × 10² | Pure | 100.00 (2/2) | 1 | 100.00 (2/2) | - | not detected | - | 100.00 (2/2) | - | |
| 10-fold diluted | 100.00 (1/2) | not detected | not detected | not detected | ||||||
| MNV-1 | MNV-1 | Pure | 74.23 ± 0.78 (4/4) | 100.00 (4/4) | 100.00 (4/4) | 100.00 (4/4) | ||||
| Nb of MNV-1 samples > 1% | 16/16 | |||||||||
| Norovirus GII | 9.9 × 10⁴ | Pure | 64.50 ± 6.43 (2/2) | 1.40 | 84.20 ± 6.43 (2/2) | 0.47 | 100.00 (2/2) | 0.89 | 92.94 ± 7.76 (2/2) | 1.07 |
| 10-fold diluted | 90.87 ± 13.51 (2/2) | 39.77 ± 15.43 (2/2) | 89.86 ± 24.25 (2/2) | 100.00 (2/2) | ||||||
| 9.9 × 10³ | Pure | 100.00 (2/2) | 1 | 100.00 (2/2) | 1 | 78.76 ± 14.93 (2/2) | 0.72 | 59.23 ± 60.40 (2/2) | - | |
| 10-fold diluted | 100.00 (2/2) | 100.00 (1/2) | 57.20 (1/2) | not detected | ||||||
| 9.9 × 10² | Pure | not detected | - | 47.83 ± 62.15 (2/2) | - | 49.13 (1/2) | - | 100.00 (1/2) | - | |
| 10-fold diluted | 100.00 (2/2) | not detected | not detected | not detected | ||||||
| 9.9 × 101 | Pure | 100.00 (1/2) | - | 100.00 (1/2) | - | 100.00 (1/2) | - | not detected | - | |
| 10-fold diluted | not detected | not detected | not detected | not detected | ||||||
| MNV-1 | MNV-1 | Pure | 74.27 ± 0.59 (4/4) | 91.34 ± 0.59 (4/4) | 98.85 ± 0.70 (4/4) | 100.00 (4/4) | ||||
| Nb of MNV-1 samples > 1% | 16/16 | |||||||||
| Target Virus | ||||
|---|---|---|---|---|
| Per g or Per mL of Dairy Product | HEV | HAV | Norovirus GI | Norovirus GII |
| LOD50 | 6.42 × 10² | 3.62 × 10² | 1.84 × 10² | 2.48 × 10² |
| LOD95 | 2.80 × 10³ | 1.56 × 10³ | 8.02 × 10² | 1.07 × 10³ |
| Sample | RT-qPCR Inhibition (%±SD) |
|---|---|
| Pasteurised whole cow’s milk | 0.99 ± 1.86 (N = 4) |
| Semi-skimmed cow’s milk | 7.96 ± 10.45 (N = 4) |
| Pasteurised goat’s milk | 0.00 (N = 4) |
| Raspberry-flavoured drinkable yoghurt | 0.00 (N = 4) |
| Vanilla dessert cream | 46.71 ± 23.98 (N = 4) |
| Raspberry pulped stirred yoghurt | 16.08 ± 23.73 (N = 4) |
| Cottage cheese with fruits | 13.77 ± 12.87 (N = 4) |
| Raspberry-flavoured yoghurt | 0.00 (N = 4) |
| Goat’s cheese (cheese) | 9.41 ± 10.57 (N = 4) |
| Camembert (cheese) | 2.76 ± 3.80 (N = 4) |
| Mozzarella (cheese) | 2.94 ± 4.86 (N = 4) |
| Emmental (cheese) | 1.40 ± 2.79 (N = 4) |
| Sheep’s cheese | 7.26 ± 4.98 (N = 4) |
| Feta (cheese) | 1.90 ± 1.78 (N = 4) |
| Cheddar (cheese) | 7.39 ± 13.95 (N = 4) |
| Raclette (cheese) | 6.61 ± 11.97 (N = 4) |
Disclaimer/Publisher’s Note: The statements, opinions and data contained in all publications are solely those of the individual author(s) and contributor(s) and not of MDPI and/or the editor(s). MDPI and/or the editor(s) disclaim responsibility for any injury to people or property resulting from any ideas, methods, instructions or products referred to in the content. |
© 2023 by the authors. Licensee MDPI, Basel, Switzerland. This article is an open access article distributed under the terms and conditions of the Creative Commons Attribution (CC BY) license (https://creativecommons.org/licenses/by/4.0/).
Share and Cite
Hennechart-Collette, C.; Fourniol, L.; Fraisse, A.; Martin-Latil, S.; Perelle, S. Evaluation of a Proteinase K-Based Extraction Method to Detect Hepatitis A Virus, Hepatitis E Virus and Norovirus in Artificially Contaminated Dairy Products. Foods 2023, 12, 1489. https://doi.org/10.3390/foods12071489
Hennechart-Collette C, Fourniol L, Fraisse A, Martin-Latil S, Perelle S. Evaluation of a Proteinase K-Based Extraction Method to Detect Hepatitis A Virus, Hepatitis E Virus and Norovirus in Artificially Contaminated Dairy Products. Foods. 2023; 12(7):1489. https://doi.org/10.3390/foods12071489
Chicago/Turabian StyleHennechart-Collette, Catherine, Lisa Fourniol, Audrey Fraisse, Sandra Martin-Latil, and Sylvie Perelle. 2023. "Evaluation of a Proteinase K-Based Extraction Method to Detect Hepatitis A Virus, Hepatitis E Virus and Norovirus in Artificially Contaminated Dairy Products" Foods 12, no. 7: 1489. https://doi.org/10.3390/foods12071489