Hybrid Spreadable Cheese Analogues with Faba Bean and Mealworm (Tenebrio molitor) Flours: Optimisation Using Desirability-Based Mixture Design

 , ,
, ,
Abstract
:1. Introduction
2. Materials and Methods
2.1. Raw Materials
2.2. Pre-Treatment of Insect Flour
2.3. Physicochemical Analysis of Protein Ingredients
2.4. Spreadable Cheese Analogues
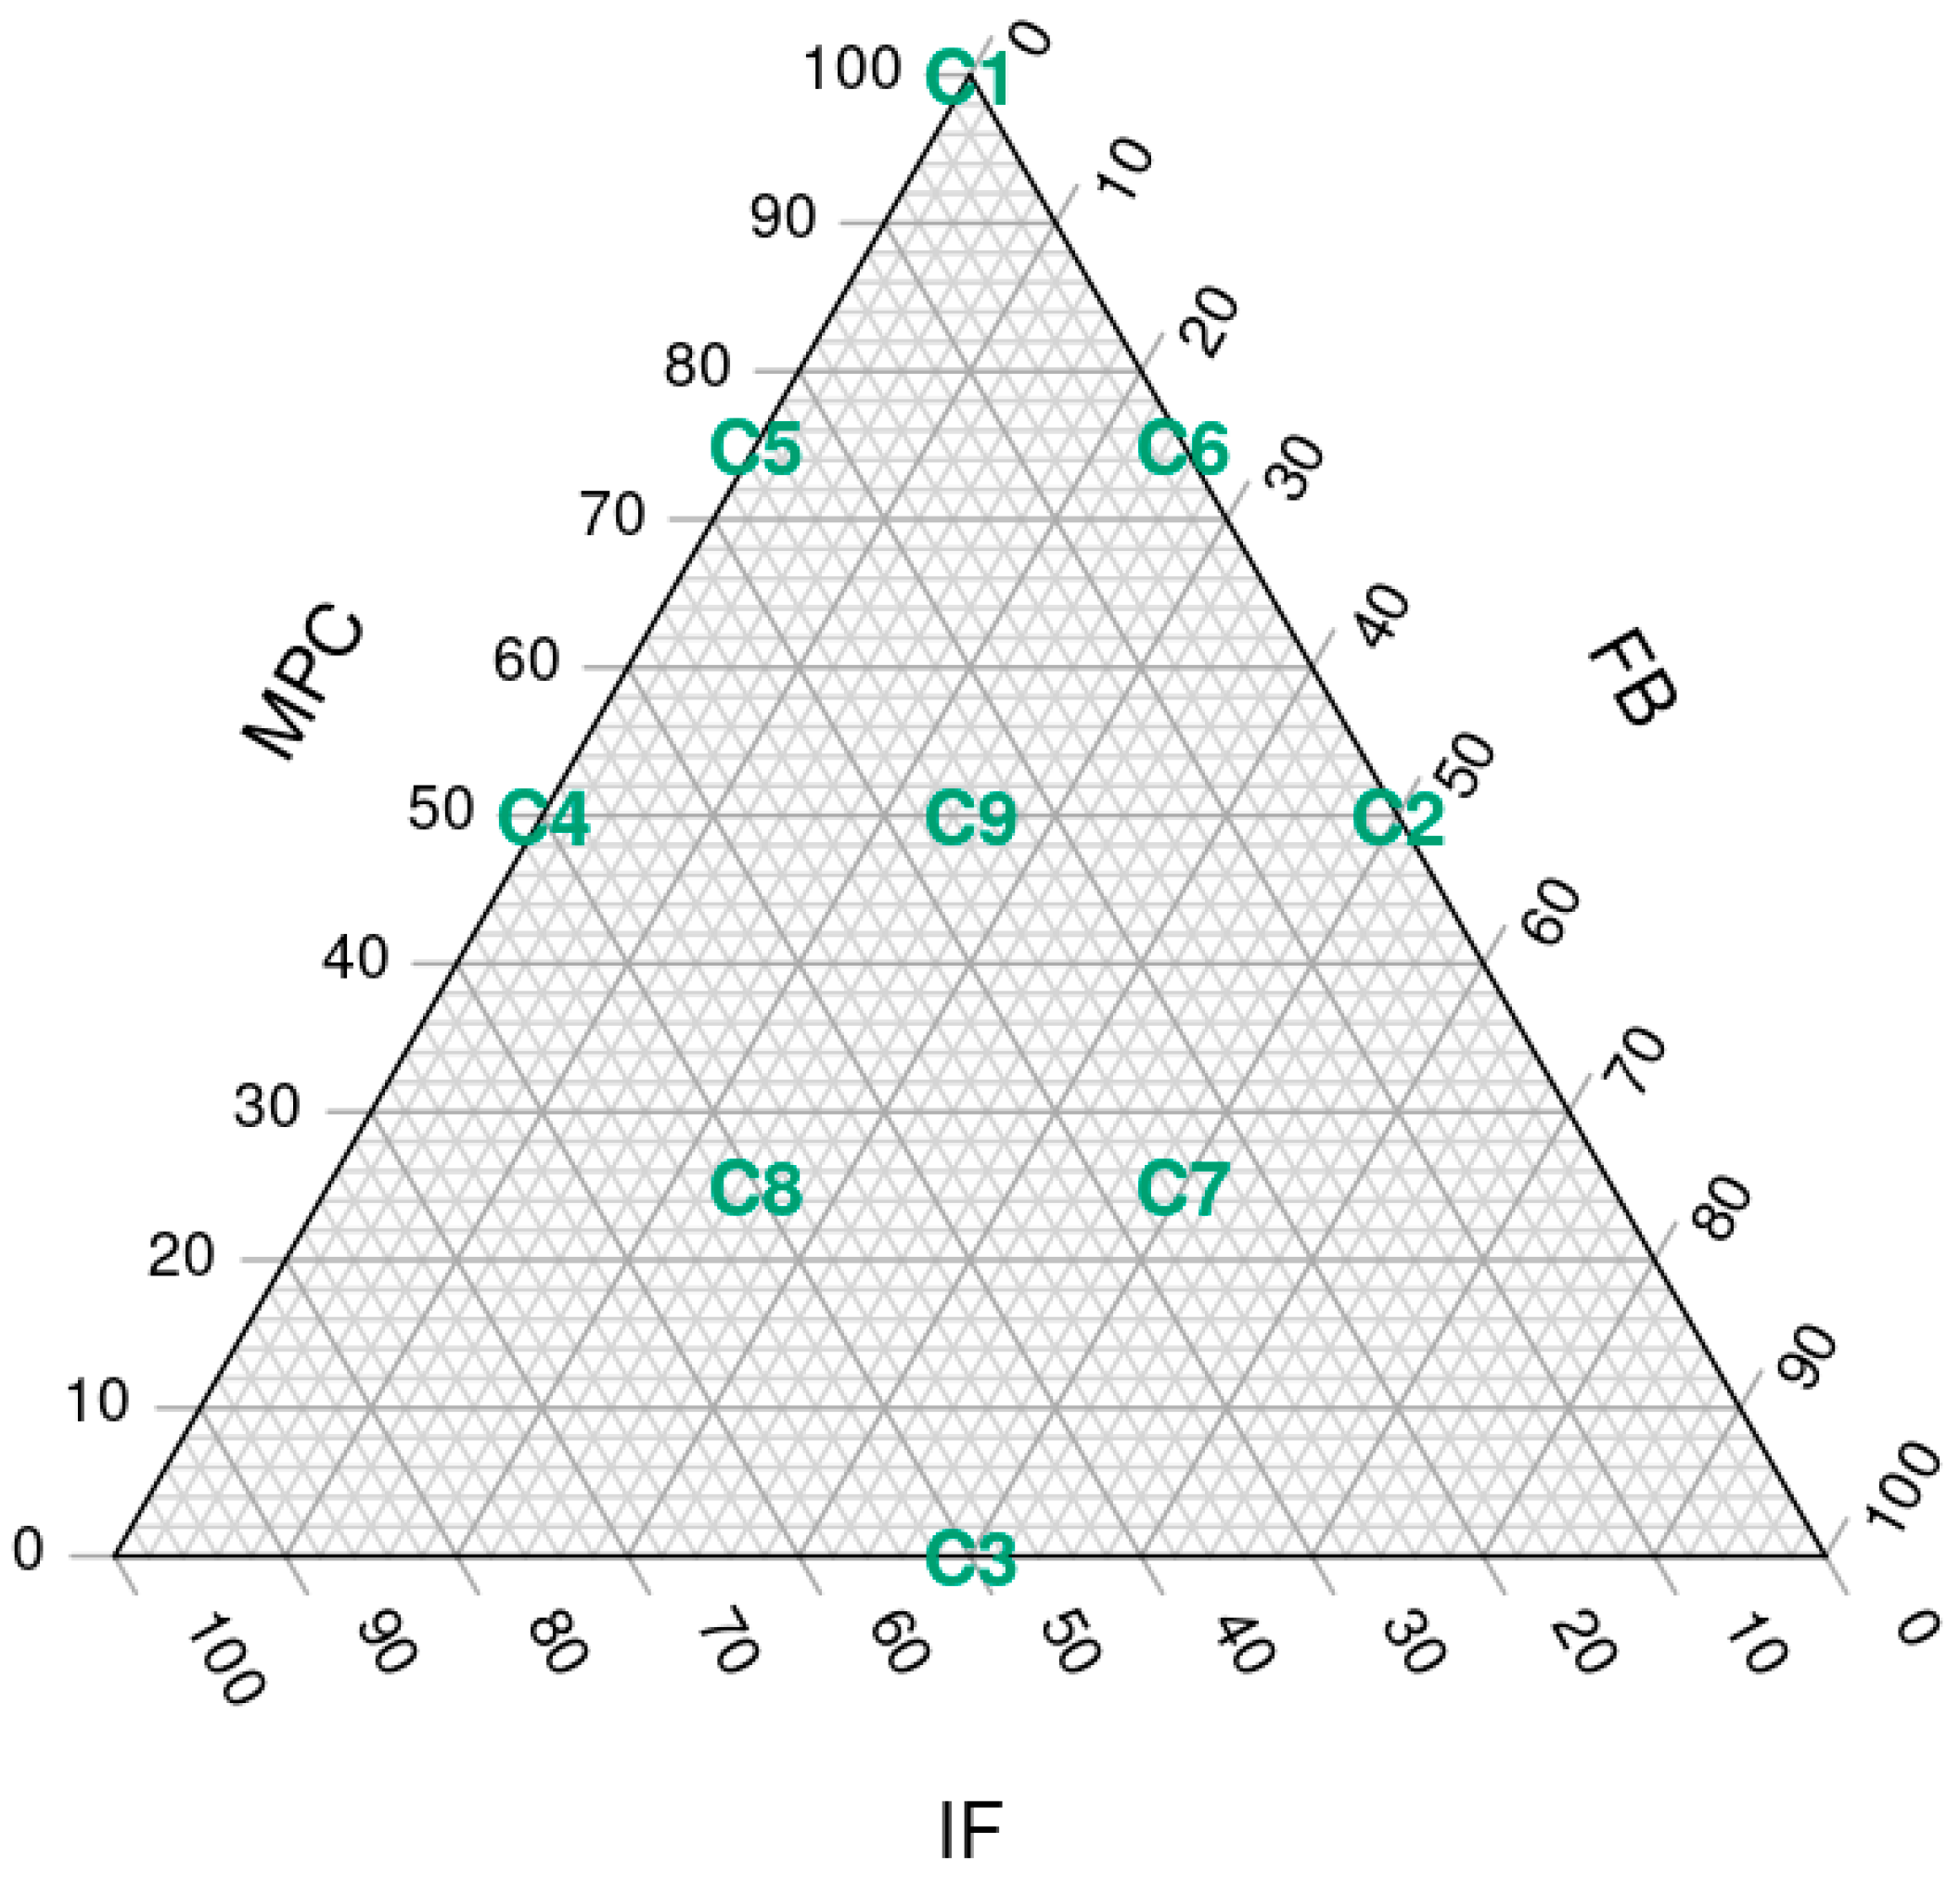
2.4.1. Experimental Design and Spreadable Cheese Analogues Preparation
2.4.2. Physicochemical Characterisation of Spreadable Hybrid Cheeses
2.4.3. Textural Properties
2.4.4. Modelling and Optimisation of Experimental Data
2.4.5. Sensory Analysis
2.5. Statistical Analysis, Modelling and Optimisation of Experimental Data
3. Results
3.1. Physicochemical Characterisation of Protein Ingredients
3.2. Physicochemical Characterisation of the Spreadable Cheese Analogues
3.3. Nutritional Estimates for the Spreadable Cheese Analogues
3.4. Texture Characterisation of the Spreadable Cheese Analogues
3.5. Modelling and Optimisation
3.6. Quantitative Descriptive Analysis of Spreadable Cheese Analogues
4. Discussion
4.1. Physicochemical Characterisation of Protein Ingredients
4.2. Texture Characterisation of the Spreadable Cheese Analogues
4.3. Sensory Analysis of the Spreadable Cheese Analogues
4.4. Nutritional Profile of the Spreadable Cheese Analogues
5. Conclusions
Author Contributions
Funding
Institutional Review Board Statement
Informed Consent Statement
Data Availability Statement
Acknowledgments
Conflicts of Interest
References
- Broekman, H.; Verhoeckx, K.C.; Jager, C.F.D.H.; Kruizinga, A.G.; Pronk-Kleinjan, M.; Remington, B.; Bruijnzeel-Koomen, C.A.; Houben, G.F.; Knulst, A.C. Majority of shrimp-allergic patients are allergic to mealworm. J. Allergy Clin. Immunol. 2016, 137, 1261–1263. [Google Scholar] [CrossRef] [PubMed] [Green Version]
- Rinaldoni, A.N.; Palatnik, D.R.; Zaritzky, N.; Campderrós, M.E. Soft cheese-like product development enriched with soy protein concentrates. LWT 2014, 55, 139–147. [Google Scholar] [CrossRef]
- Guyomarc’H, F.; Arvisenet, G.; Bouhallab, S.; Canon, F.; Deutsch, S.-M.; Drigon, V.; Dupont, D.; Famelart, M.-H.; Garric, G.; Guédon, E.; et al. Mixing milk, egg and plant resources to obtain safe and tasty foods with environmental and health benefits. Trends Food Sci. Technol. 2021, 108, 119–132. [Google Scholar] [CrossRef]
- Grasso, S.; Goksen, G. The best of both worlds? Challenges and opportunities in the development of hybrid meat products from the last 3 years. LWT 2023, 173, 114235. [Google Scholar] [CrossRef]
- Tello, A.; Aganovic, K.; Parniakov, O.; Carter, A.; Heinz, V.; Smetana, S. Product development and environmental impact of an insect-based milk alternative. Futur. Foods 2021, 4, 100080. [Google Scholar] [CrossRef]
- Mattucci, S. Ingredient Watch: Vegan Cheese Formulations, 2020. Mintel Global New Products Database (GNPD). Available online: www.mintel.com (accessed on 20 December 2022).
- Kaczorowski, M. A Year of Innovation in Cheese, 2021. Mintel Global New Products Database (GNPD). Available online: www.mintel.com (accessed on 20 December 2022).
- Ferawati, F.; Hefni, M.; Östbring, K.; Witthöft, C. The Application of Pulse Flours in the Development of Plant-Based Cheese Analogues: Proximate Compo-sition, Color, and Texture Properties. Foods 2021, 10, 2208. [Google Scholar] [CrossRef]
- Augustin, M.; Cole, M. Towards a sustainable food system by design using faba bean protein as an example. Trends Food Sci. Technol. 2022, 125, 1–11. [Google Scholar] [CrossRef]
- Nawaz, M.; Singh, T.; Stockmann, R.; Jegasothy, H.; Buckow, R. Quality Attributes of Ultra-High Temperature-Treated Model Beverages Prepared with Faba Bean Protein Concentrates. Foods 2021, 10, 1244. [Google Scholar] [CrossRef]
- Gkinali, A.-A.; Matsakidou, A.; Vasileiou, E.; Paraskevopoulou, A. Potentiality of Tenebrio molitor larva-based ingredients for the food industry: A review. Trends Food Sci. Technol. 2022, 119, 495–507. [Google Scholar] [CrossRef]
- Gravel, A.; Doyen, A. The use of edible insect proteins in food: Challenges and issues related to their functional properties. Innov. Food Sci. Emerg. Technol. 2020, 59, 102272. [Google Scholar] [CrossRef]
- Michel, P.; Begho, T. Paying for sustainable food choices: The role of environmental considerations in consumer valuation of insect-based foods. Food Qual. Prefer. 2023, 106, 104816. [Google Scholar] [CrossRef]
- Talens, C.; Llorente, R.; Simó-Boyle, L.; Odriozola-Serrano, I.; Tueros, I.; Ibargüen, M. Hybrid Sausages: Modelling the Effect of Partial Meat Replacement with Broccoli, Upcycled Brewer’s Spent Grain and Insect Flours. Foods 2022, 11, 3396. [Google Scholar] [CrossRef] [PubMed]
- Talens, C.; Lago, M.; Simó-Boyle, L.; Odriozola-Serrano, I.; Ibargüen, M. Desirability-based optimization of bakery products containing pea, hemp and insect flours using mixture design methodology. LWT 2022, 168, 113878. [Google Scholar] [CrossRef]
- Derringer, G.; Suich, R. Simultaneous Optimization of Several Response Variables. J. Qual. Technol. 1980, 12, 214–219. [Google Scholar] [CrossRef]
- AOAC. Official Methods of Analysis: Official Method for Moisture; Method No. 925.10; Association of Official Analytical Chemists: Washington, DC, USA, 1995. [Google Scholar]
- Brighenti, M.; Govindasamy-Lucey, S.; Lim, K.; Nelson, K.; Lucey, J. Characterization of the Rheological, Textural, and Sensory Properties of Samples of Commercial US Cream Cheese with Different Fat Contents. J. Dairy Sci. 2008, 91, 4501–4517. [Google Scholar] [CrossRef] [Green Version]
- Chandra, S.; Singh, S.; Kumari, D. Evaluation of functional properties of composite flours and sensorial attributes of com-posite flour biscuits. J. Food Sci. Technol. 2015, 52, 3681–3688. [Google Scholar]
- Florczuk, A.; Dąbrowska, A.; Aljewicz, M. An evaluation of the effect of curdlan and scleroglucan on the functional properties of low-fat processed cheese spreads. LWT 2022, 163, 113564. [Google Scholar] [CrossRef]
- Bayarri, S.; Carbonell, I.; Costell, E. Viscoelasticity and texture of spreadable cheeses with different fat contents at refrigeration and room temperatures. J. Dairy Sci. 2012, 95, 6926–6936. [Google Scholar] [CrossRef]
- Rezler, R.; Krzywdzińska-Bartkowiak, M.; Piątek, M. The influence of the substitution of fat with modified starch on the quality of pork liver pâtés. LWT 2021, 135, 110264. [Google Scholar] [CrossRef]
- Drohan, D.; Tziboula, A.; McNulty, D.; Horne, D. Milk protein-carrageenan interactions. Food Hydrocoll. 1997, 11, 101–107. [Google Scholar] [CrossRef]
- Arltoft, D.; Ipsen, R.; Madsen, F.; de Vries, J. Interactions between Carrageenans and Milk Proteins: A Microstructural and Rheological Study. Biomacromolecules 2007, 8, 729–736. [Google Scholar] [CrossRef]
- Błaszak, B.B.; Gozdecka, G.; Shyichuk, A. Carrageenan as a functional additive in the production of cheese and cheese-like products. Acta Sci. Pol. Technol. Aliment. 2018, 17, 107–116. [Google Scholar] [PubMed]
- Zielińska, E.; Karaś, M.; Baraniak, B. Comparison of functional properties of edible insects and protein preparations thereof. LWT 2018, 91, 168–174. [Google Scholar] [CrossRef]
- Zhao, X.; Vázquez-Gutiérrez, J.L.; Johansson, D.; Landberg, R.; Langton, M. Yellow Mealworm Protein for Food Purposes—Extraction and Functional Properties. PLoS ONE 2016, 11, e0147791. [Google Scholar] [CrossRef] [PubMed] [Green Version]
- Ali, M. Functional properties of faba bean protein and effect of enzymatic hydrolysis on its antioxidant activity. Zagazig J. Agric. Res. 2019, 46, 99–114. [Google Scholar] [CrossRef] [Green Version]
- Abbey, B.; Ibeh, G. Functional-Properties of Raw and Heat Processed Brown Bean (Canavalia rosea DC) Flour. J. Food Sci. 1987, 52, 406–408. [Google Scholar] [CrossRef]
- Bußler, S.; Rumpold, B.A.; Jander, E.; Rawel, H.M.; Schlüter, O.K. Recovery and techno-functionality of flours and proteins from two edible insect species: Meal worm (Tenebrio molitor) and black soldier fly (Hermetia illucens) larvae. Heliyon 2016, 2, e00218. [Google Scholar] [CrossRef]
- Meena, G.S.; Singh, A.K.; Arora, S.; Borad, S.; Sharma, R.; Gupta, V.K. Physico-chemical, functional and rheological properties of milk protein concentrate 60 as affected by disodium phosphate addition, diafiltration and homogenization. J. Food Sci. Technol. 2017, 54, 1678–1688. [Google Scholar] [CrossRef] [Green Version]
- Salunke, P.; Metzger, L. Functional properties of milk protein concentrate and micellar casein concentrate as affected by transglutaminase treatment. Food Hydrocoll. 2023, 137, 108367. [Google Scholar] [CrossRef]
- Bühler, J.; Dekkers, B.; Bruins, M.; Van Der Goot, A. Modifying Faba Bean Protein Concentrate Using Dry Heat to Increase Water Holding Capacity. Foods 2020, 9, 1077. [Google Scholar] [CrossRef]
- Sosulski, F.W.; McCURDY, A. Functionality of Flours, Protein Fractions and Isolates from Field Peas and Faba Bean. J. Food Sci. 1987, 52, 1010–1014. [Google Scholar] [CrossRef]
- Day, L.; Cakebread, J.A.; Loveday, S.M. Food proteins from animals and plants: Differences in the nutritional and functional properties. Trends Food Sci. Technol. 2022, 119, 428–442. [Google Scholar] [CrossRef]
- Kalab, M. Practical aspects of electron microscopy in dairy research. Food Struct. 1993, 12, 95–114. [Google Scholar]
- Liu, C.; Pei, R.; Heinonen, M. Faba bean protein: A promising plant-based emulsifier for improving physical and oxidative stabilities of oil-in-water emulsions. Food Chem. 2022, 369, 130879. [Google Scholar] [CrossRef] [PubMed]
- Scholliers, J.; Steen, L.; Fraeye, I. Gelation of a combination of insect and pork proteins as affected by heating temperature and insect:meat ratio. Food Res. Int. 2020, 137, 109703. [Google Scholar] [CrossRef]
- Lee, S.K.; Huss, M.; Klostermeyer, H.; Anema, S.G. The effect of pre-denatured whey proteins on the textural and micro-structural properties of model processed cheese spreads. Int. Dairy J. 2013, 32, 79–88. [Google Scholar] [CrossRef]
- Xiao, Y.; Li, J.; Liu, Y.; Peng, F.; Wang, X.; Wang, C.; Li, M.; Xu, H. Gel properties and formation mechanism of soy protein isolate gels improved by wheat bran cellulose. Food Chem. 2020, 324, 126876. [Google Scholar] [CrossRef]
- Zhuang, X.; Jiang, X.; Zhou, H.; Chen, Y.; Zhao, Y.; Yang, H.; Zhou, G. Insight into the mechanism of physicochemical influence by three polysaccharides on myofibrillar protein gelation. Carbohydr. Polym. 2020, 229, 115449. [Google Scholar] [CrossRef]
- Noronha, N.; Duggan, E.; Ziegler, G.; O’Riordan, E.; O’Sullivan, M. Inclusion of starch in imitation cheese: Its influence on water mobility and cheese functionality. Food Hydrocoll. 2008, 22, 1612–1621. [Google Scholar] [CrossRef]
- Johansson, M.; Johansson, D.; Ström, A.; Rydén, J.; Nilsson, K.; Karlsson, J.; Moriana, R.; Langton, M. Effect of starch and fibre on faba bean protein gel characteristics. Food Hydrocoll. 2022, 131, 107741. [Google Scholar] [CrossRef]
- Chihi, M.-L.; Mession, J.-L.; Sok, N.; Saurel, R. Heat-Induced Soluble Protein Aggregates from Mixed Pea Globulins and β-Lactoglobulin. J. Agric. Food Chem. 2016, 64, 2780–2791. [Google Scholar] [CrossRef] [PubMed]
- Roesch, R.R.; Corredig, M. Heat-Induced Soy−Whey Proteins Interactions: Formation of Soluble and Insoluble Protein Complexes. J. Agric. Food Chem. 2005, 53, 3476–3482. [Google Scholar] [CrossRef] [PubMed]
- Yi, L.; Lakemond, C.M.; Sagis, L.M.; Eisner-Schadler, V.; van Huis, A.; van Boekel, M.A. Extraction and characterisation of protein fractions from five insect species. Food Chem. 2013, 141, 3341–3348. [Google Scholar] [CrossRef] [PubMed]
- Foguel, A.; Neves Rodrigues Ract, J.; Claro da Silva, R. Sensory characterization of commercial cream cheese by the consumer using check-all-that-apply questions. J. Sens. Stud. 2021, 36, e12658. [Google Scholar] [CrossRef]
- Short, E.; Kinchla, A.; Nolden, A. Plant-Based Cheeses: A Systematic Review of Sensory Evaluation Studies and Strategies to Increase Consumer Acceptance. Foods 2021, 10, 725. [Google Scholar] [CrossRef]
- Mefleh, M.; Pasqualone, A.; Caponio, F.; De Angelis, D.; Natrella, G.; Summo, C.; Faccia, M. Spreadable plant-based cheese analogue with dry-fractioned pea protein and inulin–olive oil emulsion-filled gel. J. Sci. Food Agric. 2022, 102, 5478–5487. [Google Scholar] [CrossRef]


| Sensorial Attribute | Definition | |
|---|---|---|
| Texture by mouthfeel | Granularity | Presence of fine particles or granules. 1 = Low-as smooth cheese; 5 = High-as grainy cheese. |
| Creaminess | Creamy feeling of fullness in the mouth. 1 = not creamy; 5 = Very creamy. | |
| Firmness | Effort needed to compress and break down the cheese when pressed to the roof of the mouth. 1 = Smooth; 5 = Firm. | |
| Texture by hand | Spreadability | Ease with which cheese can be spread on a cracker. 1 = little spreadable, it required much effort to spread; 5 = very spreadable, less effort is required to spread. |
| Adhesion | Ease with which cheese sticks to bread or knife. 1 = Low adhesion 5 = High adhesion. | |
| Taste | Sourness | The basic taste, perceived on the tongue, stimulated by acids such as critic acid. Pungent acidic aroma/flavour resembling sour cream. 1 = little sour; 5 = very sour. |
| Cheesy flavour | Characteristic flavour of the cheese. 1 = little cheesy flavour; 5 = lots of cheese flavour. | |
| Uncharacteristic flavour | Beany flavour or buttery flavour. 1 = non uncharacteristic flavours; 5 = strong uncharacteristic flavours. | |
| Appearance | Characteristic yellow colour | Pale yellow, such as cheese colour. 1 = very different colour; 5 = characteristic pale yellow colour. |
| Functional Properties | MPC | FBP | IF | p-Value |
|---|---|---|---|---|
| Moisture (%) | 5.22 a ± 0.25 | 6.89 b ± 0.03 | 1.41 c ± 0.03 | <0.001 *** |
| Swelling capacity (mL/g) | 2.88 a ± 0.09 | 4.01 b ± 0.11 | 3.64 b ± 0.37 | 0.0338 * |
| Water solubility index (%) | 31.08 a ± 7.05 | 24.23 a ± 0.83 | 7.62 b ± 1.26 | 0.0234 * |
| Water-holding capacity (g/g) | 2.69 a ± 0.09 | 1.35 b ± 0.08 | 1.64 c ± 0.08 | 0.0011 * |
| Oil-holding capacity (cm3/g) | 1.44 a ± 0.05 | 0.72 b ± 0.04 | 2.10 c ± 0.02 | <0.001 *** |
| Colour parameters | ||||
| L* | 69.29 a ± 0.02 | 79.92 b ± 0.01 | 21.53 c ± 0.01 | <0.001 *** |
| a* | −1.80 a ± 0.02 | −1.92 b ± 0.02 | 2.44 c ± 0.06 | <0.001 *** |
| b* | 9.63 a ± 0.04 | 15.13 b ± 0.02 | 12.70 c ± 0.01 | <0.001 *** |
| Particle size characteristics | ||||
| d10 (µm) | 25.90 a ± 0.31 | 6.45 b ± 0.19 | 7.11 b ± 0.98 | <0.001 *** |
| d50 (µm) | 94.17 a ± 3.44 | 35.68 b ± 2.40 | 56.20 c ± 7.45 | <0.001 *** |
| d90 (µm) | 306.50 a ± 24.12 | 130.33 b ± 7.39 | 161.17 c ± 27.33 | <0.001 *** |
| D[4.3] (µm) | 135.0 a ± 8.22 | 54.63 b ± 3.16 | 77.33 c ± 13.24 | <0.001 *** |
| D[3.2] (µm) | 52.18 a ± 0.73 | 14.95 b ± 0.47 | 14.72 b ± 1.56 | <0.001 *** |
| Specific Surface area | 115.0 a ± 1.57 | 401.88 b ± 12.49 | 411.42 b ± 43.54 | <0.001 *** |
| Ratio MPC/FBC/IF | Moisture (%) | pH | L* | a* | b* | |
|---|---|---|---|---|---|---|
| C1 | 100/0/0 | 60.72 a ± 0.36 | 5.20 a ± 0.20 | 74.42 a ± 0.26 | −2.99 a ± 0.03 | 20.32 a ± 0.69 |
| C2 | 50/50/0 | 60.72 a ± 0.16 | 4.60 b ± 0.28 | 76.81 b ± 0.17 | −2.57 b ± 0.06 | 19.48 b ± 0.19 |
| C3 | 0/50/50 | 61.47 b ± 0.05 | 4.41 b ± 0.06 | 62.57 c ± 0.43 | −0.25 c ± 0.19 | 17.23 c ± 0.79 |
| C4 | 50/0/50 | 62.15 c ± 0.28 | 4.55 b ± 0.13 | 63.46 c ± 0.61 | −0.15 c ± 0.17 | 15.93 e ± 0.60 |
| C5 | 75/0/25 | 60.55 a ± 0.16 | 4.63 b ± 0.09 | 67.43 d ± 0.22 | −0.86 de ± 0.14 | 16.68 cd ± 0.21 |
| C6 | 75/25/0 | 60.66 a ± 0.06 | 4.56 b ± 0.12 | 76.84 b ± 0.28 | −2.55 b ± 0.06 | 19.18 a ± 0.38 |
| C7 | 25/50/25 | 60.61 a ± 0.07 | 4.43 b ± 0.04 | 70.06 e ± 0.98 | −1.04 d ± 0.12 | 16.40 a ± 0.14 |
| C8 | 25/25/50 | 60.93 a ± 0.02 | 4.46 b ± 0.13 | 65.27 f ± 0.29 | −0.21 c ± 0.11 | 15.92 a ± 0.07 |
| C9 | 50/25/25 | 60.59 a ± 0.01 | 4.55 b ± 0.07 | 68.08 d ± 1.81 | −0.79 e ± 0.32 | 15.95 a ± 0.69 |
| Energy (kJ) | Energy (Kcal) | Protein (g) | Total Fat (g) | SFA (g) | UFA (g) | CH (g) | Sugars (g) | Total Fibre (g) | Salt (g) | |
|---|---|---|---|---|---|---|---|---|---|---|
| C1 | 1204.88 | 292.35 | 5.18 | 30.08 | 6.51 | 23.15 | 0.21 | 0.21 | 0.00 | 0.69 |
| C2 | 1208.05 | 293.17 | 4.83 | 30.14 | 6.49 | 23.20 | 0.40 | 0.29 | 0.51 | 0.69 |
| C3 | 1239.41 | 300.89 | 4.20 | 31.25 | 6.73 | 24.06 | 0.40 | 0.29 | 0.64 | 0.70 |
| C4 | 1236.24 | 300.07 | 4.55 | 31.19 | 6.75 | 24.01 | 0.21 | 0.21 | 0.13 | 0.70 |
| C5 | 1220.56 | 296.21 | 4.87 | 30.64 | 6.63 | 23.58 | 0.21 | 0.21 | 0.07 | 0.69 |
| C6 | 1206.47 | 292.76 | 5.01 | 30.11 | 6.50 | 23.17 | 0.31 | 0.25 | 0.26 | 0.69 |
| C7 | 1223.73 | 297.03 | 4.51 | 30.69 | 6.61 | 23.63 | 0.40 | 0.29 | 0.58 | 0.69 |
| C8 | 1237.82 | 300.48 | 4.37 | 31.22 | 6.74 | 24.04 | 0.31 | 0.25 | 0.39 | 0.70 |
| C9 | 1222.15 | 296.62 | 4.69 | 30.66 | 6.62 | 23.61 | 0.31 | 0.25 | 0.32 | 0.69 |
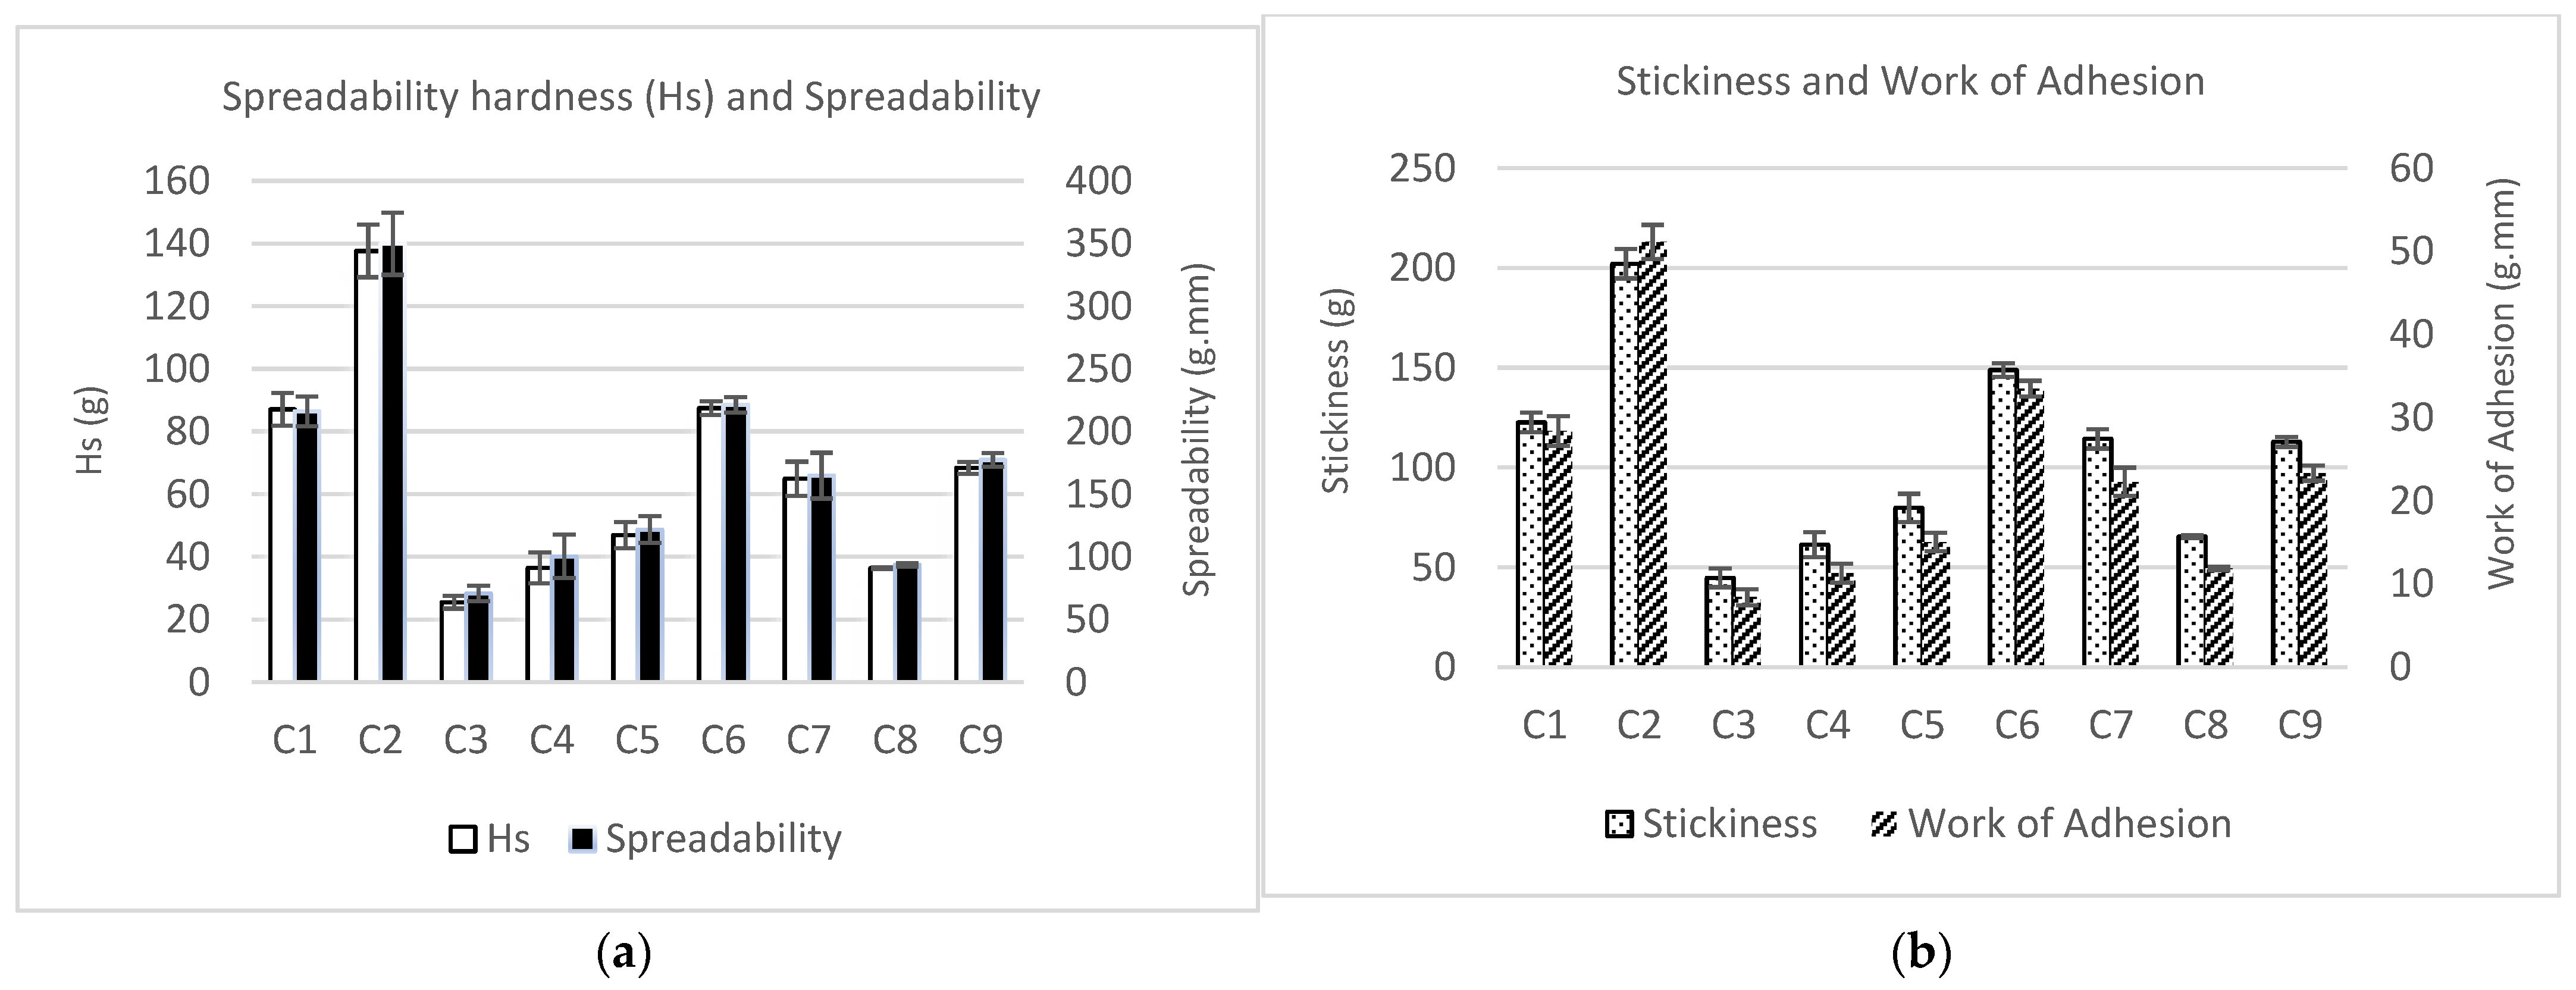
| Ratio MPC/FBP/IF | Hs (g) | Spreadability (g.mm) | Stickiness (g) | Work of Adhesion (g.mm) | |
|---|---|---|---|---|---|
| C1 | 100/0/0 | 87.1 b ± 5.2 | 216.0 c ± 12.0 | 122.5 b ± 4.9 | 28.4 c ± 1.8 |
| C2 | 50/50/0 | 137.6 a ± 8.4 | 349.9 a ± 24.9 | 202.1 a ± 7.3 | 51.1 a ± 2.1 |
| C3 | 0/50/50 | 25.5 e ± 2.1 | 70.6 e ± 6.2 | 44.7 e ± 4.6 | 8.4 g ± 0.9 |
| C4 | 50/0/50 | 36.4 d ± 5.0 | 100.4 d ± 17.3 | 61.3 d ± 6.3 | 11.3 f ± 1.2 |
| C5 | 75/0/25 | 46.9 d ± 4.2 | 121.8 d ± 10.6 | 79.7 c ± 7.1 | 15.0 e ± 1.1 |
| C6 | 75/25/0 | 87.5 b ± 2.2 | 221.3 b ± 6.2 | 148.9 a ± 3.4 | 33.5 b ± 0.9 |
| C7 | 25/50/25 | 64.9 c ± 5.5 | 164.8 c ± 18.3 | 114.3 b ± 4.8 | 22.3 d ± 1.7 |
| C8 | 25/25/50 | 36.4 d ± 0.3 | 93.6 de ± 1.2 | 65.4 d ± 0.8 | 11.9 f ± 0.2 |
| C9 | 50/25/25 | 68.4 c ± 1.9 | 177.3 b ± 5.5 | 112.9 b ± 2.5 | 23.3 d ± 0.9 |
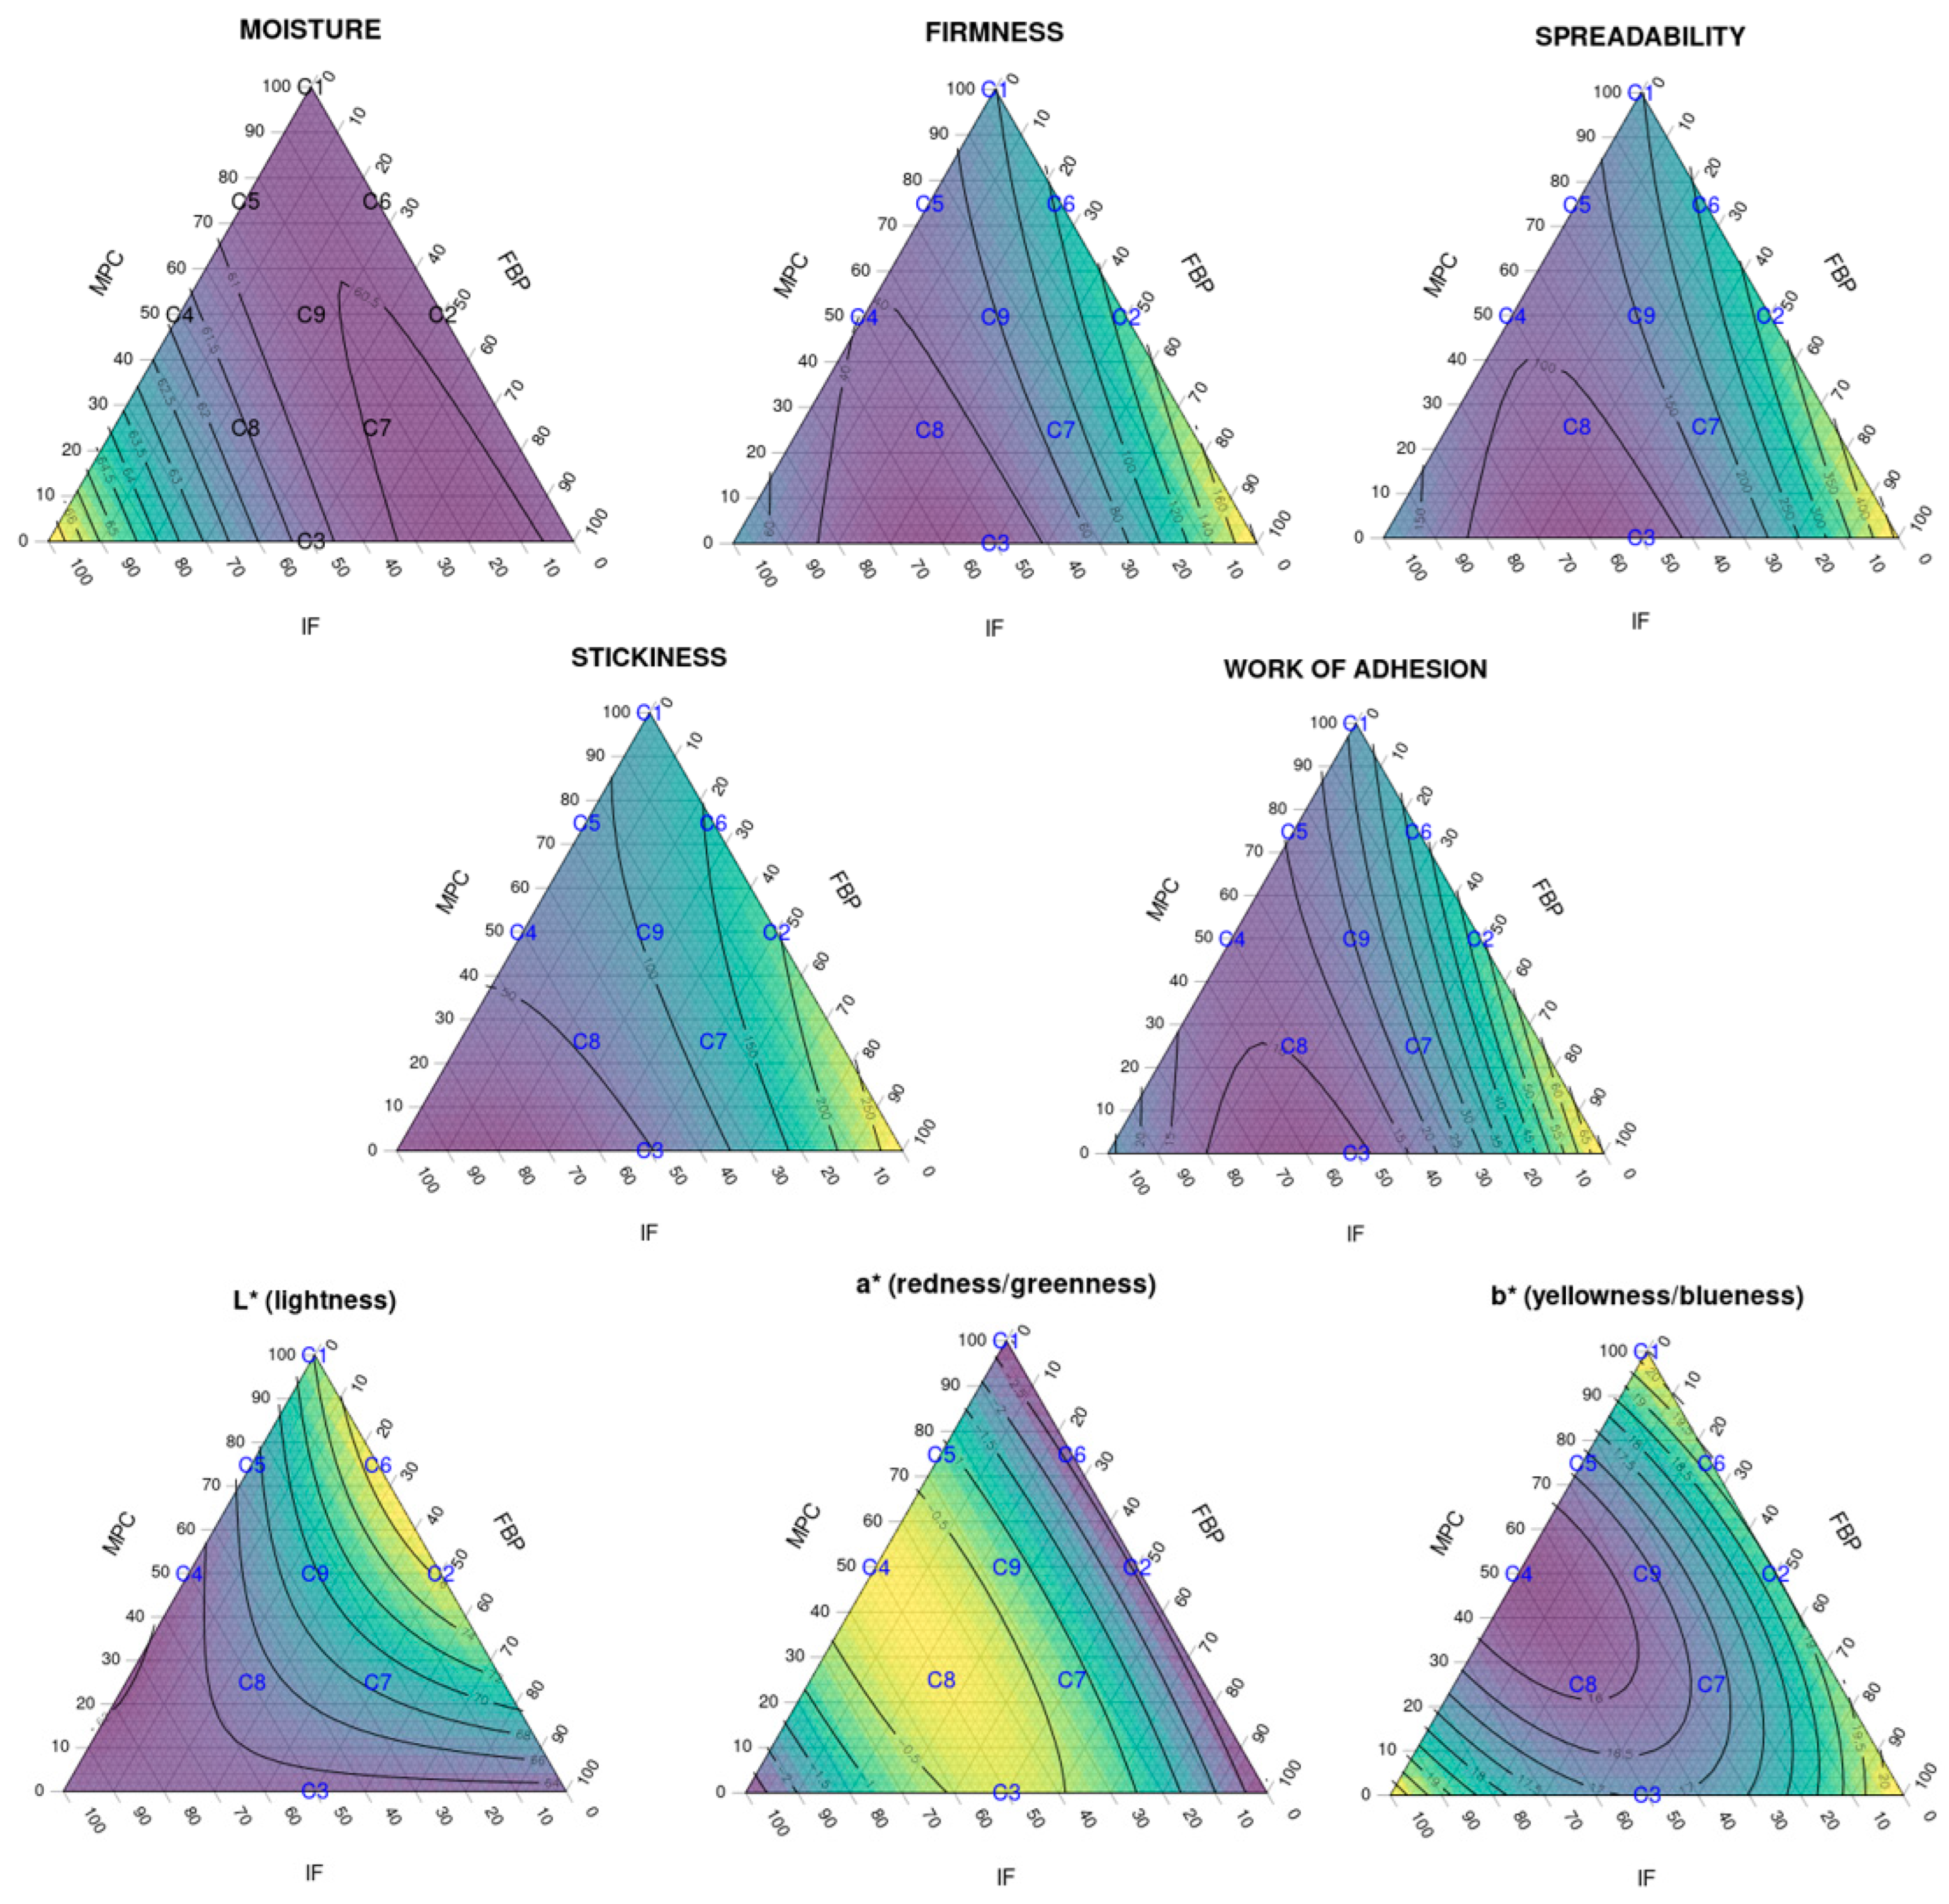
| Moisture | Firmness (g) | Spreadability (g.mm) | Stickiness (g) | Work of Adhesion (g.mm) | L* | a* | b* | |
|---|---|---|---|---|---|---|---|---|
| R2 | 0.744 | 0.945 | 0.944 | 0.977 | 0.969 | 0.973 | 0.991 | 0.965 |
| F | 4.848 | 28.455 | 27.900 | 71.150 | 51.842 | 60.260 | 176.372 | 46.122 |
| Pr > F | 0.061 | 0.001 | 0.002 | 0.000 | 0.000 | 0.000 | <0.000 | 0.000 |
| MPC | - | - | - | 43.568 | - | 68.581 | - | - |
| - | - | - | 0.001 | - | 0.000 | - | - | |
| FBP | - | 15.134 | 16.434 | - | 32.981 | - | - | - |
| - | 0.012 | 0.010 | - | 0.002 | - | - | - | |
| IF | 9.387 | - | - | 148.689 | - | - | - | - |
| 0.028 | - | - | <0.0001 | - | - | - | - | |
| MPC–FBP | - | - | - | - | - | 42.280 | 3.457 | 9.913 |
| - | - | - | - | - | 0.001 | 0.122 | 0.025 | |
| MPC–IF | 4.646 | 10.359 | 8.805 | - | 16.805 | 21.165 | 291.024 | 109.041 |
| 0.084 | 0.024 | 0.031 | - | 0.009 | 0.006 | <0.0001 | 0.000 | |
| FBP–IF | 6.007 | 58.259 | 58.657 | 25.839 | 105.231 | - | 268.403 | 58.037 |
| 0.058 | 0.001 | 0.001 | 0.004 | 0.000 | - | <0.0001 | 0.001 | |
| MPC–FBP–IF | - | - | - | - | - | - | - | - |
| - | - | - | - | - | - | - | - |
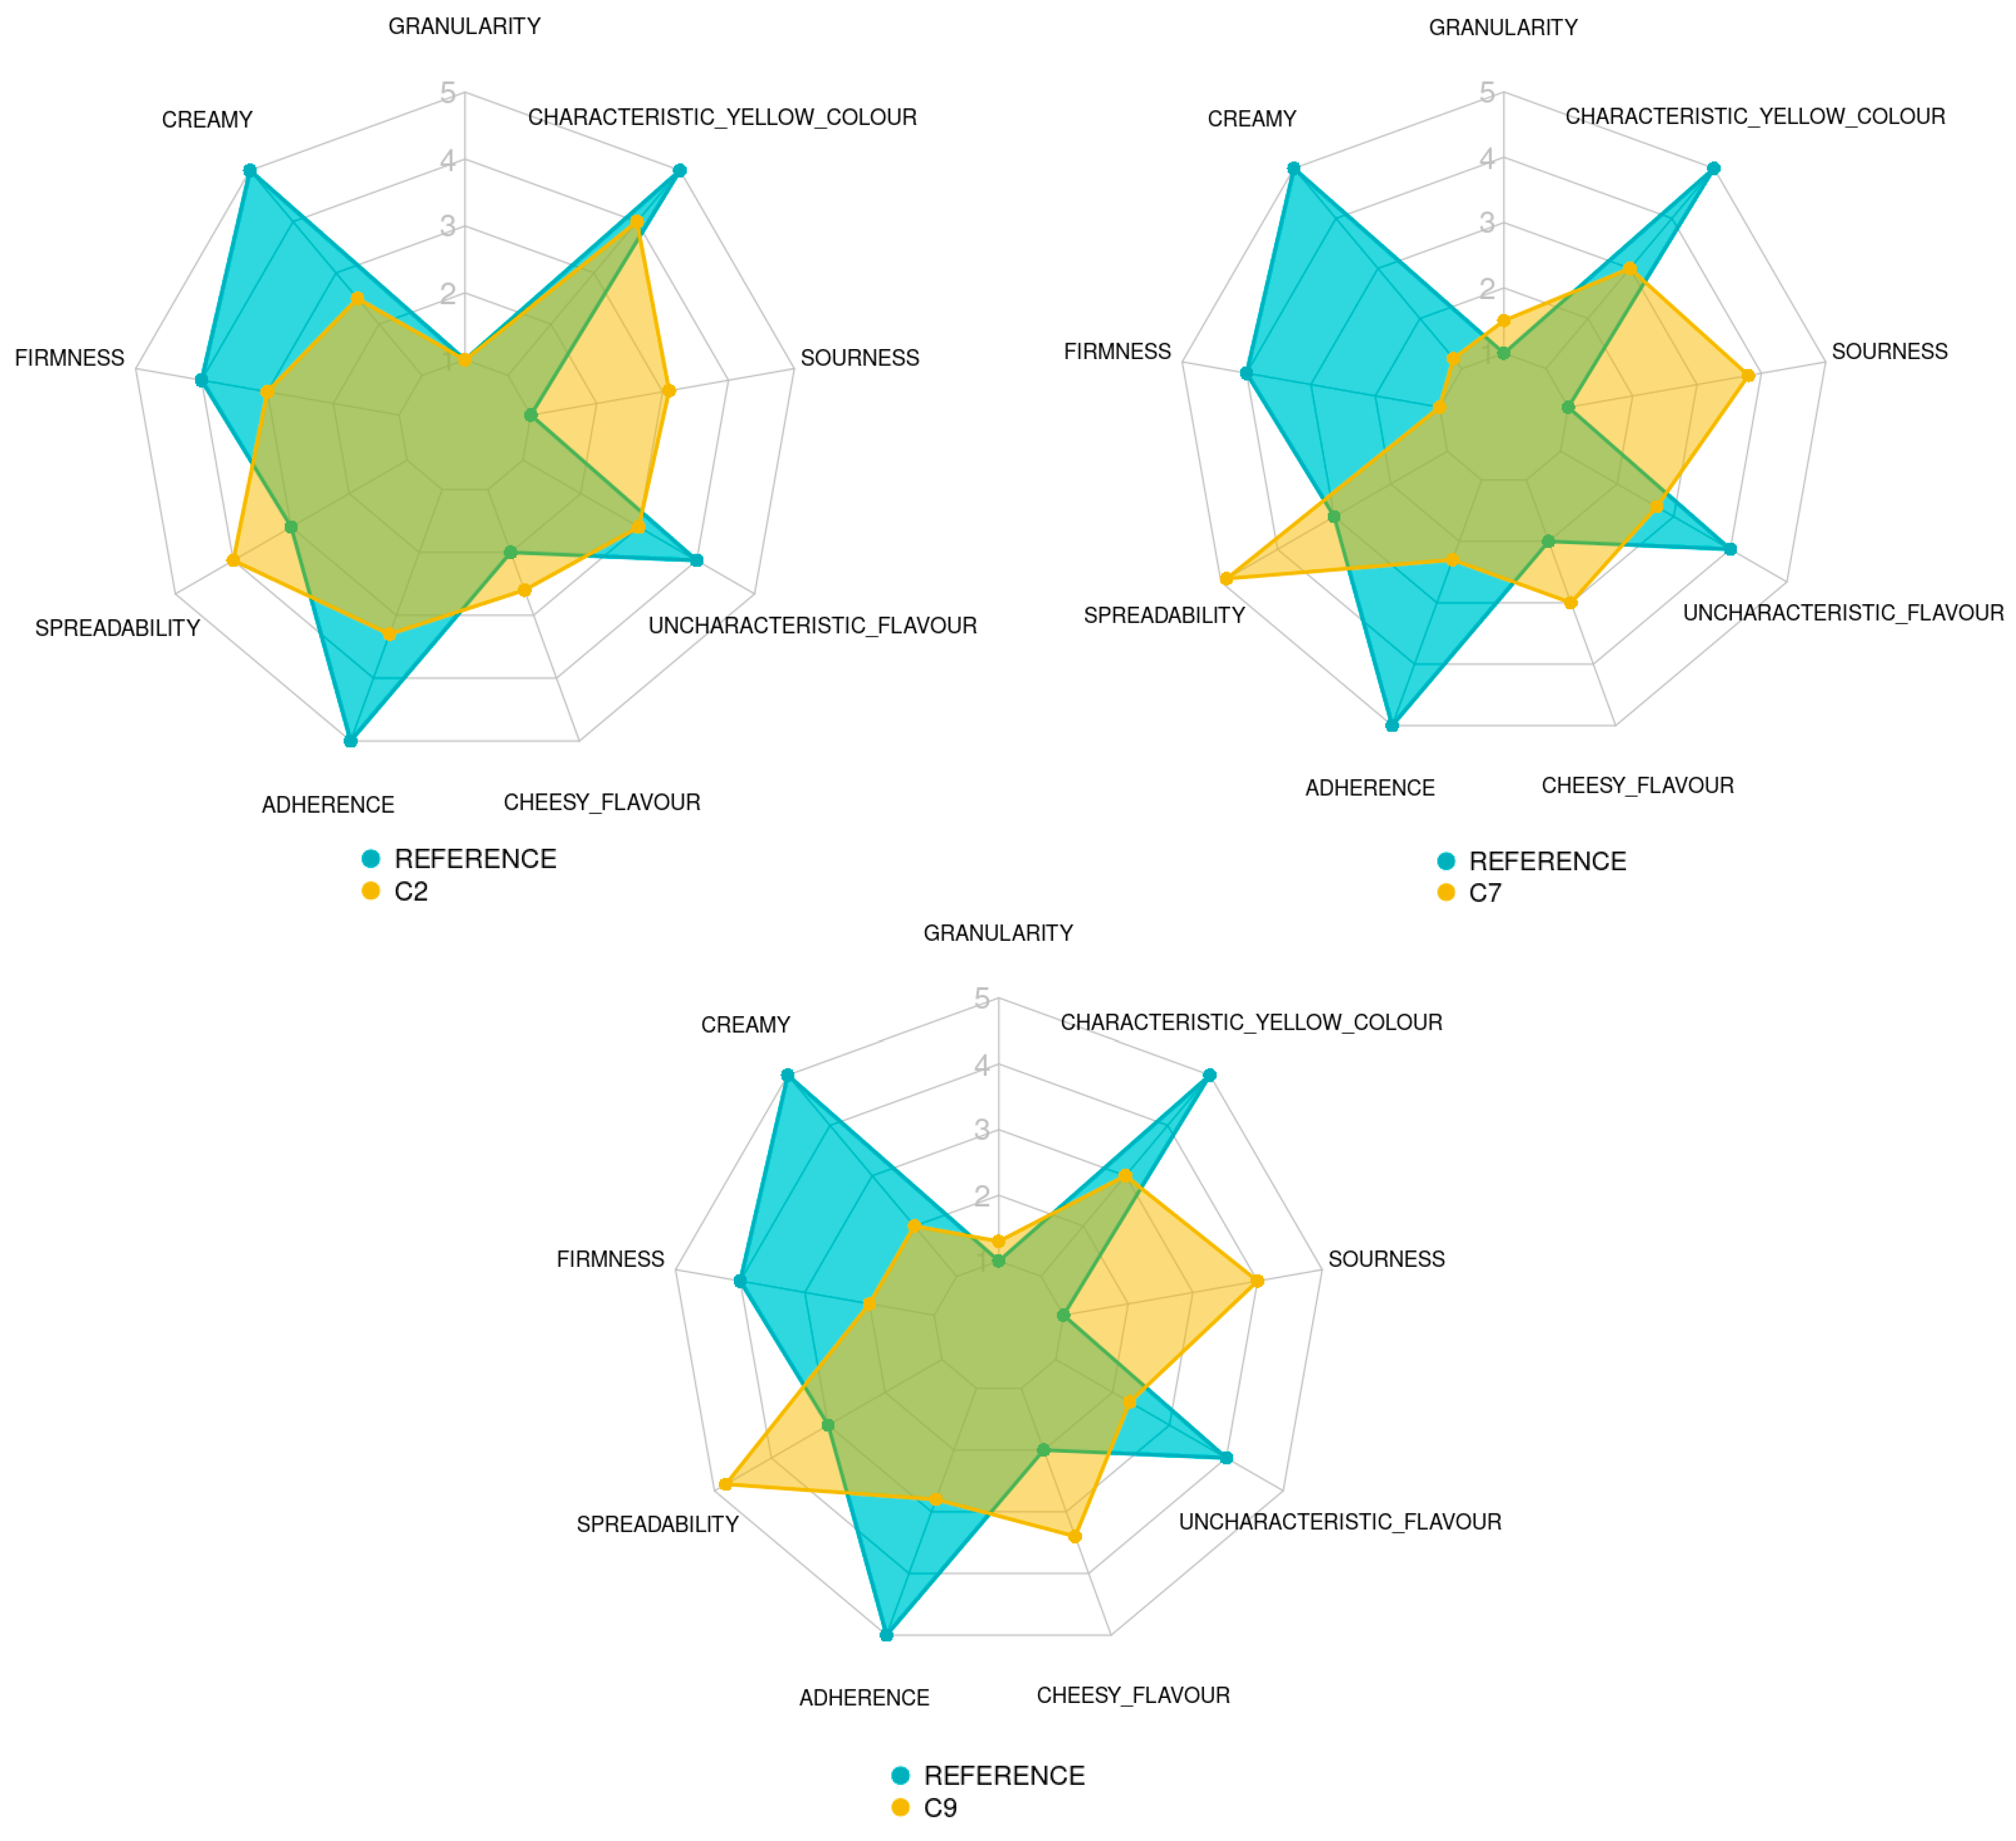
| Descriptors | Reference | C2 | C7 | C9 | F-Value | p-Value |
|---|---|---|---|---|---|---|
| Granularity | 1.0 a ± 0.0 | 1.0 a ± 0.0 | 1.60 b ± 0.6 | 1.35 ab ± 0.5 | 6.26 | 0.00157 ** |
| Creaminess | 5.0 a ± 0.0 | 2.5 b ± 0.5 | 1.3 d ± 0.4 | 2.0 c ± 0.0 | 259.30 | <2 × 10⁻¹⁶ *** |
| Firmness | 4.0 a ± 0.0 | 3.0 b ± 0.0 | 1.25 d ± 0.3 | 2.0 c ± 0.0 | 825.0 | <2 × 10⁻¹⁶ *** |
| Spreadability | 3.0 a ± 0.0 | 4.0 b ± 0.0 | 4.85 c ± 0.3 | 4.7 c ± 0.4 | 120.70 | <2 × 10⁻¹⁶ *** |
| Adherence | 5.0 a ± 0.0 | 3.35 b ± 0.4 | 2.35 d ± 0.4 | 2.9 c ± 0.5 | 94.91 | <2 × 10⁻¹⁶ *** |
| Cheesy flavour | 2.0 a ± 0.0 | 2.6 b ± 0.5 | 3.0 bc ± 0.2 | 3.4 c ± 0.5 | 26.75 | 2.82 × 10⁻⁹ *** |
| Uncharacteristic flavour | 4.0 a ± 0.0 | 3.0 b ± 0.0 | 2.65 bc ± 0.3 | 2.35 c ± 0.5 | 45.78 | 2.26 × 10⁻¹² *** |
| Sourness | 1.0 a ± 0.0 | 3.1 b ± 0.3 | 3.7 c ± 0.4 | 3.85 c ± 0.2 | 246.70 | <2 × 10⁻¹⁶ *** |
| Characteristic colour | 5.0 a ± 0.0 | 4.0 b ± 0.0 | 2.95 c ± 0.2 | 3.0 c ± 0.0 | 1508.0 | <2 × 10⁻¹⁶ *** |
Disclaimer/Publisher’s Note: The statements, opinions and data contained in all publications are solely those of the individual author(s) and contributor(s) and not of MDPI and/or the editor(s). MDPI and/or the editor(s) disclaim responsibility for any injury to people or property resulting from any ideas, methods, instructions or products referred to in the content. |
© 2023 by the authors. Licensee MDPI, Basel, Switzerland. This article is an open access article distributed under the terms and conditions of the Creative Commons Attribution (CC BY) license (https://creativecommons.org/licenses/by/4.0/).
Share and Cite
Garcia-Fontanals, L.; Llorente, R.; Valderrama, J.; Bravo, S.; Talens, C. Hybrid Spreadable Cheese Analogues with Faba Bean and Mealworm (Tenebrio molitor) Flours: Optimisation Using Desirability-Based Mixture Design. Foods 2023, 12, 1522. https://doi.org/10.3390/foods12071522
Garcia-Fontanals L, Llorente R, Valderrama J, Bravo S, Talens C. Hybrid Spreadable Cheese Analogues with Faba Bean and Mealworm (Tenebrio molitor) Flours: Optimisation Using Desirability-Based Mixture Design. Foods. 2023; 12(7):1522. https://doi.org/10.3390/foods12071522
Chicago/Turabian StyleGarcia-Fontanals, Laura, Raquel Llorente, Juanjo Valderrama, Sergio Bravo, and Clara Talens. 2023. "Hybrid Spreadable Cheese Analogues with Faba Bean and Mealworm (Tenebrio molitor) Flours: Optimisation Using Desirability-Based Mixture Design" Foods 12, no. 7: 1522. https://doi.org/10.3390/foods12071522