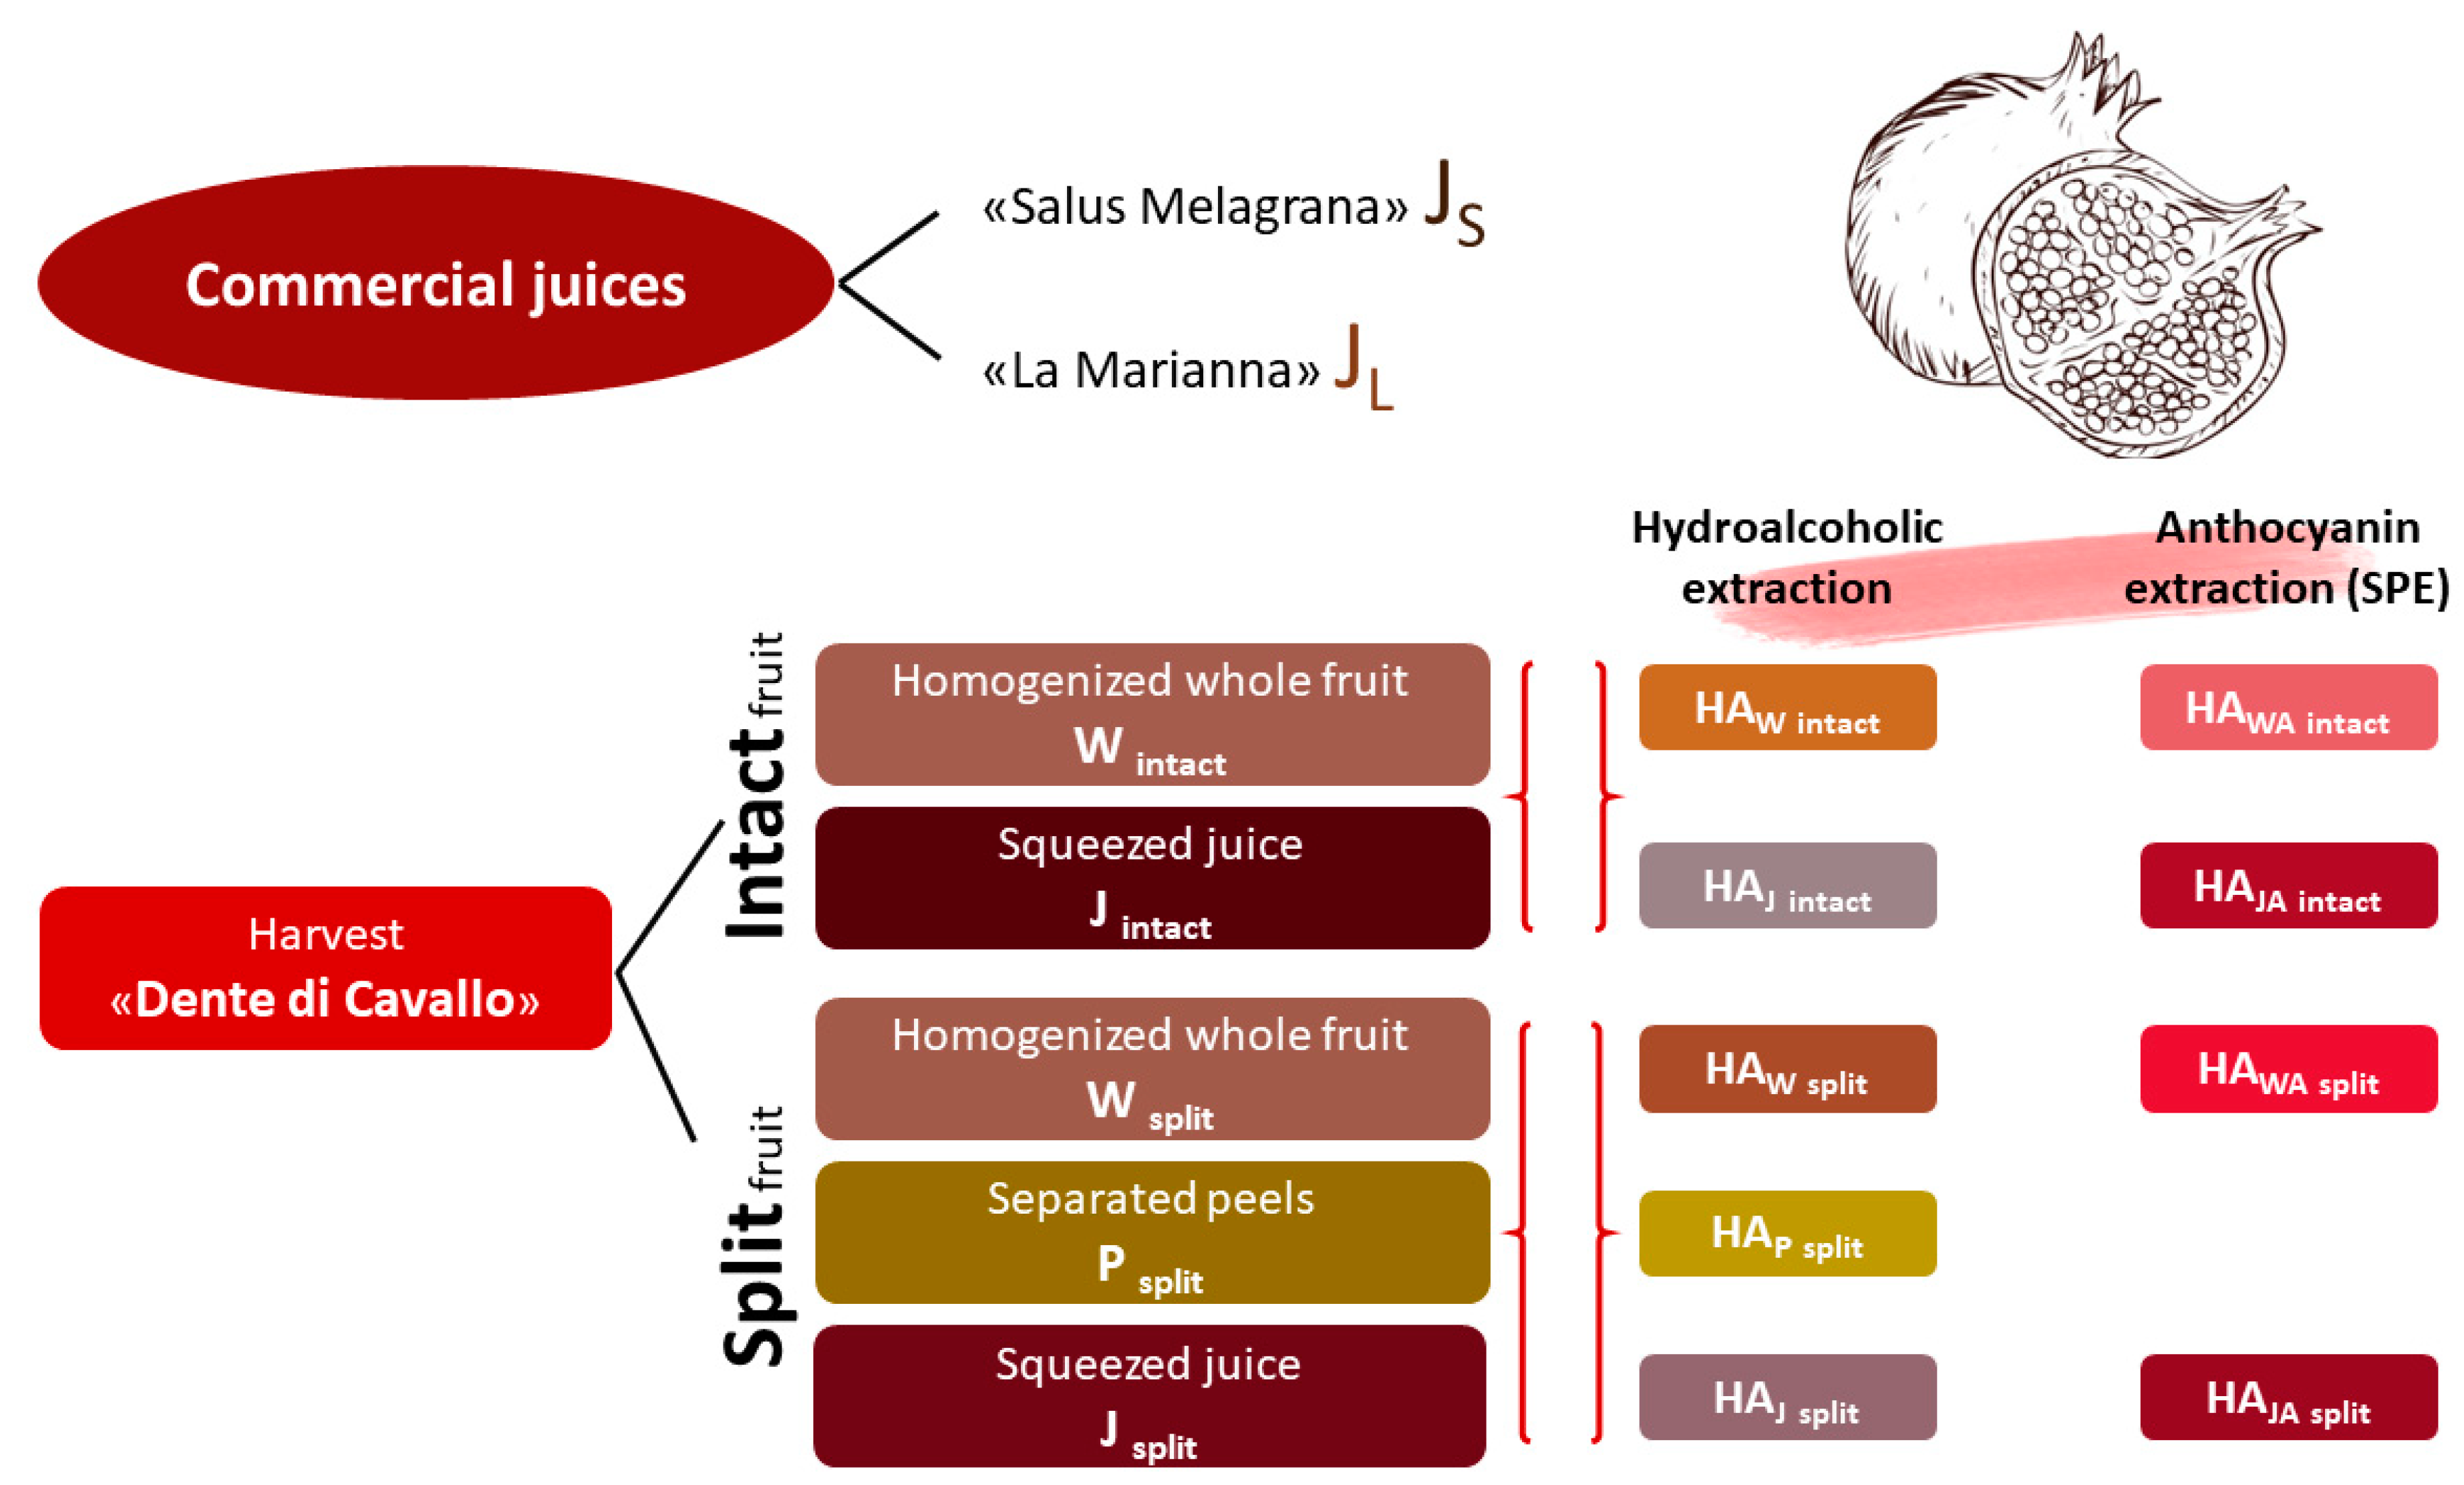
3.1. Polyphenols Extraction
Split and intact whole fruits and separated peels were homogenized (W and P) or squeezed (J). The resulting homogenates and juices were submitted to a mild extraction method as previously reported in the Materials and Methods section (HA
W, HA
P and HA
J). The hydroalcoholic extraction yield ranged from 10% to 12% by dry weight in HA
W and HA
P accounting for the sugar content and not directly correlated to the polyphenolic content, as detailed below by HPLC analyses. The extraction yields afforded by starting from HA
J showed higher ranges, between 15–16%, accounting for the more concentrated sugar content and soluble fibers of the edible part with respect to the peels represented in the whole fruits. No significant differences were shown among extracts from split or intact fruits and, on the whole, data are comparable with our previously obtained results on different pomegranate cultivars [
9,
13].
Considering the extraction yields related to the solid phase extraction (SPE) of anthocyanins by the hydroalcoholic extracts, yields ranging from 1.1 to 2.8% were obtained. In any case, these are only indicative because, as the anthocyanins were concentrated and made perceptible using HPLC-DAD analysis, other polyphenols and flavonoids were still present. The highest yields of SPE extracts were shown in samples obtained from split fruits (HAWA split, 2.8%; HAJA split, 1.7%) and effectively correlated with the higher anthocyanin amount found using HPLC-DAD analysis.
3.2. Colorimetric Analysis
As is well known, different pigments deeply characterize pomegranate fruit components. Anthocyanins, contained in arils, confer a brilliant red color, and yellow-brown ellagitannins are represented in both the arils and peels, contributing to or determining their color [
14].
The W
intact, W
split, J
intact, J
split, HA
W intact, HA
W split, HA
J intact, HA
J split, HA
P split, J
S and J
L samples were submitted to colorimetric CIEL*a*b* analysis. The J
S and J
L juices were further submitted to a shelf-life study, and the color differences were monitored over time. The CIEL*a*b* parameters are reported in
Table 1.
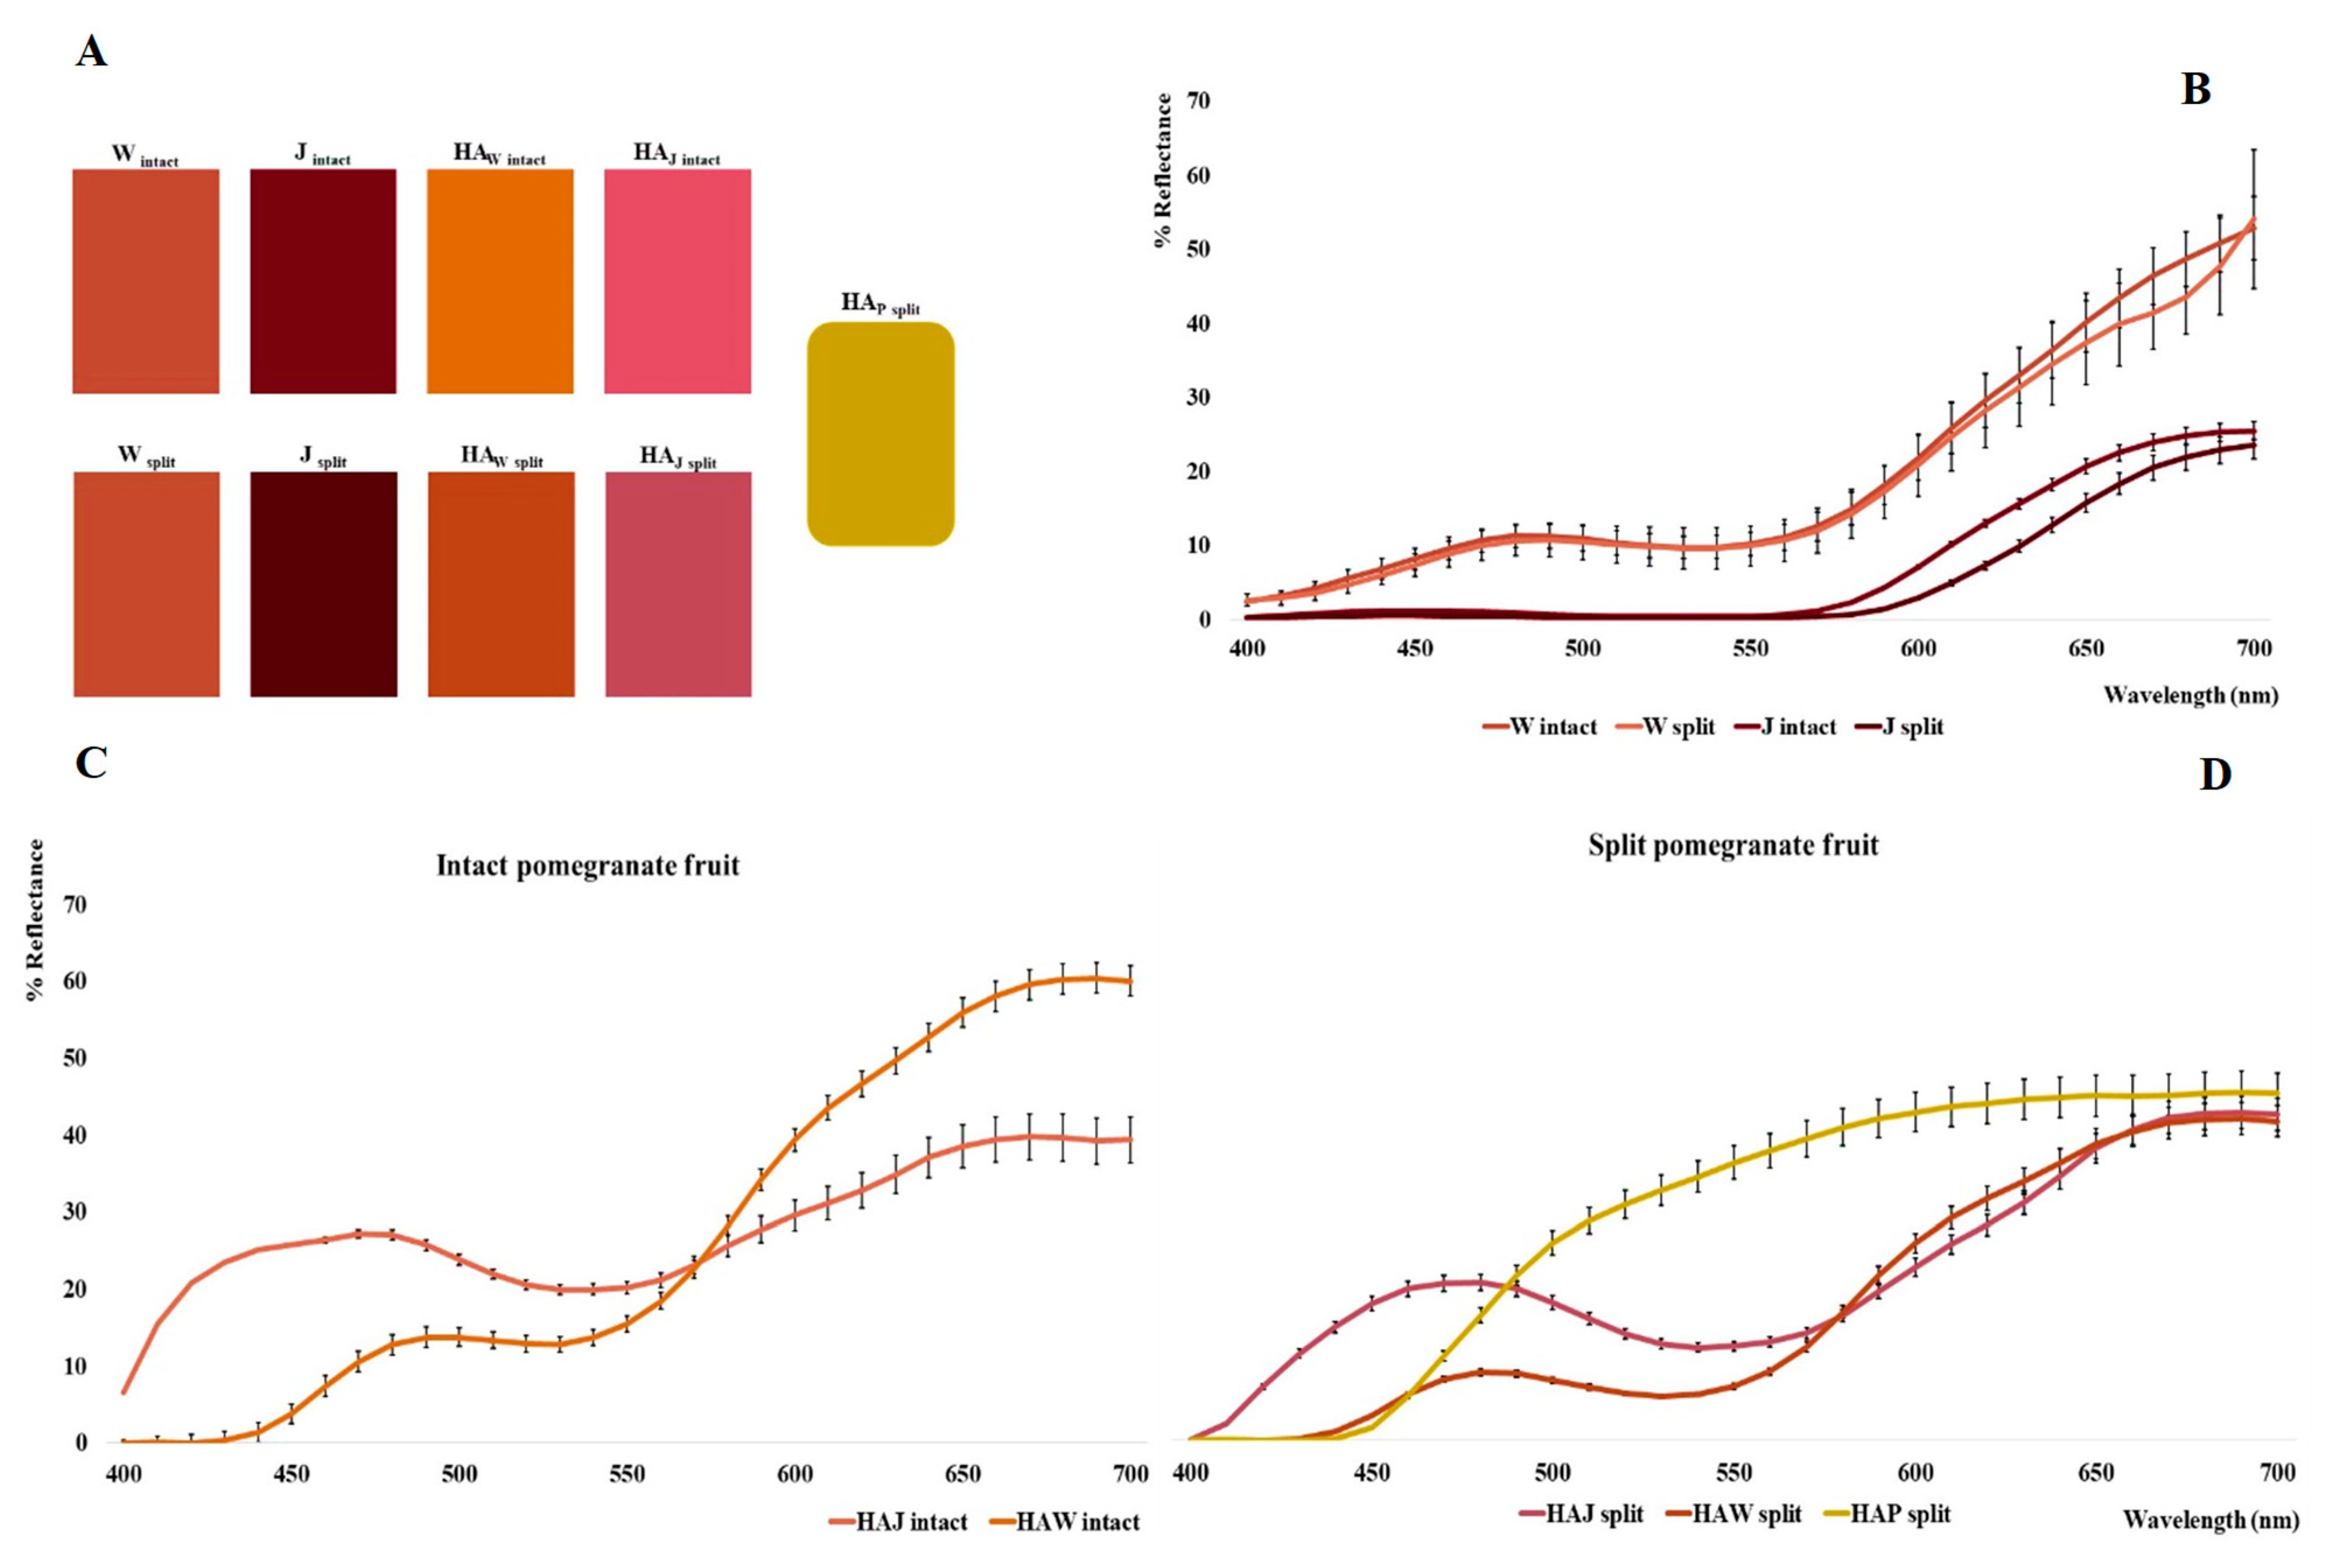
With regard to the homogenized samples (W intact and W split) and juices (J intact, J split, JS and JL), the L* parameter varies between 12.41 and 44.58, a* between 11.00 and 38.26 and b* between 15.29 and 31.81.
Specifically, there is no statistically significant difference (
Figure 2B) between samples W
intact and W
split (ΔE = 5.32), and only a slight difference is observed between J
intact and J
split (ΔE = 7.86). This mainly concerns the range between 600 and 650 nm, where J
split shows a lower reflectance curve, probably due to a higher concentration of anthocyanin pigments. In fact, while the CIEL*a*b* parameters are similar in the W series (L*, 44.58 vs. 43.63; a*, 21.20 vs. 20.99; b* 17.90 vs. 19.06), in the J series, in addition to an increase in L* (12.41 rises to 19.51), a significantly higher value of a* is also observed (34.35 rises to 38.26).
In the hydroalcoholic samples (HA
W intact, HA
W split, HA
J intact, HA
J split, HA
P split), L* values ranged between 41.39 (HA
W split) and 63.96 (HA
P split), showing the highest luminance values compared to W and J before the extraction step. In this regard, as indicated from the color palette shown in
Figure 2A, it is possible to observe a brighter and more brick red color for HA
W samples than for W samples, with a greater difference for HA
W intact (ΔE = 31.65) with respect to HA
W split (ΔE = 21.36). Conversely, HA
J samples present a lighter and more opaque reddish color than the intense mahogany coloration of the J samples, being more pronounced in HA
J intact (ΔE = 53.14) with respect to HA
J split (ΔE = 43.09). Completely different coloration is obviously presented by the HA
P sample from the peels, which tends towards dark yellow.
In addition, the a* parameter drops to −1.66 in HA
P split and rises to 28.86 in HA
W split, whereas the b* parameter varies deeply between 0.29 (HA
J intact) and 62.59 (HA
P split). Tendentially, the a* and b* parameters are always higher in the split series, with the exception of HA
W split (32.11 vs. 48.14). This difference could be related to a higher concentration of pigments (both anthocyanins and ellagitannins) in split samples than in intact ones. It is also observed that the a*/b* ratios in the HA
J series are higher than in the HA
W and HA
P series, in relation to a higher anthocyanin content with respect to ellagitannins (see also the HPLC-DAD analysis). Conversely, the higher yellow positive b* parameter could be associated with ellagitannins [
15].
The highest value of b* is found in HA
P split, richer in ellagitannins as further demonstrated by the HPLC-DAD analysis. This also correlates with reflectance curves shown by
Figure 2C,D. Indeed, the curves related to the hydroalcoholic extracts of the split pomegranates compared with the intact samples are lower in the region around 650 nm. In particular, there is a marked 19% decrease in reflectance for HA
W split, and a slight decrease (about 2%) for HA
J split, confirming the pigment’s prevalence in the split samples; this behavior is evident in the redder juice samples obtained by squeezing, due to the high anthocyanin content represented in pomegranate arils [
16,
17]. The present data are partially comparable with those reported in the literature [
13].
Figure 3A,B shows the reflectance curves related to the shelf-life study conducted on J
S and J
L juices kept at 40 °C for five weeks. Regarding J
S, a color change is observed after the first week, and it remains constant until the third week, when a bleaching phenomenon is observed. On the contrary, around the fourth and fifth weeks, a darkening is observed, probably associated with a higher concentration of ellagitannins (see also HPLC data). A substantially different trend is registered for J
L. In fact, darkening is found in the first week, followed by bleaching until the third week, and then darkening again around the fifth week.
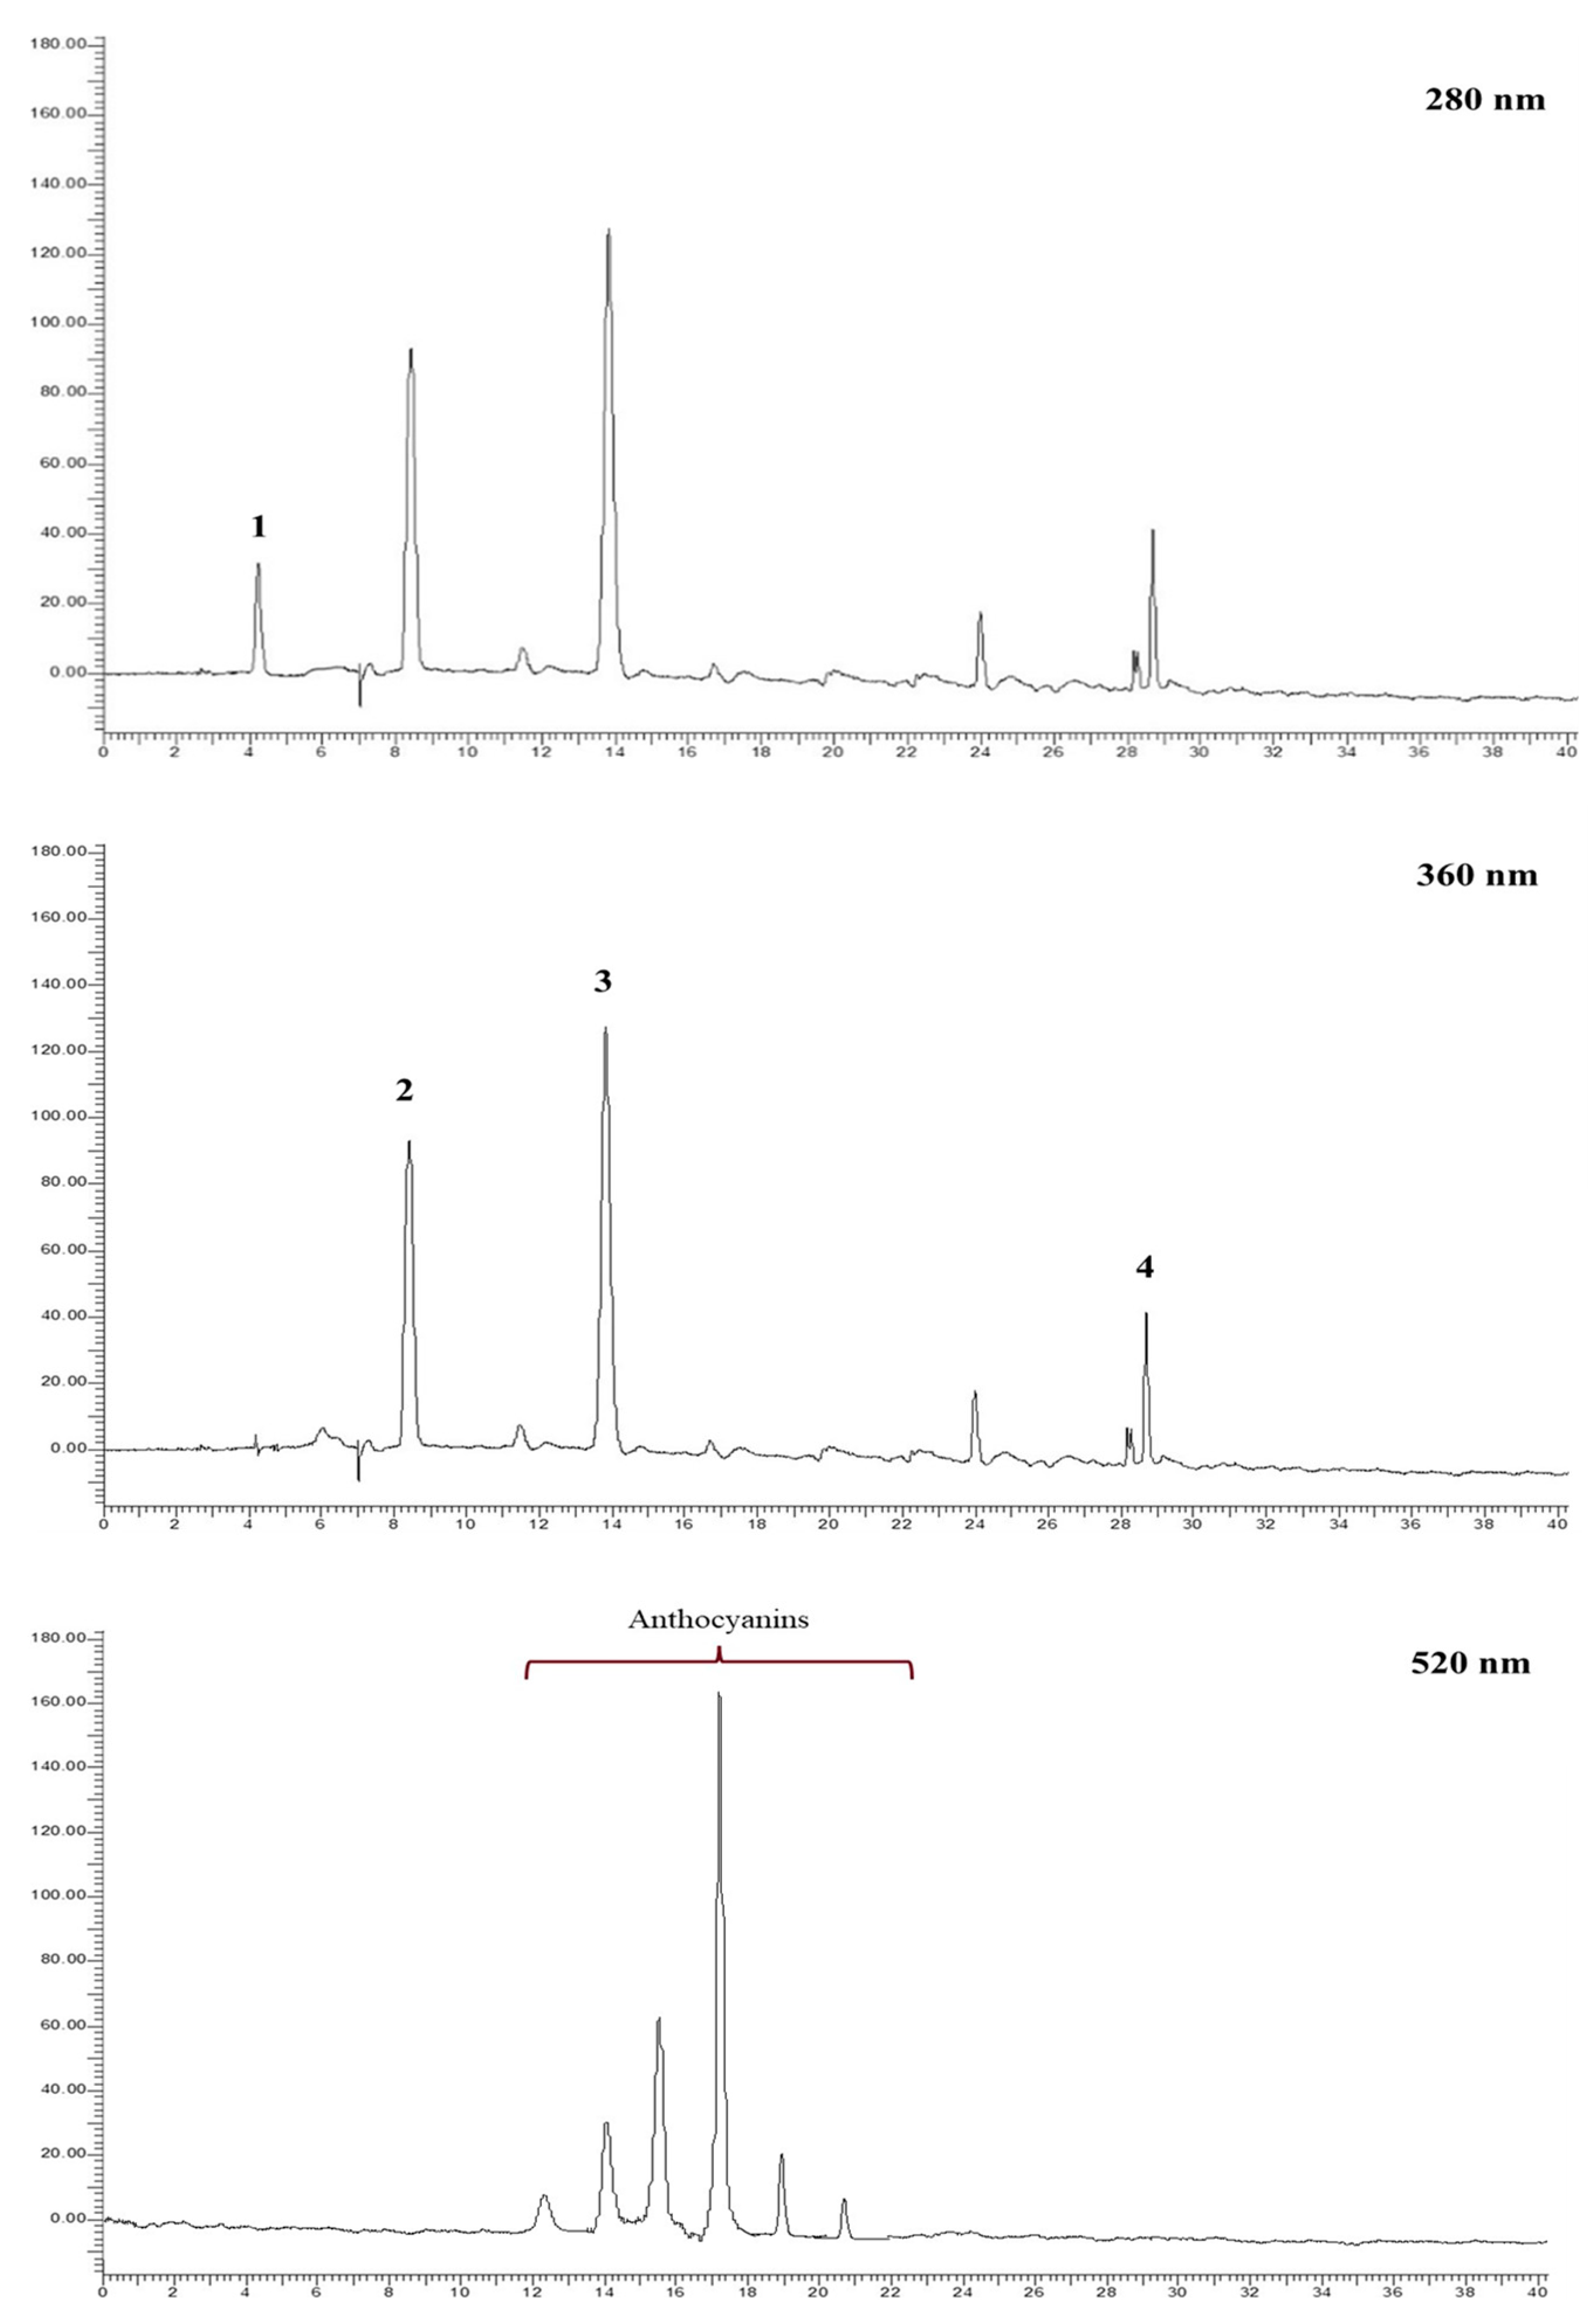
3.3. HPLC-DAD Analysis
The different hydroalcoholic extracts obtained from pomegranate fruits of “Dente di Cavallo” and the two related commercial juices were subjected to HPLC-DAD analysis. The analyses were performed at 280 nm for the identification of phenolic acids, at 360 nm for the identification of the ellagitannin profile, mainly represented by punicalagin (α + β) and ellagic acid, and at 520 nm for the identification of the anthocyanins. Compounds were identified by external standard or by comparison with the literature [
18,
19]. As anthocyanins were not directly detectable from these extracts, they were analyzed after a further step of solid phase extraction, which made it possible to concentrate and quantify these pivotal compounds as well. Examples of chromatograms related to the HA
W split and HA
WA split samples are shown in
Figure 4.
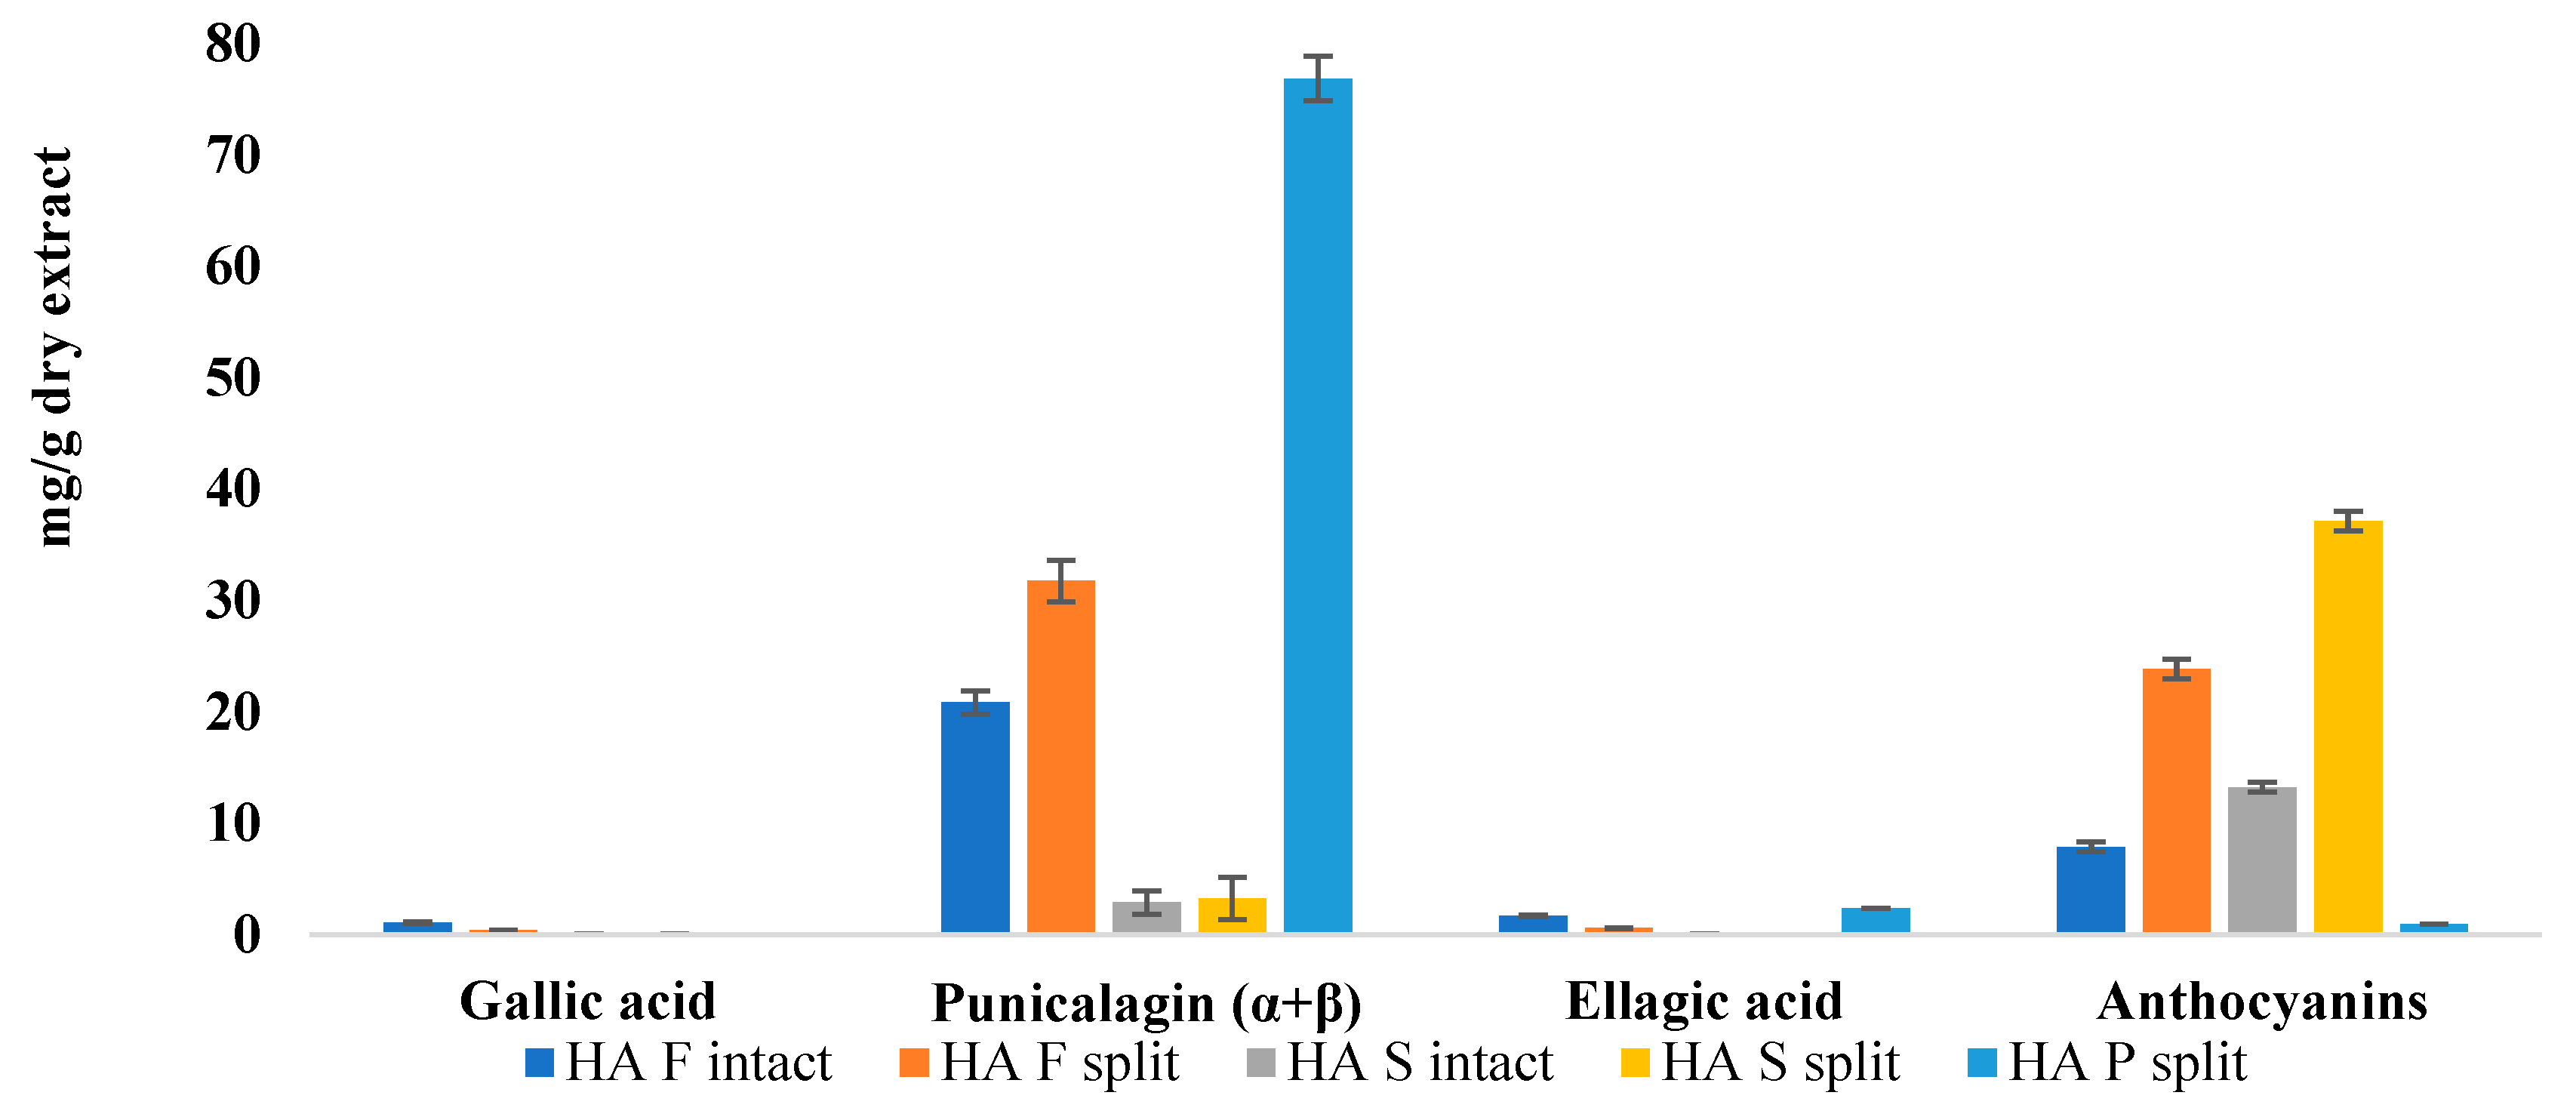
The quantification of ellagitannins, reported as mg/g dry extract (
Table 2), evidenced relevant differences in the range of 3–17 mg/g dry extract by juices, 21–32 mg/g dry extract by whole fruits, up to the maximum amount (77 mg/g dry extract) in the peel. Very low values were found for juices, with the exception of J
S (17 mg/g by dry extract). In fact, significant differences could be seen among the three applied work-up methodologies. Juices obtained by simple pressing of the fruit (HA
J, both from intact and split fruits, and J
L) show very low values of punicalagin and only in the case of J
L a very slight amount of ellagic acid (<0.1 mg/g dry extract). On the contrary, in J
S obtained by compression of the whole fruit, values of punicalagin and ellagic acid (17 and 1 mg/g dry extract, respectively) comparable to those recorded in the whole fruit were shown. The anthocyanin amount, yielded in relation to hydroalcoholic extracts, as well as quantified in SPE extracts, on the other hand, varied among 1 and 37 µg/g dry HA extract, reaching maxima in juice-related extracts. Anthocyanins were not detected in the J
S and J
L samples. The reported data agree with our previous work [
9].
Further considerations were made by analyzing extracts from the intact or split fruit. As shown in
Figure 5, the amount of ellagitannins, especially punicalagins, and anthocyanins appears to be higher in extracts from split fruits with respect to intact fruits. This information is very interesting, as it is related to the fact that ripening and storage can influence the matrix phytocomplex [
20,
21]. Such evidence could confirm what was observed in the colorimetry, as lower reflectance curves of split samples correspond to higher concentrations of ellagitannins and anthocyanins.
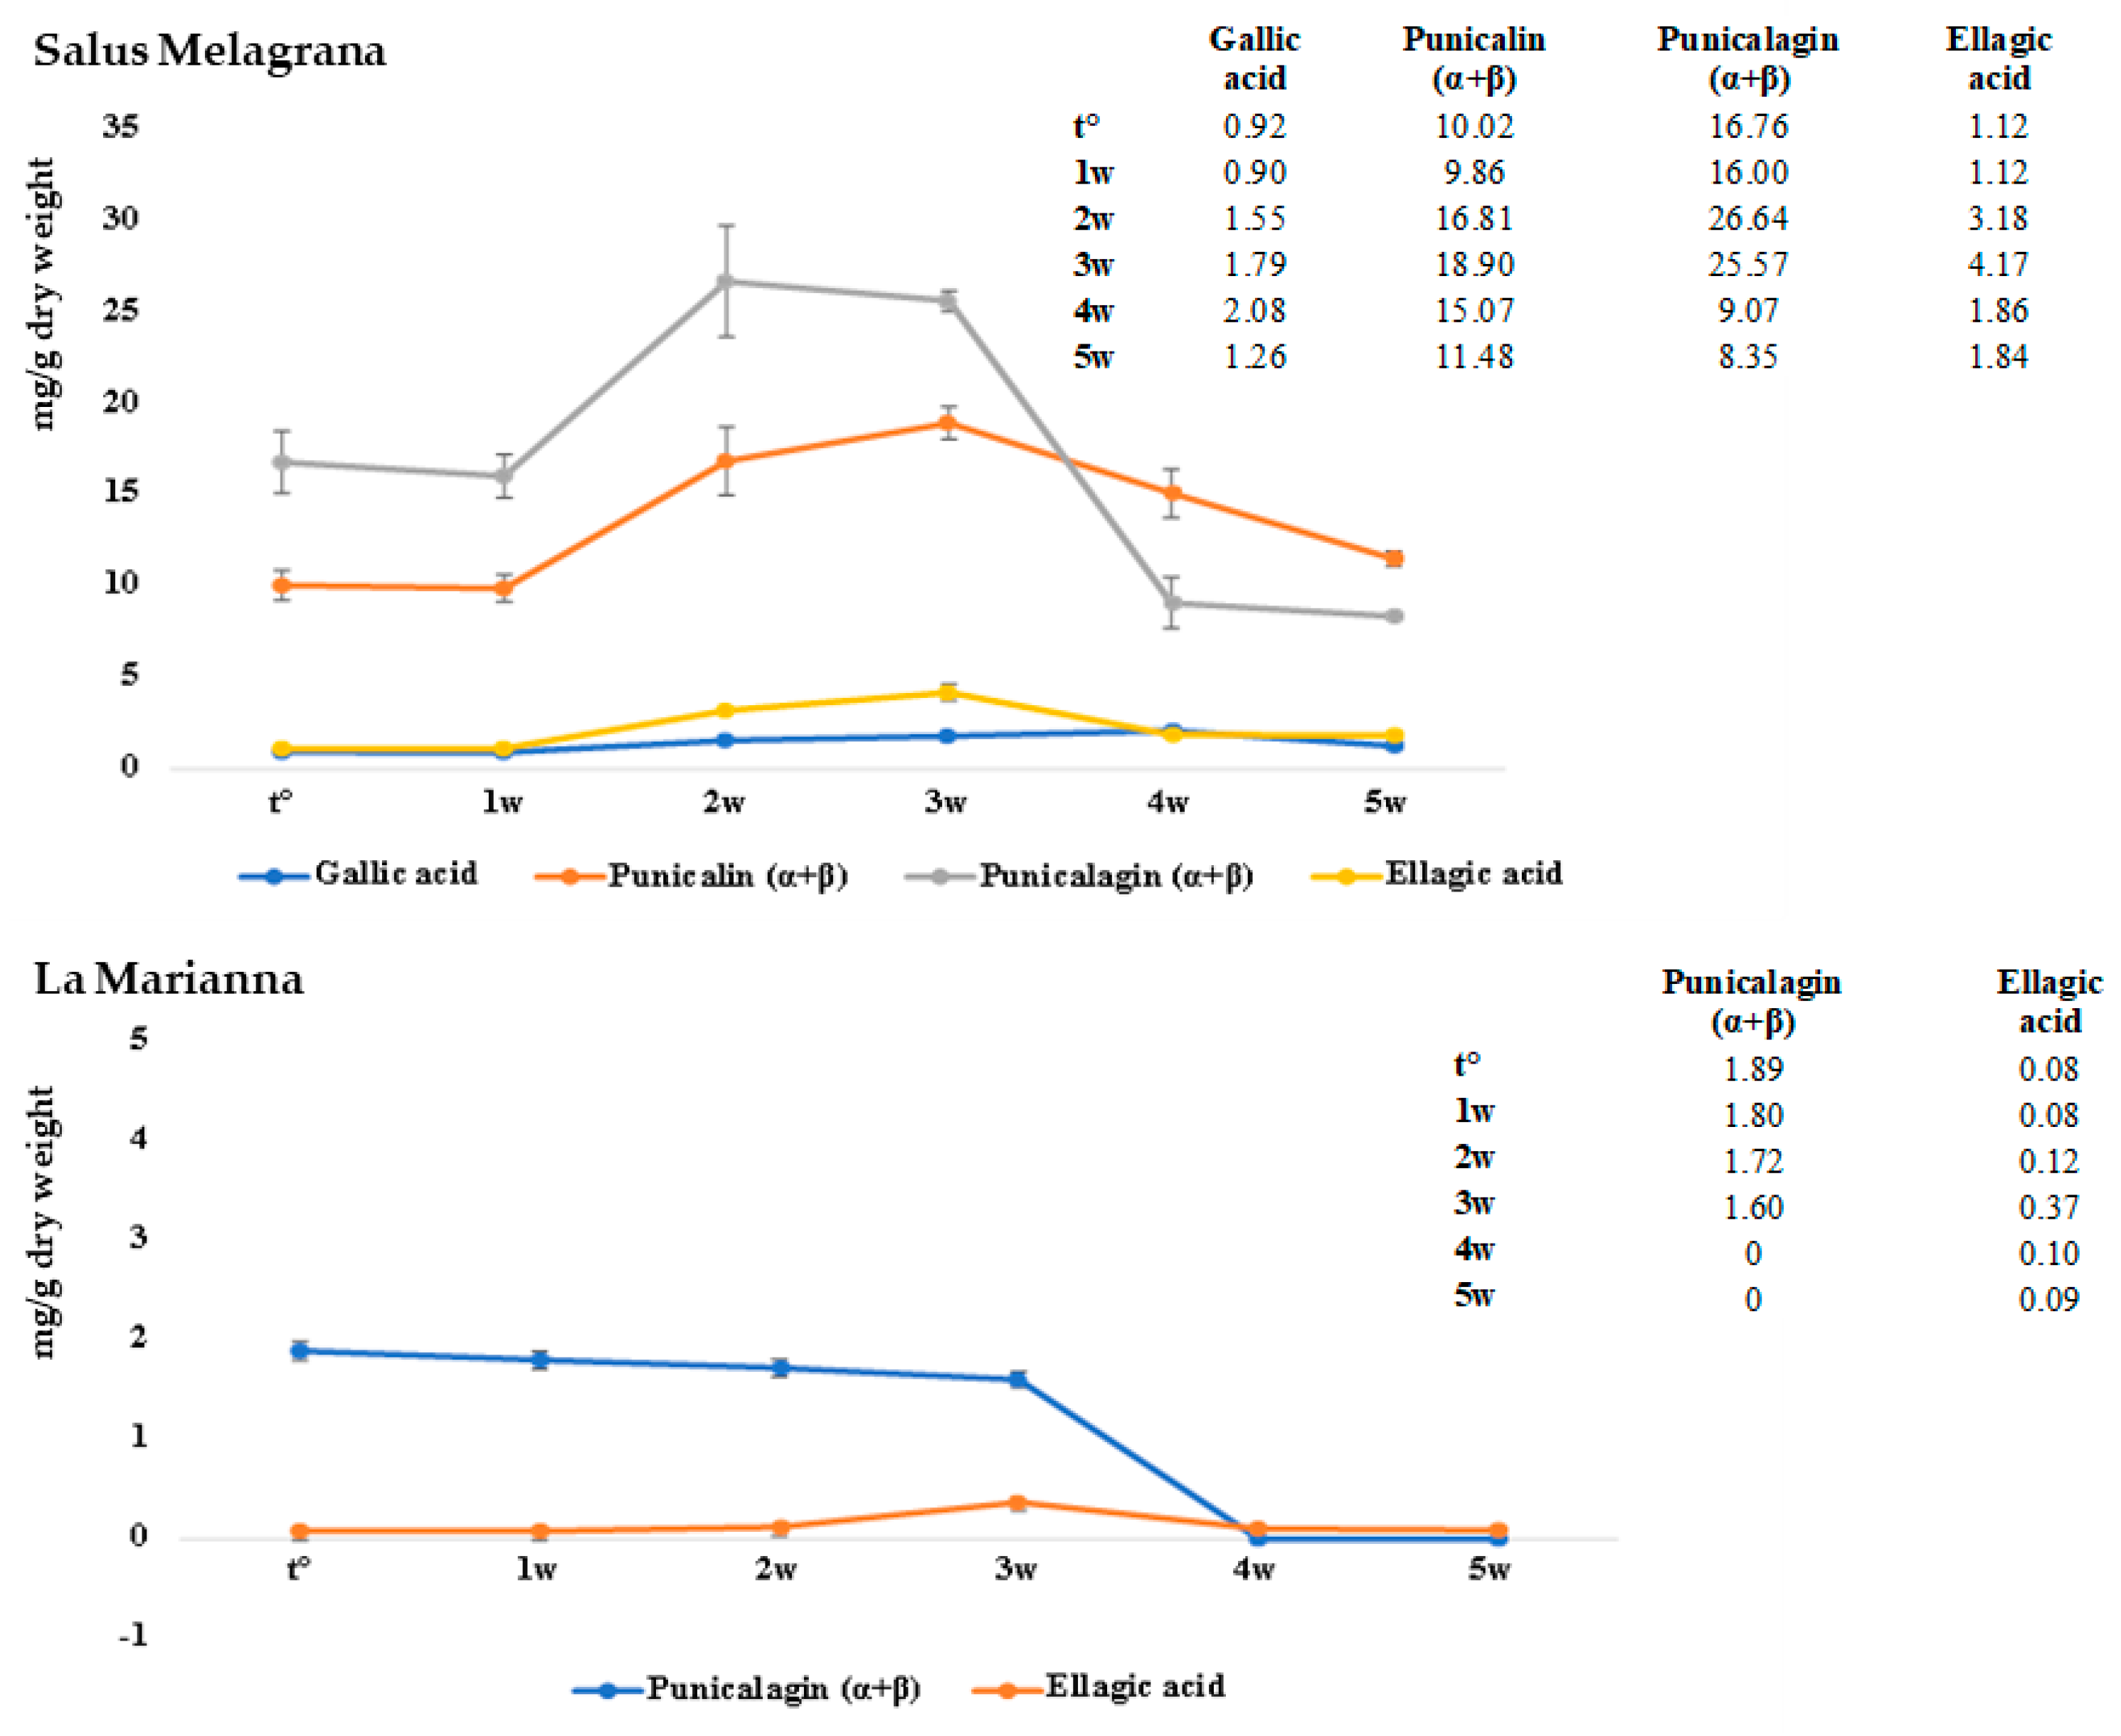
The shelf-life study was conducted by storing the samples at 37 °C for 5 weeks and evaluated using both colorimetric and HPLC-DAD analyses. As shown in
Figure 6, in both J
S and J
L, a slight increase in ellagic acid was observed in the first two weeks, and a decrease was observed until the stabilization observed at around five weeks.
With regard to punicalagin, whereas in JL there is a sharp drop after three weeks, in JS there is a slight decrease in the first weeks and then it stabilizes around four to five weeks at lower values with respect to the t°. At the same time, punicalin, identified only in JS, increases as punicalagin decreases between the second and third week, coming back to the initial values around five weeks. In conclusion, a decrease in punicalagin could be observed, whereas punicalin and ellagic acid tend to reestablish at the initial values, in an observation period of five weeks at 37 °C. Gallic acid, represented in smaller quantities comparable to those of ellagic acid, appears quite stable for the duration of the whole experiment.
3.4. HS-SPME/GC-MS Analysis
GC-MS is the technique of choice to detect and identify apolar and medium-polarity metabolites arising from vegetable and food matrices [
22,
23]. In the present study, the HS-SPME/GC-MS analysis of split and intact HA
J and HA
W samples made it possible to identify several compounds clustered according to their chemical classification (
Table 3 and
Table 4), and these are reported in
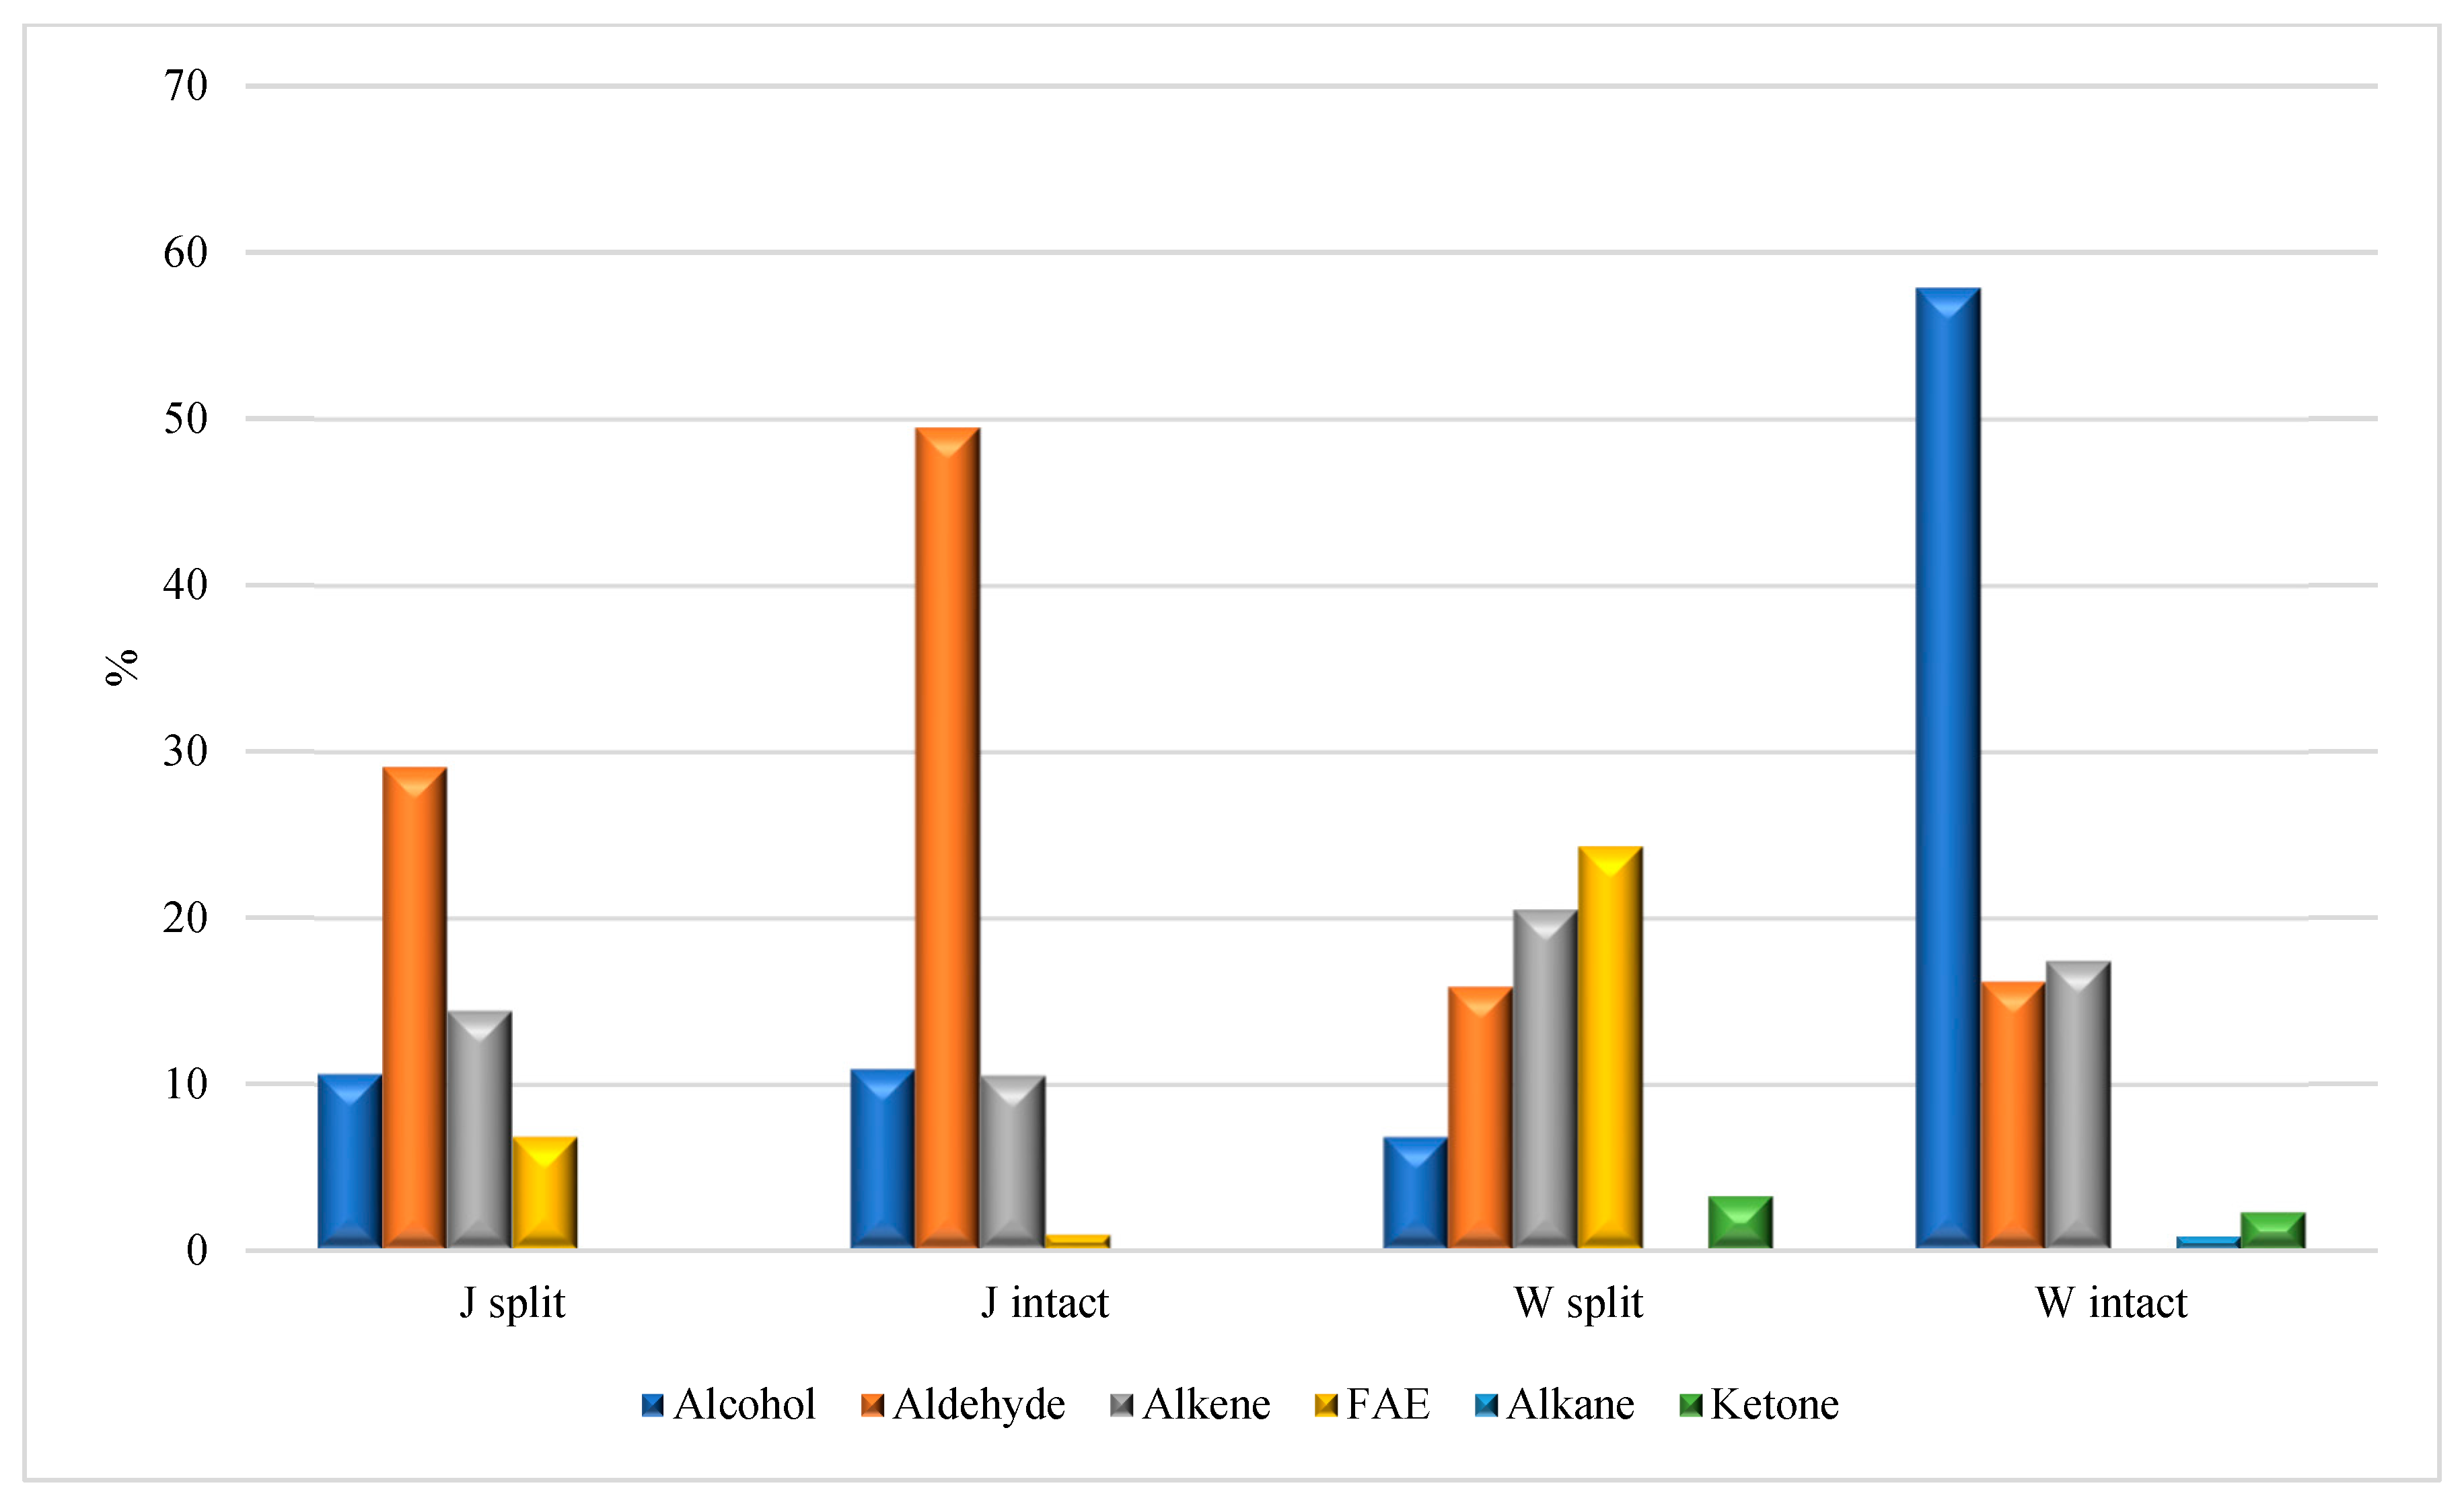
Figure 7. Aldehydes represent the prevalent class of chemicals in the HA
J samples (
Figure 7), with a larger abundance in the HA
J intact, mainly due to the presence of hexanal (not detected in HA
J split), nonanal (6.4 vs. 11.2% in HA
J split and HA
J intact, respectively) and decanal (7.2 vs. 12.4% in HA
J split and HA
J intact, respectively). The HA
W samples differ mainly due to the abundance of alcohol (6.8 vs. 57.9% in HA
W split and HA
W intact, respectively), which is completely ascribable to the presence of carvacrol in HA
W intact, and the FAE distribution (24.3% in HA
W split but totally absent in HA
W intact). The absence of carvacrol, even in trace amounts, in all the other analyzed samples is a reasonable clue of its presence in the seeds of the pomegranate. A further comparison between the four analyzed samples reveals the following details: (i) the alkene distribution in the four analyzed samples ranges between 10.5 in HA
J intact and 20.5 in HA
W split; (ii) the FAE class was detected in the HA
J split and HA
W split samples (6.8 and 24.3%, respectively), but was poorly concentrated (0.9%) and absent in HA
J intact and HA
W intact, respectively; (iii) methoxy phenyl oxime, a compound naturally occurring in food matrices but also recognized as a SPME fiber contaminant, was detected in all samples except for HA
W intact [
24,
25]. Lastly, the HS-SPME/GC-MS analysis of the HA
P split (
Table 5 and
Figure 8) pointed to aldehydes as the most abundant class of compounds (66.4%), with nonanal and decanal comprising the largest part (47.3%).
3.5. Enzyme Inhibitory Activity
The HA
W intact, HA
W split, HA
J intact, HA
J split and HA
P split samples were submitted to enzymatic inhibitory activity assays, in an attempt to assess the potential to inhibit three important enzymes with implications in human physiopathology: α-glucosidase, acetylcholinesterase and tyrosinase (
Table 6).
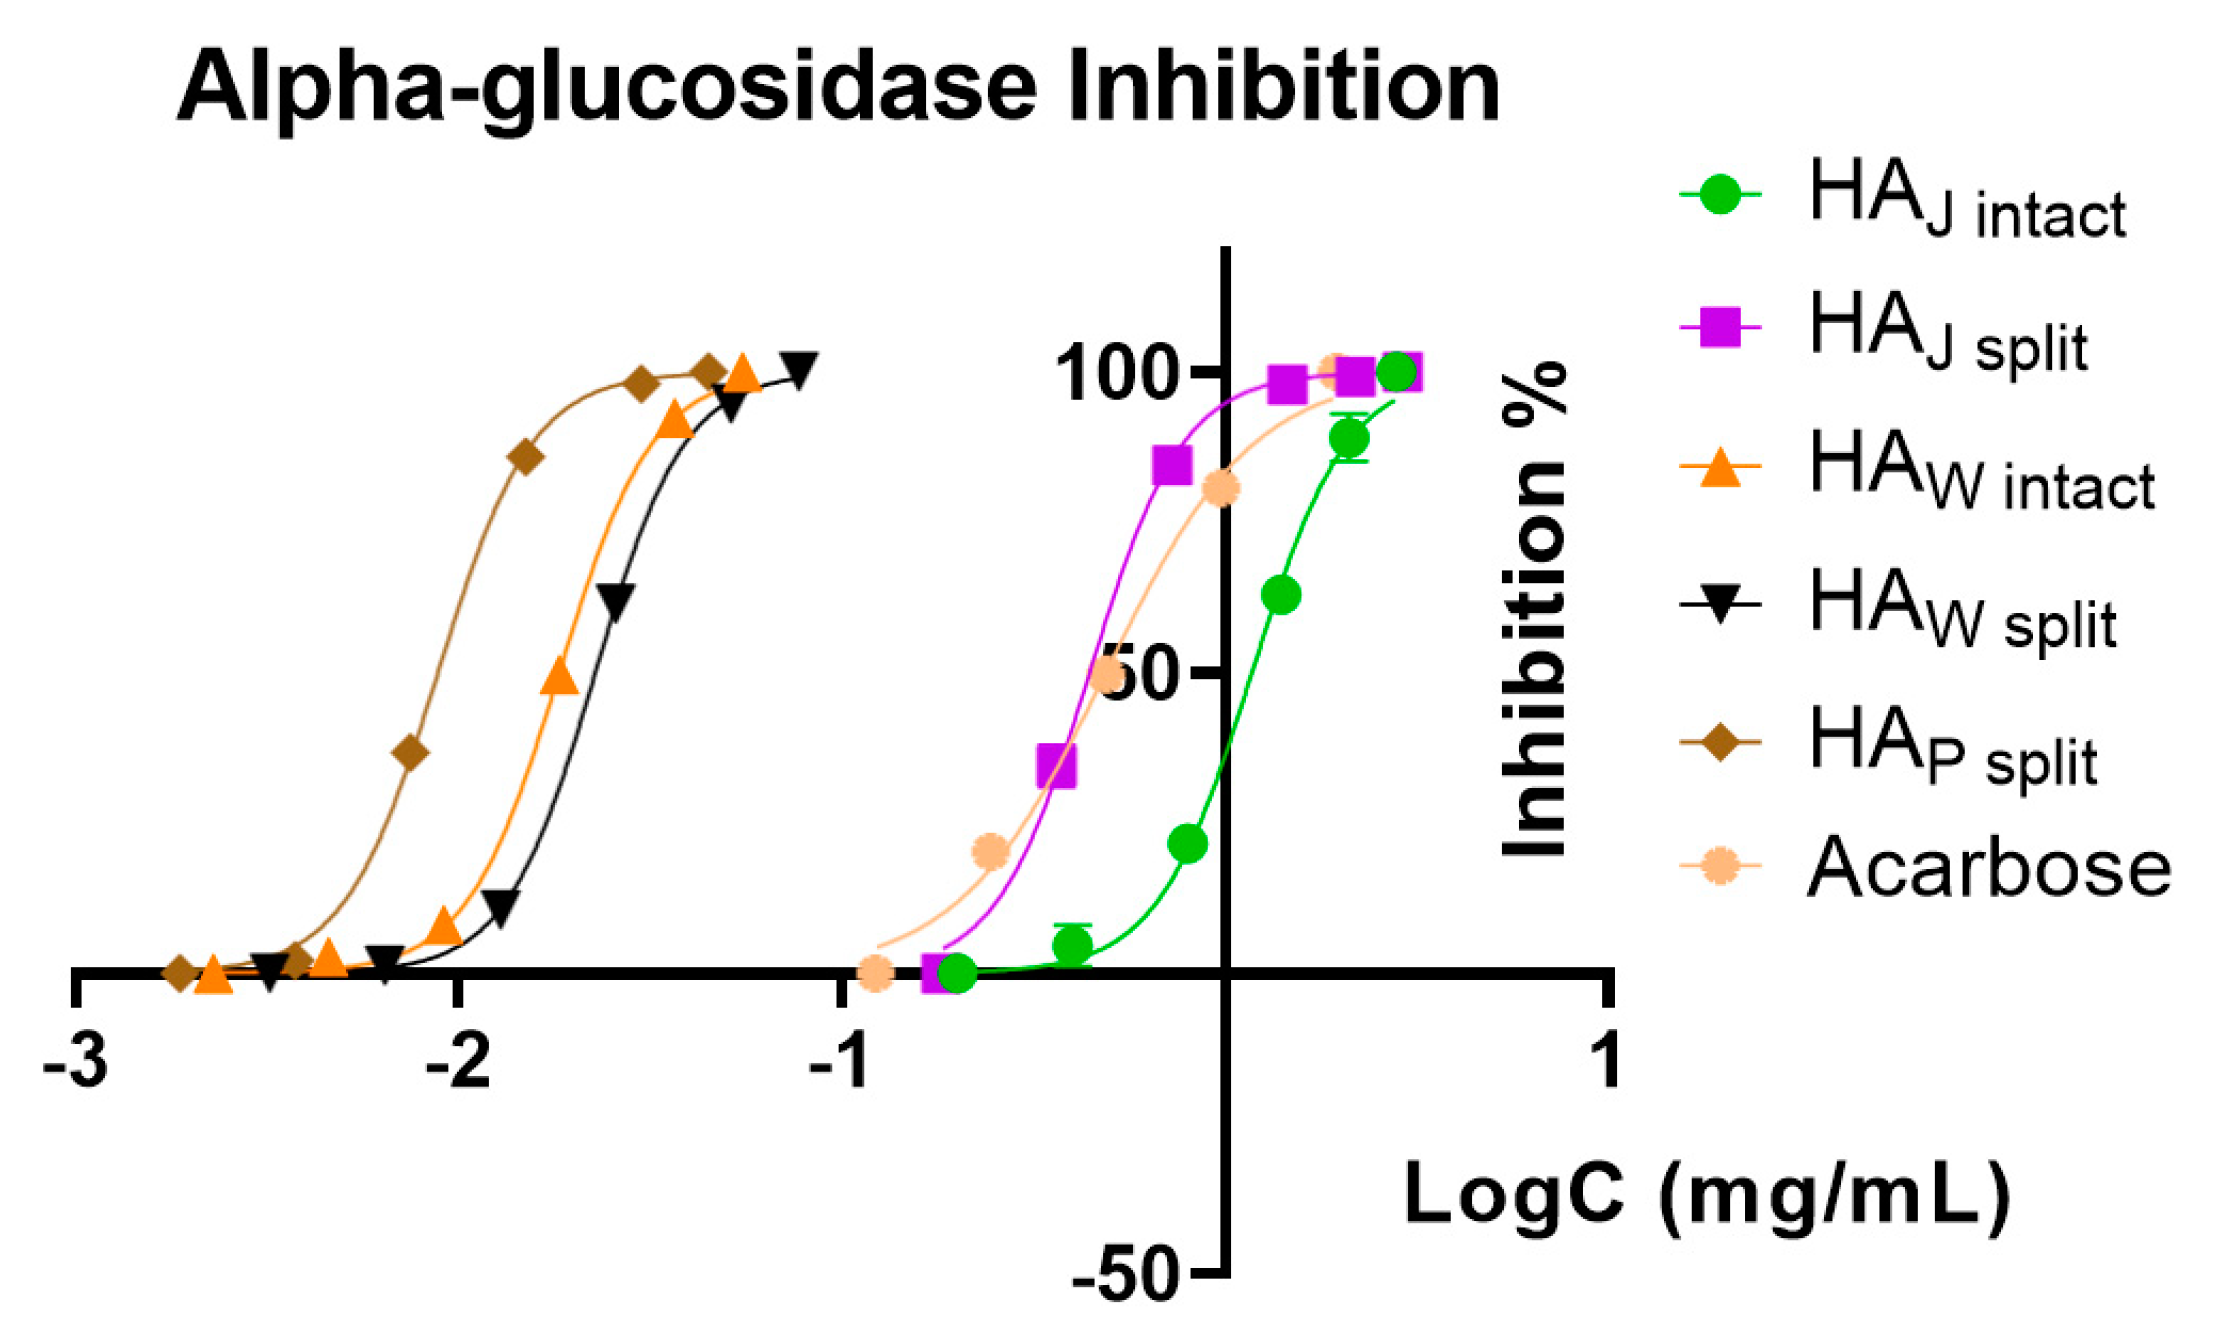
As a general trend, the HA
J intact and HA
J split samples showed the lowest inhibitory activity among all, and for acetylcholinesterase and tyrosinase, we could not determine any activity. In all the samples, the inhibitory activity against acetylcholinesterase and tyrosinase was weak, with values at least 100 times higher than the positive controls used. For the α-glucosidase enzyme, the only sample with activity lower than the positive control (acarbose) was HA
J intact, with an IC
50 of 294.25 μg/mL. Regarding the same enzyme, the sample HA
P split showed the highest inhibitory activity, with an IC
50 of 2.20 μg/mL, followed by HA
W intact and HA
W split. These results can also be observed in
Figure 9, where the logarithmic inhibition curves show better activity than acarbose (IC
50 of 122.27 μg/mL) for all samples, with the exception of HA
J intact.
Compounds with inhibitory activity against α-glucosidase, such as acarbose, voglibose and miglitol, have the potential to be used therapeutically in delaying glucose absorption (postprandial glycemia) from the gastrointestinal tract as adjunctive therapy of type 2 diabetes mellitus. This enzyme digests starches and carbohydrates, lowering insulin demand and sustaining a long-term release of GLP-1. Commercially available competitive and reversible inhibitors can limit the progression of diabetes but do not have any effects on pre-existing cardiovascular disease.
Kam et al. (2013) [
26] studied the α-glucosidase inhibitory activity of different parts of the pomegranate, showing that some phenolic species, including ellagic acid, can selectively inhibit this enzyme. Interestingly, it was also identified that the highest amount of ellagic acid and punicalagin in the HA
P split sample corresponded with the highest inhibitory activity. Thus, the findings of this study highlight that the chemical composition of the phenolic content is a factor influencing the selective inhibitory effect against α-glucosidase. Furthermore, Çam and İçyer (2015) [
27] found that phenolic species of pomegranate peels had an IC
50 of 5.56 μg/mL for α-glucosidase, which are in line with our results. Other phenolic derivatives display inhibitory activity against this enzyme, for example, ellagitannins, ellagic acid and punicalagin from the peels [
28,
29,
30]. The applicability of pomegranate peels as a by-product can also be further enhanced with a suitable formulation, for example, by microencapsulation [
31].


 ,
, 


