
First ATR-FTIR Characterization of Black, Green and White Teas (Camellia sinensis) from European Tea Gardens: A PCA Analysis to Differentiate Leaves from the In-Cup Infusion

 ,
,  ,
, 
 and
and 
Abstract
:1. Introduction
2. Materials and Methods
2.1. Tea Samples
2.2. Preparation of Tea Brews
2.3. ATR-FTIR Measurements and Data Analysis
3. Results and Discussion
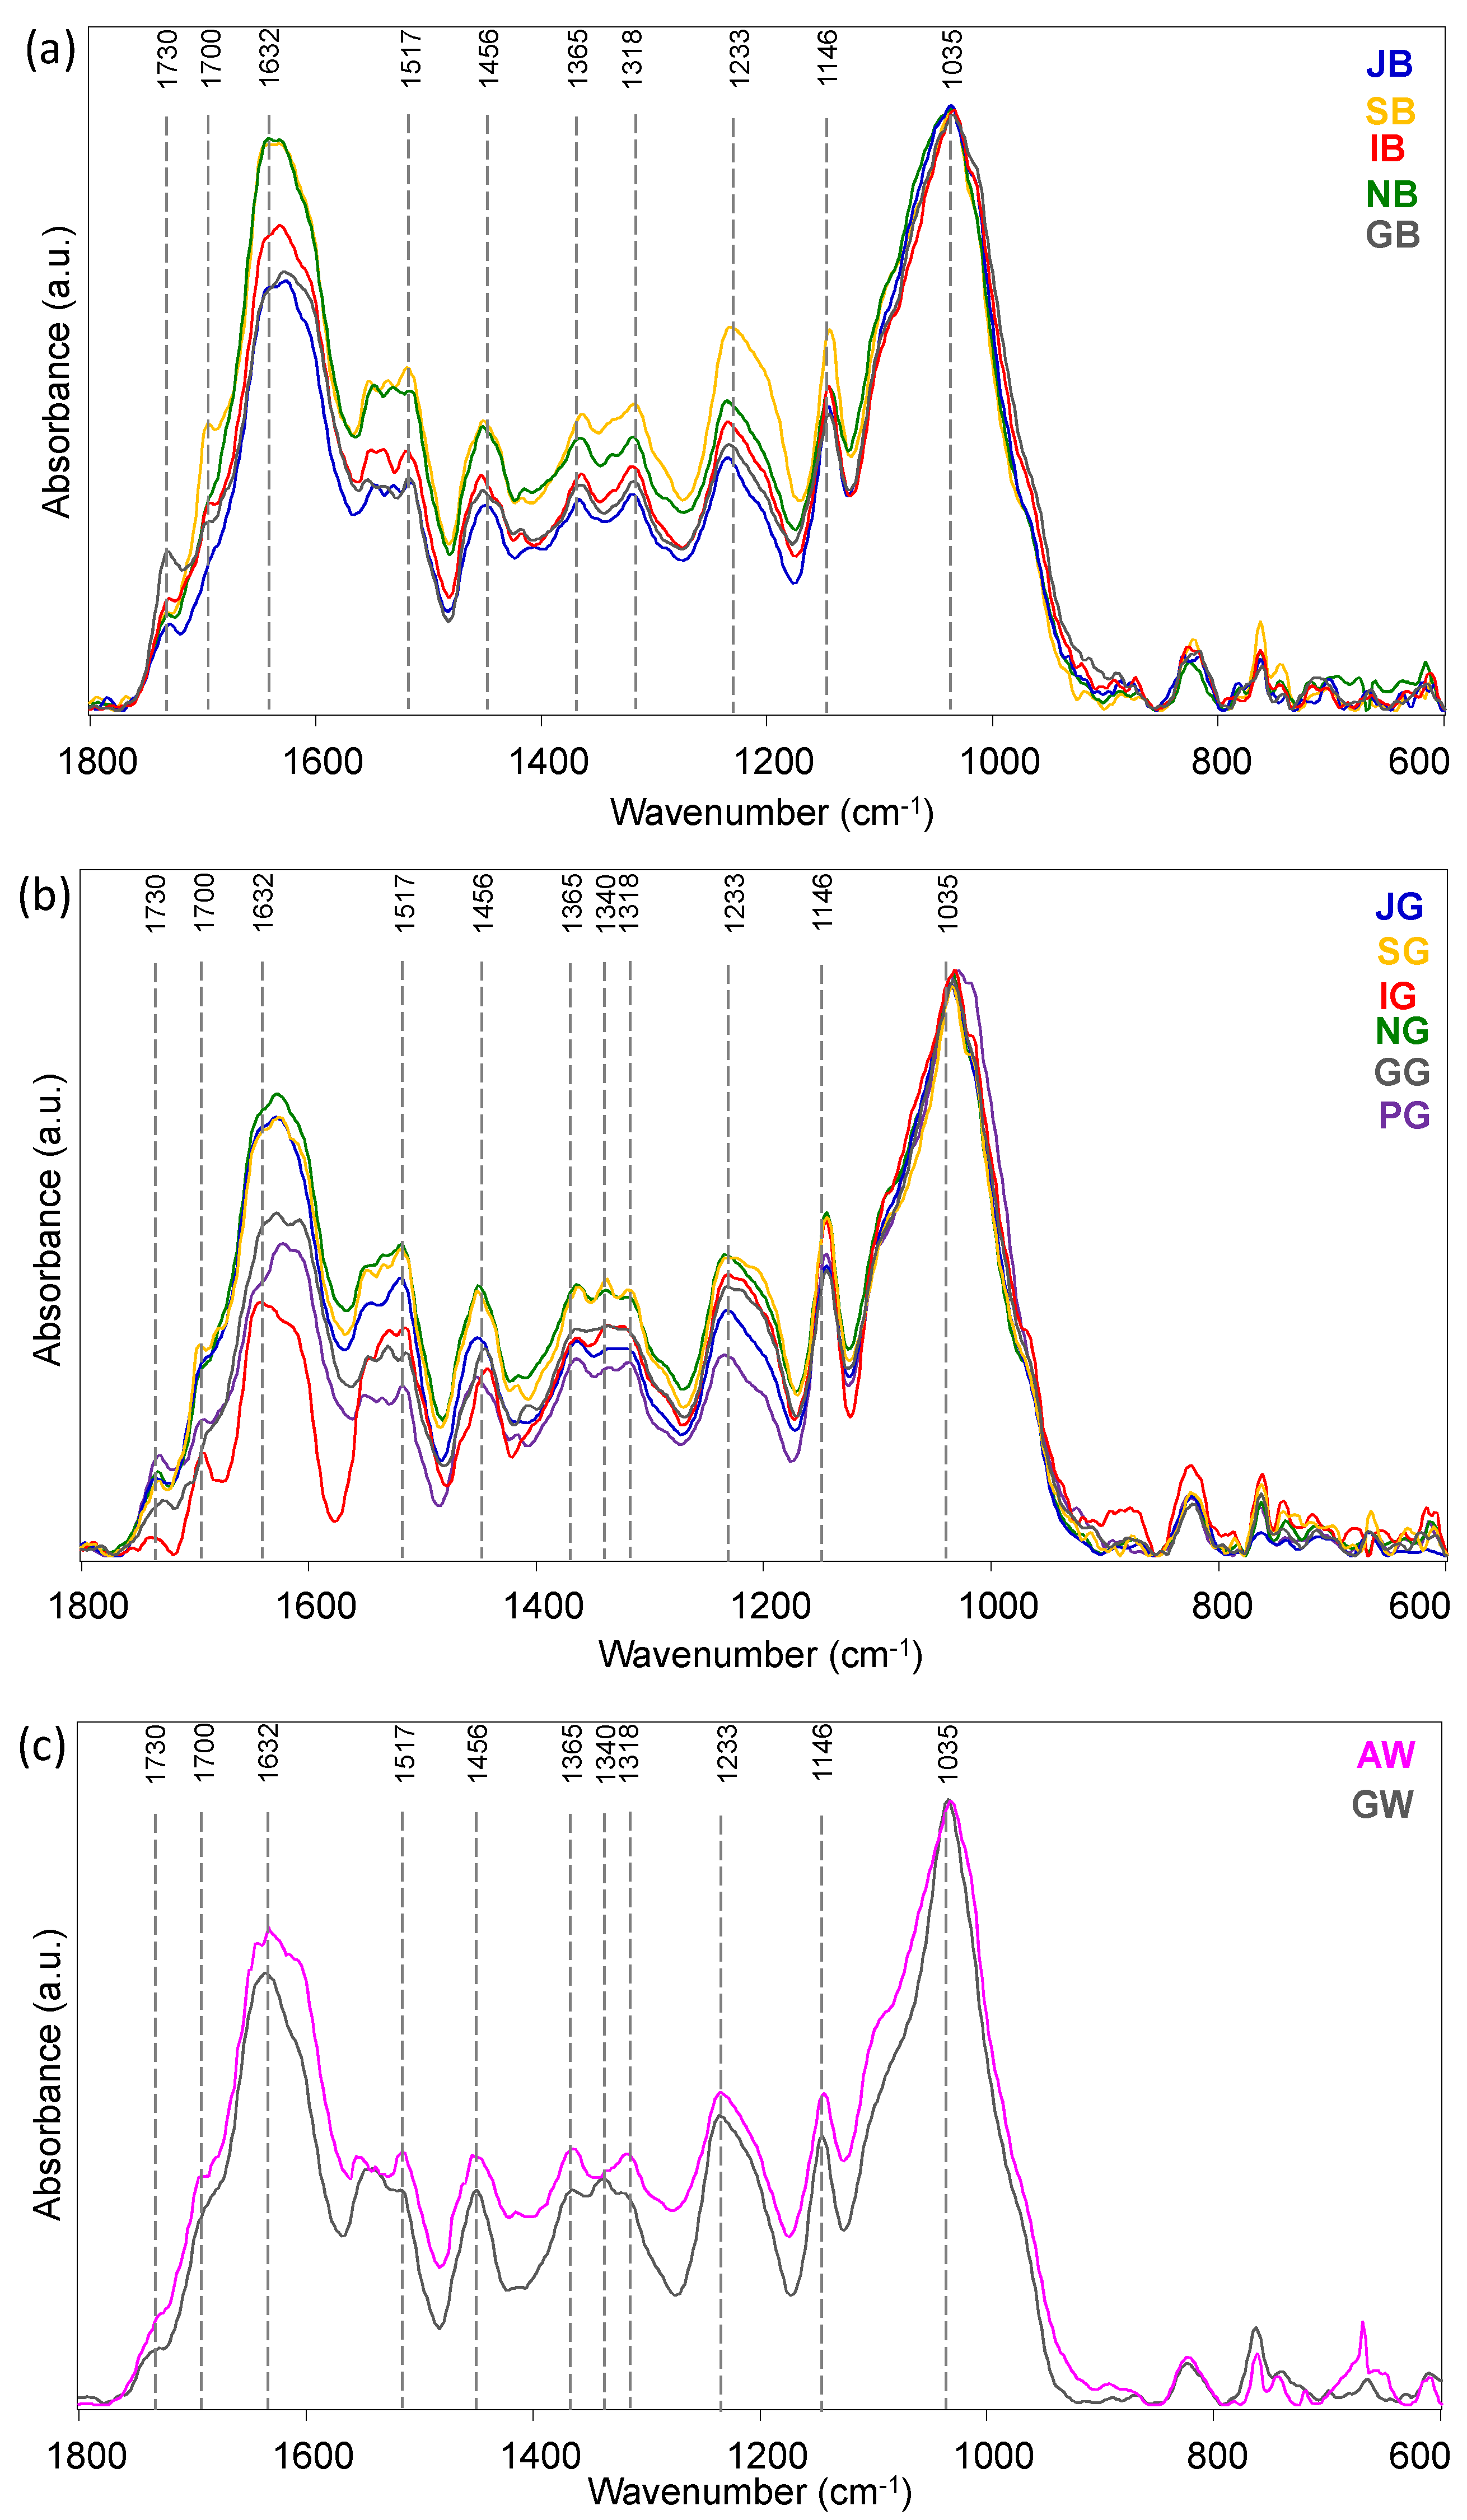
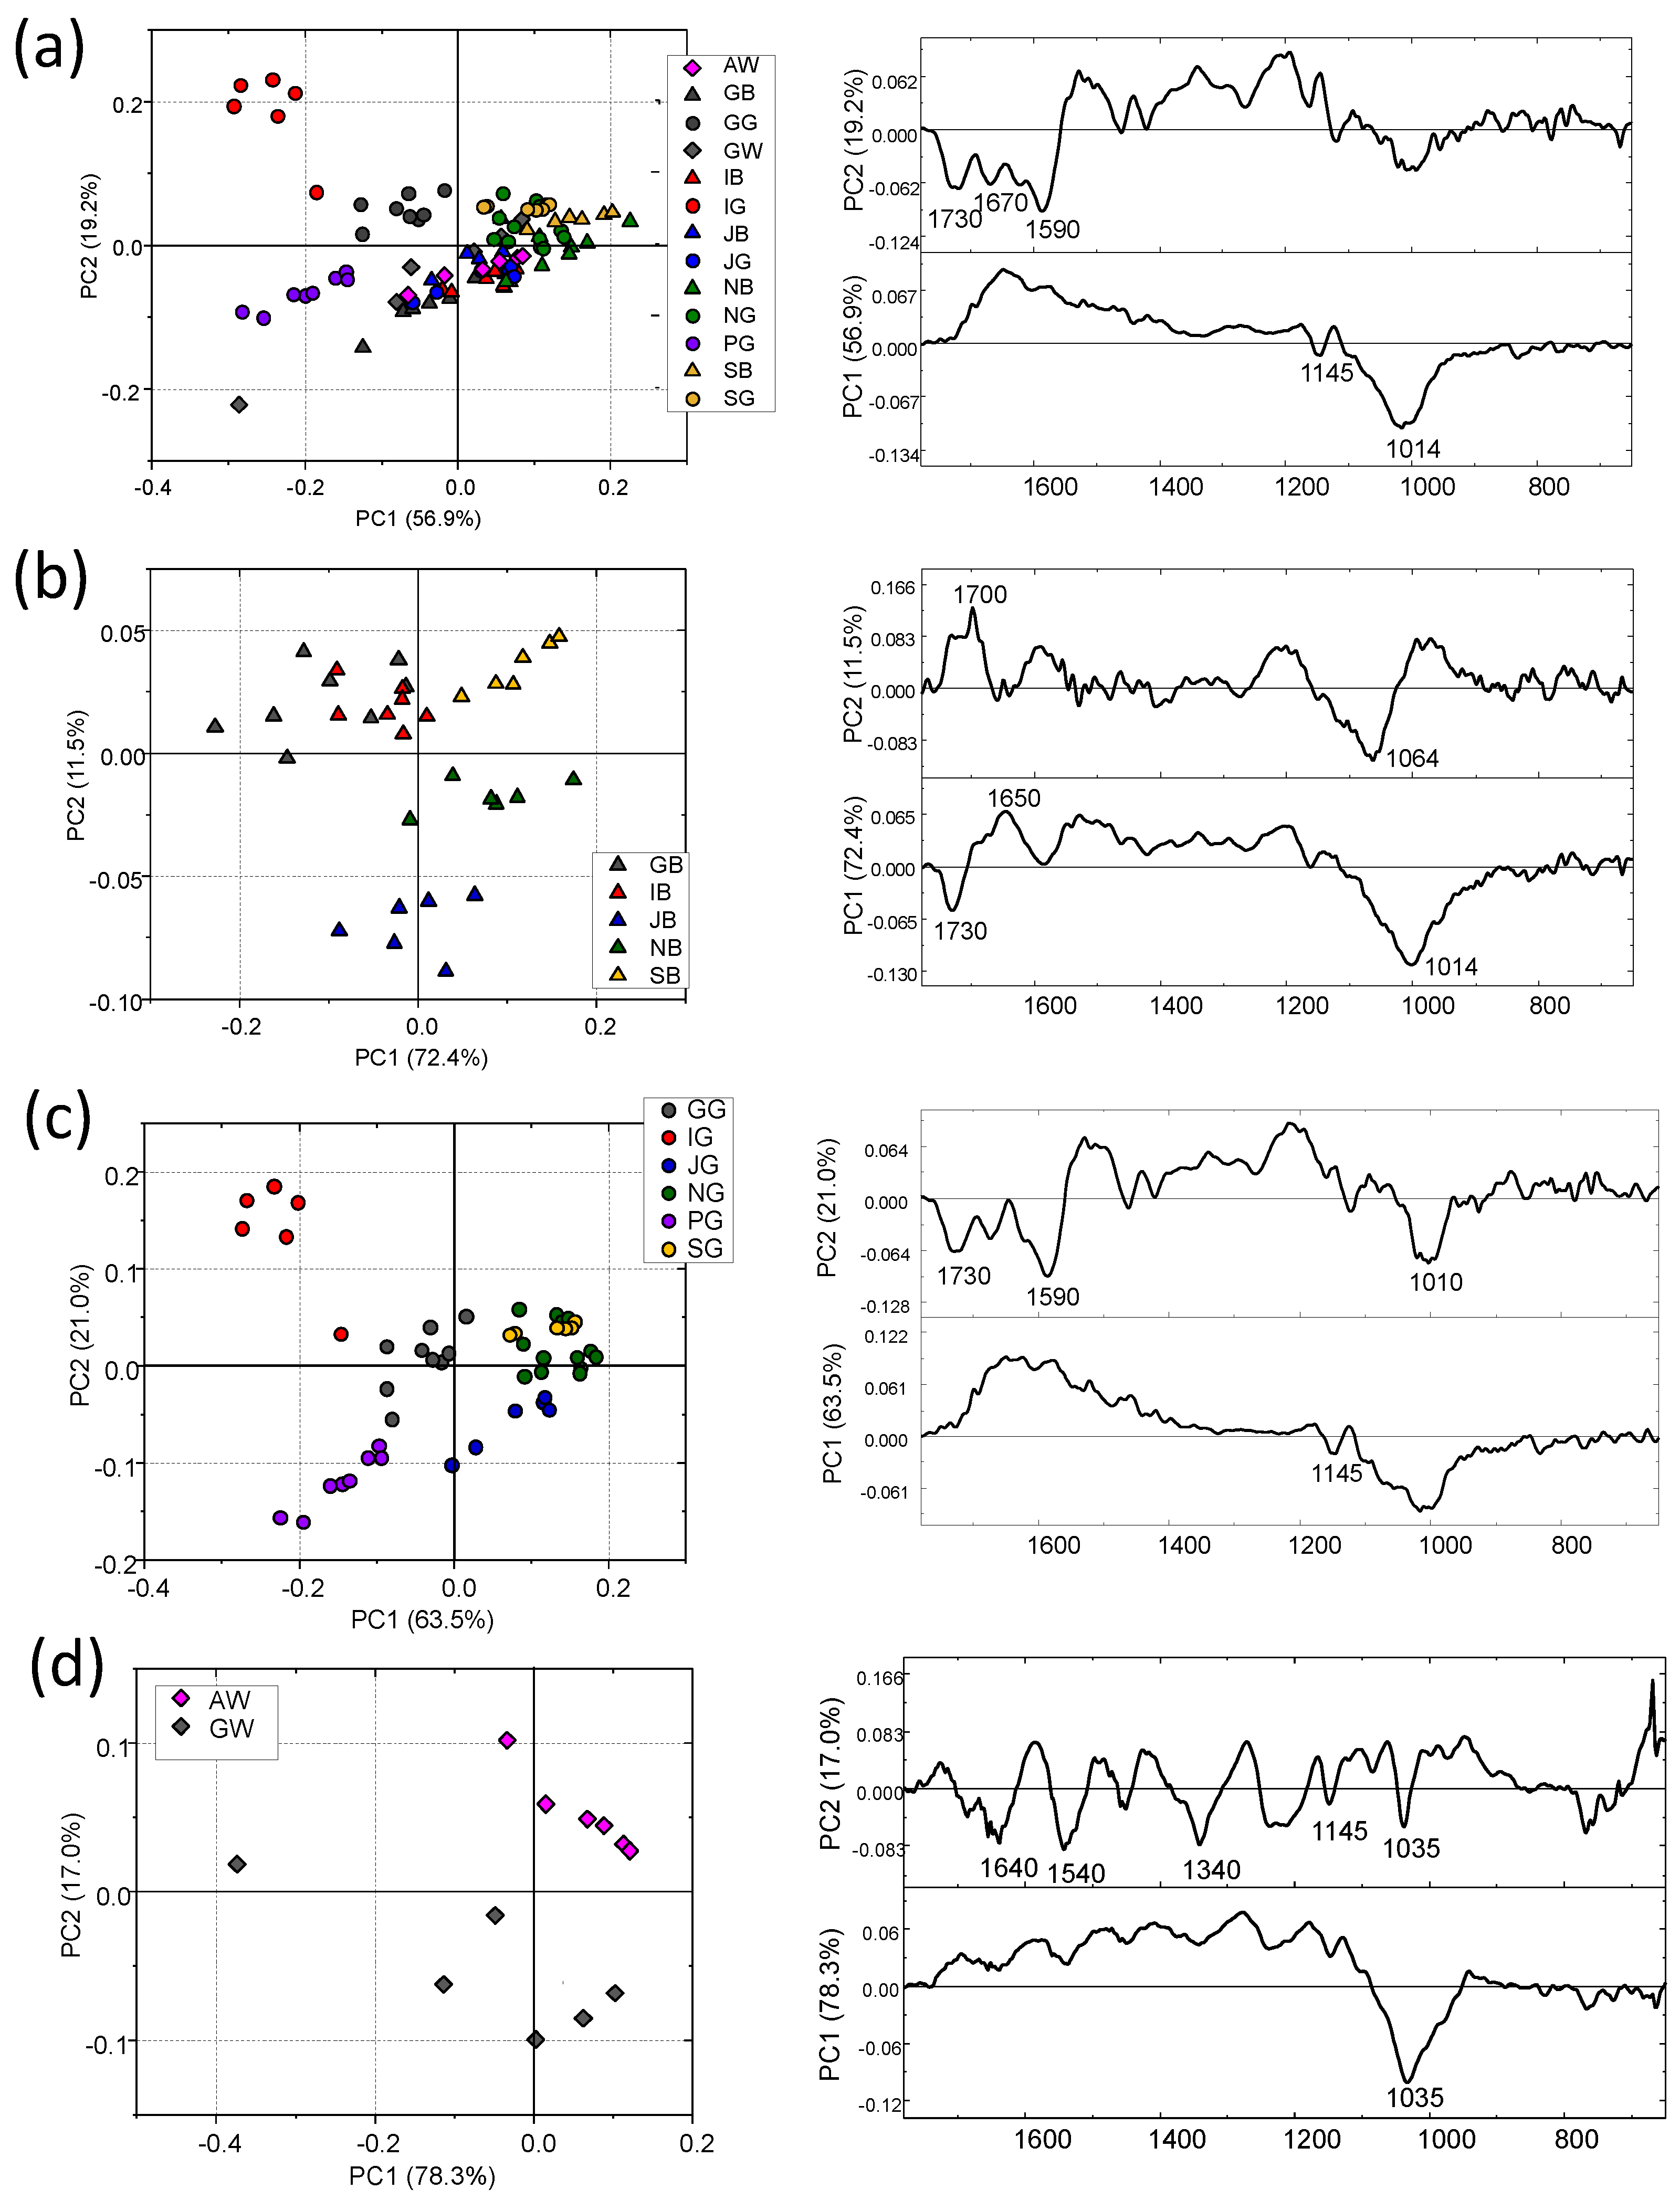
3.1. Tea Leaves
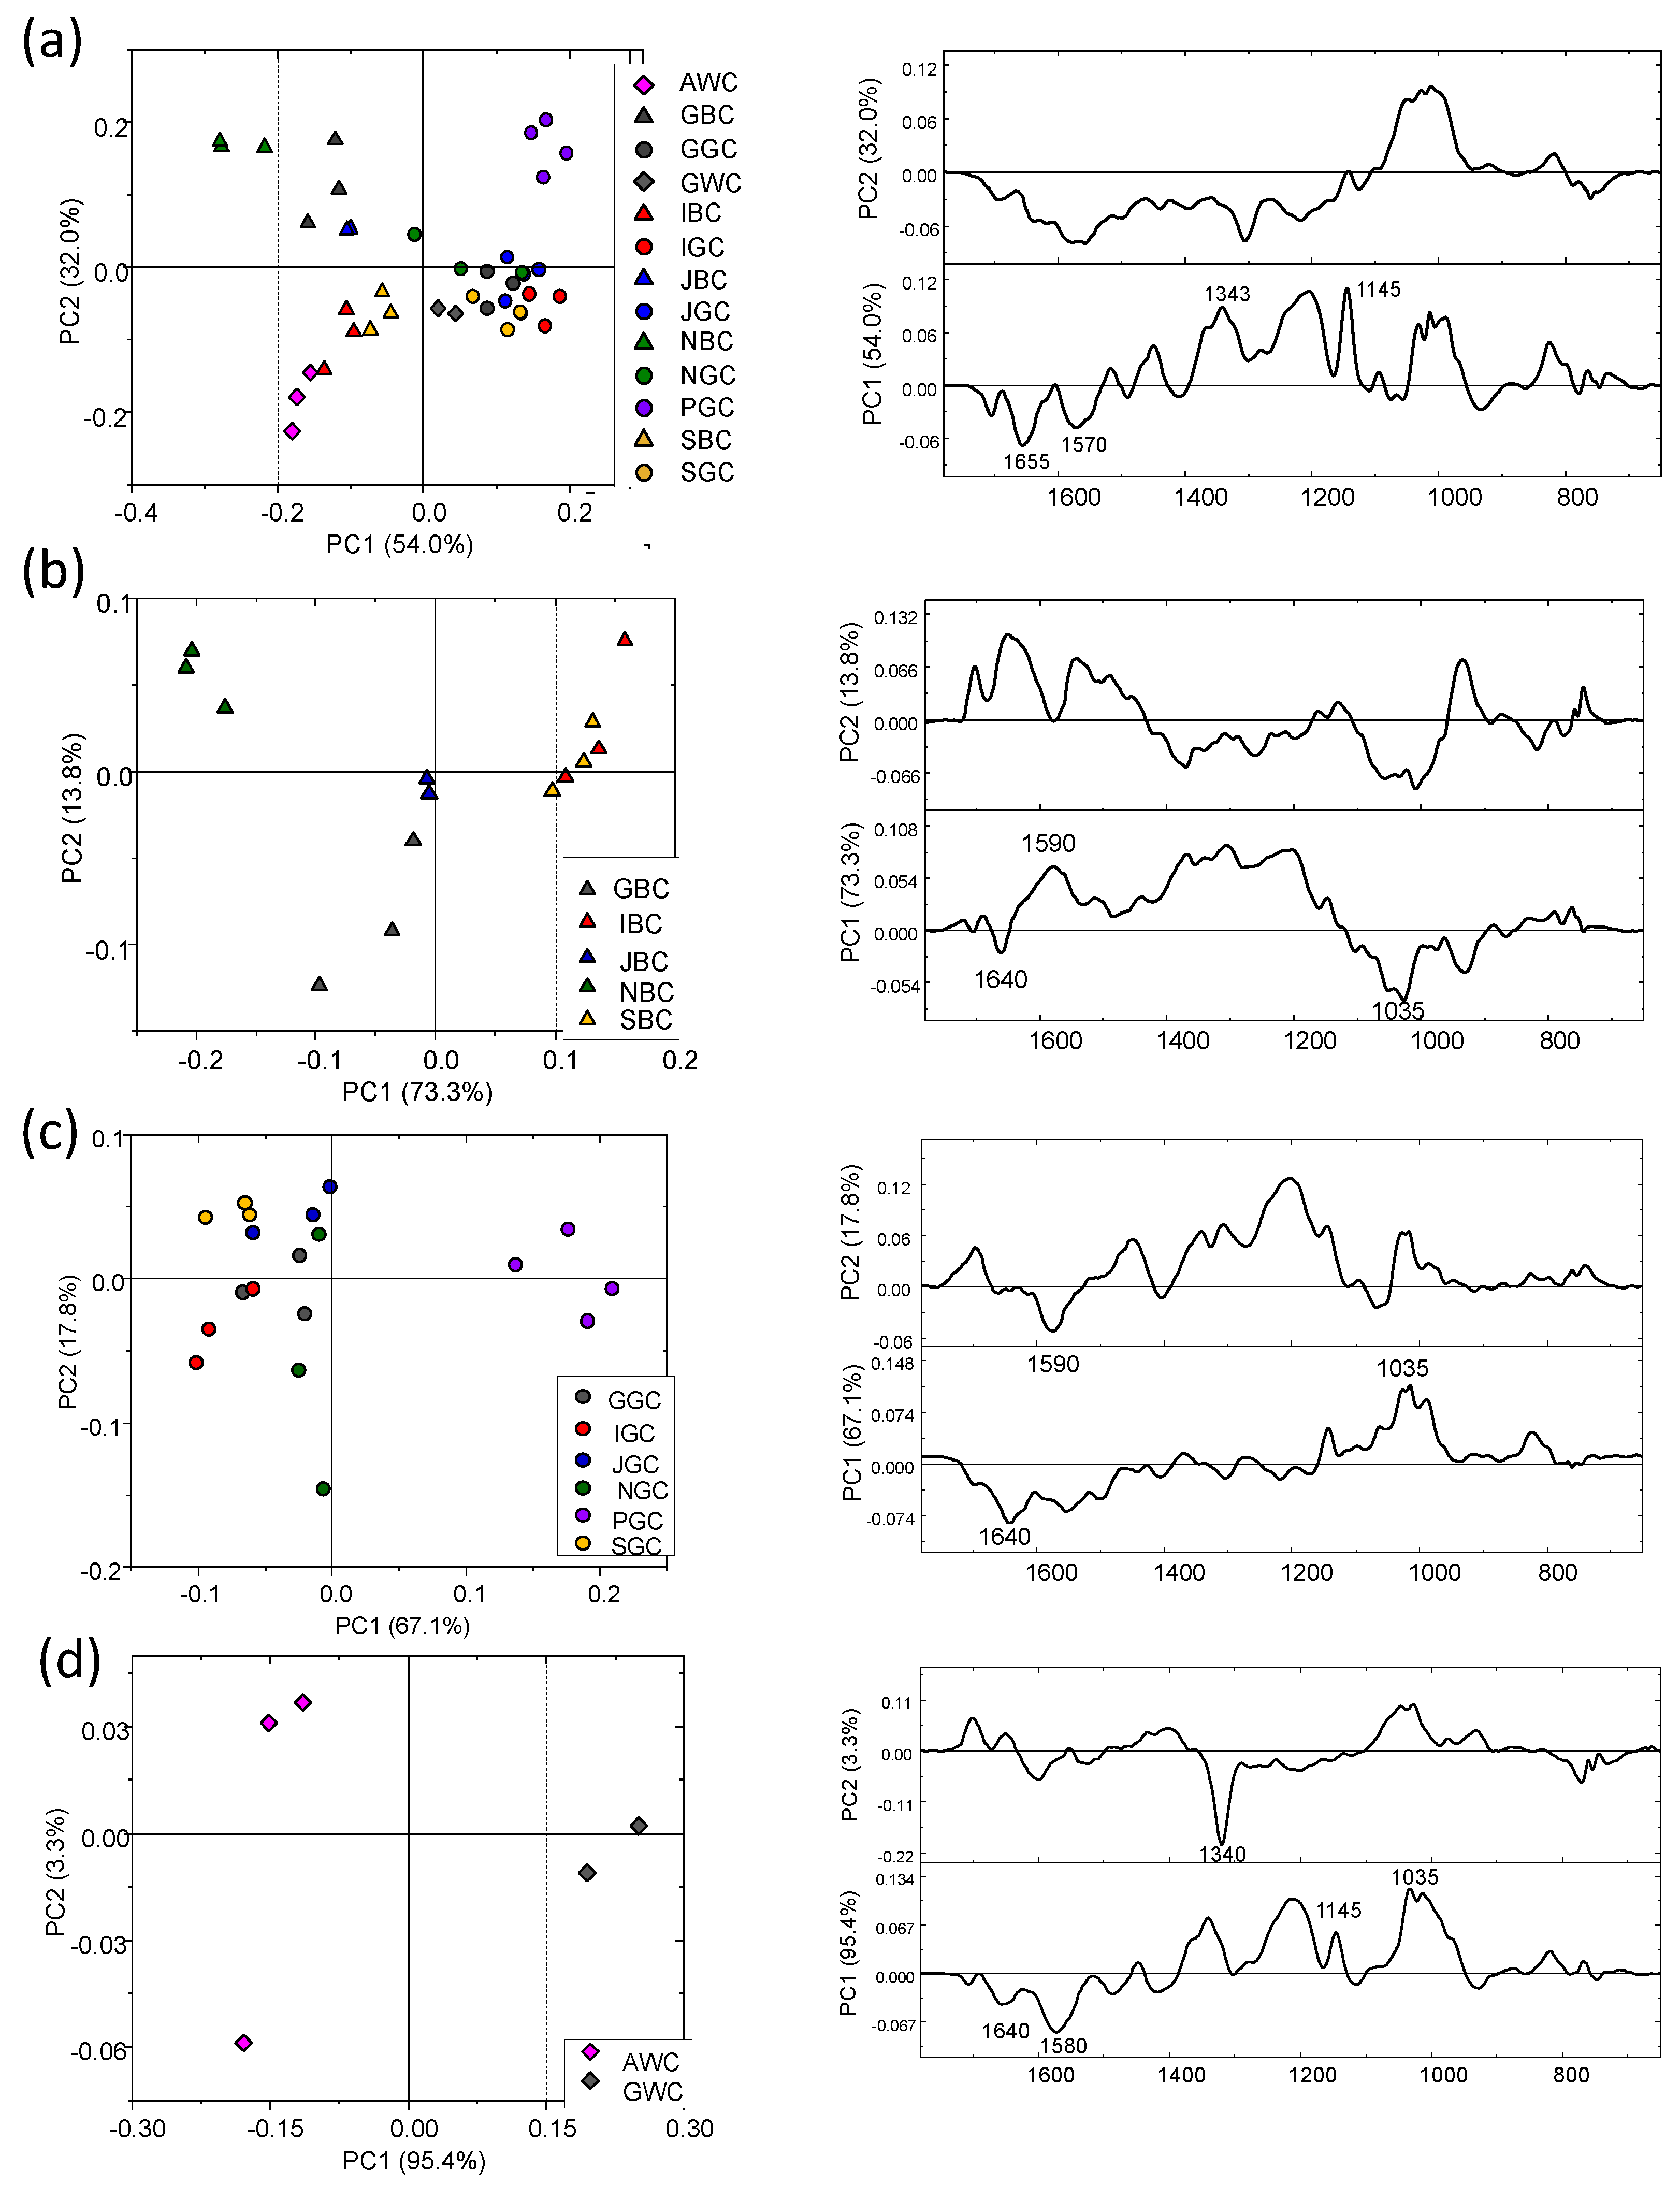
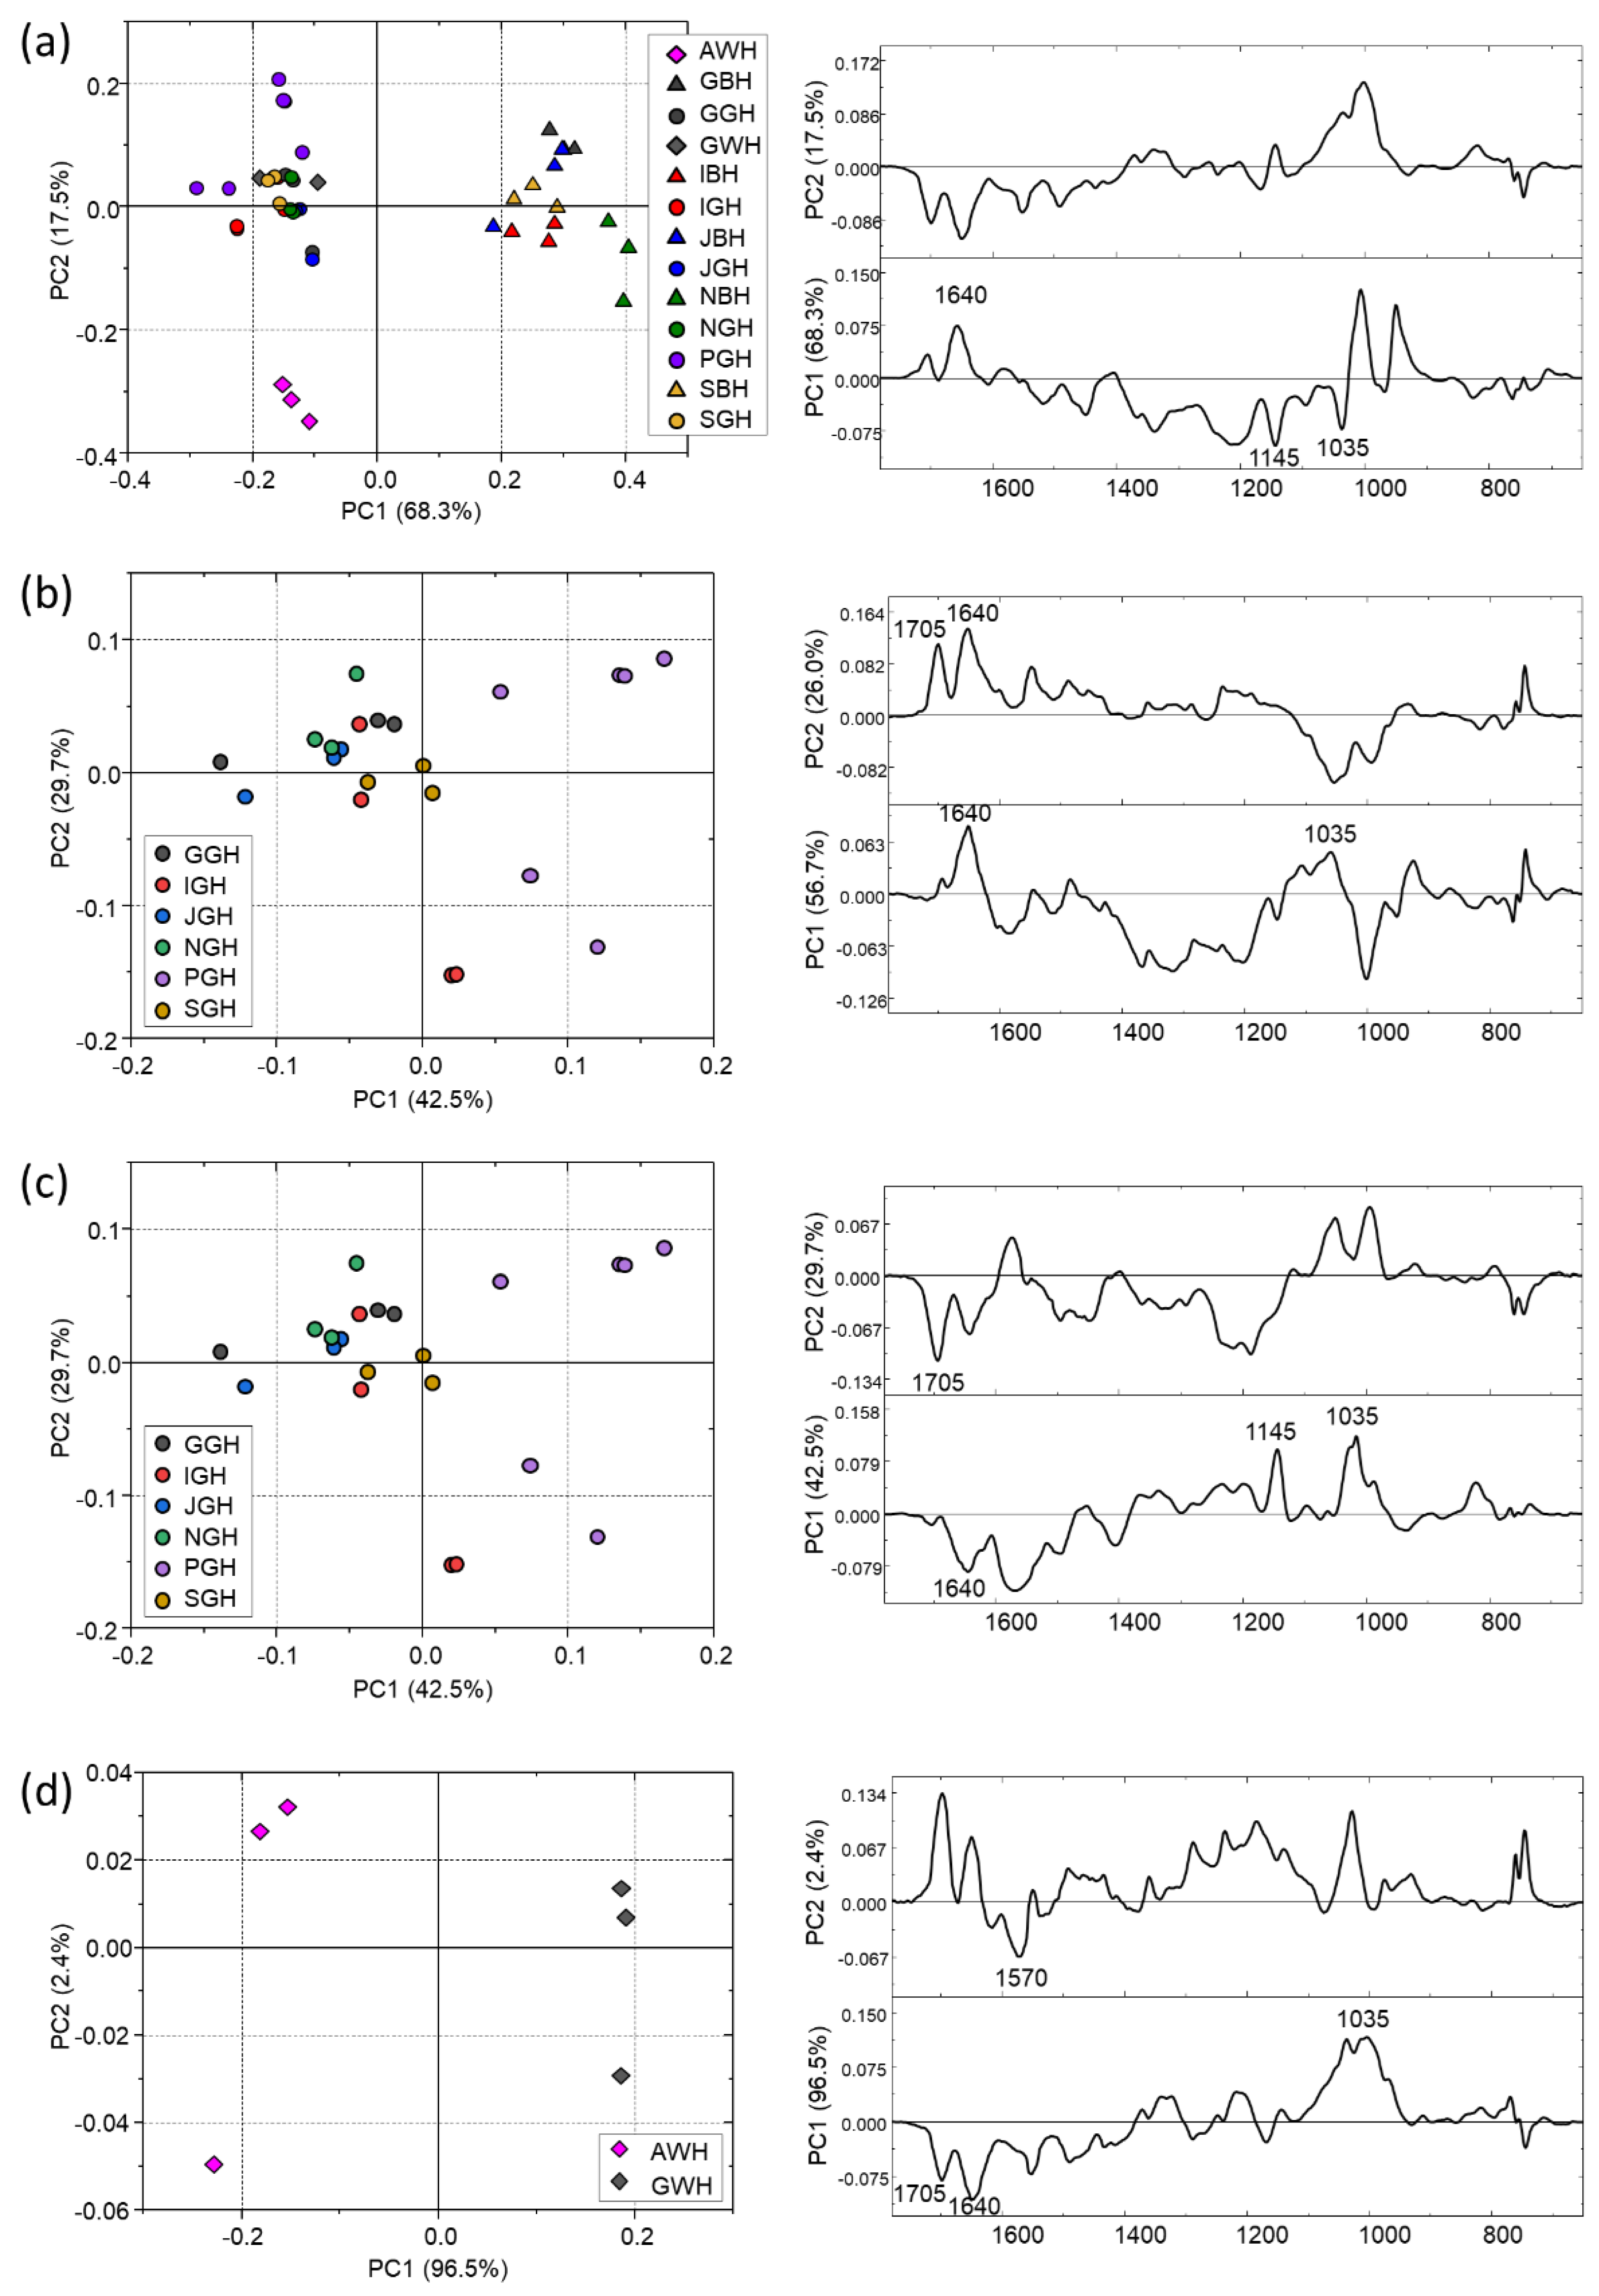
3.2. Tea Brews
3.3. Comparison between the IR Spectral Featuress of Leaves and Their Corresponding Brews
3.4. Comparison of IR Spectral Featuress with Antioxidant Activity
4. Conclusions
Author Contributions
Funding
Institutional Review Board Statement
Informed Consent Statement
Data Availability Statement
Acknowledgments
Conflicts of Interest
References
- Food and Agriculture Organization of the United Nations. International Tea Market: Market Situation, Prospects and Emerging Issues. Available online: https://www.fao.org/3/cc0238en/cc0238en.pdf (accessed on 17 November 2023).
- Tea Grown in Europe Association. EuT-2023-Leaflet-Digital-Version. Available online: https://tea-grown-in-europe.eu (accessed on 17 November 2023).
- Carloni, P.; Albacete, A.; Martínez-Melgarejo, P.A.; Girolametti, F.; Truzzi, C.; Damiani, E. Comparative Analysis of Hot and Cold Brews from Single-Estate Teas (Camellia sinensis) Grown across Europe: An Emerging Specialty Product. Antioxidants 2023, 12, 1306. [Google Scholar] [CrossRef] [PubMed]
- Carloni, P.; Girolametti, F.; Giorgini, E.; Bacchetti, T.; Truzzi, C.; Illuminati, S.; Damiani, E. Insights on the Nutraceutical Properties of Different Specialty Teas Grown and Processed in a German Tea Garden. Antioxidants 2023, 12, 1943. [Google Scholar] [CrossRef] [PubMed]
- Girolametti, F.; Annibaldi, A.; Illuminati, S.; Damiani, E.; Carloni, P.; Truzzi, C. Essential and Potentially Toxic Elements (PTEs) Content in European Tea (Camellia sinensis) Leaves: Risk Assessment for Consumers. Molecules 2023, 28, 3802. [Google Scholar] [CrossRef] [PubMed]
- Ahmad, A.; Ayub, H. Fourier Transform Infrared Spectroscopy (FTIR) Technique for Food Analysis and Authentication. In Nondestructive Quality Assessment Techniques for Fresh Fruits and Vegetables; Pathare, P.B., Rahman, M.S., Eds.; Springer Nature Singapore: Singapore, 2022; pp. 103–142. [Google Scholar] [CrossRef]
- Pro, C.; Basili, D.; Notarstefano, V.; Belloni, A.; Fiorentini, M.; Zenobi, S.; Alia, S.; Vignini, A.; Orsini, R.; Giorgini, E. A Spectroscopic Approach to Evaluate the Effects of Different Soil Tillage Methods and Nitrogen Fertilization Levels on the Biochemical Composition of Durum Wheat (Triticum turgidum subsp. durum) Leaves and Caryopses. Agriculture 2021, 11, 321. [Google Scholar] [CrossRef]
- Szymanska-Chargot, M.; Zdunek, A. Use of FT-IR Spectra and PCA to the Bulk Characterization of Cell Wall Residues of Fruits and Vegetables Along a Fraction Process. Food Biophys. 2013, 8, 29–42. [Google Scholar] [CrossRef]
- Johnson, J.; Mani, J.; Ashwath, N.; Naiker, M. Potential for Fourier transform infrared (FTIR) spectroscopy toward predicting antioxidant and phenolic contents in powdered plant matrices. Spectrochim. Acta Part A Mol. Biomol. Spectrosc. 2020, 233, 118228. [Google Scholar] [CrossRef] [PubMed]
- Chen, Q.; Zhao, J.; Chaitep, S.; Guo, Z. Simultaneous analysis of main catechins contents in green tea (Camellia sinensis (L.)) by Fourier transform near infrared reflectance (FT-NIR) spectroscopy. Food Chem. 2009, 113, 1272–1277. [Google Scholar] [CrossRef]
- Chen, Q.; Zhao, J.; Liu, M.; Cai, J.; Liu, J. Determination of total polyphenols content in green tea using FT-NIR spectroscopy and different PLS algorithms. J. Pharm. Biomed. Anal. 2008, 46, 568–573. [Google Scholar] [CrossRef]
- Cozzolino, D. An Overview of the Successful Application of Vibrational Spectroscopy Techniques to Quantify Nutraceuticals in Fruits and Plants. Foods 2022, 11, 315. [Google Scholar] [CrossRef]
- Wang, J.; Wang, Y.; Cheng, J.; Wang, J.; Sun, X.; Sun, S.; Zhang, Z. Enhanced cross-category models for predicting the total polyphenols, caffeine and free amino acids contents in Chinese tea using NIR spectroscopy. LWT 2018, 96, 90–97. [Google Scholar] [CrossRef]
- Wen, M.; Zhu, M.; Han, Z.; Ho, C.-T.; Granato, D.; Zhang, L. Comprehensive applications of metabolomics on tea science and technology: Opportunities, hurdles, and perspectives. Compr. Rev. Food Sci. Food Saf. 2023, 22, 4890–4924. [Google Scholar] [CrossRef] [PubMed]
- Zareef, M.; Chen, Q.; Ouyang, Q.; Kutsanedzie, F.Y.H.; Hassan, M.M.; Viswadevarayalu, A.; Wang, A. Prediction of amino acids, caffeine, theaflavins and water extract in black tea using FT-NIR spectroscopy coupled chemometrics algorithms. Anal. Methods 2018, 10, 3023–3031. [Google Scholar] [CrossRef]
- Esteki, M.; Memarbashi, N.; Simal-Gandara, J. Classification and authentication of tea according to their geographical origin based on FT-IR fingerprinting using pattern recognition methods. J. Food Compos. Anal. 2022, 106, 104321. [Google Scholar] [CrossRef]
- Song, Y.; Wang, X.; Xie, H.; Li, L.; Ning, J.; Zhang, Z. Quality evaluation of Keemun black tea by fusing data obtained from near-infrared reflectance spectroscopy and computer vision sensors. Spectrochim. Acta Part A Mol. Biomol. Spectrosc. 2021, 252, 119522. [Google Scholar] [CrossRef] [PubMed]
- Zhou, H.; Fu, H.; Wu, X.; Wu, B.; Dai, C. Discrimination of tea varieties based on FTIR spectroscopy and an adaptive improved possibilistic c-means clustering. J. Food Process. Preserv. 2020, 44, e14795. [Google Scholar] [CrossRef]
- Aboulwafa, M.M.; Youssef, F.S.; Gad, H.A.; Sarker, S.D.; Nahar, L.; Al-Azizi, M.M.; Ashour, M.L. Authentication and discrimination of green tea samples using UV–vis, FTIR and HPLC techniques coupled with chemometrics analysis. J. Pharm. Biomed. Anal. 2019, 164, 653–658. [Google Scholar] [CrossRef]
- Arifah, M.F.; Hastuti, A.A.M.B.H.; Rohman, A. Utilization of UV-visible and FTIR spectroscopy coupled with chemometrics for differentiation of Indonesian tea: An exploratory study. Indones. J. Pharm. 2022, 33, 200–207. [Google Scholar] [CrossRef]
- Budínová, G.; Vláčil, D.; Mestek, O.; Volka, K. Application of infrared spectroscopy to the assessment of authenticity of tea. Talanta 1998, 47, 255–260. [Google Scholar] [CrossRef]
- Carvalho, D.G.; Ranzan, L.; Jacques, R.A.; Trierweiler, L.F.; Trierweiler, J.O. Analysis of total phenolic compounds and caffeine in teas using variable selection approach with two-dimensional fluorescence and infrared spectroscopy. Microchem. J. 2021, 169, 106570. [Google Scholar] [CrossRef]
- Stuart, B.H. Infrared Spectroscopy: Fundamentals and Applications; John Wiley & Sons, Ltd.: Hoboken, NJ, USA, 2004. [Google Scholar]
- Tea and Herbal Infusions Europe. Compendium of Guidelines for Tea (Camellia sinensis). Available online: https://thie-online/eu/files/thie/docs/2018-08-20_Compendium_of_Guidelines_for_Tea_ISSUE_5.pdf (accessed on 17 November 2023).
- Cai, J.-X.; Wang, Y.-F.; Xi, X.-G.; Li, H.; Wei, X.-L. Using FTIR spectra and pattern recognition for discrimination of tea varieties. Int. J. Biol. Macromol. 2015, 78, 439–446. [Google Scholar] [CrossRef]
- Krysa, M.; Szymańska-Chargot, M.; Zdunek, A. FT-IR and FT-Raman fingerprints of flavonoids—A review. Food Chem. 2022, 393, 133430. [Google Scholar] [CrossRef] [PubMed]
- Li, X.; Zhou, R.; Xu, K.; Xu, J.; Jin, J.; Fang, H.; He, Y. Rapid Determination of Chlorophyll and Pheophytin in Green Tea Using Fourier Transform Infrared Spectroscopy. Molecules 2018, 23, 1010. [Google Scholar] [CrossRef] [PubMed]
- Movasaghi, Z.; Rehman, S.; ur Rehman, D.I. Fourier Transform Infrared (FTIR) Spectroscopy of Biological Tissues. Appl. Spectrosc. Rev. 2008, 43, 134–179. [Google Scholar] [CrossRef]
- Singh, B.R.; Wechter, M.A.; Hu, Y.; Lafontaine, C. Determination of caffeine content in coffee using Fourier transform infra-red spectroscopy in combination with attenuated total reflectance technique: A bioanalytical chemistry experiment for biochemists. Biochem. Educ. 1998, 26, 243–247. [Google Scholar] [CrossRef]
- Balentine, D.A.; Wiseman, S.A.; Bouwens, L.C.M. The chemistry of tea flavonoids. Crit. Rev. Food Sci. Nutr. 1997, 37, 693–704. [Google Scholar] [CrossRef] [PubMed]
- Mohamed, M.A.; Salleh, W.N.W.; Jaafar, J.; Asri, S.E.A.M.; Ismail, A.F. Physicochemical properties of “green” nanocrystalline cellulose isolated from recycled newspaper. RSC Adv. 2015, 5, 29842–29849. [Google Scholar] [CrossRef]
- Yousefbeyk, F.; Ebrahimi-Najafabadi, H.; Dabirian, S.; Salimi, S.; Baniardalani, F.; Moghadam, F.; Ghasemi, S. Phytochemical Analysis and Antioxidant Activity of Eight Cultivars of Tea (Camellia sinensis) and Rapid Discrimination with FTIR Spectroscopy and Pattern Recognition Techniques. Pharm. Sci. 2023, 29, 100–110. [Google Scholar] [CrossRef]
- Yu, J.; Liu, Y.; Zhang, S.; Luo, L.; Zeng, L. Effect of brewing conditions on phytochemicals and sensory profiles of black tea infusions: A primary study on the effects of geraniol and β-ionone on taste perception of black tea infusions. Food Chem. 2021, 354, 129504. [Google Scholar] [CrossRef]
- Zhao, C.-N.; Tang, G.-Y.; Cao, S.-Y.; Xu, X.-Y.; Gan, R.-Y.; Liu, Q.; Mao, Q.-Q.; Shang, A.; Li, H.-B. Phenolic Profiles and Antioxidant Activities of 30 Tea Infusions from Green, Black, Oolong, White, Yellow and Dark Teas. Antioxidants 2019, 8, 215. [Google Scholar] [CrossRef]
- Abiri, B.; Amini, S.; Hejazi, M.; Hosseinpanah, F.; Zarghi, A.; Abbaspour, F.; Valizadeh, M. Tea’s anti-obesity properties, cardiometabolic health-promoting potentials, bioactive compounds, and adverse effects: A review focusing on white and green teas. Food Sci. Nutr. 2023, 11, 5818–5836. [Google Scholar] [CrossRef]
- Samanta, S. Potential Bioactive Components and Health Promotional Benefits of Tea (Camellia sinensis). J. Am. Nutr. Assoc. 2022, 41, 65–93. [Google Scholar] [CrossRef] [PubMed]
- Cheng, W.H. Green Tea: An Ancient Antioxidant Drink for Optimal Health? J. Nutr. 2019, 149, 1877–1879. [Google Scholar] [CrossRef] [PubMed]
- Pérez-Burillo, S.; Giménez, R.; Rufián-Henares, J.A.; Pastoriza, S. Effect of brewing time and temperature on antioxidant capacity and phenols of white tea: Relationship with sensory properties. Food Chem. 2018, 248, 111–118. [Google Scholar] [CrossRef] [PubMed]
- Yang, X.; Dai, H.; Deng, R.; Zhang, Z.; Quan, Y.; Giri, M.; Shen, J. Association between tea consumption and prevention of coronary artery disease: A systematic review and dose-response meta-analysis. Front. Nutr. 2022, 9, 1021405. [Google Scholar] [CrossRef]
- Fuchs, D.; De Graaf, Y.; Van Kerckhoven, R.; Draijer, R. Effect of Tea Theaflavins and Catechins on Microvascular Function. Nutrients 2014, 6, 5772–5785. [Google Scholar] [CrossRef]


| European Garden | Country | Type | Label |
|---|---|---|---|
| Jersey Fine Tea | United Kingdom | Black | JB |
| Green | JG | ||
| Casa del Tè Monte Verità | Switzerland | Black | SB |
| Green | SG | ||
| Compagnia del Lago Maggiore | Italy | Black | IB |
| Green | IG | ||
| Het Zuyderbald | Netherlands | Black | NB |
| Green | NG | ||
| Tschanara Tea Garden | Germany | Black | GB |
| Green | GG | ||
| White | GW | ||
| Chà Camelia | Portugal | Green | PG |
| Agrarian Devt. Services Sao Miguel | Azores (Portugal) | White | AW |
Disclaimer/Publisher’s Note: The statements, opinions and data contained in all publications are solely those of the individual author(s) and contributor(s) and not of MDPI and/or the editor(s). MDPI and/or the editor(s) disclaim responsibility for any injury to people or property resulting from any ideas, methods, instructions or products referred to in the content. |
© 2023 by the authors. Licensee MDPI, Basel, Switzerland. This article is an open access article distributed under the terms and conditions of the Creative Commons Attribution (CC BY) license (https://creativecommons.org/licenses/by/4.0/).
Share and Cite
Giorgini, E.; Notarstefano, V.; Foligni, R.; Carloni, P.; Damiani, E. First ATR-FTIR Characterization of Black, Green and White Teas (Camellia sinensis) from European Tea Gardens: A PCA Analysis to Differentiate Leaves from the In-Cup Infusion. Foods 2024, 13, 109. https://doi.org/10.3390/foods13010109
Giorgini E, Notarstefano V, Foligni R, Carloni P, Damiani E. First ATR-FTIR Characterization of Black, Green and White Teas (Camellia sinensis) from European Tea Gardens: A PCA Analysis to Differentiate Leaves from the In-Cup Infusion. Foods. 2024; 13(1):109. https://doi.org/10.3390/foods13010109
Chicago/Turabian StyleGiorgini, Elisabetta, Valentina Notarstefano, Roberta Foligni, Patricia Carloni, and Elisabetta Damiani. 2024. "First ATR-FTIR Characterization of Black, Green and White Teas (Camellia sinensis) from European Tea Gardens: A PCA Analysis to Differentiate Leaves from the In-Cup Infusion" Foods 13, no. 1: 109. https://doi.org/10.3390/foods13010109
APA StyleGiorgini, E., Notarstefano, V., Foligni, R., Carloni, P., & Damiani, E. (2024). First ATR-FTIR Characterization of Black, Green and White Teas (Camellia sinensis) from European Tea Gardens: A PCA Analysis to Differentiate Leaves from the In-Cup Infusion. Foods, 13(1), 109. https://doi.org/10.3390/foods13010109