
Changes in Meat of Hu Sheep during Postmortem Aging Based on ACQUITY UPLC I-Class Plus/VION IMS QTof

Abstract
1. Introduction
2. Materials and Methods
2.1. Animals
2.2. The Quality Characteristics
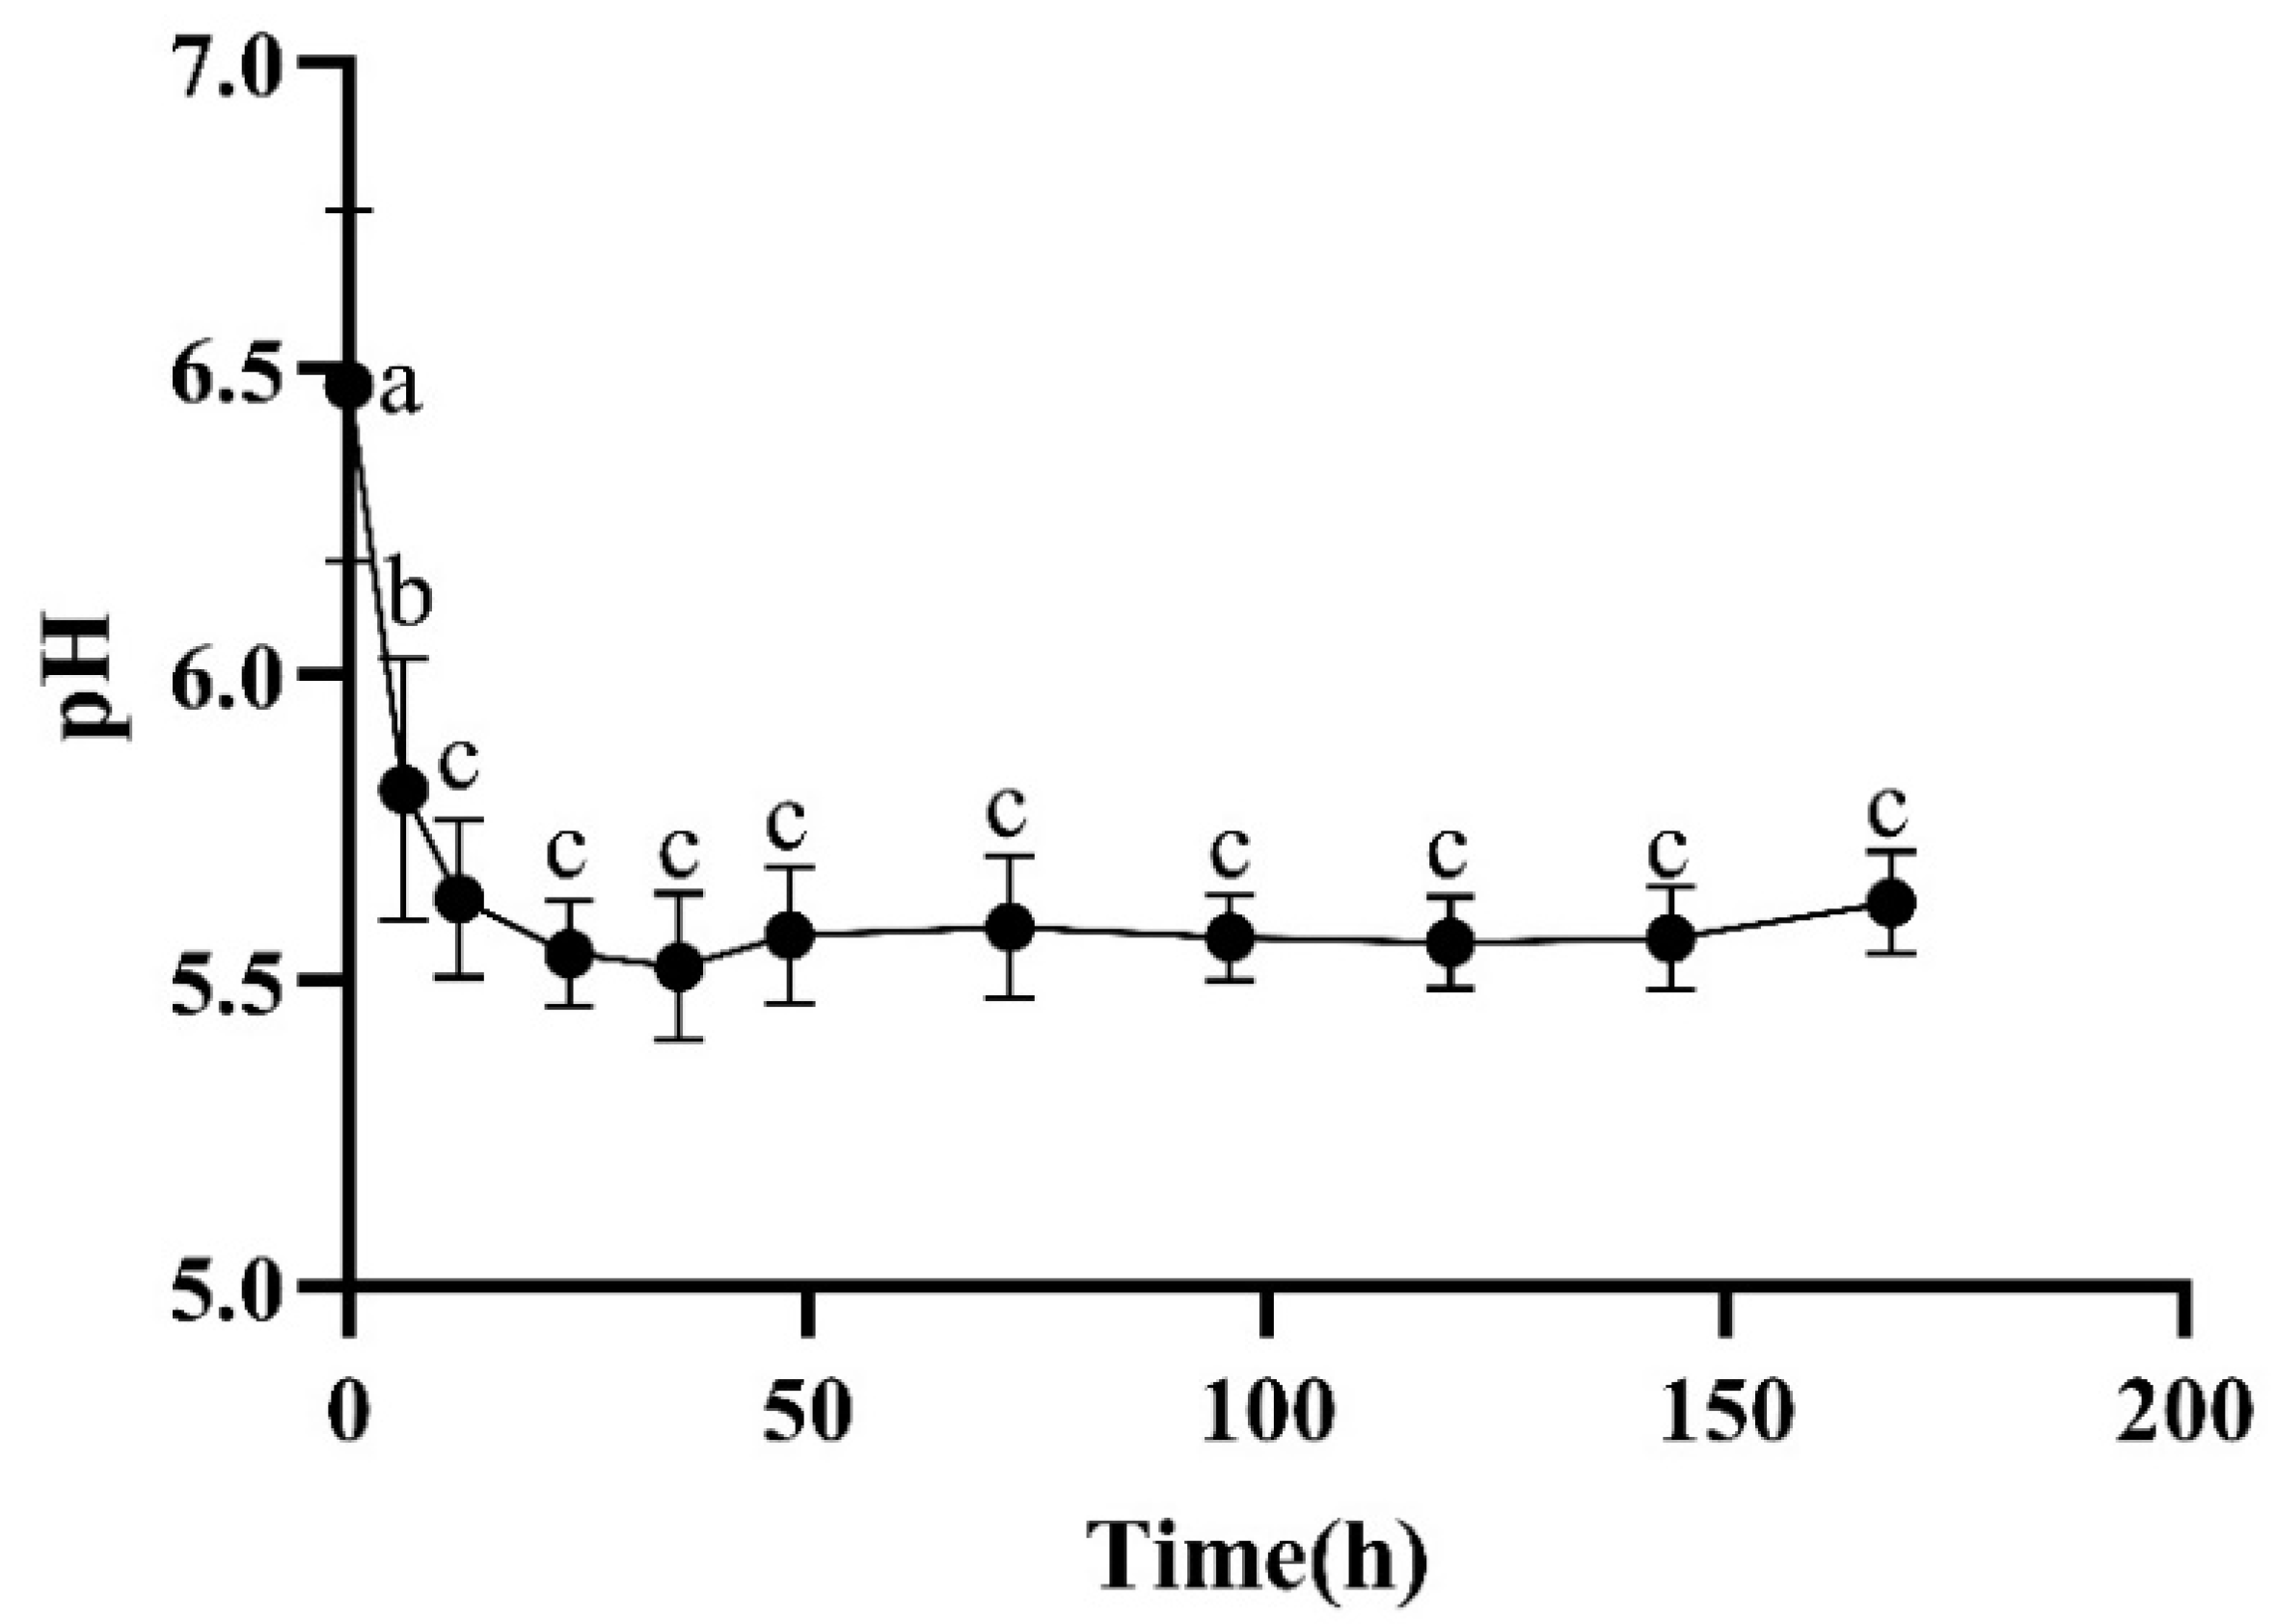
2.2.1. pH
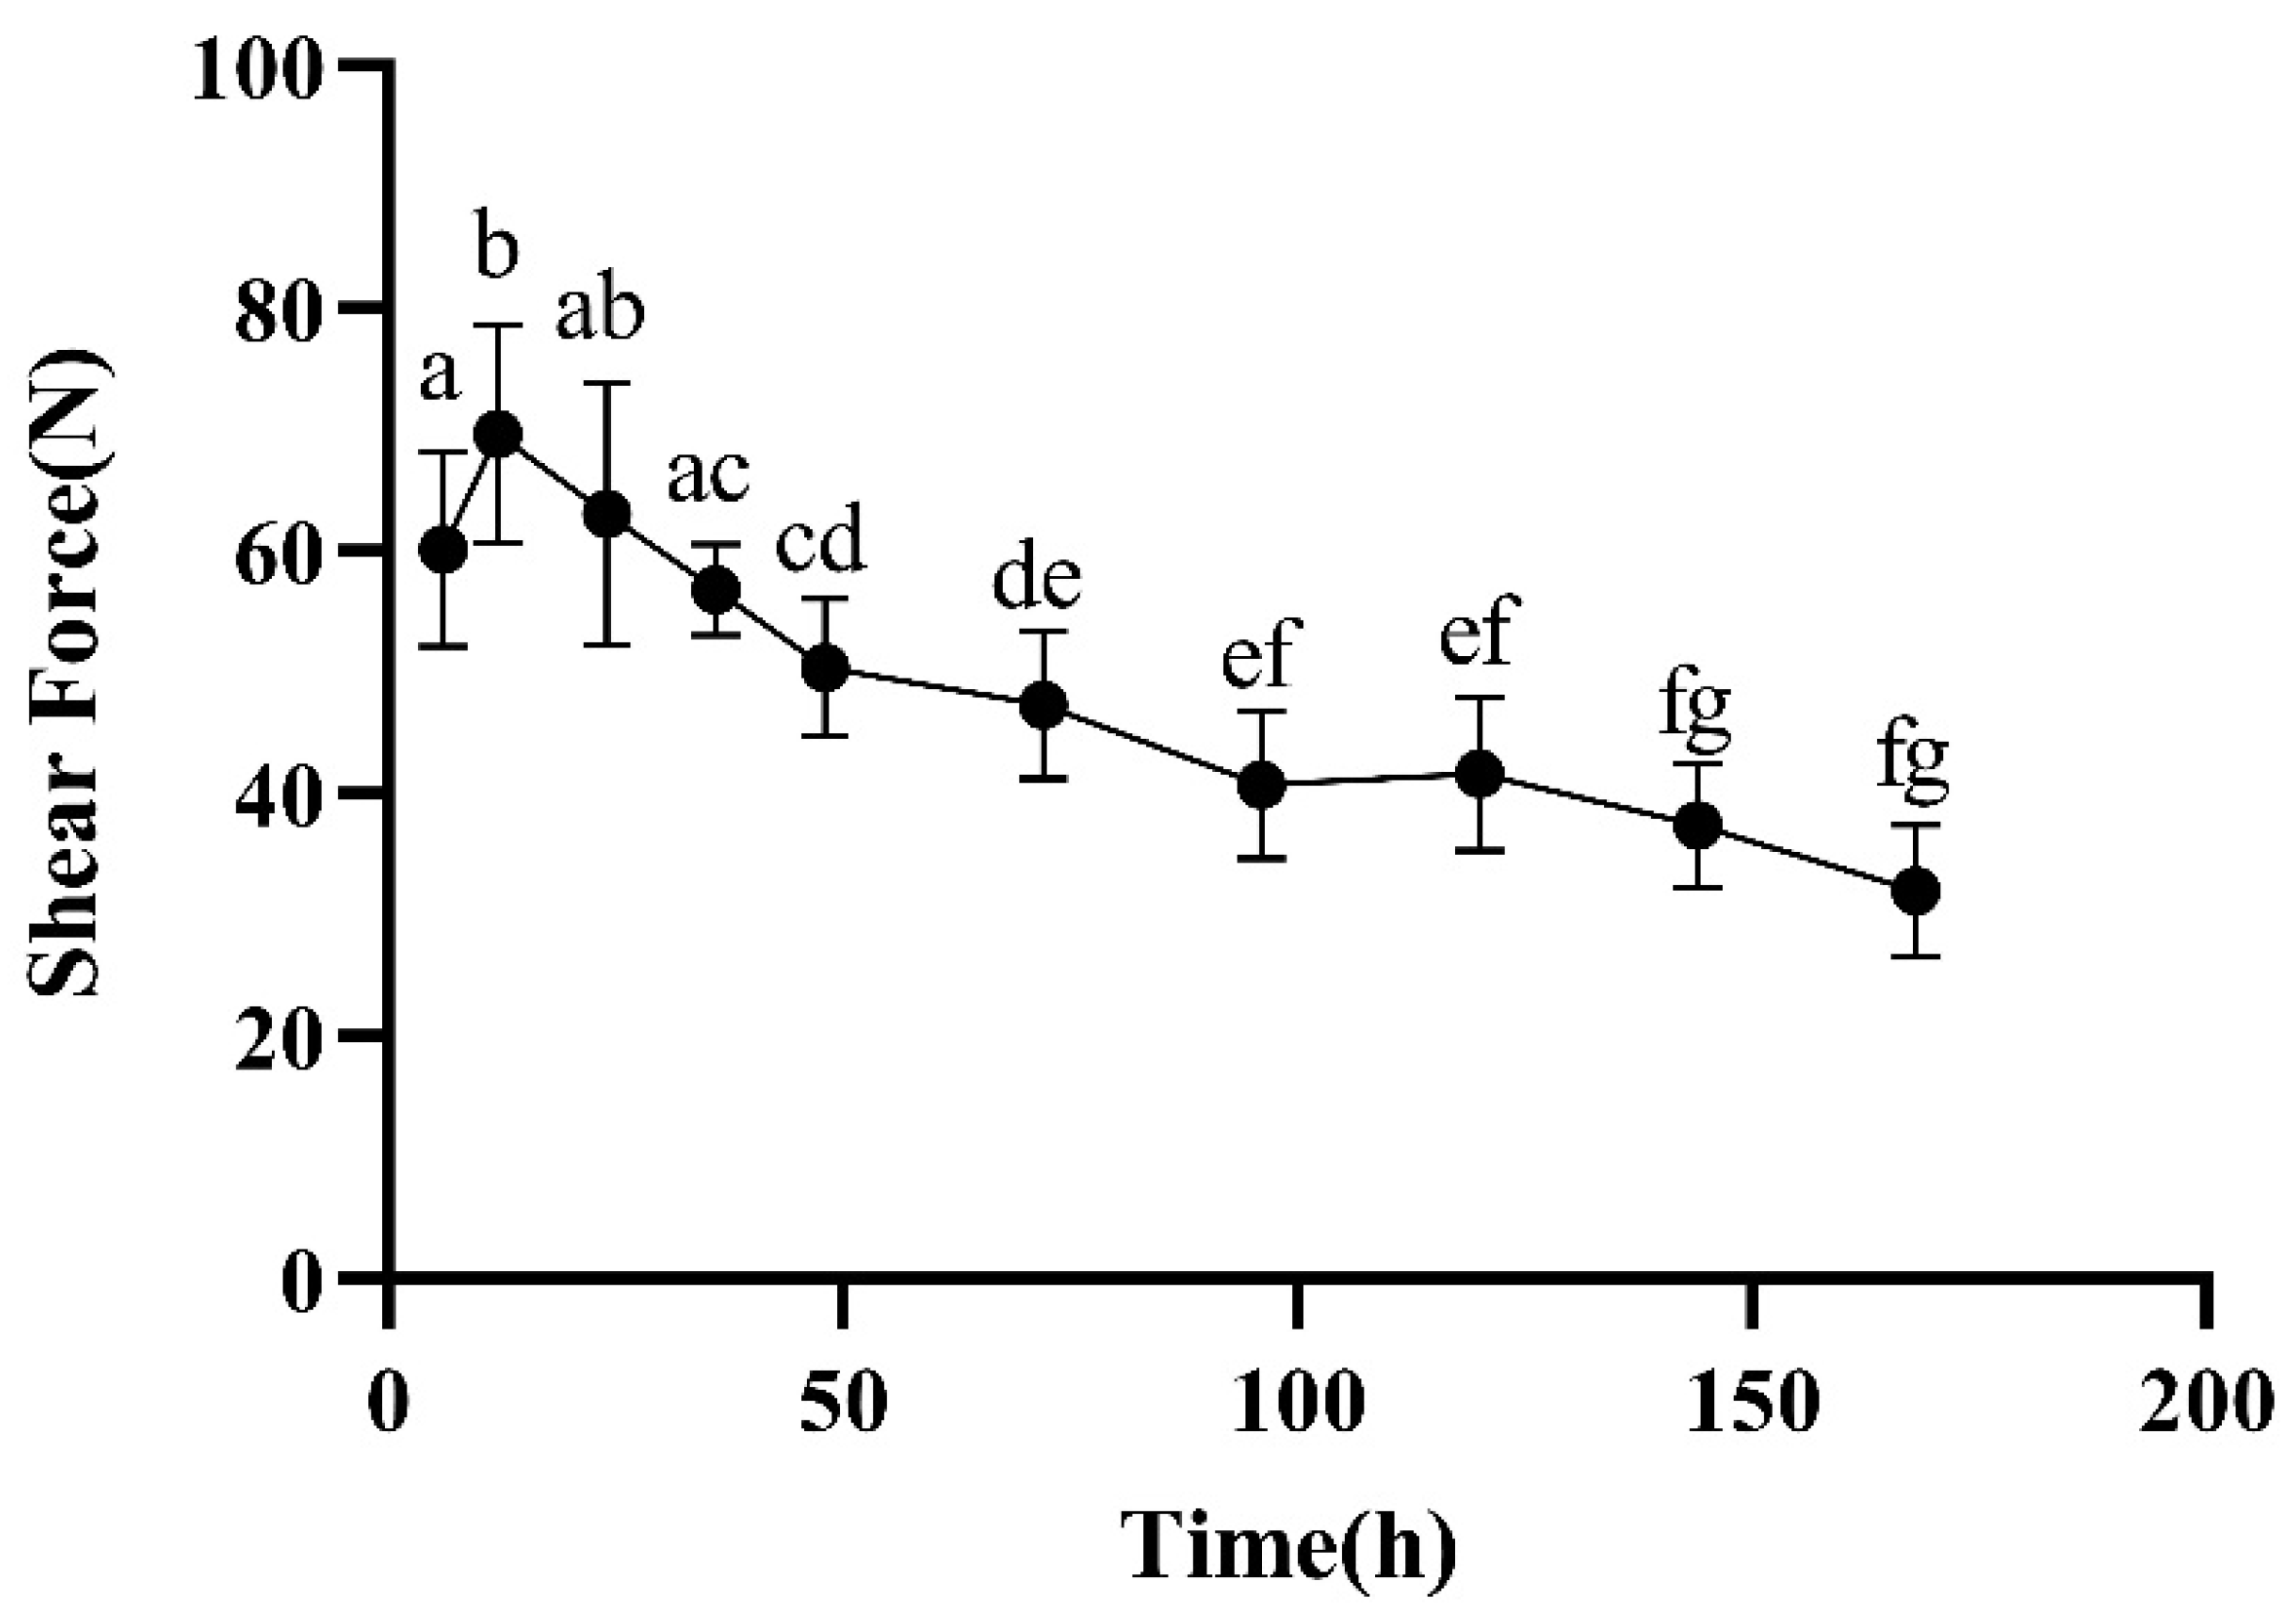
2.2.2. Shear Forces
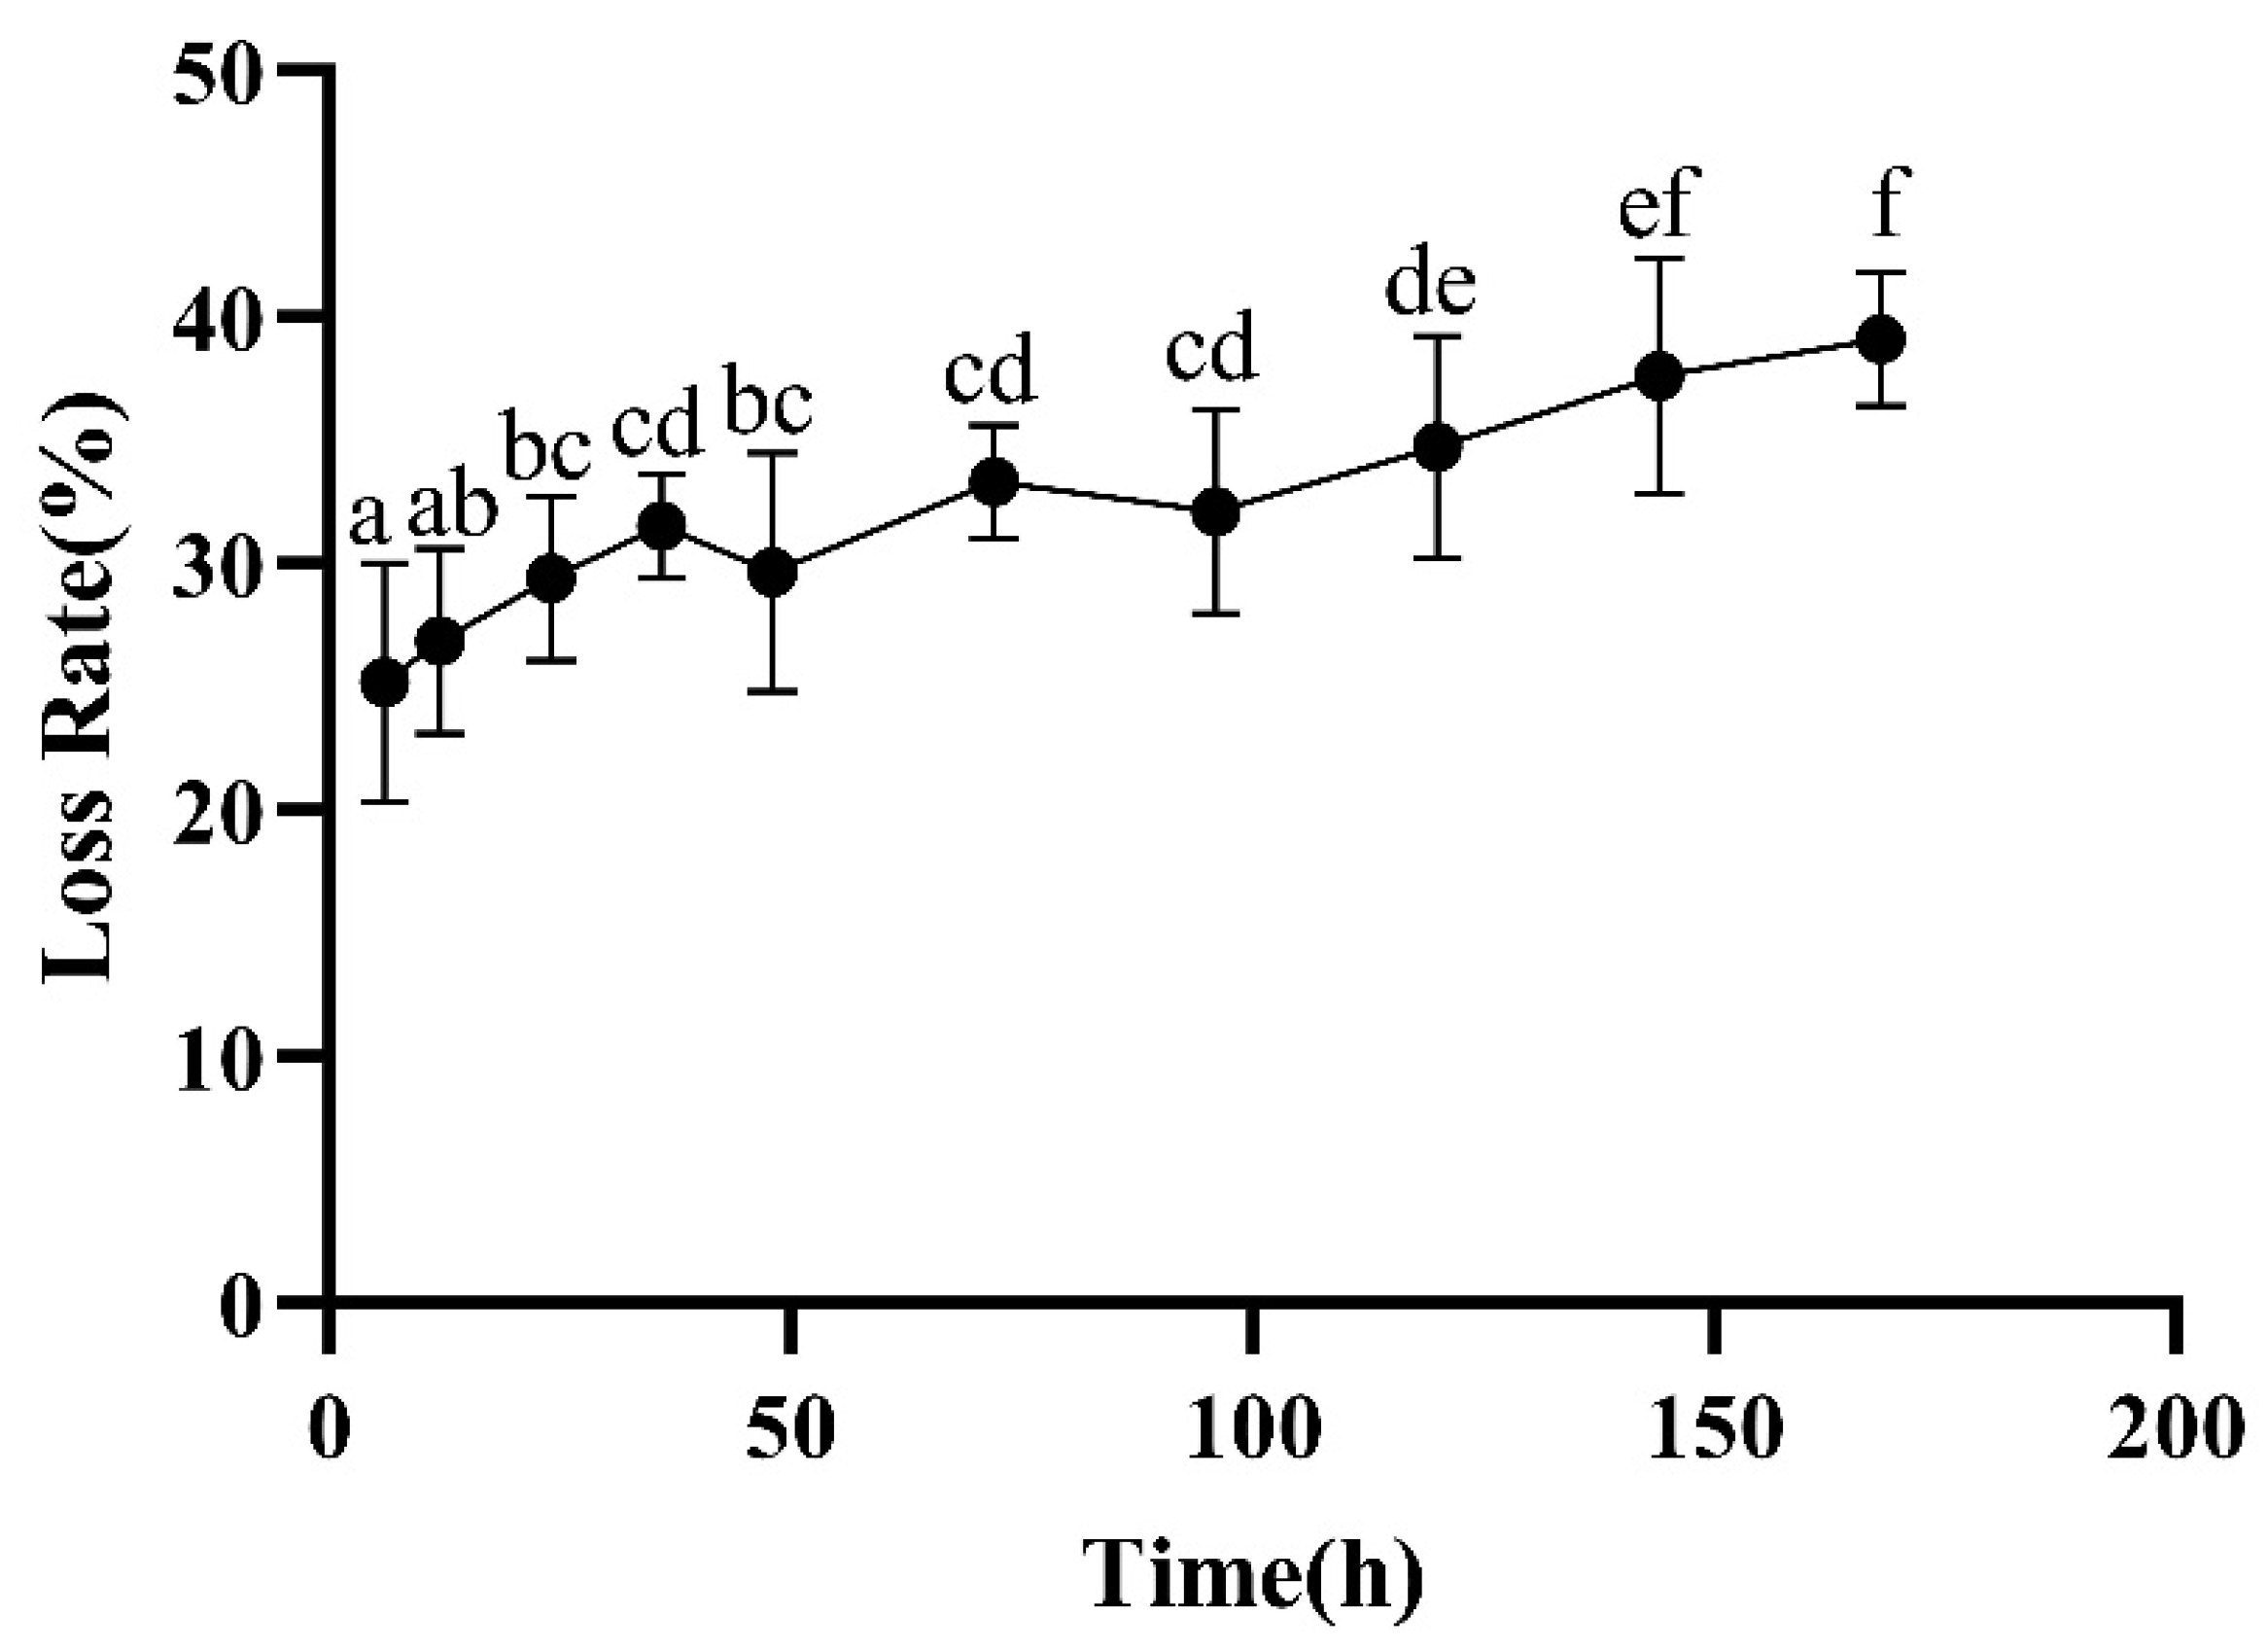
2.2.3. Loss Rate
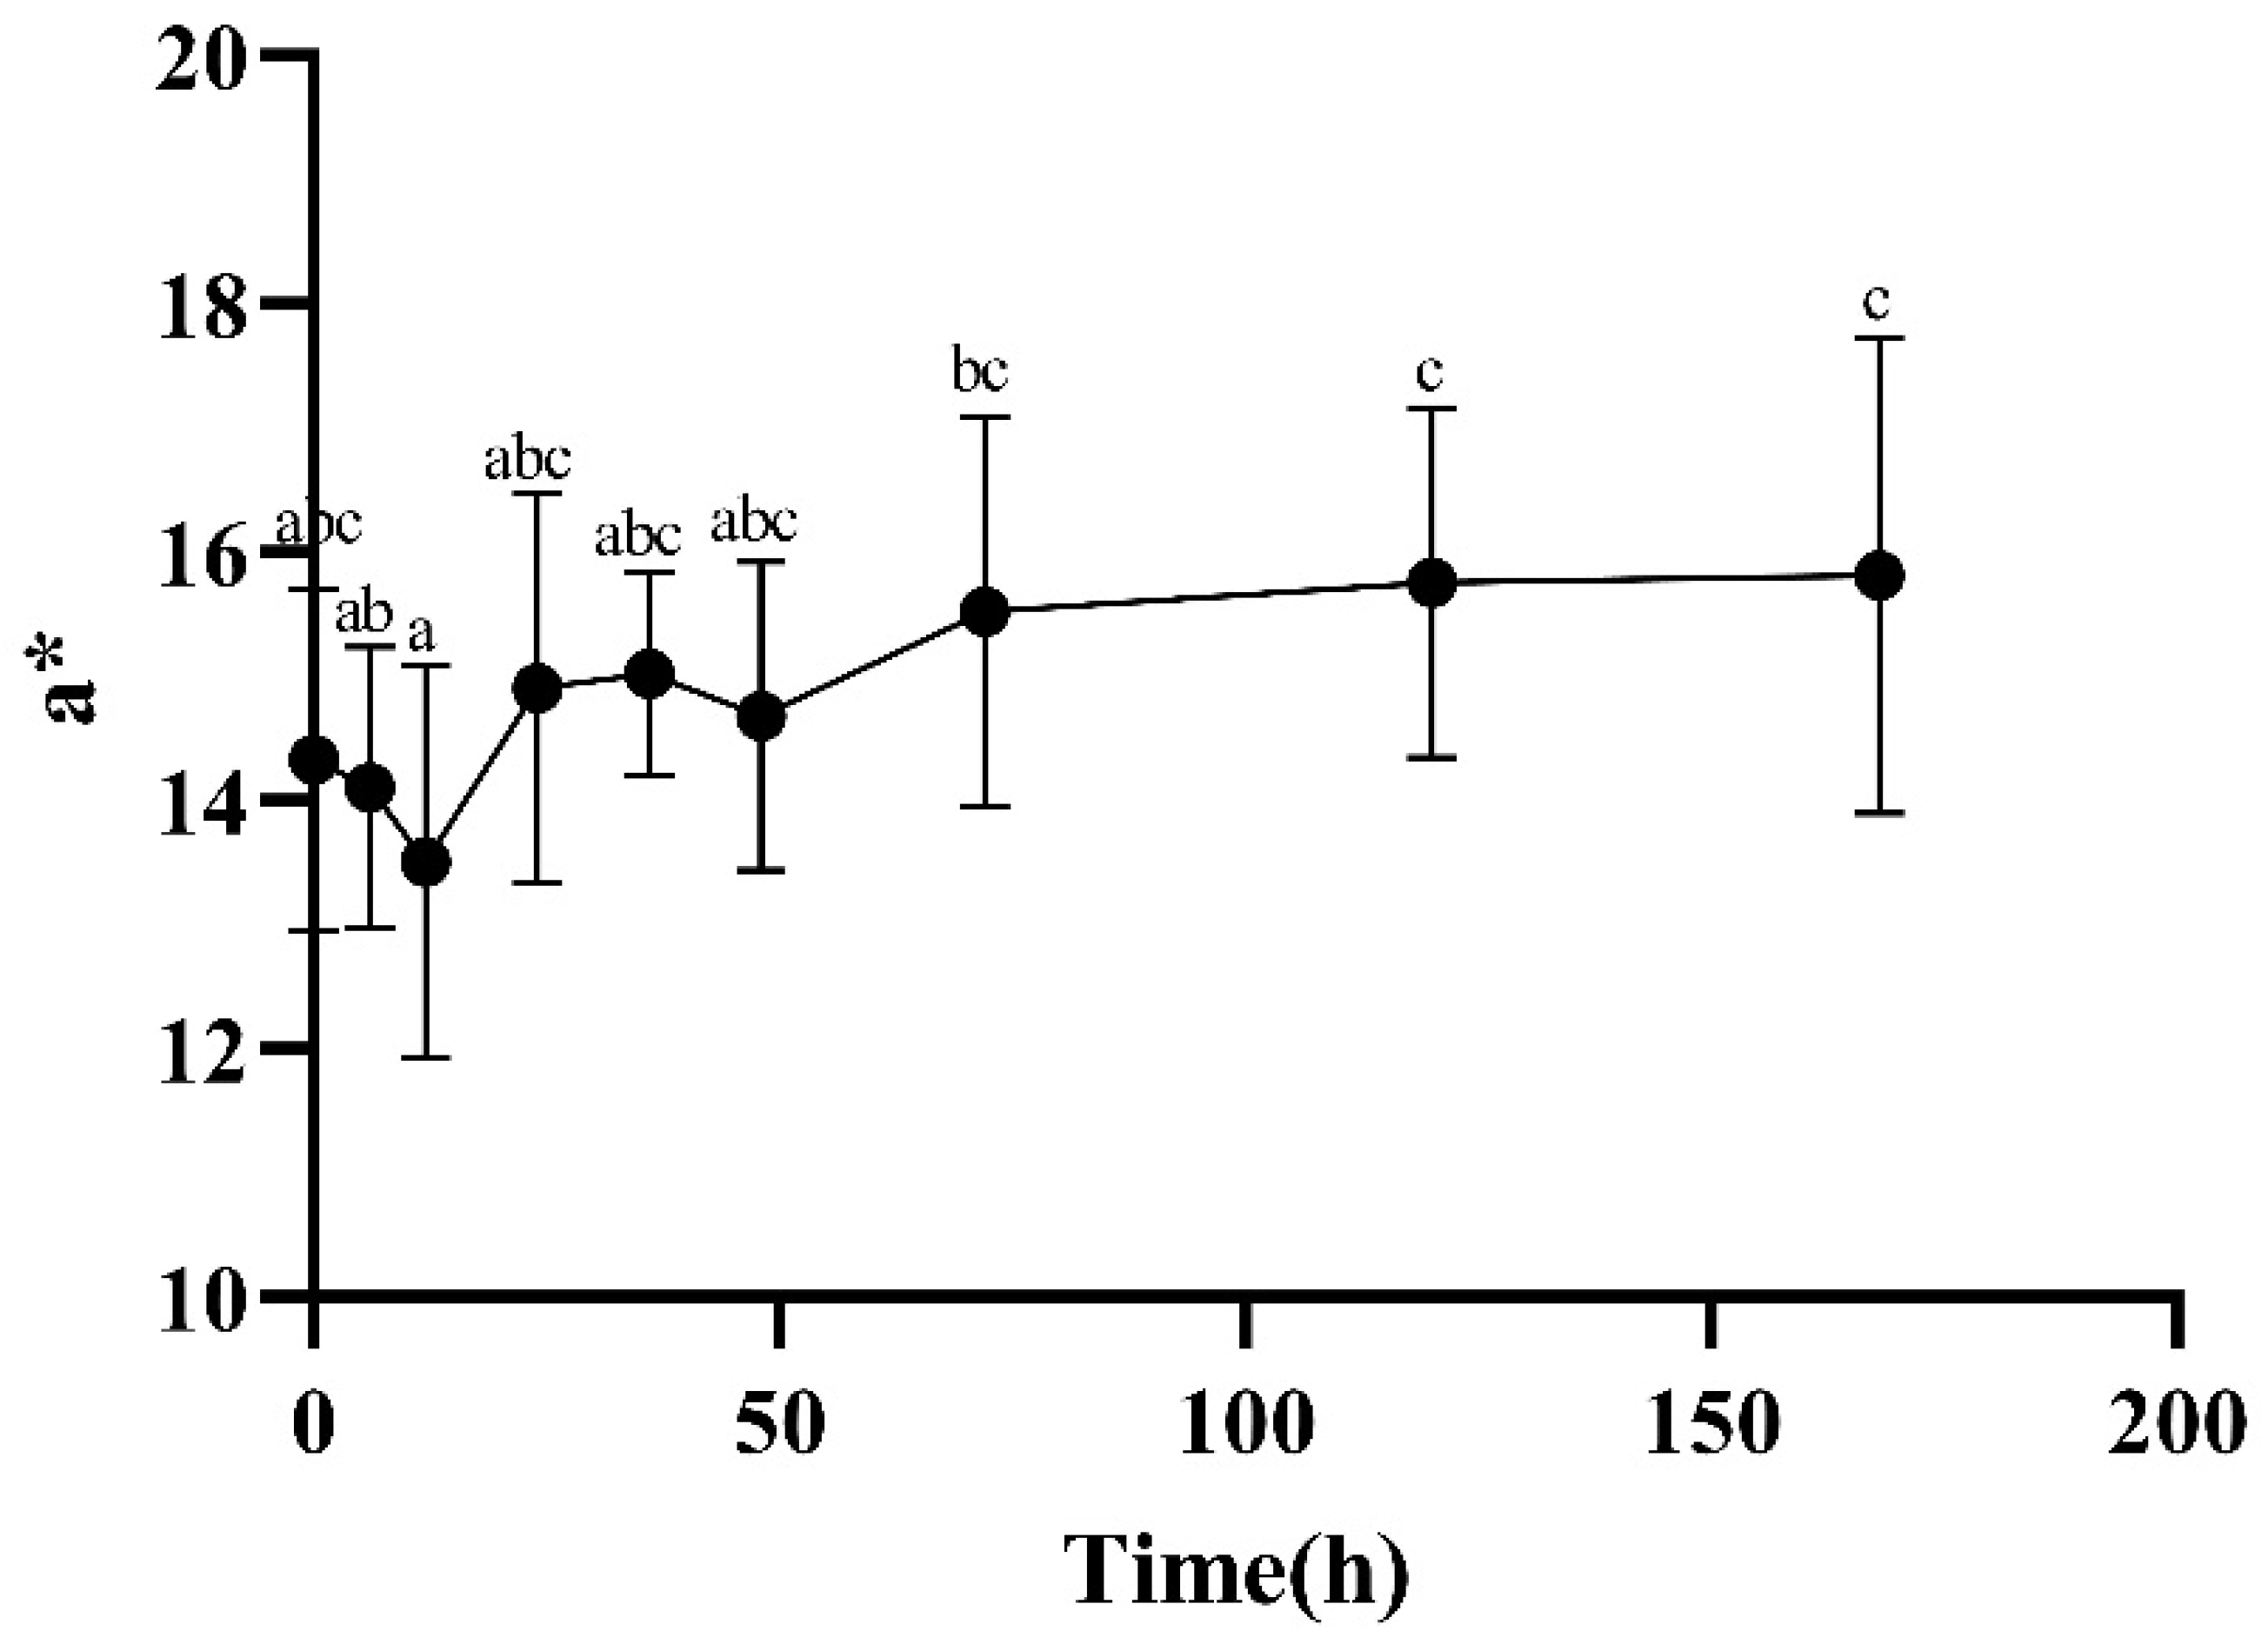
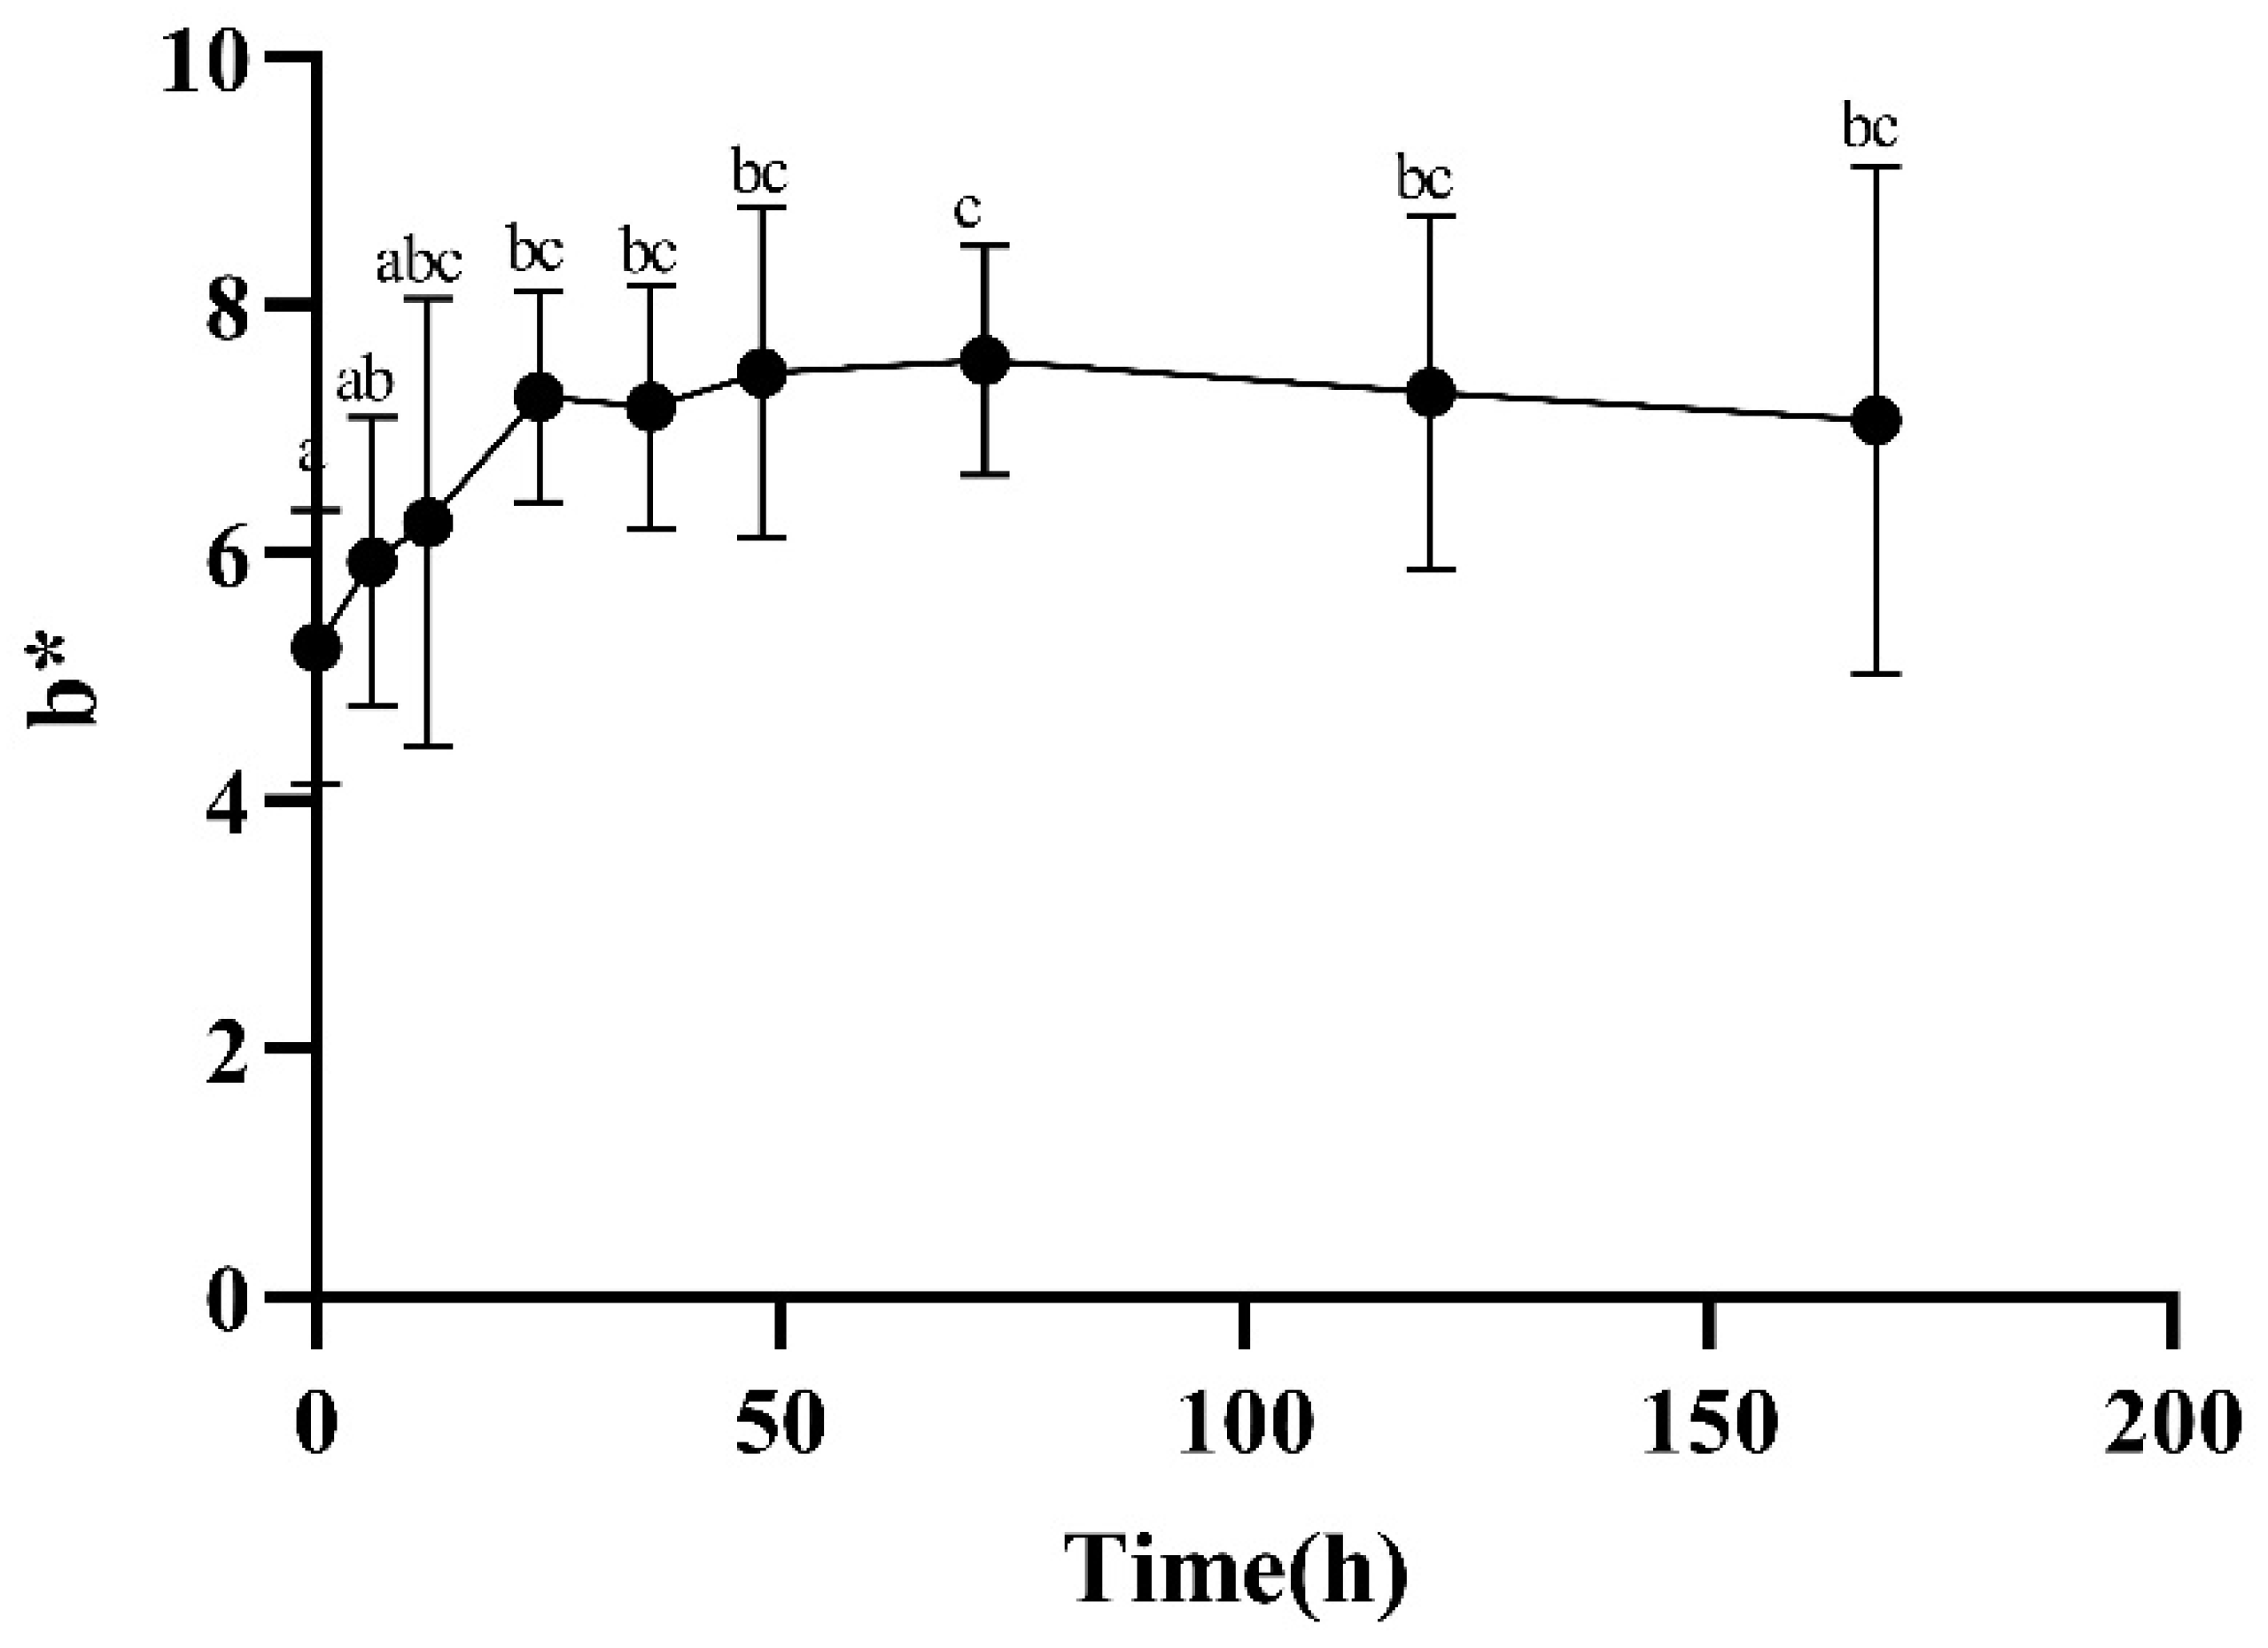
2.2.4. Color Measurements
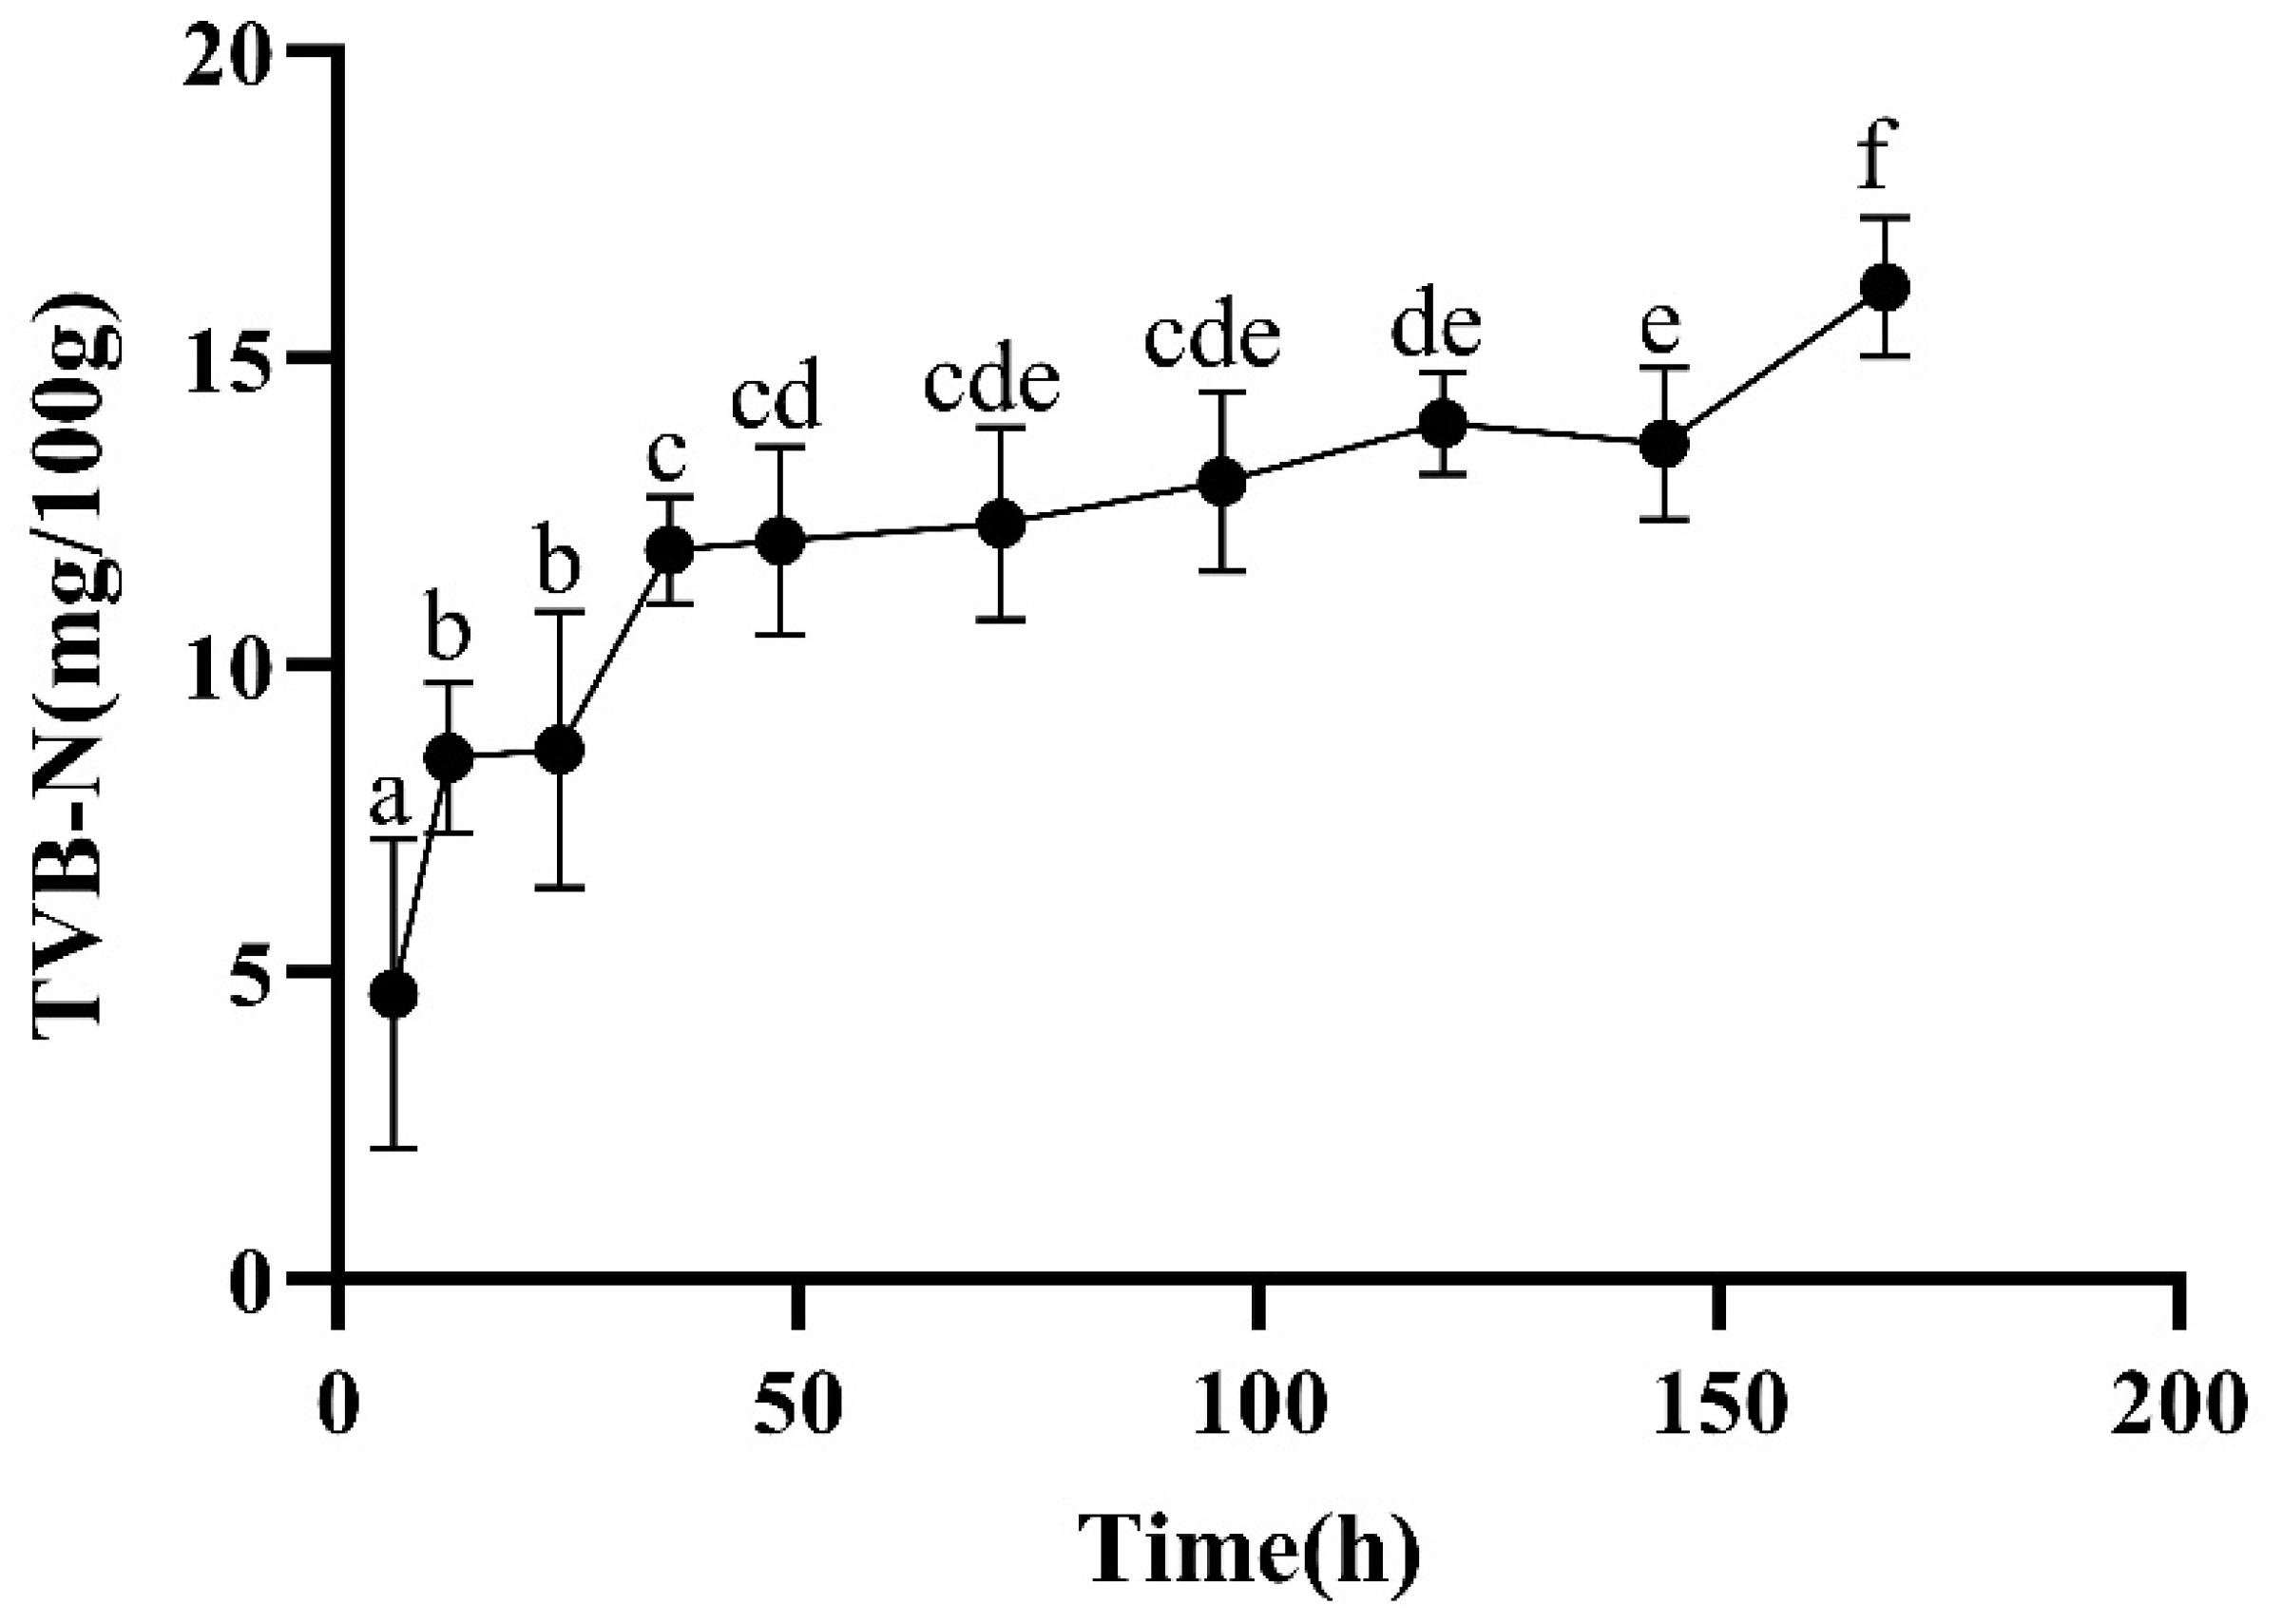
2.2.5. TVB-N
2.3. Observation of Muscle Fiber Morphology
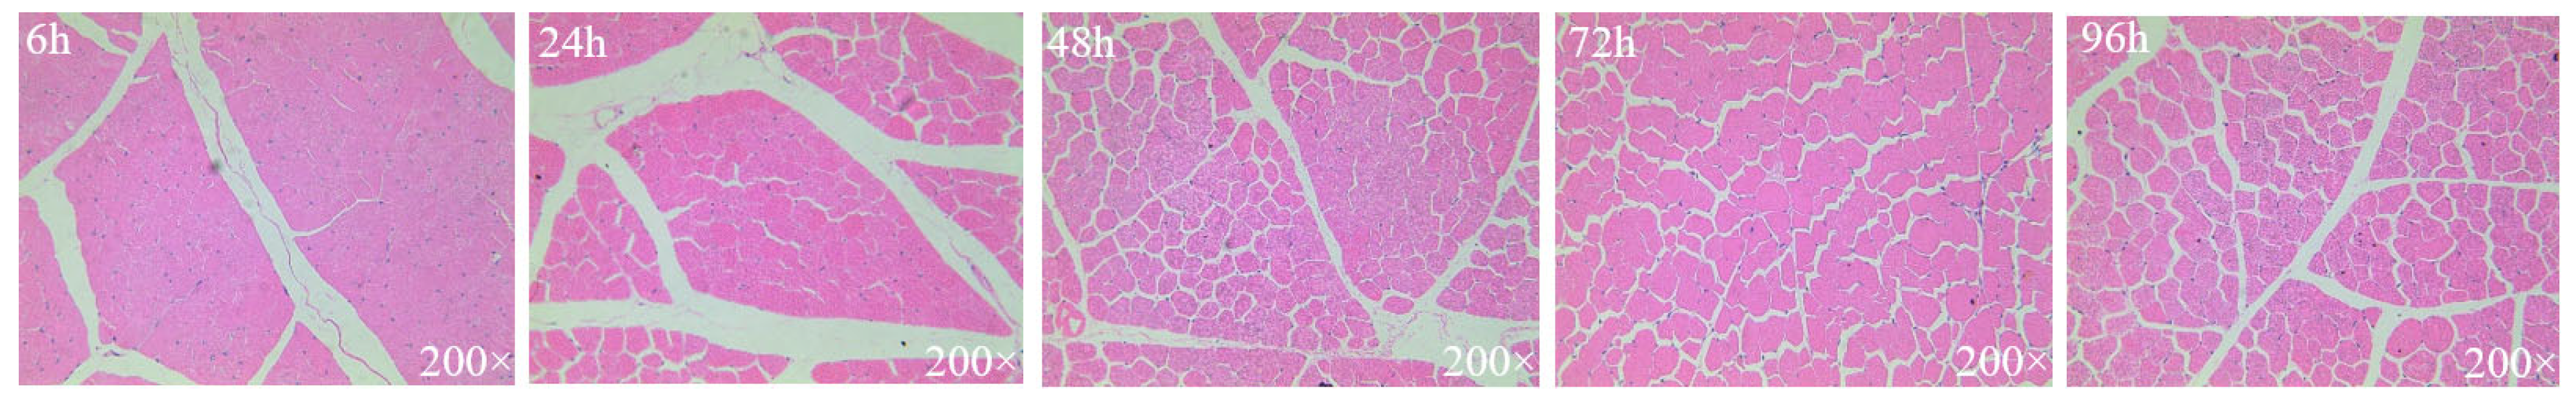
2.3.1. HE Staining and Observation
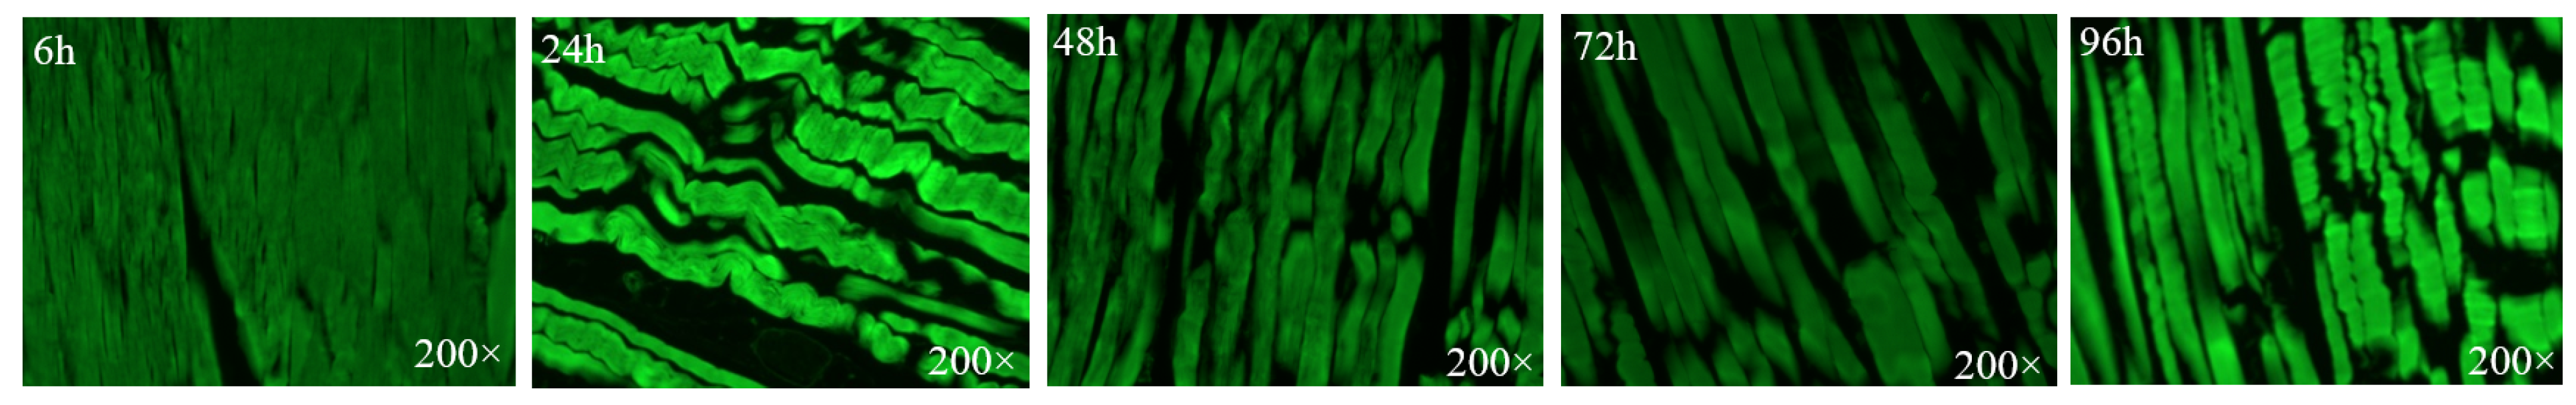
2.3.2. Staining and Observation of Skeleton Proteins
2.4. Metabolite Extraction from Hu Sheep Meats
2.5. UPLC I-Class Plus Method
2.6. Data Processing and Statistical Analysis
3. Results and Discussion
3.1. pH and Share Forces
3.2. Color, Loss Rate, and TVB-N
3.3. Muscle Fibers
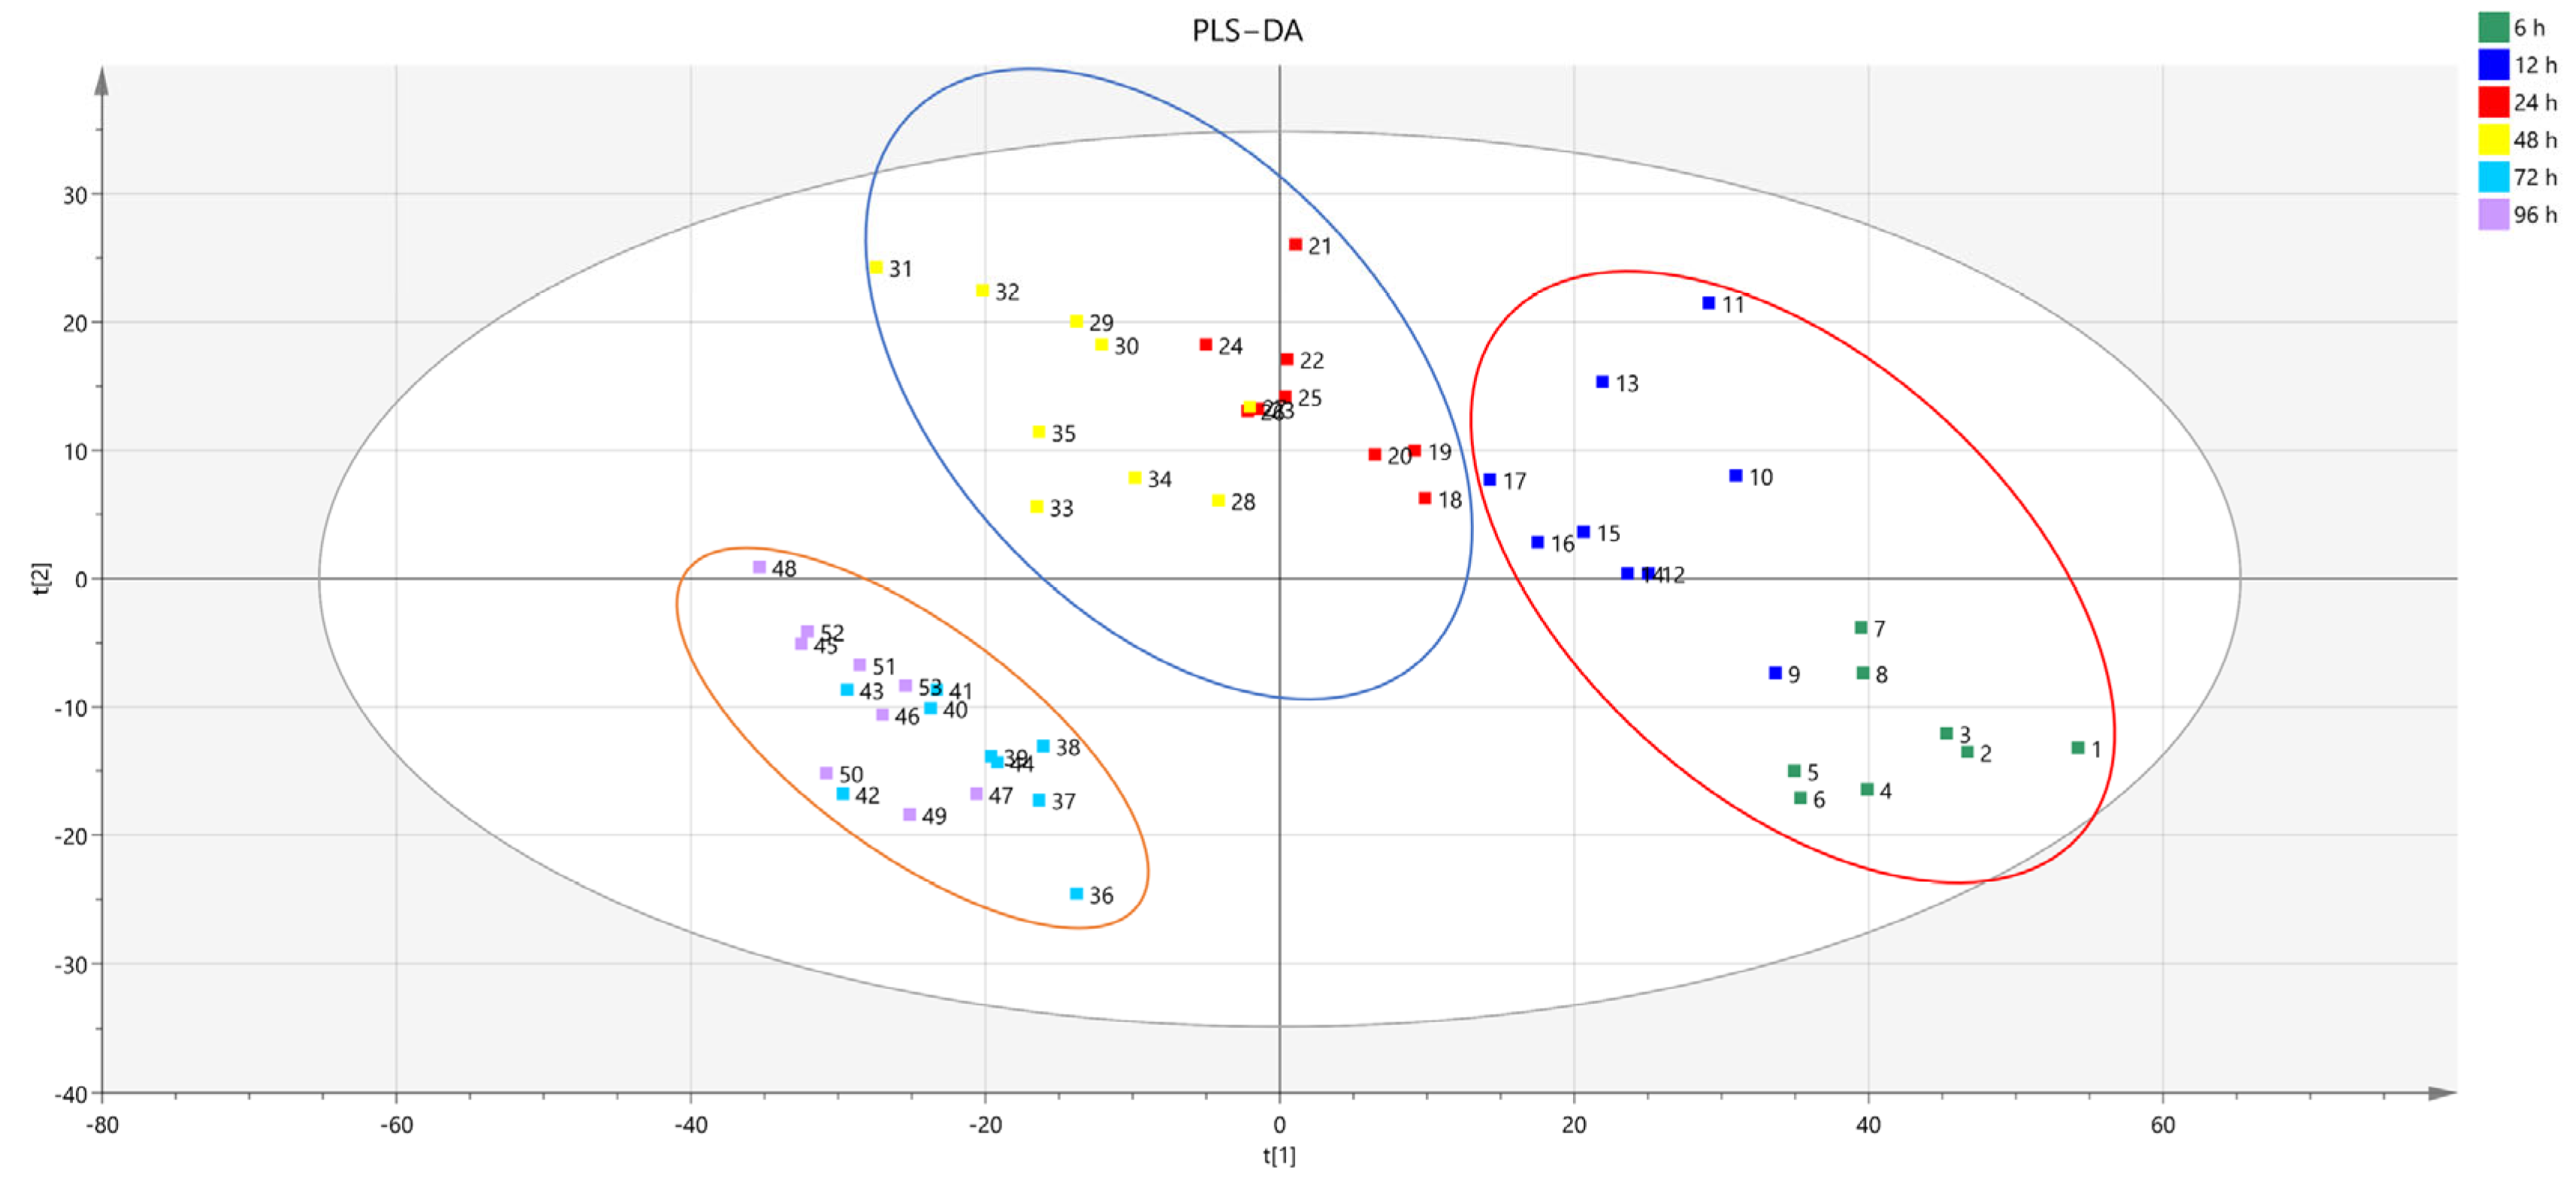
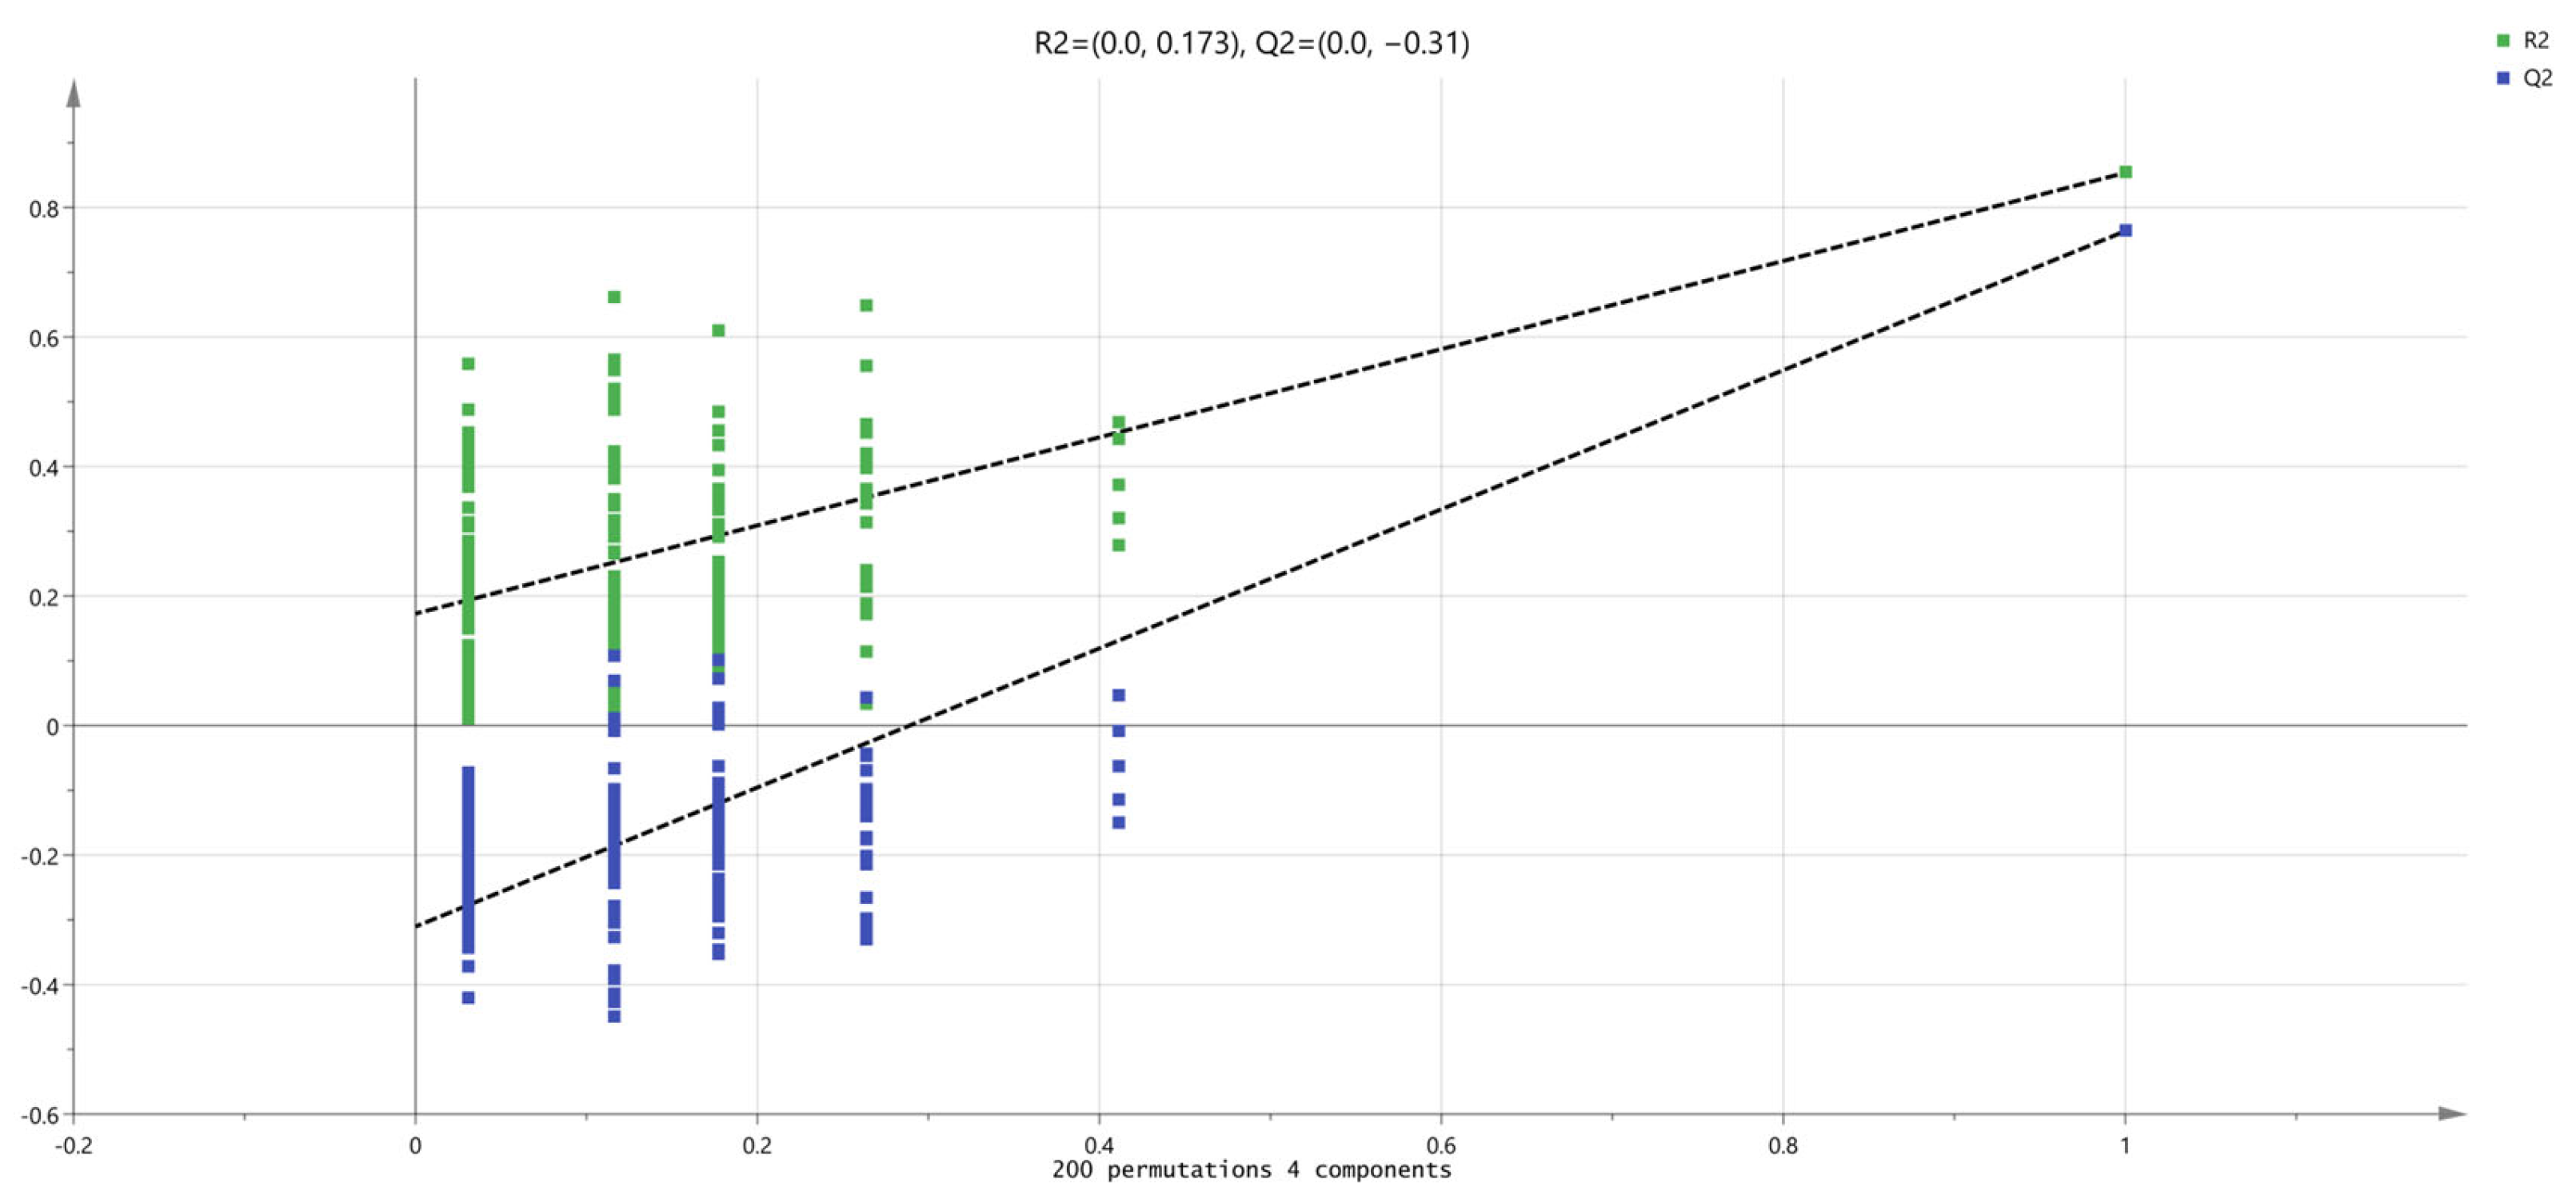
3.4. Untargeted Metabolic Profiling of Hu Sheep
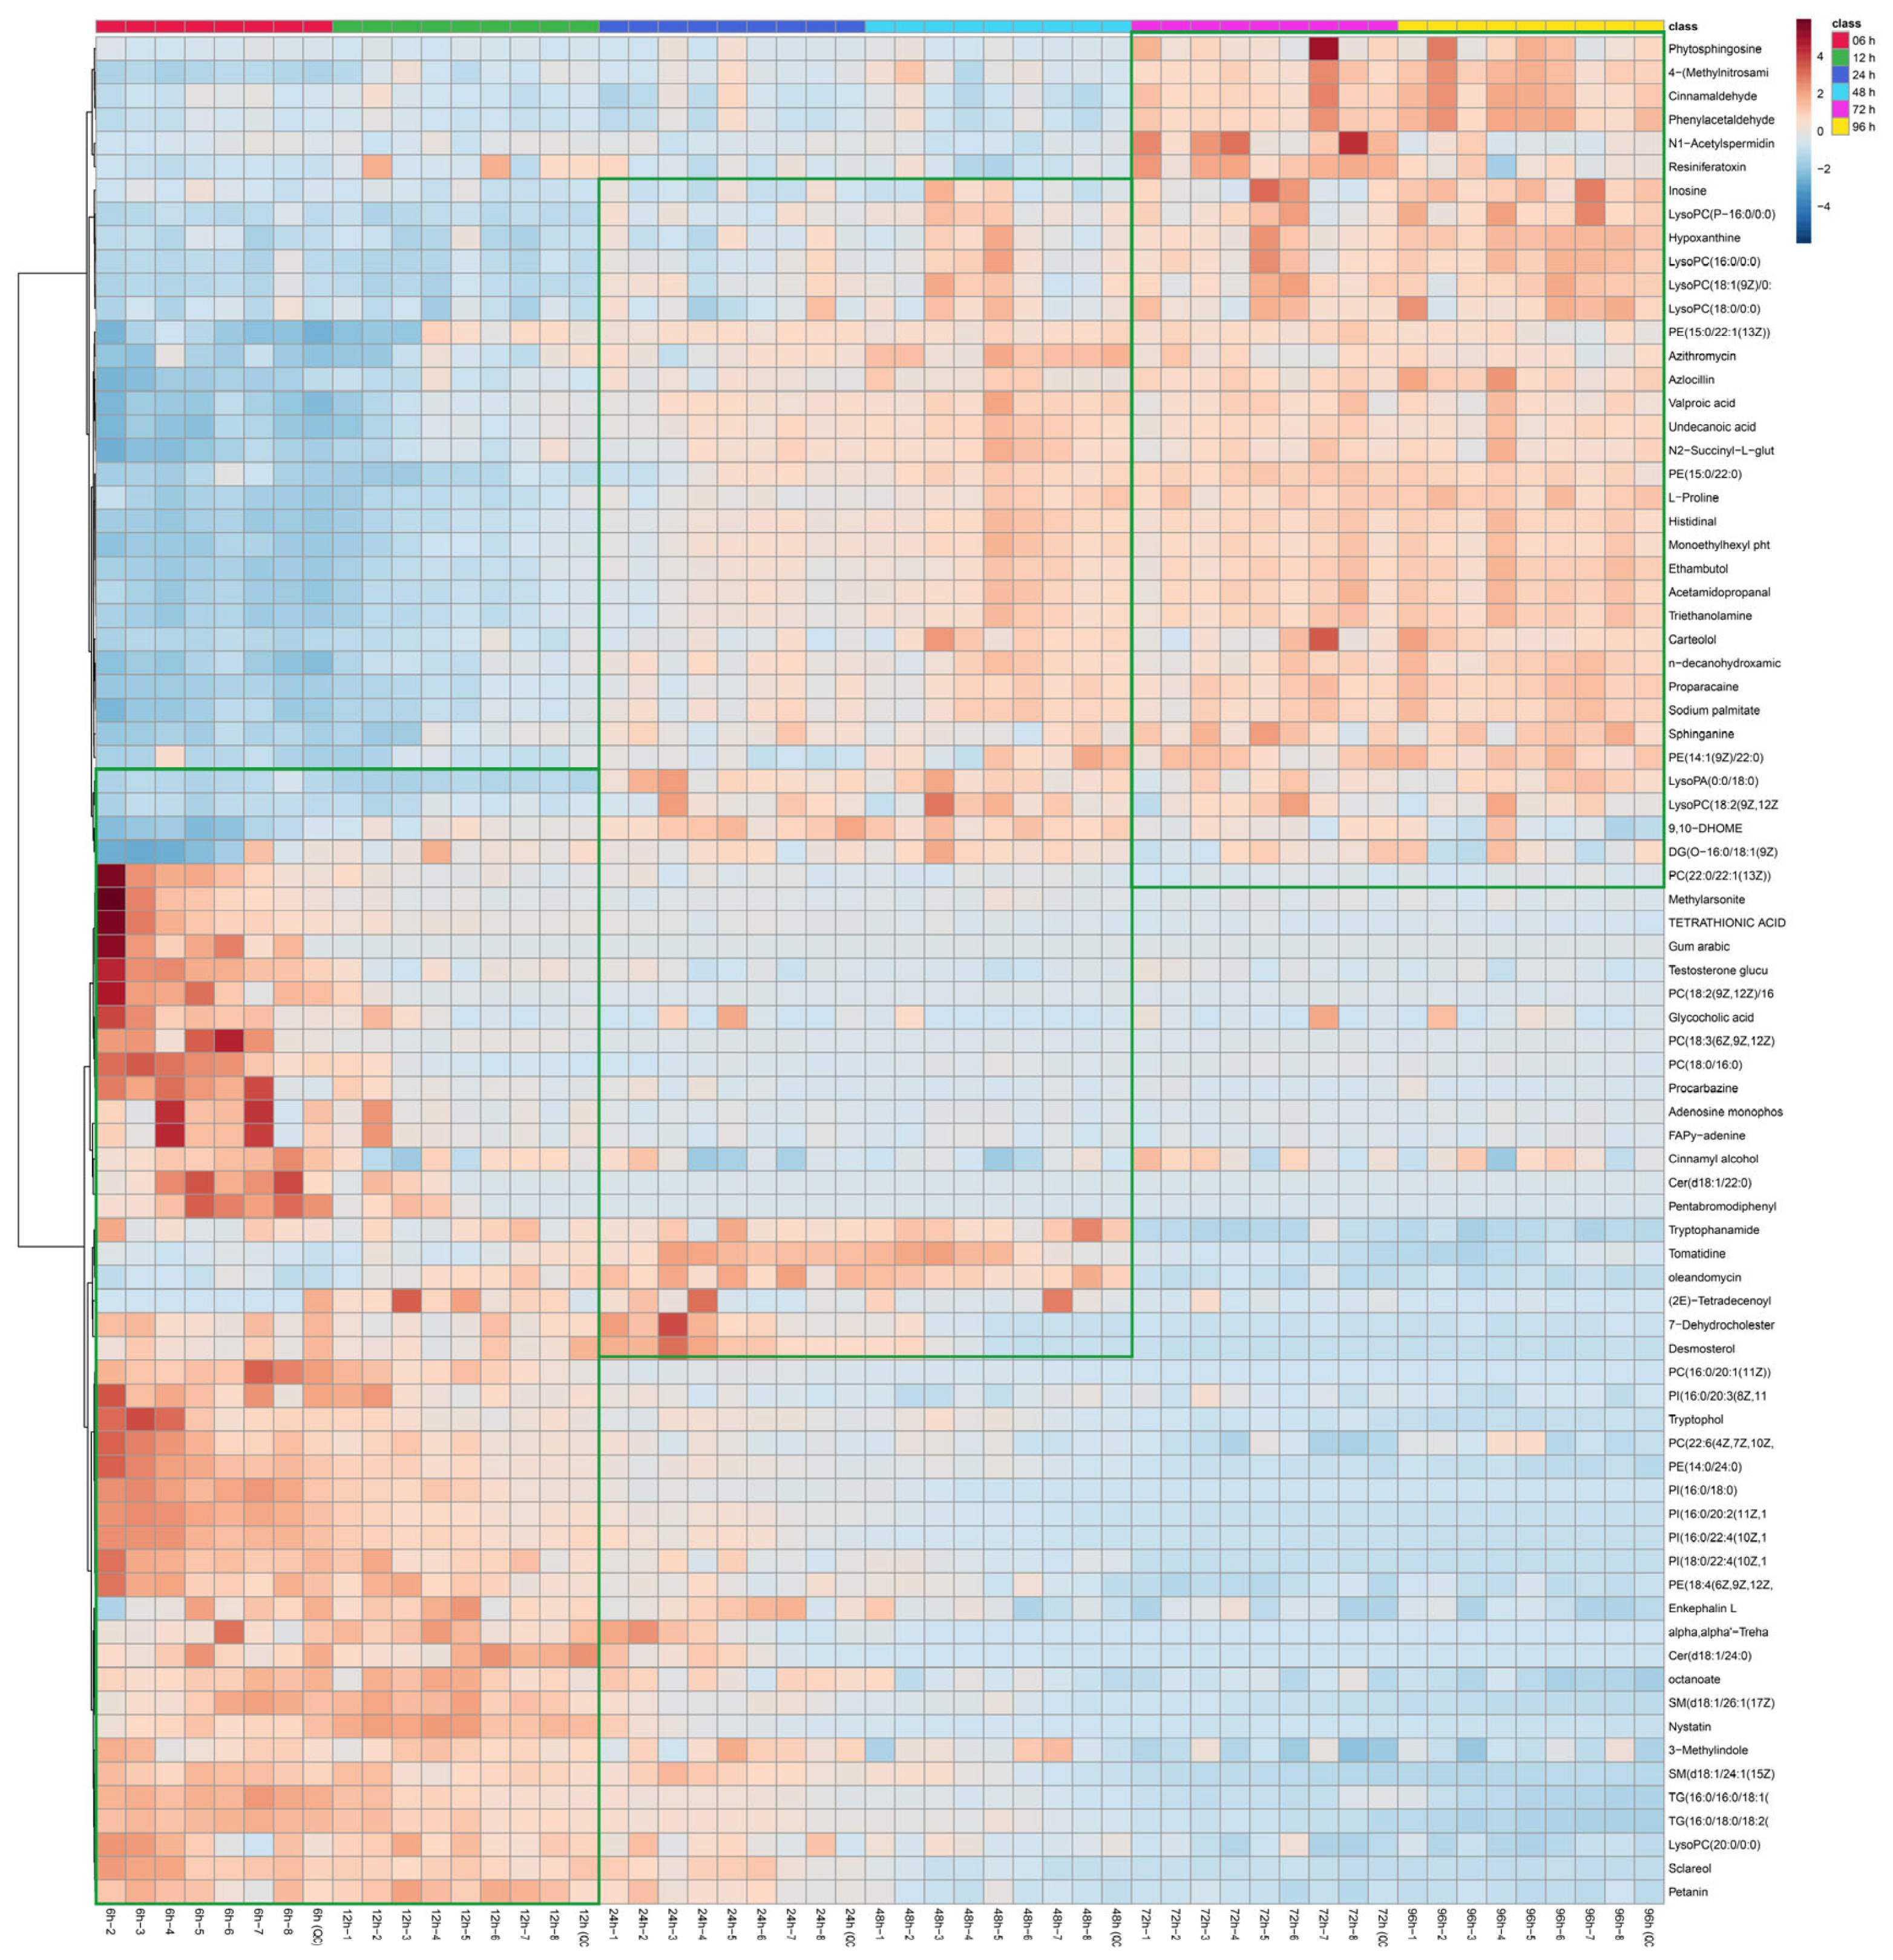
3.5. Comparison of Metabolites of Hu Sheep Meat
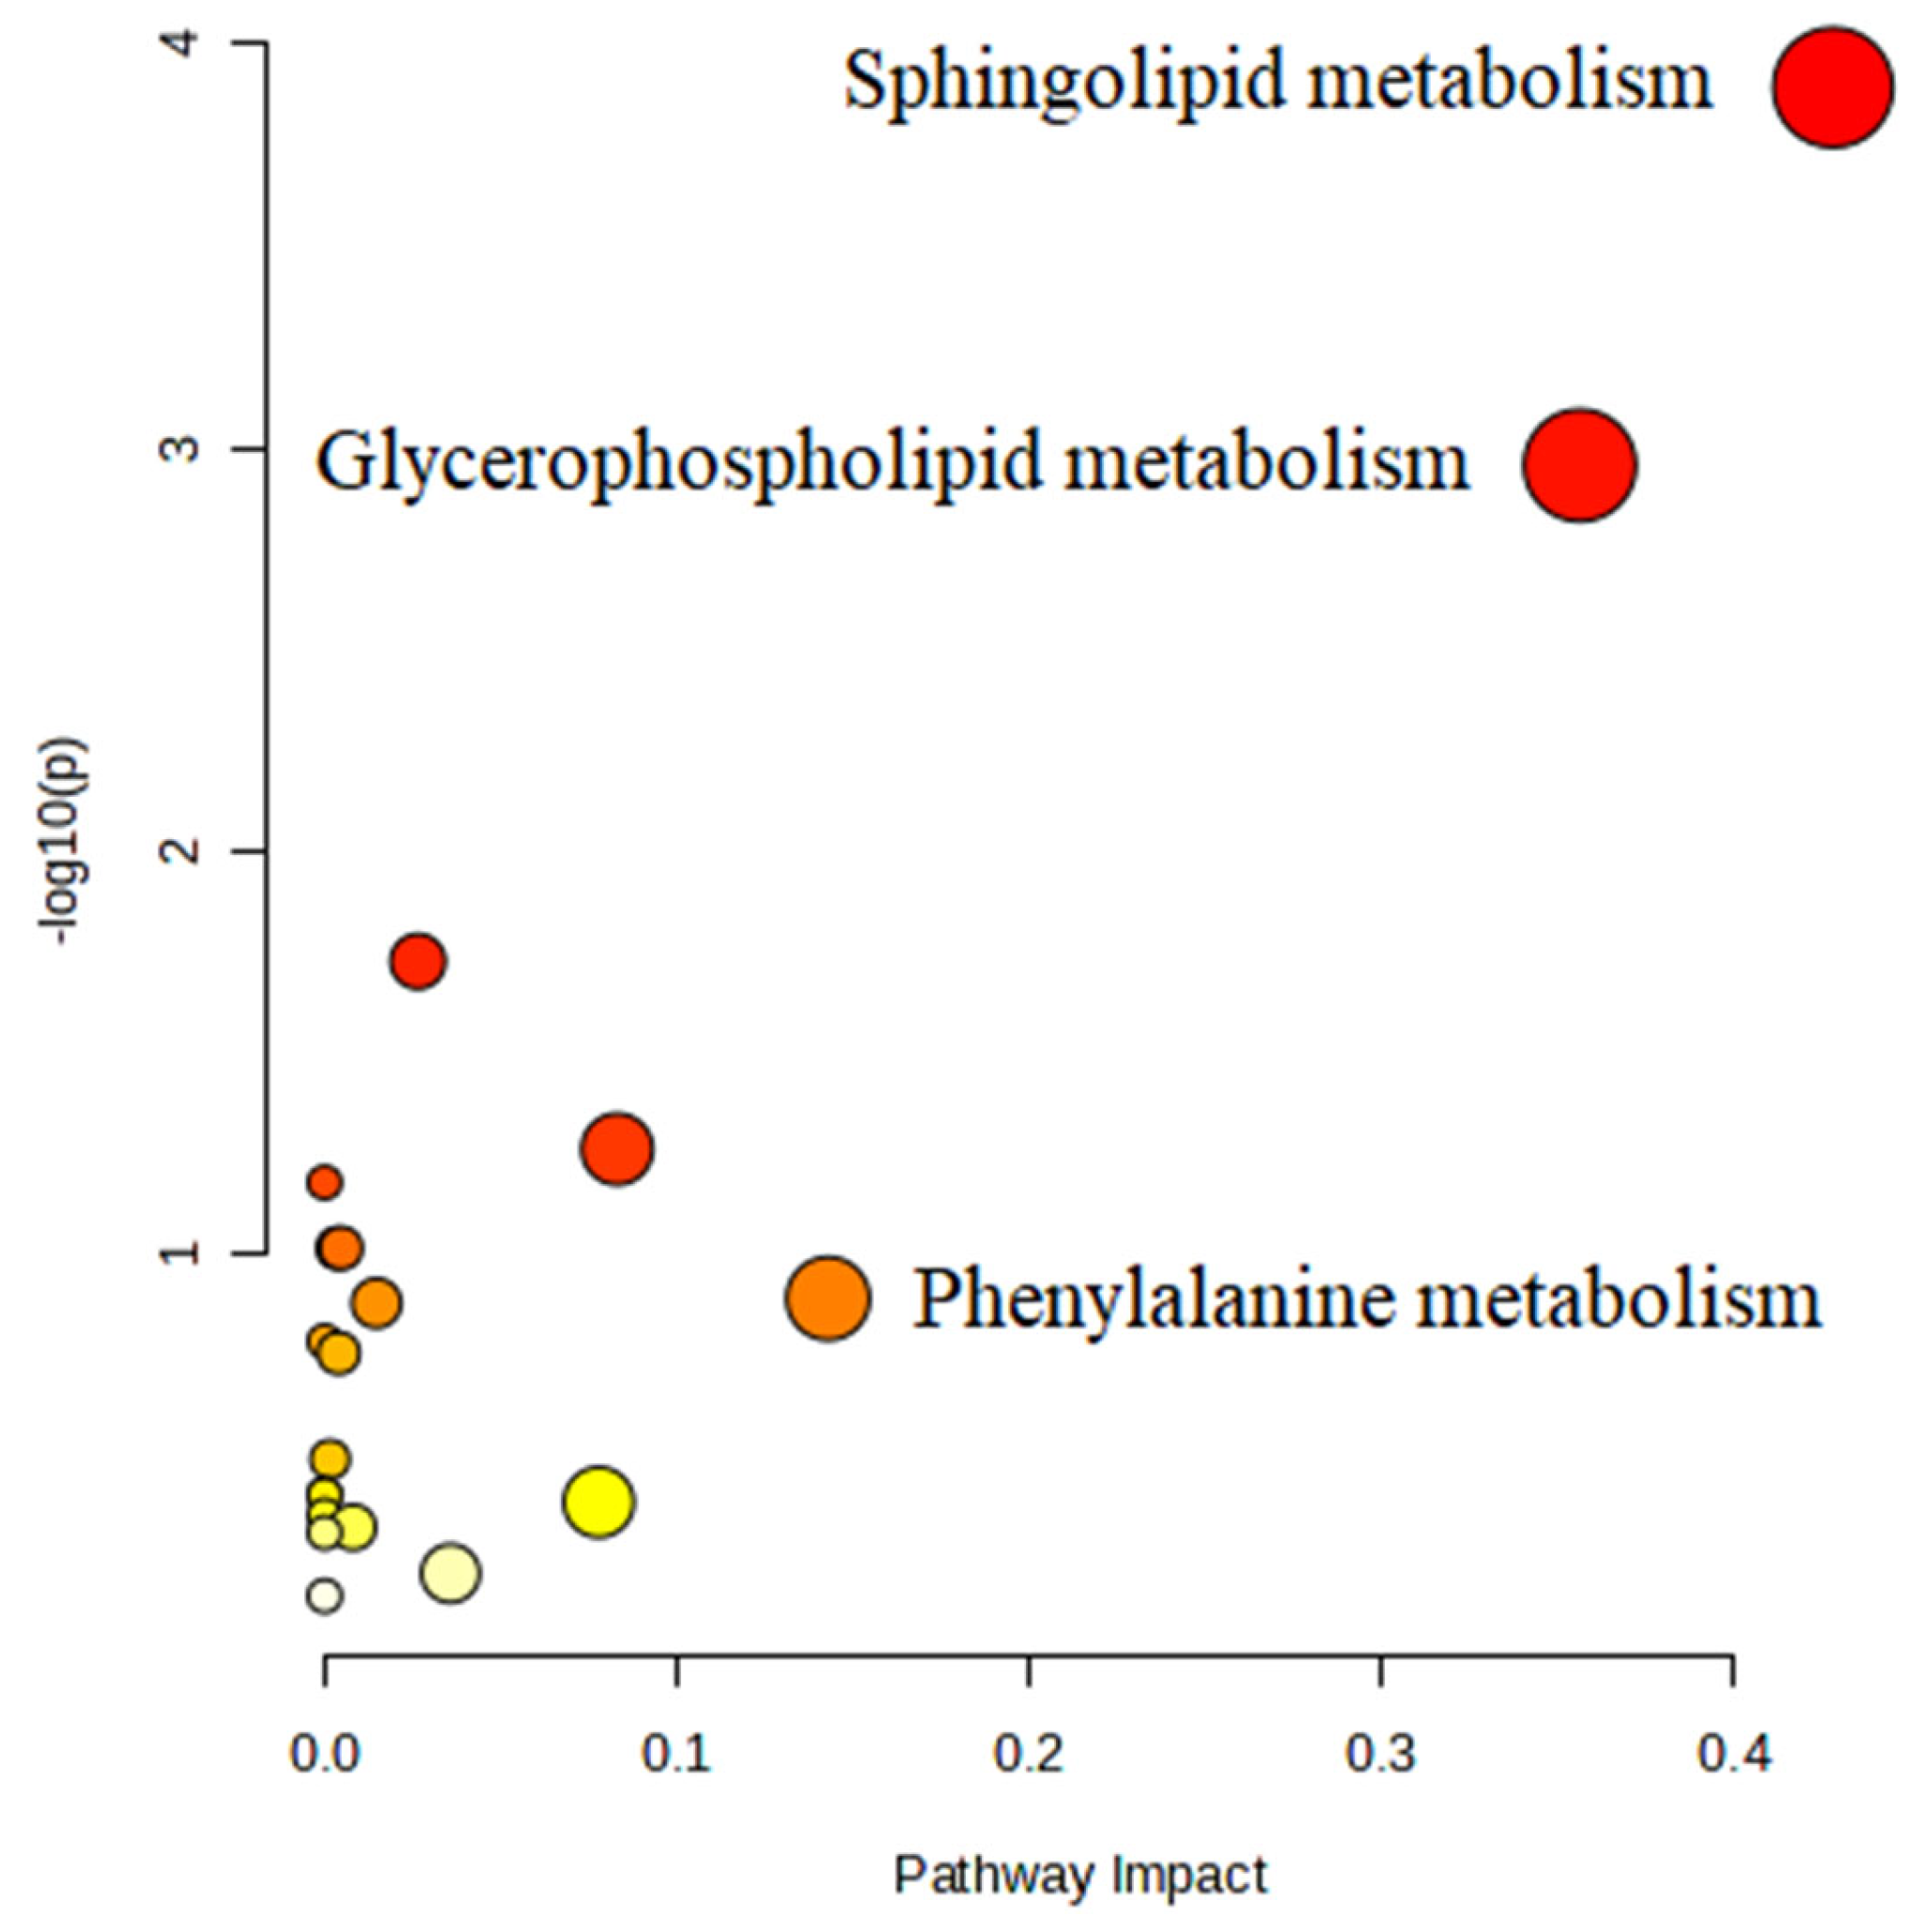
3.6. Metabolic Pathway Analysis
3.7. Differential Metabolites Related to the Flesh Quality of Hu Sheep Meat
4. Conclusions
Supplementary Materials
Author Contributions
Funding
Institutional Review Board Statement
Informed Consent Statement
Data Availability Statement
Conflicts of Interest
References
- Jiménez-Colmenero, F.; Herrero, A.M.; Cofrades, S.; Ruiz-Capillas, C. Meat: Eating Quality and Preservation. In Encyclopedia of Food and Health; Elsevier: Amsterdam, The Netherlands, 2016; pp. 685–692. [Google Scholar]
- Kantono, K.; Hamid, N.; Ma, Q.; Chadha, D.; Oey, I. Consumers’ perception and purchase behaviour of meat in China. Meat Sci. 2021, 179, 108548. [Google Scholar] [CrossRef]
- Zhang, M.; Su, R.; Corazzin, M.; Hou, R.; Zhang, Y.; Sun, L.; Hu, G.; Dou, L.; Guo, Y.; Su, L.; et al. Lipid transformation during postmortem chilled aging in Mongolian sheep using lipidomics. Food Chem. 2023, 405, 134882. [Google Scholar] [CrossRef] [PubMed]
- Hastie, M.; Ha, M.; Jacob, R.H.; Hepworth, G.; Torrico, D.D.; Warner, R.D. High consumer acceptance of mutton and the influence of ageing method on eating quality. Meat Sci. 2022, 189, 108813. [Google Scholar] [CrossRef] [PubMed]
- Bakhsh, A.; Hwang, Y.H.; Joo, S.T. Effect of Slaughter Age on Muscle Fiber Composition, Intramuscular Connective Tissue, and Tenderness of Goat Meat during Post-Mortem Time. Foods 2019, 8, 571. [Google Scholar] [CrossRef] [PubMed]
- Holman, B.W.B.; Kerr, M.J.; Refshauge, G.; Diffey, S.M.; Hopkins, D.L. Post-mortem pH decline in lamb semitendinosus muscle and its relationship to the pH decline parameters of the longissimus lumborum muscle: A pilot study. Meat Sci. 2021, 176, 108473. [Google Scholar] [CrossRef] [PubMed]
- Insausti, K.; Murillo-Arbizu, M.T.; Urrutia, O.; Mendizabal, J.A.; Beriain, M.J.; Colle, M.J.; Bass, P.D.; Arana, A. Volatile compounds, odour and flavour attributes of lamb meat from the Navarra breed as affected by ageing. Foods 2021, 10, 493. [Google Scholar] [CrossRef] [PubMed]
- Zheng, N.; Zhang, L.; Xin, Q.; Miao, Z.; Huang, Y. Changes in antioxidant enzymes in postmortem muscle and effects on meat quality from three duck breeds during cold storage. Can. J. Anim. Sci. 2019, 100, 234–243. [Google Scholar] [CrossRef]
- Ijaz, M.; Jaspal, M.H.; Hayat, Z.; Yar, M.K.; Badar, I.H.; Ullah, S.; Hussain, Z.; Ali, S.; Farid, M.U.; Farooq, M.Z. Effect of animal age, postmortem chilling rate, and aging time on meat quality attributes of water buffalo and humped cattle bulls. Anim. Sci. J. 2020, 91, e13354. [Google Scholar] [CrossRef]
- Orkusz, A.; Haraf, G.; Okruszek, A.; Wereńska-Sudnik, M. Lipid oxidation and color changes of goose meat stored under vacuum and modified atmosphere conditions. Poult. Sci. 2017, 96, 731–737. [Google Scholar] [CrossRef]
- Hwang, S.-I.; Hong, G.-P. Effects of high pressure in combination with the type of aging on the eating quality and biochemical changes in pork loin. Meat Sci. 2020, 162, 108028. [Google Scholar] [CrossRef]
- Li, Y.; Chen, Z.; Fang, Y.; Cao, C.; Zhang, Z.; Pan, Y.; Wang, Q. Runs of Homozygosity Revealed Reproductive Traits of Hu Sheep. Genes 2022, 13, 1848. [Google Scholar] [CrossRef] [PubMed]
- Li, J.; Tang, C.; Yang, Y.; Hu, Y.; Zhao, Q.; Ma, Q.; Yue, X.; Li, F.; Zhang, J. Characterization of meat quality traits, fatty acids and volatile compounds in Hu and Tan sheep. Front. Nutr. 2023, 10, 1072159. [Google Scholar] [CrossRef] [PubMed]
- Wang, Z.; Li, X.; Wang, T.; Liao, G.; Gu, J.; Hou, R.; Qiu, J. Lipidomic profiling study on neurobehavior toxicity in zebrafish treated with aflatoxin B1. Sci. Total Environ. 2023, 898, 165553. [Google Scholar] [CrossRef]
- Huang, Q.; Liu, L.; Wu, Y.; Huang, X.; Wang, G.; Song, H.; Geng, F.; Luo, P. Mechanism of differences in characteristics of thick/thin egg whites during storage: Physicochemical, functional and molecular structure characteristics analysis. Food Chem. 2022, 369, 130828. [Google Scholar] [CrossRef]
- Hou, X.; Liang, R.; Mao, Y.; Zhang, Y.; Niu, L.; Wang, R.; Liu, C.; Liu, Y.; Luo, X. Effect of suspension method and aging time on meat quality of Chinese fattened cattle M. Longissimus dorsi. Meat Sci. 2014, 96, 640–645. [Google Scholar] [CrossRef]
- Holman, B.W.B.; Bekhit, A.E.-D.A.; Waller, M.; Bailes, K.L.; Kerr, M.J.; Hopkins, D.L. The association between total vol-tile basic nitrogen (TVB-N) concentration and other biomarkers of quality and spoilage for vacuum packaged beef. Meat Sci. 2021, 179, 108551. [Google Scholar] [CrossRef]
- Yamadera, M.; Shinto, E.; Kajiwara, Y.; Mochizuki, S.; Okamoto, K.; Shimazaki, H.; Hase, K.; Ueno, H. Differential clinical impacts of tumour budding evaluated by the use of immunohistochemical and haematoxylin and eosin staining in stage II colorectal cancer. Histopathology 2019, 74, 1005–1013. [Google Scholar] [CrossRef]
- Davis, D.A.; Pellowski, D.M.; William Hanke, C. Preparation of frozen sections. Dermatol. Surg. 2004, 30, 1479–1485. [Google Scholar] [CrossRef] [PubMed]
- Wu, X.; Ni, S.; Dai, T.; Li, J.; Shao, F.; Liu, C.; Wang, J.; Fan, S.; Tan, Y.; Zhang, L.; et al. Biomineralized tetramethylpyrazine-loaded PCL/gelatin nanofibrous membrane promotes vascularization and bone regeneration of rat cranium defects. J. Nanobiotechnol. 2023, 21, 423. [Google Scholar] [CrossRef]
- Jia, W.; Fan, Z.; Shi, Q.; Zhang, R.; Wang, X.; Shi, L. LC-MS-based metabolomics reveals metabolite dynamic changes during irradiation of goat meat. Food Res. Int. 2021, 150, 110721. [Google Scholar] [CrossRef]
- Huang, Q.; Dong, K.; Wang, Q.; Huang, X.; Wang, G.; An, F.; Luo, Z.; Luo, P. Changes in volatile flavor of yak meat during oxidation based on multi-omics. Food Chem. 2022, 371, 131103. [Google Scholar] [CrossRef]
- Yang, Z.; Liu, C.; Dou, L.; Chen, X.; Zhao, L.; Su, L.; Jin, Y. Effects of Feeding Regimes and Postmortem Aging on Meat Quality, Fatty Acid Composition, and Volatile Flavor of Longissimus Thoracis Muscle in Sunit Sheep. Animals 2022, 12, 3081. [Google Scholar] [CrossRef]
- Zhang, W.; Xiao, S.; Ahn, D.U. Protein oxidation: Basic principles and implications for meat quality. Crit. Rev. Food Sci. Nutr. 2013, 53, 1191–1201. [Google Scholar] [CrossRef]
- Sohail, A.; Al-Dalali, S.; Wang, J.; Xie, J.; Shakoor, A.; Asimi, S.; Shah, H.; Patil, P. Aroma compounds identified in cooked meat: A review. Food Res. Int. 2022, 157, 111385. [Google Scholar] [CrossRef]
- Fu, Y.; Cao, S.; Yang, L.; Li, Z. Flavor formation based on lipid in meat and meat products: A review. J. Food Biochem. 2022, 46, e14439. [Google Scholar] [CrossRef]
- Smit, G.; Smit, B.A.; Engels, W.J. Flavour formation by lactic acid bacteria and biochemical flavour profiling of cheese products. FEMS Microbiol. Rev. 2005, 29, 591–610. [Google Scholar] [CrossRef]
- Bao, Y.; Ertbjerg, P. Effects of protein oxidation on the texture and water-holding of meat: A review. Crit. Rev. Food Sci. Nutr. 2019, 59, 3564–3578. [Google Scholar] [CrossRef]
- Yu, Y.; Wang, G.; Yin, X.; Ge, C.; Liao, G. Effects of different cooking methods on free fatty acid profile, water-soluble compounds and flavor compounds in Chinese Piao chicken meat. Food Res. Int. 2021, 149, 110696. [Google Scholar] [CrossRef] [PubMed]
- Li, M.; Ren, W.; Chai, W.; Zhu, M.; Man, L.; Zhan, Y.; Qin, H.; Sun, M.; Liu, J.; Zhang, D.; et al. Comparing the Profiles of Raw and Cooked Donkey Meat by Metabonomics and Lipidomics Assessment. Front. Nutr. 2022, 9, 851761. [Google Scholar] [CrossRef] [PubMed]
- Migdał, W.; Kawęcka, A.; Sikora, J.; Migdał, Ł. Meat Quality of the Native Carpathian Goat Breed in Comparison with the Saanen Breed. Animals 2021, 11, 2220. [Google Scholar] [CrossRef] [PubMed]
- Barido, F.H.; Lee, S.K. Changes in proteolytic enzyme activities, tenderness-related traits, and quality properties of spent hen meat affected by adenosine 5′-monophosphate during cold storage. Poult. Sci. 2021, 100, 101056. [Google Scholar] [CrossRef]
- Nagahara, Y.; Shinomiya, T.; Kuroda, S.; Kaneko, N.; Nishio, R.; Ikekita, M. Phytosphingosine induced mitochondria-involved apoptosis. Cancer Sci. 2005, 96, 83–92. [Google Scholar] [CrossRef]
- Li, X.; Xie, W.; Bai, F.; Wang, J.; Zhou, X.; Gao, R.; Xu, X.; Zhao, Y. Influence of thermal processing on flavor and sensory profile of sturgeon meat. Food Chem. 2022, 374, 131689. [Google Scholar] [CrossRef]
- Zhang, M.; Xie, D.; Wang, D.; Xu, W.; Zhang, C.; Li, P.; Sun, C. Lipidomic profile changes of yellow-feathered chicken meat during thermal processing based on UPLC-ESI-MS approach. Food Chem. 2023, 399, 133977. [Google Scholar] [CrossRef]


| Compound | RT (min) | VIP | p | MAX FC | KEGG ID |
|---|---|---|---|---|---|
| 7-Dehydrocholesterol | 16.94 | 1.0845 | 1.54 × 10⁻⁶ | 0.10403 | C01164 |
| Adenosine monophosphate | 0.94 | 1.0692 | 5.07 × 10⁻³ | 0.14610 | C00020 |
| Glycocholic acid | 8.21 | 1.0486 | 3.81 × 10⁻⁴ | 0.09227 | C01921 |
| Hypoxanthine | 1.60 | 1.2362 | 1.55 × 10⁻¹⁰ | 2.61580 | C00262 |
| L-Proline | 13.02 | 1.2902 | 6.60 × 10⁻¹¹ | 2.42194 | C00148 |
| Inosine | 1.60 | 1.1783 | 1.13 × 10⁻⁵ | 4.14642 | C00294 |
| Sphinganine | 10.63 | 1.0807 | 1.87 × 10⁻⁷ | 7.40301 | C00836 |
| 3-Methylindole | 8.06 | 1.2503 | 6.84 × 10⁻⁵ | 0.43736 | C08313 |
| Undecanoic acid | 10.19 | 1.4279 | 1.43 × 10⁻¹⁰ | 3.56285 | C17715 |
| Enkephalin L | 16.51 | 1.1233 | 1.98 × 10⁻³ | 0.24478 | C16041 |
| N2-Succinyl-L-glutamic acid 5-semialdehyde | 9.37 | 1.3988 | 3.65 × 10⁻⁹ | 2.13017 | C05932 |
| N1-Acetylspermidine | 14.68 | 1.2693 | 1.02 × 10⁻³ | 3.82457 | C00612 |
| Desmosterol | 17.63 | 1.3727 | 1.88 × 10⁻⁶ | 0.13485 | C01802 |
| LysoPC(18:1(9Z)/0:0) | 9.80 | 1.1244 | 4.38 × 10⁻⁷ | 3.44659 | C04230 |
| Testosterone glucuronide | 14.80 | 1.4248 | 5.75 × 10⁻⁶ | 0.12439 | C11134 |
| Cinnamaldehyde | 8.59 | 1.6872 | 2.64 × 10⁻⁶ | 2.56298 | C00903 |
| Tryptophol | 10.30 | 1.1046 | 2.51 × 10⁻⁵ | 0.27433 | C00955 |
| (2E)-Tetradecenoyl-CoA | 15.52 | 1.0385 | 1.37 × 10⁻² | 0.18103 | C05273 |
| Phytosphingosine | 7.32 | 1.2752 | 1.55 × 10⁻³ | 3.46050 | C12144 |
| 9,10-DHOME | 6.45 | 1.8056 | 3.35 × 10⁻⁸ | 3.22173 | C14828 |
| FAPy-adenine | 0.94 | 1.0645 | 4.08 × 10⁻³ | 0.11126 | C06502 |
| Cer(d18:1/22:0) | 17.65 | 1.2753 | 1.59 × 10⁻⁴ | 0.00019 | C00195 |
| Cer(d18:1/24:0) | 15.27 | 1.1066 | 5.44 × 10⁻⁶ | 0.00377 | C00195 |
| TG(16:0/16:0/18:1(9Z)) | 17.62 | 1.3167 | 7.99 × 10⁻¹³ | 0.13895 | C00422 |
| TG(16:0/18:0/18:2(9Z,12Z)) | 15.27 | 1.3851 | 1.30 × 10⁻¹⁶ | 0.20244 | C00422 |
| Phenylacetaldehyde | 8.58 | 1.6699 | 2.66 × 10⁻⁷ | 5.34375 | C00601 |
| LysoPA(0:0/18:0) | 9.69 | 1.2091 | 5.74 × 10⁻⁷ | 3.43180 | C00416 |
| PC(16:0/20:1(11Z)) | 13.03 | 1.3313 | 9.95 × 10⁻⁸ | 0.06575 | C00157 |
| PC(18:0/16:0) | 13.04 | 1.4029 | 3.86 × 10⁻⁶ | 0.24483 | C00157 |
| PC(18:2(9Z,12Z)/16:0) | 11.76 | 1.2954 | 1.67 × 10⁻⁴ | 0.07218 | C00157 |
| PC(18:3(6Z,9Z,12Z)/22:6(4Z,7Z,10Z,13Z,16Z,19Z)) | 12.01 | 1.2578 | 7.08 × 10⁻⁴ | 0.03811 | C00157 |
| PC(22:6(4Z,7Z,10Z,13Z,16Z,19Z)/20:4(5Z,8Z,11Z,14Z)) | 4.45 | 1.1355 | 1.54 × 10⁻⁶ | 0.33359 | C00157 |
| PE(14:0/24:0) | 4.90 | 1.2762 | 1.05 × 10⁻⁸ | 0.39162 | C00350 |
| PE(14:1(9Z)/22:0) | 12.22 | 1.1505 | 1.62 × 10⁻⁶ | 5.60701 | C00350 |
| PE(15:0/22:0) | 11.76 | 1.2211 | 5.31 × 10⁻⁹ | 2.92555 | C00350 |
| PE(15:0/22:1(13Z)) | 11.76 | 1.2579 | 1.31 × 10⁻⁸ | 3.48521 | C00350 |
| PI(16:0/18:0) | 18.12 | 1.3937 | 1.07 × 10⁻¹¹ | 0.03992 | C00626 |
| PI(16:0/20:2(11Z,14Z)) | 18.12 | 1.3449 | 1.72 × 10⁻¹² | 0.00061 | C00626 |
| PI(16:0/22:4(10Z,13Z,16Z,19Z)) | 18.12 | 1.3288 | 1.47×10⁻¹¹ | 0.01661 | C00626 |
| PI(18:0/22:4(10Z,13Z,16Z,19Z)) | 15.48 | 1.2545 | 1.99 × 10⁻⁹ | 0.00180 | C00626 |
| LysoPC(16:0/0:0) | 9.52 | 1.2091 | 6.29 × 10⁻⁹ | 3.27169 | C04230 |
| LysoPC(18:0/0:0) | 10.85 | 1.0605 | 1.66 × 10⁻⁴ | 2.02727 | C04230 |
| LysoPC(18:2(9Z,12Z)/0:0) | 8.95 | 1.0389 | 1.01 × 10⁻⁴ | 2.10668 | C04230 |
| LysoPC(20:0/0:0) | 4.73 | 1.2112 | 9.47 × 10⁻⁵ | 0.18359 | C04230 |
| LysoPC(P-16:0/0:0) | 9.85 | 1.1504 | 3.33 × 10⁻⁶ | 3.97018 | C04230 |
| 4-(Methylnitrosamino)-1-(3-pyridyl)-1-butanone | 13.63 | 1.2845 | 3.09 × 10⁻⁹ | 3.96652 | C16453 |
| SM(d18:1/24:1(15Z)) | 12.62 | 1.4618 | 4.69 × 10⁻¹³ | 0.09573 | C00550 |
| Histidinal | 13.30 | 1.3567 | 4.60 × 10⁻¹³ | 3.15894 | C01929 |
| Methylarsonite | 18.21 | 1.0455 | 6.45 × 10⁻³ | 0.49109 | C07295 |
| Acetamidopropanal | 13.11 | 1.2957 | 3.63 × 10⁻¹¹ | 2.23829 | C18170 |
| Monoethylhexyl phthalic acid | 10.32 | 1.3609 | 1.33 × 10⁻¹¹ | 2.44375 | C03343 |
| Tryptophanamide | 8.18 | 1.7118 | 2.61 × 10⁻⁵ | 0.44664 | C00977 |
| SM(d18:1/26:1(17Z)) | 16.34 | 1.2566 | 3.94 × 10⁻⁷ | 0.05409 | C00550 |
| Azithromycin | 11.96 | 1.3466 | 5.50 × 10⁻⁷ | 5.44225 | C06838 |
| Ethambutol | 12.90 | 1.3167 | 1.24 × 10⁻¹² | 3.11991 | C06984 |
| Carteolol | 9.69 | 1.0615 | 1.46 × 10⁻⁸ | 5.10115 | C06874 |
| Nystatin | 12.40 | 1.1696 | 6.16 × 10⁻¹⁰ | 0.02798 | C06572 |
| Proparacaine | 10.23 | 1.3057 | 1.84 × 10⁻¹³ | 13.09740 | C07383 |
| Azlocillin | 11.71 | 1.2460 | 5.78 × 10⁻¹⁰ | 4.77165 | C06839 |
| Procarbazine | 11.08 | 1.2308 | 3.10 × 10⁻⁴ | 0.02835 | C07402 |
| Cinnamyl alcohol | 10.81 | 1.2869 | 2.36 × 10⁻⁵ | 0.49156 | C02394 |
| Triethanolamine | 13.39 | 1.3102 | 2.59 × 10⁻¹² | 2.33451 | C06771 |
| Tomatidine | 10.01 | 2.0814 | 1.90 × 10⁻⁷ | 2.11146 | C10826 |
| Sclareol | 18.12 | 1.2857 | 5.30 × 10⁻¹⁰ | 0.00866 | C09183 |
| Pentabromodiphenyl ethers | 14.69 | 1.3333 | 1.30 × 10⁻⁵ | 0.00016 | C18203 |
| Petanin | 10.99 | 1.2599 | 3.45 × 10⁻⁷ | 0.10535 | C12139 |
| Resiniferatoxin | 13.26 | 1.0417 | 1.11 × 10⁻⁷ | 2.28031 | C09179 |
| Oleandomycin | 11.55 | 2.2712 | 1.82 × 10⁻⁷ | 4.94682 | C01946 |
| TETRATHIONIC ACID | 18.17 | 1.1311 | 1.21 × 10⁻³ | 0.15010 | C05529 |
| Sodium palmitate | 10.15 | 1.2995 | 2.83 × 10⁻¹⁰ | 2.67924 | C00249 |
| Octanoate | 7.63 | 1.2354 | 3.20 × 10⁻⁹ | 0.29379 | C06423 |
| Gum arabic | 9.24 | 1.2287 | 9.46 × 10⁻⁴ | 0 | C08822 |
| n-decanohydroxamic acid | 12.63 | 1.3181 | 4.76 × 10⁻¹⁰ | 2.63773 | C12889 |
| Valproic acid | 10.48 | 1.4104 | 3.14 × 10⁻⁹ | 2.27628 | C07185 |
| alpha,alpha′-Trehalose 6-mycolate | 11.73 | 1.0273 | 8.41 × 10⁻⁴ | 0.04322 | C04218 |
| DG(O-16:0/18:1(9Z)) | 13.66 | 1.1011 | 2.27 × 10⁻³ | 2.11238 | C13862 |
| PC(22:0/22:1(13Z)) | 12.14 | 1.1250 | 1.32 × 10⁻³ | 0.30577 | C00157 |
| PE(18:4(6Z,9Z,12Z,15Z)/18:4(6Z,9Z,12Z,15Z)) | 4.64 | 1.2228 | 3.99 × 10⁻⁸ | 0.20370 | C00350 |
| PI(16:0/20:3(8Z,11Z,14Z)) | 14.72 | 1.2396 | 5.62 × 10⁻⁶ | 0.27455 | C00626 |
| Pathway Name | Match Status | p | −log (p) | Holm p | FDR | Impact |
|---|---|---|---|---|---|---|
| Sphingolipid metabolism | 4/21 | 0.00013 | 3.89060 | 0.01081 | 0.01081 | 0.42800 |
| Glycerophospholipid metabolism | 4/36 | 0.00111 | 2.95530 | 0.09200 | 0.04655 | 0.35618 |
| Glycerolipid metabolism | 2/16 | 0.01872 | 1.72770 | 1 | 0.52412 | 0.02648 |
| Purine metabolism | 3/65 | 0.05457 | 1.26300 | 1 | 1 | 0.08302 |
| Linoleic acid metabolism | 1/5 | 0.06601 | 1.18040 | 1 | 1 | 0 |
| Fatty acid elongation | 2/39 | 0.09596 | 1.01790 | 1 | 1 | 0.00362 |
| Fatty acid degradation | 2/39 | 0.09596 | 1.01790 | 1 | 1 | 0.00467 |
| Phenylalanine metabolism | 1/10 | 0.12786 | 0.89325 | 1 | 1 | 0.14286 |
| Fatty acid biosynthesis | 2/47 | 0.13130 | 0.88175 | 1 | 1 | 0.01473 |
| alpha-Linolenic acid metabolism | 1/13 | 0.16308 | 0.78760 | 1 | 1 | 0 |
| Glycosylphosphatidylinositol (GPI)-anchor biosynthesis | 1/14 | 0.17452 | 0.75817 | 1 | 1 | 0.00399 |
| Phosphatidylinositol signaling system | 1/28 | 0.31978 | 0.49515 | 1 | 1 | 0.00152 |
| Arachidonic acid metabolism | 1/36 | 0.39149 | 0.40728 | 1 | 1 | 0 |
| Biosynthesis of unsaturated fatty acids | 1/36 | 0.39149 | 0.40728 | 1 | 1 | 0 |
| Arginine and proline metabolism | 1/38 | 0.40826 | 0.38906 | 1 | 1 | 0.07780 |
| Steroid biosynthesis | 1/42 | 0.44049 | 0.35607 | 1 | 1 | 0 |
| Primary bile acid biosynthesis | 1/46 | 0.47104 | 0.32694 | 1 | 1 | 0.00805 |
| Aminoacyl-tRNA biosynthesis | 1/48 | 0.48571 | 0.31362 | 1 | 1 | 0 |
| Metabolism of xenobiotics by cytochrome P450 | 1/68 | 0.61263 | 0.21280 | 1 | 1 | 0.03571 |
| Steroid hormone biosynthesis | 1/85 | 0.69649 | 0.15709 | 1 | 1 | 0 |
Disclaimer/Publisher’s Note: The statements, opinions and data contained in all publications are solely those of the individual author(s) and contributor(s) and not of MDPI and/or the editor(s). MDPI and/or the editor(s) disclaim responsibility for any injury to people or property resulting from any ideas, methods, instructions or products referred to in the content. |
© 2024 by the authors. Licensee MDPI, Basel, Switzerland. This article is an open access article distributed under the terms and conditions of the Creative Commons Attribution (CC BY) license (https://creativecommons.org/licenses/by/4.0/).
Share and Cite
Xu, J.; Wang, Q.; Wang, Y.; Bao, M.; Sun, X.; Li, Y. Changes in Meat of Hu Sheep during Postmortem Aging Based on ACQUITY UPLC I-Class Plus/VION IMS QTof. Foods 2024, 13, 174. https://doi.org/10.3390/foods13010174
Xu J, Wang Q, Wang Y, Bao M, Sun X, Li Y. Changes in Meat of Hu Sheep during Postmortem Aging Based on ACQUITY UPLC I-Class Plus/VION IMS QTof. Foods. 2024; 13(1):174. https://doi.org/10.3390/foods13010174
Chicago/Turabian StyleXu, Jie, Qiang Wang, Yimeng Wang, Menghuan Bao, Xiaomei Sun, and Yongjun Li. 2024. "Changes in Meat of Hu Sheep during Postmortem Aging Based on ACQUITY UPLC I-Class Plus/VION IMS QTof" Foods 13, no. 1: 174. https://doi.org/10.3390/foods13010174
APA StyleXu, J., Wang, Q., Wang, Y., Bao, M., Sun, X., & Li, Y. (2024). Changes in Meat of Hu Sheep during Postmortem Aging Based on ACQUITY UPLC I-Class Plus/VION IMS QTof. Foods, 13(1), 174. https://doi.org/10.3390/foods13010174