Article

Characterizing the Contribution of Functional Microbiota Cultures in Pit Mud to the Metabolite Profiles of Fermented Grains

1
College of Biomass Science and Engineering, Sichuan University, Chengdu 610065, China
2
Luzhou Lao Jiao Co., Ltd., Luzhou 646699, China
*
Author to whom correspondence should be addressed.
Foods 2024, 13(11), 1597; https://doi.org/10.3390/foods13111597
Submission received: 12 April 2024 / Revised: 14 May 2024 / Accepted: 19 May 2024 / Published: 21 May 2024
(This article belongs to the Special Issue Microbiological Studies on Wine/Baijiu Fermentation)

Abstract

:
Elevating the flavor profile of strong flavors Baijiu has always been a focal point in the industry, and pit mud (PM) serves as a crucial flavor contributor in the fermentation process of the fermented grains (FG). This study investigated the influence of wheat flour and bran (MC and FC) as PM culture enrichment media on the microbiota and metabolites of FG, aiming to inform strategies for improving strong-flavor Baijiu flavor. Results showed that adding PM cultures to FG significantly altered its properties: FC enhanced starch degradation to 51.46% and elevated reducing sugar content to 1.60%, while MC increased acidity to 2.11 mmol/10 g. PM cultures also elevated FG’s ester content, with increases of 0.36 times for MC-FG60d and 1.48 times for FC-FG60d compared to controls, and ethyl hexanoate rising by 0.91 times and 1.39 times, respectively. Microbial analysis revealed that Lactobacillus constituted over 95% of the Abundant bacteria community, with Kroppenstedtia or Bacillus being predominant among Rare bacteria. Abundant fungi included Rasamsonia, Pichia, and Thermomyces, while Rare fungi consisted of Rhizopus and Malassezia. Metagenomic analysis revealed bacterial dominance, primarily consisting of Lactobacillus and Acetilactobacillus (98.80–99.40%), with metabolic function predictions highlighting genes related to metabolism, especially in MC-FG60d. Predictions from PICRUSt2 suggested control over starch, cellulose degradation, and the TCA cycle by fungal subgroups, while Abundant fungi and bacteria regulated ethanol and lactic acid production. This study highlights the importance of PM cultures in the fermentation process of FG, which is significant for brewing high-quality, strong-flavor Baijiu.

Graphical Abstract

1. Introduction

Strong-flavor Baijiu was manufactured via distinctive solid-state fermentation craftwork, in which wheat and sorghum were used as primary raw materials, and participating microorganisms involved fungi, eubacteria, and archaea. The key microorganisms are sourced from Daqu and pit mud (PM). PM is a special type of clay lined at the bottom and four inner walls of the pit [1,2]. Daqu is an essential starter and one of the requisite raw materials in Baijiu brewing [3]. In fact, the contribution of the microbiota habituated in Daqu to the yield and quality of the fresh Baijiu still depended on the interaction with PM [4]. Previous studies revealed the synthesizing of some organic acids was driven by the synergistic effect of microbiota habiting in both FG and PM during the process [5]. The contribution of PM to the microbial community dynamics and microenvironmental parameters in FG reduced the abundance of dominant microbes, enriched functional microbial communities, and mitigated the acidification trend of the microenvironment [6]. Therefore, it is an effective strategy to improve the yield and quality of fresh Baijiu by regulating the interspecific interactions and their metabolic network among the microbiota, including within phases and between phases. In the past decade, results reported in many documents confirmed that bioturbation, or inoculating functional strains or microbiota, altered the endogenous microbiota structure and their metabolic dynamics in the brewing microecosystem, improving specific functional phenotypes. For example, adding 6% Muqu into Qupei (the initial non-fermentation starter) is an essential step in manufacturing high-quality Jiangqu [7]. In order to produce high-quality artificial pit mud (APM), the old PM was often used as the starter [8,9], and it not only accelerated the maturation rate of APM but also improved the content of ethyl hexanoate when the suspension of Clostridium spp. was inoculated [10]. The synthetic microbiota, composed of Bacillus, Saccharomycopsis, and Absidia, significantly improved the activity of amylase in Daqu [11].
Tetramethylpyrazine is one of the unique flavor components in Baijiu. The content of Zaopei and fresh Baijiu increased by 26 and 24 times, respectively, when the suspension of B. amyloliquefaciens was added in the initial stage of fermentation [12]. Similarly, the microbiota structure and their flavor metabolites in Daqu were improved by inoculating the synthetic microbiota, composed of B. velezensis and B. subtilis [13], which enhanced the relative abundance (RA) of some functional microorganisms, such as Caproiciproducens, Clostridium, Methanobacterium, Methanosarcina, etc., while decreasing that of Lactobacillus when it was used for Baijiu fermentation [14]. In addition, some research results have also shown that isolated strains from Daqu can effectively avoid defects in the production process. For example, two isolated strains of Bacillus high-degrading geosmin played a significant role in eliminating this odor [15]. Kodamaea ohmeri can effectively produce the biogenic amine [16], whereas Lysinibacillus spherericus can degrade ethyl carbamate and urea up to 41.77% and 63.32% in the Baijiu simulation system, respectively [17]. Meanwhile, the spatiotemporal characteristics of the Zaopei community are significant. With the progress of the fermentation process, the abundance of functional microbial groups, such as Clostridium and methanogenic archaea, gradually decreased, leading to a reduction in the yield and quality of the fresh Baijiu [18,19,20]. However, the role of cultures of PM functional microbiota on the fermentation of FG is still unclear.
This study investigated the effects of wheat flour and bran (MC and FC) served as the medium enriching functional microbiota in PM culture, respectively, on the physicochemical properties, volatile components, and microbial communities of FG simulated fermentation systems by the multi-omics method. Meanwhile, the contribution of rare and abundant microorganisms to the metabolite feature in FG was also examined. The objective is to establish a theoretical framework for the role of functional microbiota during FG fermentation and to facilitate the development of novel application technologies.

2. Materials and Methods

2.1. Preparation of High Ability of PM Culture Producing Ethyl Hexanoate

The PM originated from the pit with 100 years of Luzhou Laojiao Co., Ltd. (Luzhou city, China) and was domesticated repeatedly, as followed by a previous study [21]. The main process description is as follows: The PM was diluted 10 times with sterile normal saline and treated in an 85 °C hot water bath for 10 min to kill heat-labile microorganisms. Then, the suspension was inoculated into the modified acetate medium in a 5% ratio (v/v) and cultured at 37 ± 1 °C for 7 days. The total acid content of the cultures was quantified through alkaline titration. Concentrations of specific acids, namely acetic acid, butyric acid, and hexanoic acid, were analyzed using HPLC, which was composed of an Agilent 1260 HPLC system equipped with an Alltech OA-1000 organic acid column (300 mm × 7.8 mm, Agilent, Santa Clara, CA, USA). The samples underwent purification and filtration prior to analysis. Meanwhile, the quantities of colonies were measured using a hemocytometer. The sample with excellent results for these parameters was repeated according to the above process 10 times until these parameters were stabilized, referred to as functional microbiota (FM). FM was conserved at −20 °C for use as the initial starter, which was subcultured monthly to check its activity. The activated FM was inoculated into the sterile wheat flour and bran medium at a 5% ratio (v/w), respectively, and cultured at 37 ± 1 °C for 7 days. Subsequently, they were dried at 45 ± 2 °C and referred to as PM cultures, specifically MC and FC. PM cultures were placed in sterile self-sealing bags and stored at −20 °C for use in Baijiu brewing. All inoculation and sampling operations were conducted within a sterile workbench, ensuring a clean and independent cultivation environment to minimize the risks of contamination.
The formula for the modified sodium acetate medium was as follows: 5 g CH3COONa, 0.5 g (NH)2SO4, 0.4 g KH2PO4, 0.2 g Mg2SO4, 1.0 g yeast extract, 5.0 g CaCO3, and 1000 mL ddH2O, with the pH adjusted to 6.0–6.5. The medium was autoclaved at 121 °C for 20 min, followed by the addition of 20 mL of 100% ethanol [22]. The wheat flour or bran medium was prepared by mixing 1000 g of wheat flour or bran with 10.0 g of Na2CO3 and 1000 mL of distilled water. After thorough mixing, 150 g of the mixture was transferred into a 500 mL conical flask and autoclaved at 121 °C for 20 min.

2.2. Baijiu Brewing and Sampling

The experiment was carried out according to the process described in a previous study [23]. The initial FG, consisting of sorghum, Huizao (the last round of FG), and the pre-steamed rice husks, were combined in a ratio of 1:4:0.2. This mixture was steamed under atmospheric pressure for 1 h. After cooling to below 40 °C, Daqu and PM cultures were added to the initial FG based on the dry weight of sorghum, as detailed in Table 1. The mixture was transferred into simulated fermentation pits (6 L of plastic containers measuring 25 cm × 17 cm × 14 cm) and fermented at 30 °C for 60 days. Sampling occurred at 0 days, 30 days, and 60 days using the five-point method. After thorough mixing, the samples were divided into two portions, one stored at −20 °C for physicochemical and volatile substance analysis and the other stored at −80 °C for microbial community analysis.

2.3. Physicochemical Properties Analyzing

The moisture content of FG was measured by drying at 105 °C for 4 h and weighing. FG was mixed with CO2-free water at a ratio of 1:10 (w/v), extracted for 30 min, filtered, and then analyzed separately for acidity and reducing sugar content using acid-base titration and Fehling’s titration methods. The starch content was determined by hydrolyzing in a hydrochloric acid solution for 30 min, followed by using Fehling’s titration methods. Additionally, 100 g of FG were mixed with distilled water in a 1:2 ratio (w/v), and then 100 mL of distillate was obtained through distillation for alcohol content analysis, which was conducted using an alcoholometer. All the samples were measured in triplicate.

2.4. Detecting Volatiles

Volatile compounds were determined using headspace solid-phase microextraction gas chromatography–mass spectrometry (HS-SPME–GC–MS) on a Trace 1300-TSQ 9000 GC–MS system (Thermo Scientific, Waltham, MA, USA) equipped with a VF-WAX-MS capillary column (30.0 m × 0.25 mm × 0.25 µm, Agilent, Santa Clara, CA, USA).
Sample pretreatment [3]: 1.00 g of the sample and 10 μL of internal standard (methyl octanoate, 0.0073 g/100 mL) were added to a 20 mL headspace vial. The vial was placed on a constant-temperature magnetic stirrer at 60 °C for 15 min. Volatile components were extracted using a 50/30 µm DVB/CAR/PDMS fiber (2 cm, Supelco, Bellefonte, PA, USA) for 45 min. The extraction head was desorbed at 250 °C for 5 min. Chromatographic conditions: The injection port temperature was set at 250 °C, and the carrier gas was high-purity helium with a flow rate of 1 mL/min (>99.999%). The temperature program included an initial temperature of 40 °C for 5 min, followed by an increase at 4 °C/min to 100 °C, and then at 6 °C/min to 230 °C, where it was held for 10 min. Mass spectrometry conditions: The ion source temperature was 250 °C; the transfer line temperature was 300 °C; and the ionization was performed by electron impact (EI) at 70 eV. The scanning range was 35 to 400 amu. Qualitative and quantitative analysis: After comparing the obtained mass spectra with the NIST 2017 mass spectral library, only compounds with a similarity greater than 80% were retained for further analysis. The content of each volatile compound was calculated based on the ratio of its peak area to the content of the internal standard, methyl octanoate. All the samples were measured in triplicate.

2.5. Amplicon Sequencing

Total DNA was extracted from the samples using the Fast DNA SPIN extraction kit (MP Biomedicals, Santa Ana, CA, USA) following the manufacturer’s instructions. The quality of DNA extraction was verified using 0.8% agarose gel electrophoresis and quantified using a spectrophotometer (Thermo Scientific, Waltham, MA, USA). The bacterial 16S rRNA V3-V4 region and the fungal ITS1 region were amplified using universal primers 338F/806R and ITS5/ITS1, respectively.
Polymerase chain reaction (PCR) system: The PCR reaction mixture included 5 µL of 5× Q5 high-fidelity reaction buffer, 5 µL of 5× Q5 high-fidelity GC buffer, 0.25 µL of Q5 high-fidelity DNA polymerase (5 U/µL), 2 µL of dNTPs (2.5 mmol/L), 1 µL each of forward and reverse primers (10 µmol/L), 2 µL of DNA template, and 8.75 µL of ddH2O. The amplification program consisted of an initial denaturation at 98 °C for 2 min, followed by 25 cycles of denaturation at 98 °C for 15 s, annealing at 55 °C for 30 s, extension at 72 °C for 30 s, and a final extension at 72 °C for 5 min. PCR products were purified using VAHTSTM DNA Clean Beads (Vazyme, Nanjing, China), and the concentration was quantified using the Quant-iT PicoGreen dsDNA Assay Kit (Invitrogen, Carlsbad, CA, USA). After purification, samples were sequenced on the Illumina Novaseq platform by Shanghai Personal Biotechnology Co., Ltd. (Shanghai, China).
The raw sequencing data were primarily processed using QIIME2. The demux plugin was used for multiplexing, and cutadapt was employed to remove primers. Subsequently, DADA2 was applied for quality filtering, denoising, merging, and removing chimeric sequences. Further filtering retained amplicon sequence variants (ASVs) found in only one sample and singleton sequences. Finally, the taxonomic assignment was performed against the Silva (v. 132) and UNITE (v. 8.0) databases.

2.6. Metagenomic Sequencing

Total microbial DNA extraction was performed using the Mag-Bind Soil DNA Kit (Omega Bio-Tek, Norcross, GA, USA). The extracted DNA was quantified using a Qubit 4 fluorometer (Thermo Scientific, Waltham, MA, USA), and the quality was assessed by agarose gel electrophoresis. Library construction followed the Illumina TruSeq DNA library preparation protocol, including DNA fragmentation, repair, introduction of “A” bases, adapter ligation, purification, and enrichment of DNA fragments. The library was validated using Qubit 4 and Agilent 2100 after normalization and subjected to Illumina sequencing.

2.7. Statistical Analysis

Visualizations of physicochemical properties were conducted using OriginPro 2019b (Origin Lab Corporation, MA, USA). The differences between the statistical significance (p < 0.05) and the means of the samples were tested by one-way analysis of variance (ANOVA) using SPSS 25.0 software (SPSS Inc., Chicago, IL, USA). Specifically, data normality was assessed with P-P and Q-Q plots and the Shapiro–Wilk test. Variance homogeneity was tested, followed by either the F-test for homogeneous or the Welch test for heterogeneous variances to compare group means. Post hoc comparisons used Duncan, Tukey, or Tamhane T2 tests. The microbial community assessment included α-diversity metrics such as the Chao1 index and Shannon index, as well as β-diversity metrics using principal component analysis (PCA) and hierarchical clustering analysis. Metabolic functions were predicted based on the KEGG, Metacyc, and CAZy databases using PICRUSt2. Partial least squares discriminant analysis (PLS-DA) and permutation tests were performed in SIMCA 14.1. Heatmaps were generated using TB Tools (v. 1.108).

3. Results and Discussion

3.1. Changes in Physicochemical Properties of FG

The physicochemical properties of FG exhibited distinct trends throughout the whole process, as documented in Table 2. During the initial phase (0–30 days), the moisture content increased significantly and then stabilized in the later phase (30–60 days), up by about 11%, in line with past research [18,24]. This consistent trend across all samples suggested normal microbial metabolism in each group [24]. Microorganisms initiated fermentation, hydrolyzing starch to reducing sugars that were then converted into alcohols, acids, and flavor components, with starch and reducing sugar consumption reflecting the process [20,24]. The starch content gradually decreased throughout the process, especially in the early phase [18]. Notably, on day 30, the starch degradation rates of DZ-FG, MC-FG, and FC-FG were 40.43%, 32.61%, and 33.64%, respectively. By the end of fermentation, these rates had increased to 43.88%, 36.76%, and 51.46%, with FC-FG exhibiting significant further degradation in the later phase. Acidity showed an overall increasing trend, with more pronounced increases observed in the later phase. Notably, the acidity of MC-FG was significantly higher than that of DZ-FG and FC-FG, both on day 30 and day 60. The trends in reducing sugar content varied markedly among samples. DZ-FG showed a notable decrease in the early phase, followed by a slight rise in the later phase. Conversely, MC-FG increased in the early phase, followed by a significant decline in a later phase, possibly due to the conversion of reducing sugars to acids, as indicated by its significantly higher acidity. FC-FG’s reducing sugar content decreased slightly in the early phase and then increased significantly in a later phase, which corresponded with its substantial starch degradation in the later phase, while its acidity remained similar to that of DZ-FG. The alcohol content increased significantly in the early phase, peaking in DZ-FG30d, aligning with its highest rates of starch and reducing sugar degradation [20]. Subsequently, the alcohol content slightly decreased in a later phase, possibly due to its conversion into esters. The changes in physicochemical properties during the simulated fermentation closely mirrored those observed in industrial-scale Baijiu fermentation, underscoring the effectiveness of the simulation in replicating real-world fermentation dynamics [18,20].

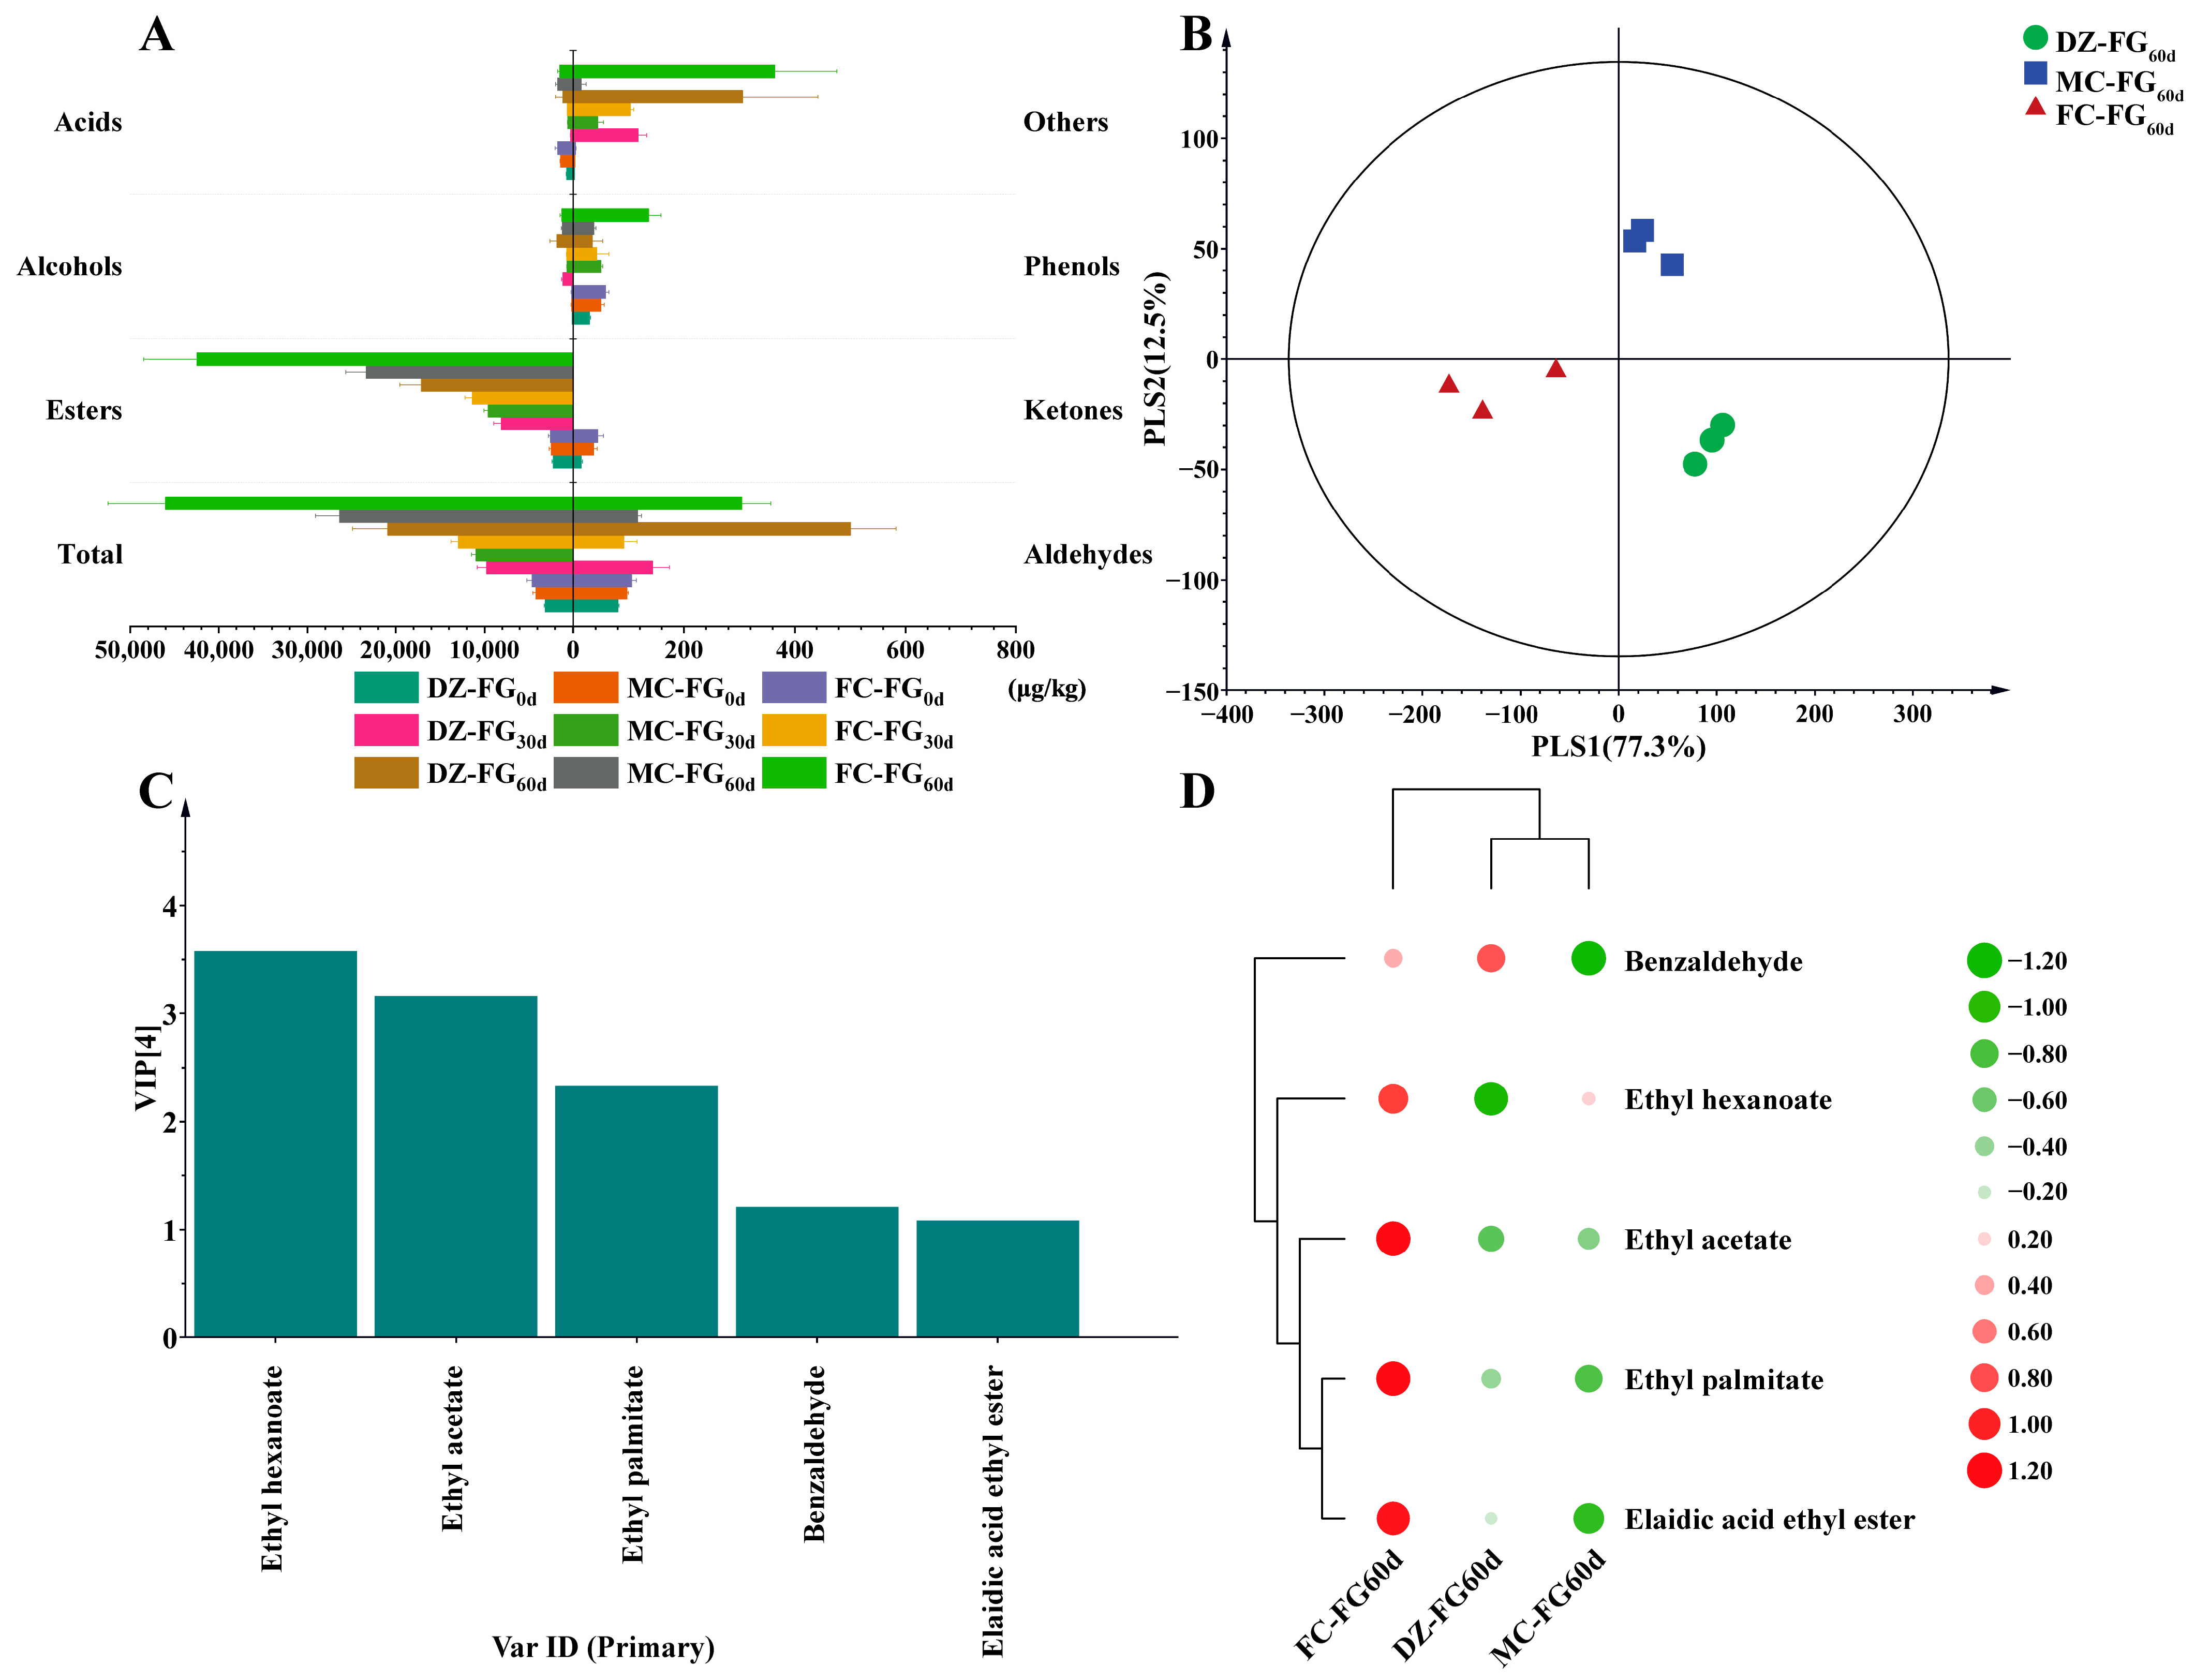
3.2. Changes in Volatile Components

In the present study, 68 volatiles identified in these FG were divided into seven groups: esters (36), alcohols (6), acids (8), aldehydes (7), ketones (2), phenols (5), and others (4). The contents of volatiles increased from 3.14 mg/kg–4.61 mg/kg to 9.79–12.97 mg/kg when fermented for 30 days, reaching 20.92–46.02 mg/kg at the end. Subsequently, the increase ranged from 5.34 times (MC-FG) to 8.98 times (FC-FG) by the end of fermentation (Figure 1A). Among these volatiles, esters, alcohols, and acids were predominant, echoing findings reported by previous studies [24,25]. The contents of esters rose by 3.67 times–4.47 times and 2.11 times–3.73 times in the prophase and the anaphase of fermentation, respectively. In comparison to DZ-FG60d’s, the ester content in MC-FG60d and FC-FG60d increased by 0.36 times and 1.48 times, respectively. Notably, ethyl hexanoate, contributing to fruity aromas for Baijiu [23], had the highest content, increasing by 0.91 times and 1.39 times in MC-FG60d and FC-FG60d, respectively, compared to DZ-FG60d. Additionally, at the end of fermentation, the volatile acid content also increased due to the addition of MC and FC, with an increase of 0.51 times and 0.30 times in MC-FG60d and FC-FG60d, respectively, compared to DZ-FG60d. The elevated volatile acid content of MC-FG60d, consistent with its significantly higher acidity, may have suppressed the activity of its functional microbial community [26], leading to less pronounced flavor enhancement relative to FC-FG60d. However, by the end of fermentation, the alcohol content in MC-FG and FC-FG decreased to 0.67 times and 0.70 times that of DZ-FG, recording contents of 1.20 mg/kg and 1.26 mg/kg, respectively. The decrease was mainly attributed to the reduction in branched-chain alcohols such as phenethyl alcohol, 2,3-butanediol, and isoamyl alcohol, which was consistent with the previous study on the impact of PM on fermentation flavor [2]. These observations suggested that FC notably enhanced the content of volatiles in FG, especially esters and ethyl hexanoate.
The differentiation of characteristic volatiles in FG was effectively determined using a partial least squares discriminant analysis (PLS-DA) model (Figure 1B). The model demonstrated outstanding performance with values of R2X (cumulative) at 0.992, R2Y (cumulative) at 0.988, and Q2 (cumulative) at 0.958, indicating exceptional explanatory power for both the X and Y matrices and a strong predictive capability [23,27]. The analysis revealed a significant distinction in volatile profiles among the different types of FG, with DZ-FG60d, MC-FG60d, and FC-FG60d positioned in the IV, I, and III quadrants, respectively, highlighting the marked differences in their volatile compositions.
Based on the variable importance of projection scores (VIP > 1.0), five distinct volatiles were identified as crucial [27,28], namely ethyl hexanoate, ethyl acetate, ethyl palmitate, benzaldehyde, and elaidic acid ethyl ester (Figure 1C). Ethyl hexanoate and ethyl acetate, key structural components, significantly influence the quality of fresh Baijiu through their concentration and the ratio between them [29,30]. Benzaldehyde, in moderate amounts, enhances the taste, whereas excessive amounts can impart a bitter flavor [31]. The cluster heatmap of characteristic volatiles indicated that benzaldehyde had the highest concentration in DZ-FG60d, while the concentrations of the other four volatiles were significantly higher in FC-FG60d (Figure 1D).

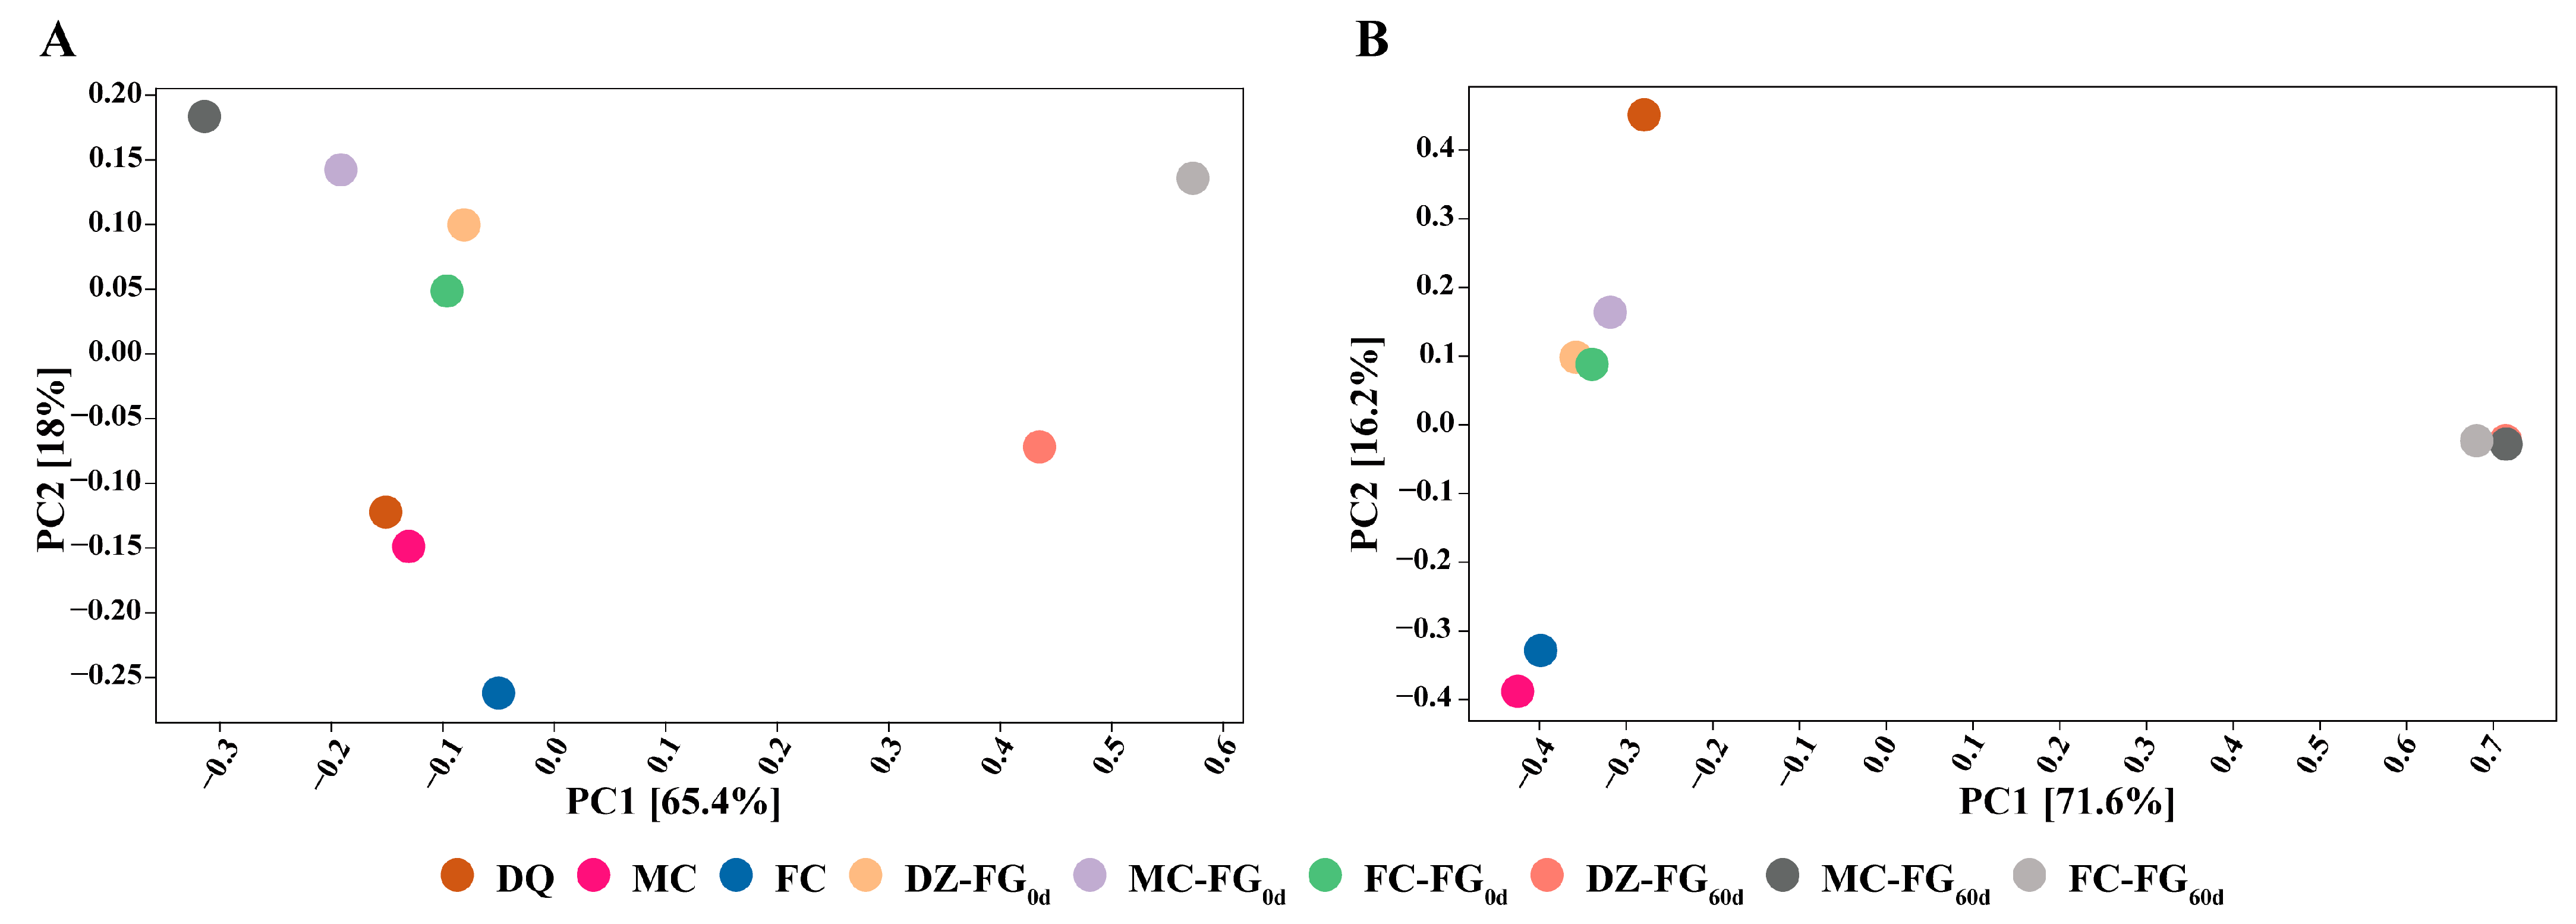
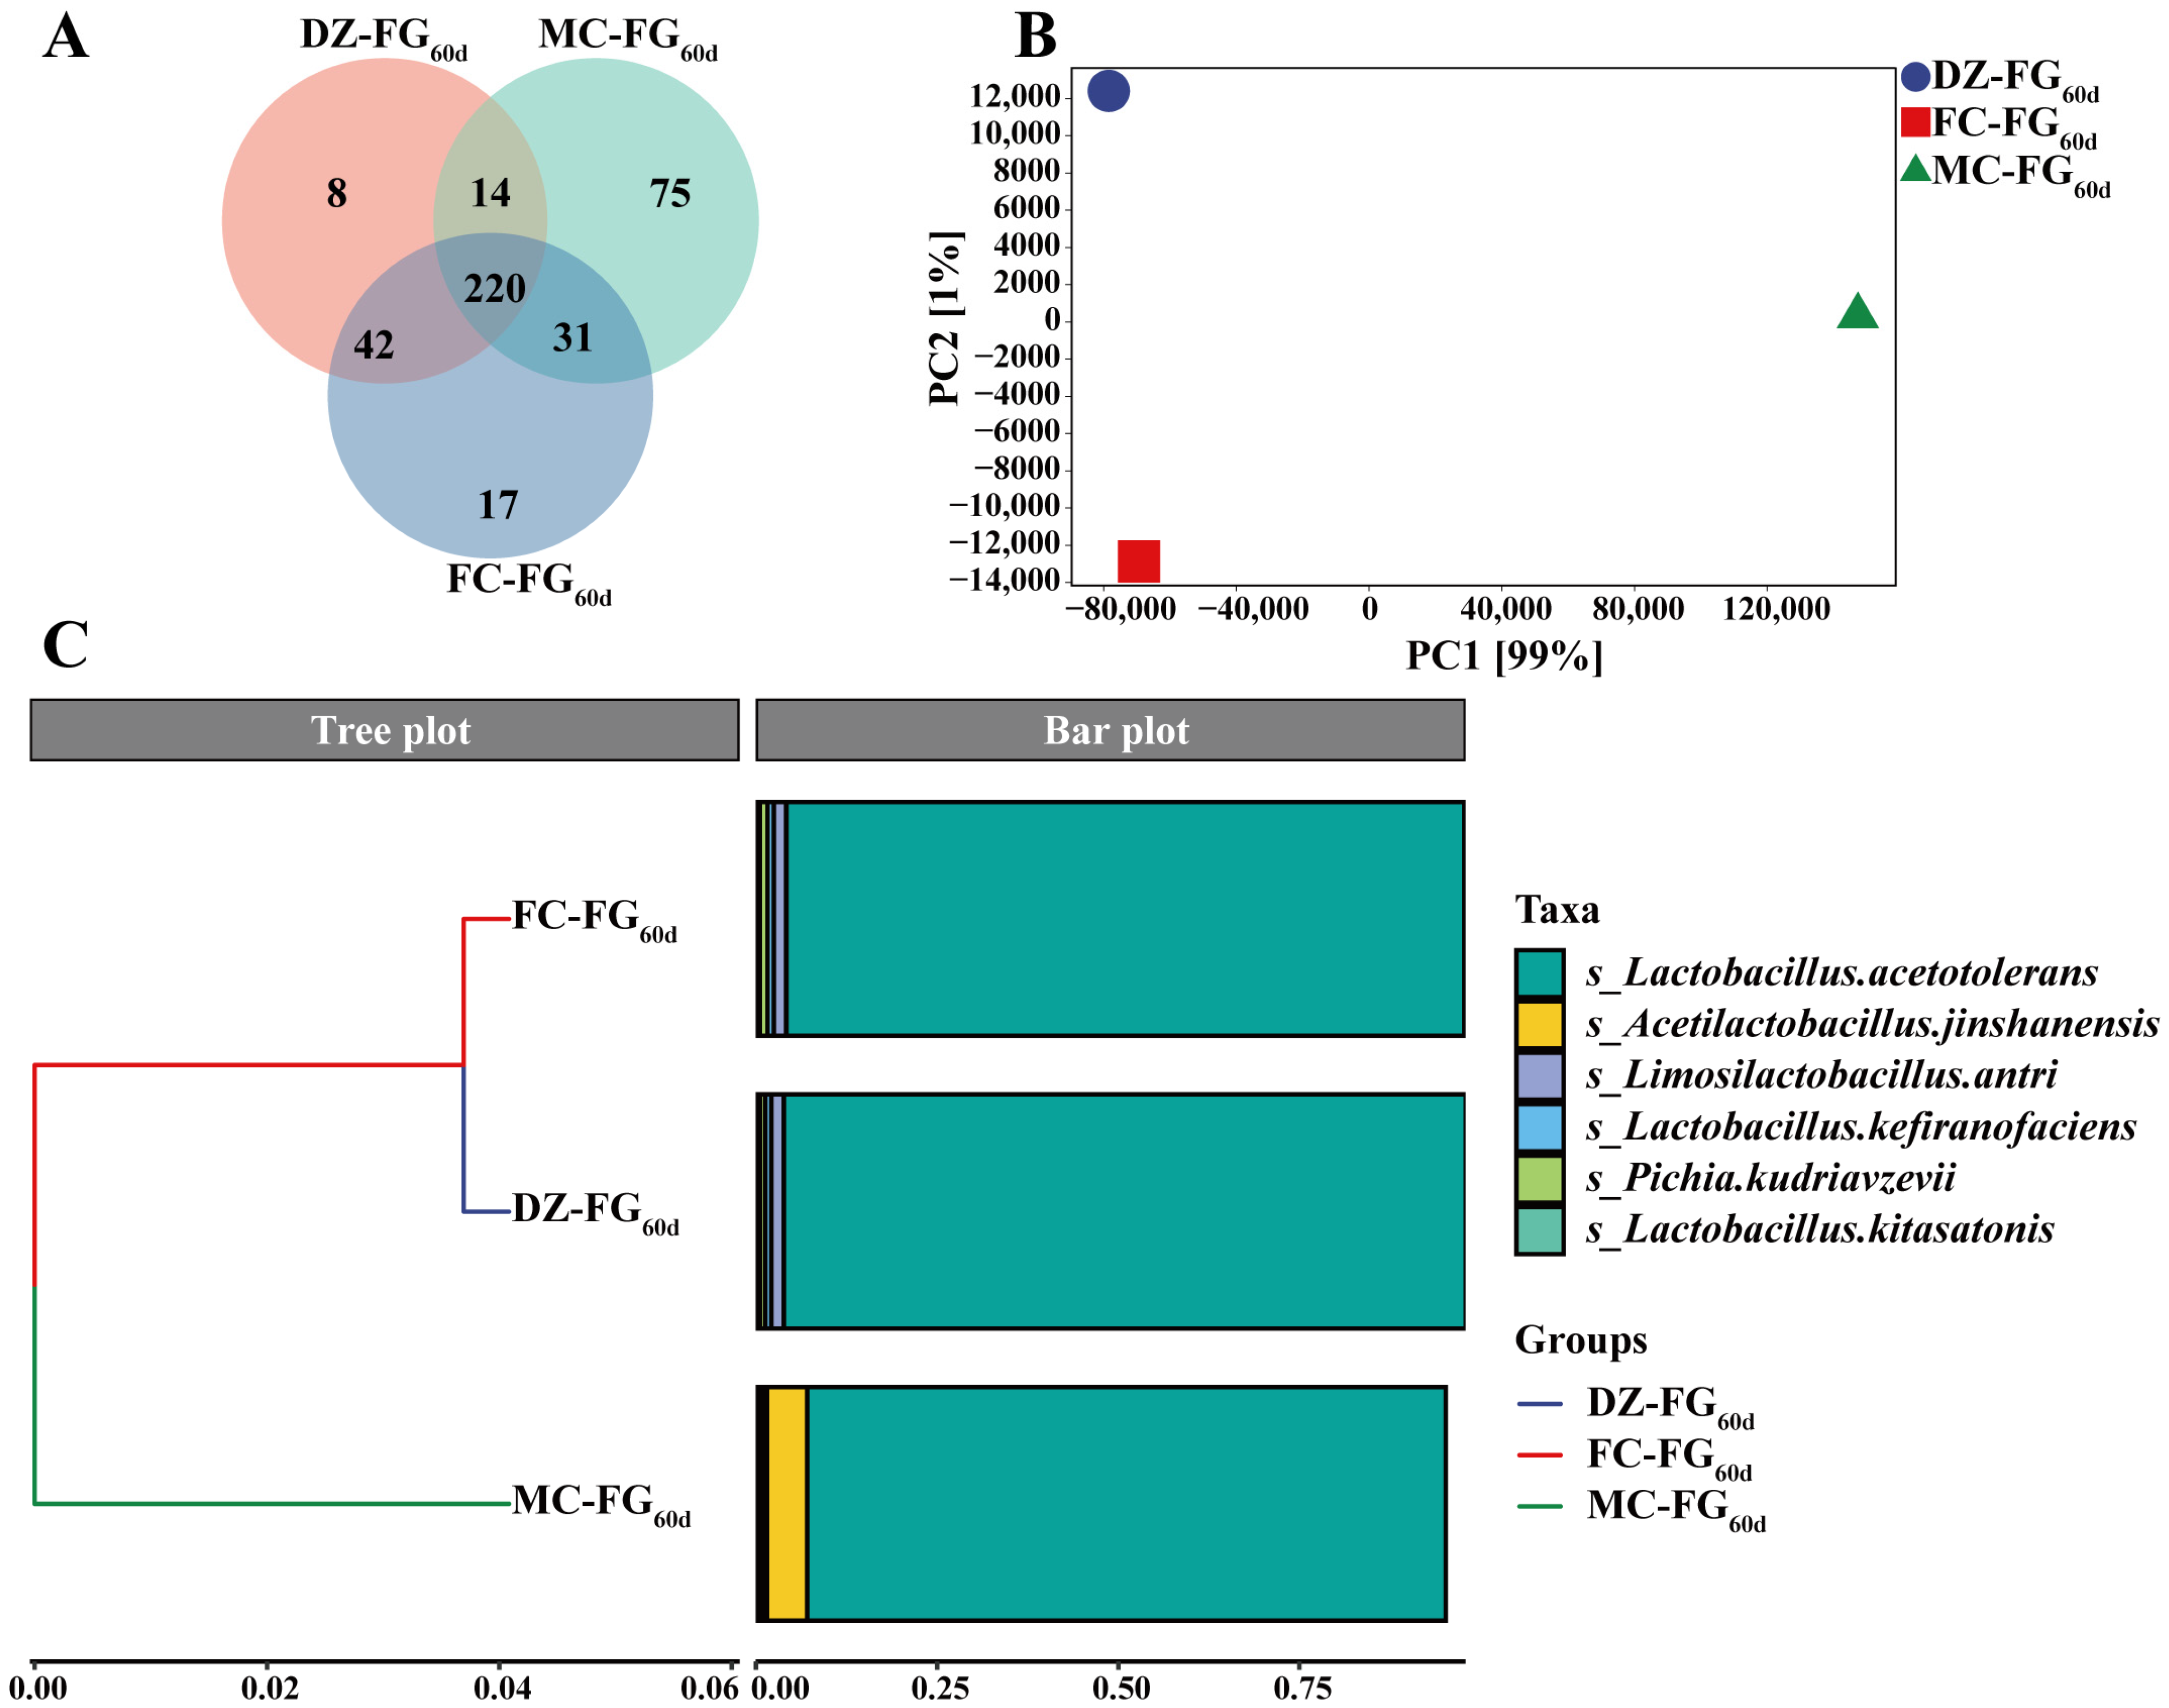
3.3. Difference in Microbiota Diversity and Their Constructure among Samples

The differences in α-diversity of the microbial communities are presented in Table 3. The bacterial richness and diversity in DQ were higher than those in MC and FC, possibly due to the greater ease of colonization by bacteria in smaller habitats [32,33]. The fungal diversity in MC was higher than that in FC and DQ, with the latter exhibiting the lowest diversity. In the initial phase, bacterial richness was highest in FC-FG0d, while diversity was highest in MC-FG0d. For fungi, richness and diversity were both highest in FC-FG0d. After 60 days of fermentation, there was a significant reduction in bacterial richness and diversity, along with a decrease in fungal richness, consistent with the findings reported by a previous study [34].
The results of the fungal community PCA analysis are presented in Figure 2A. For the fungal community, at the initial stage (0 days), the distances between FG were relatively short, indicating a similarity in structure. However, after 60 days, while the structure of MC-FG60d remained similar to the initial state, FC-FG60d and DZ-FG60d were not only distanced from the initial state but were also moved away from MC-FG60d. At the initial stage, the structure of the bacterial community resembled that of fungi, with mutual structural similarity, and a higher degree of similarity between FC-FG0d and DZ-FG0d was observed. Before and after fermentation, the bacterial community structures between the FG were found to be in a dispersed state, but aggregated states were individually demonstrated (Figure 2B). These results revealed that a significant impact on the structure of the fungal community was exerted by FC.

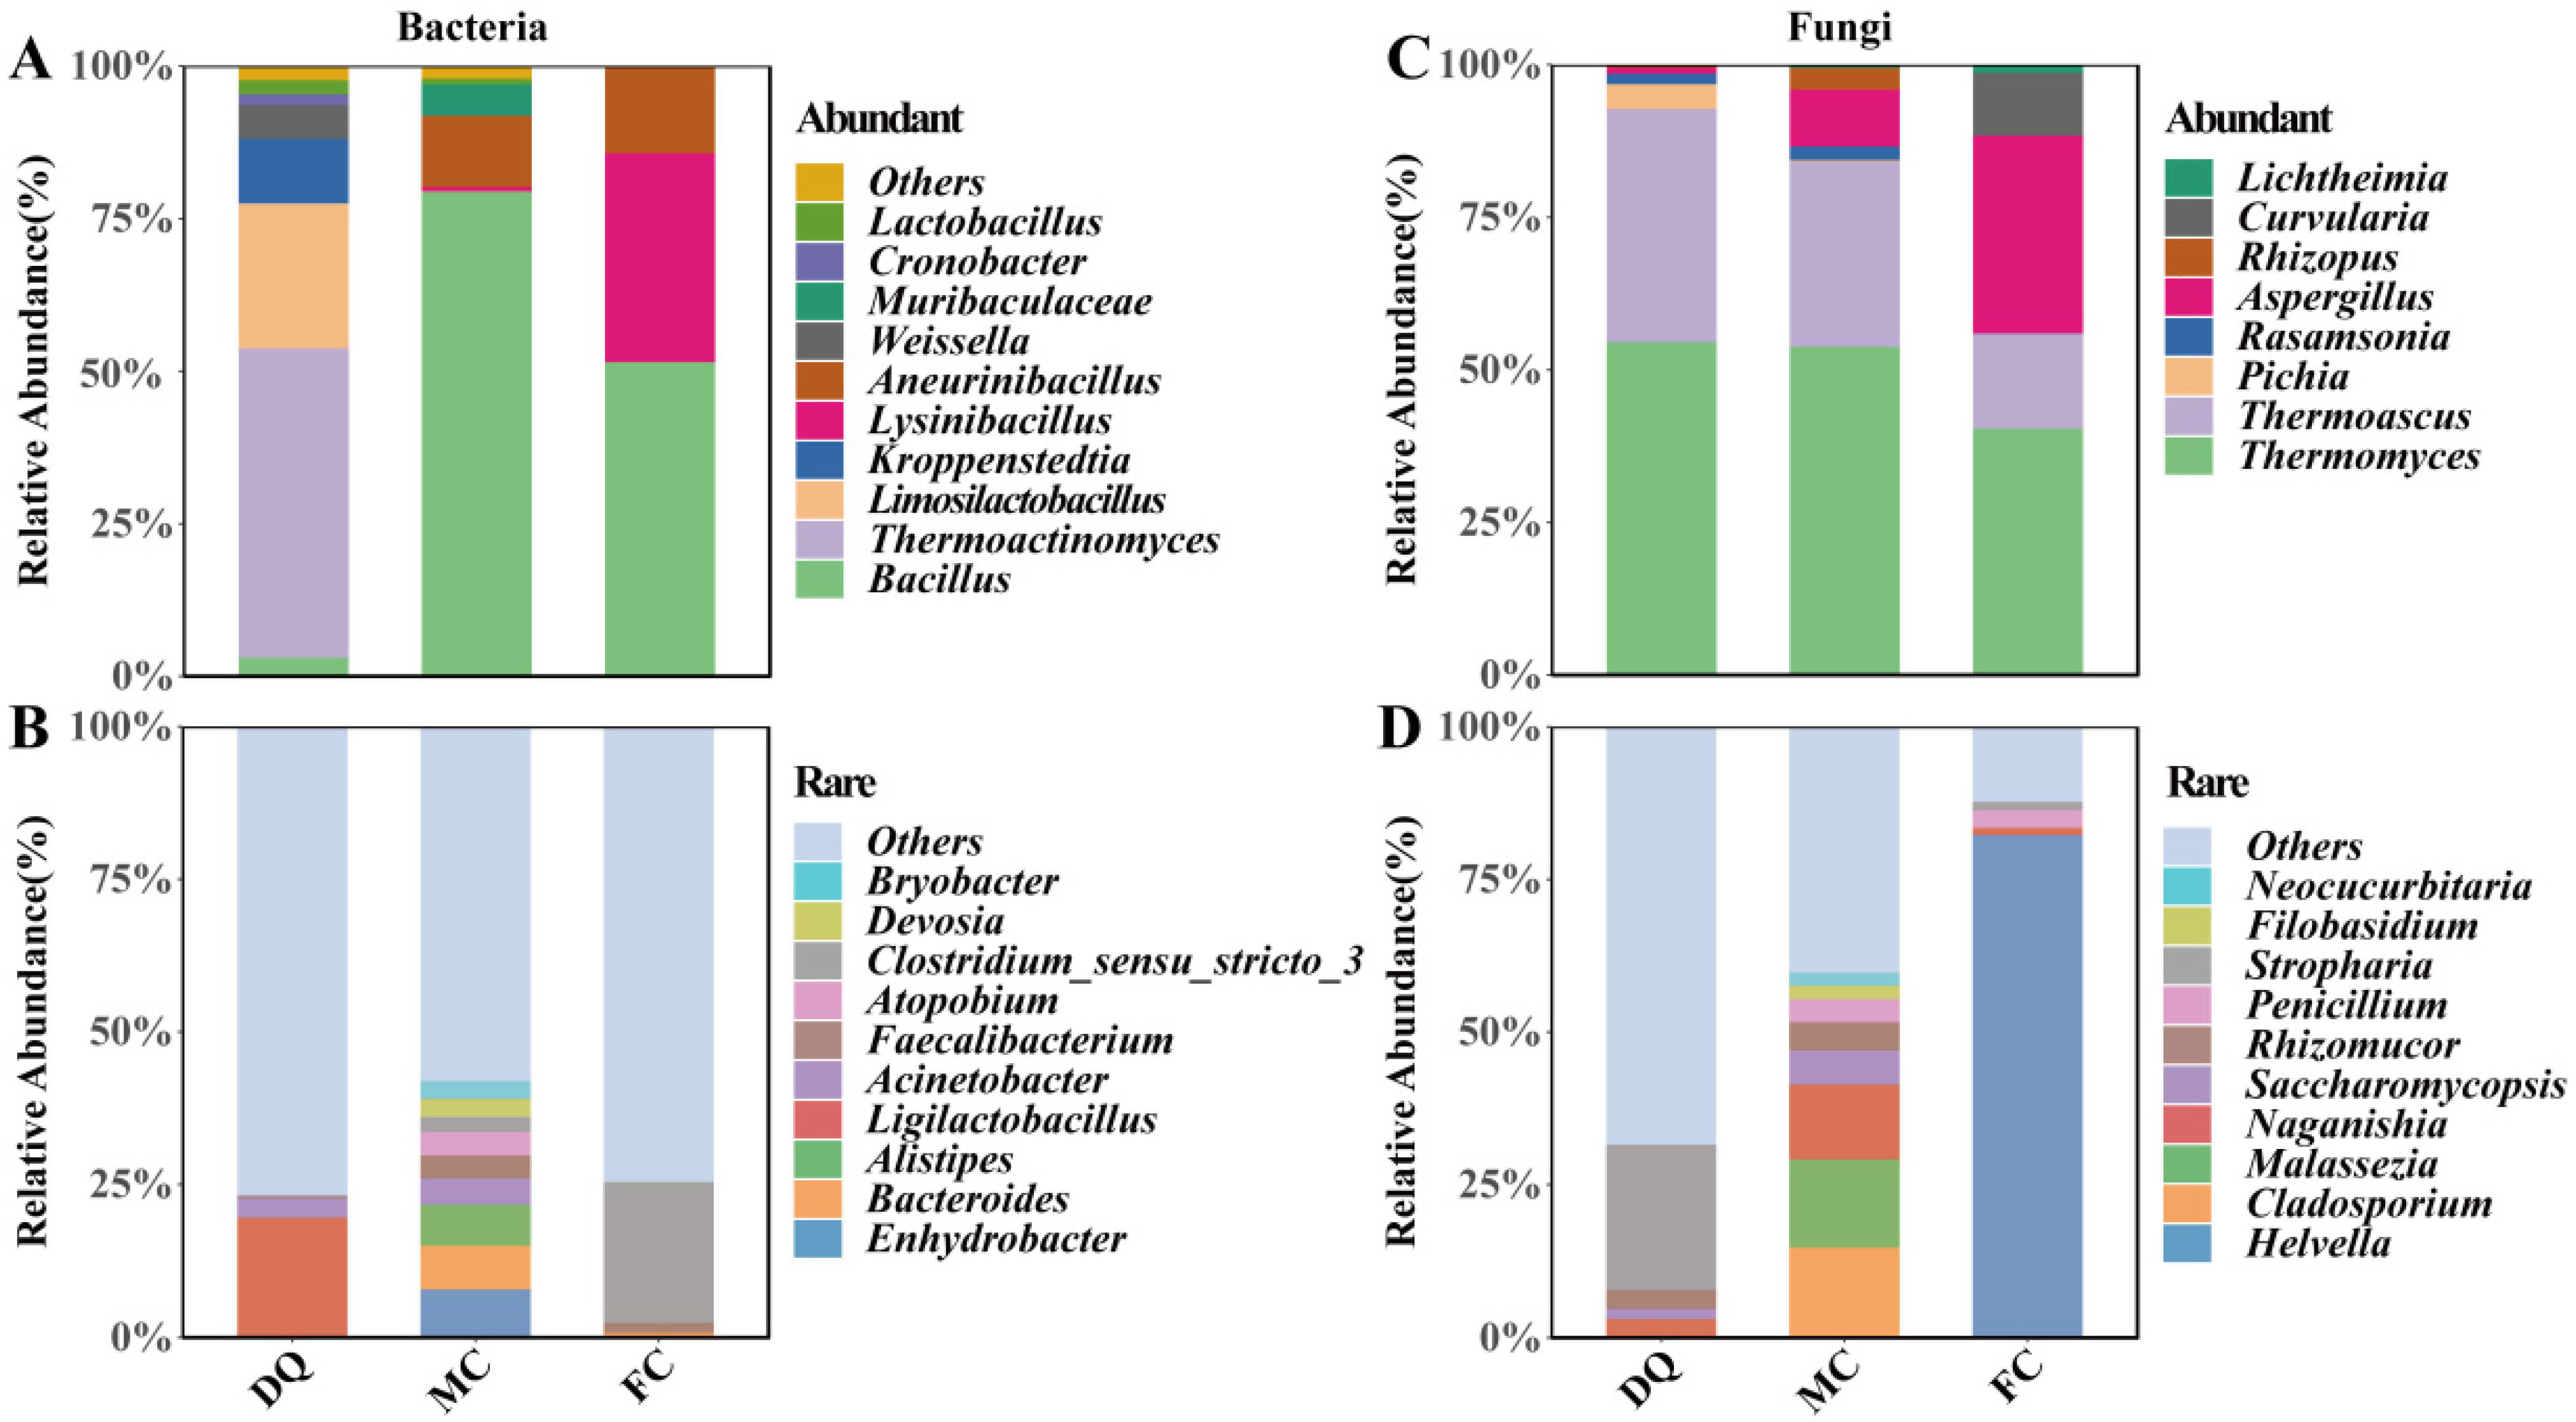
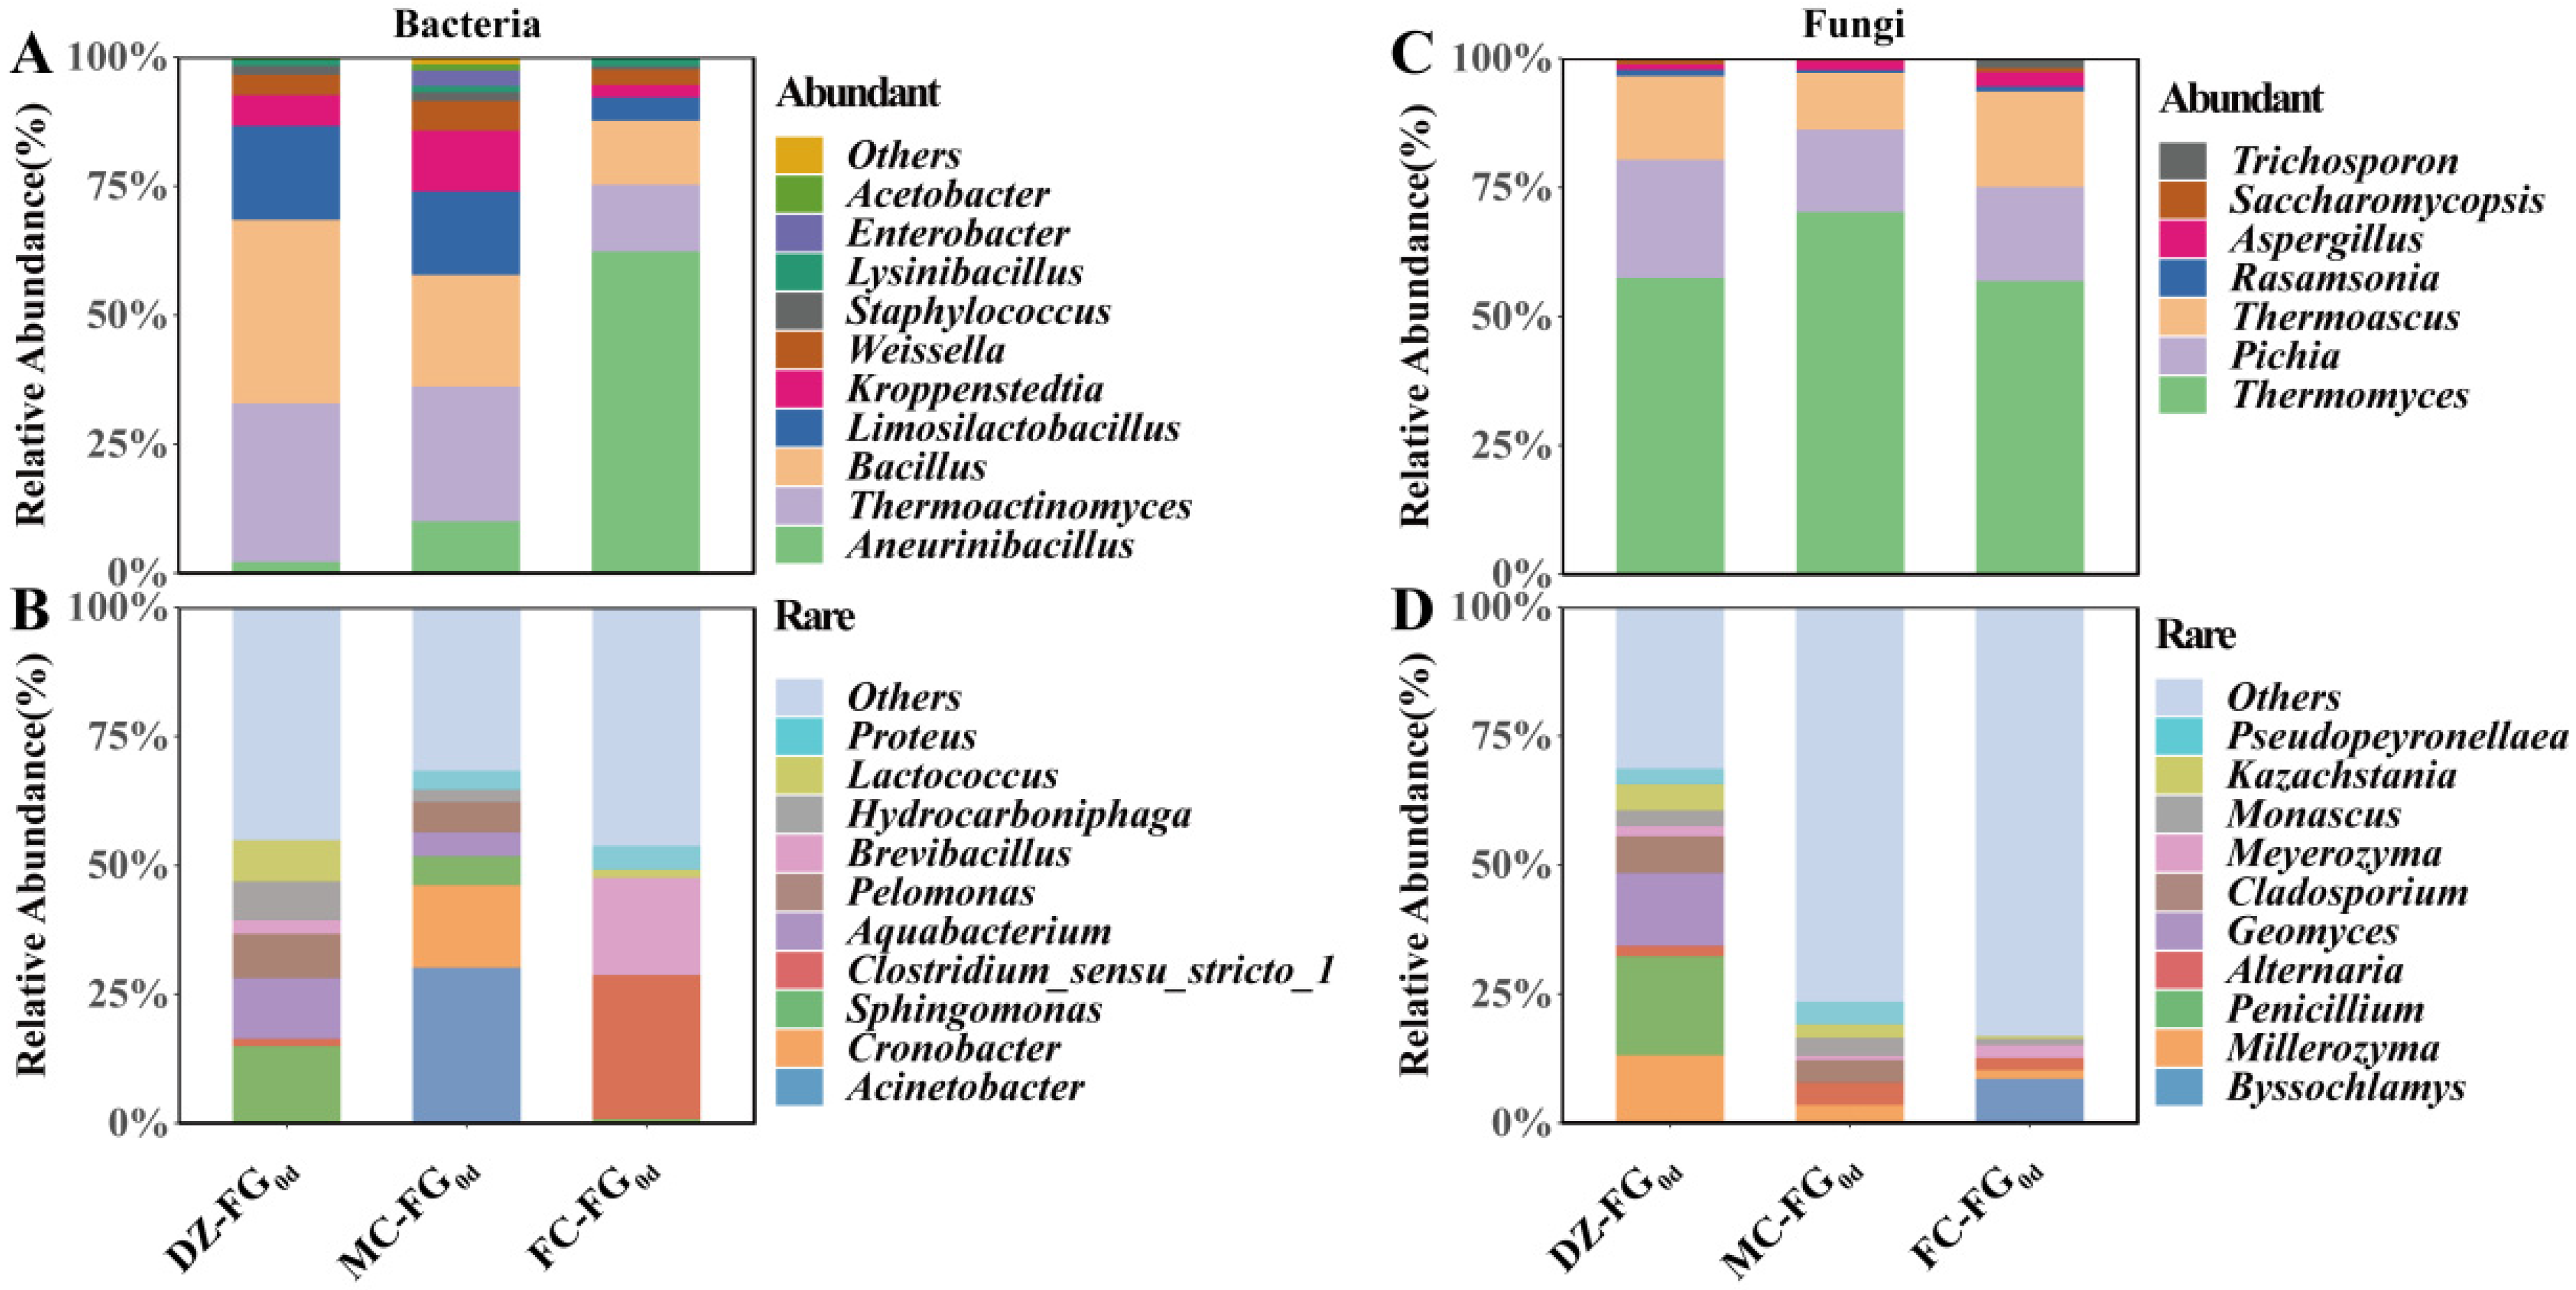
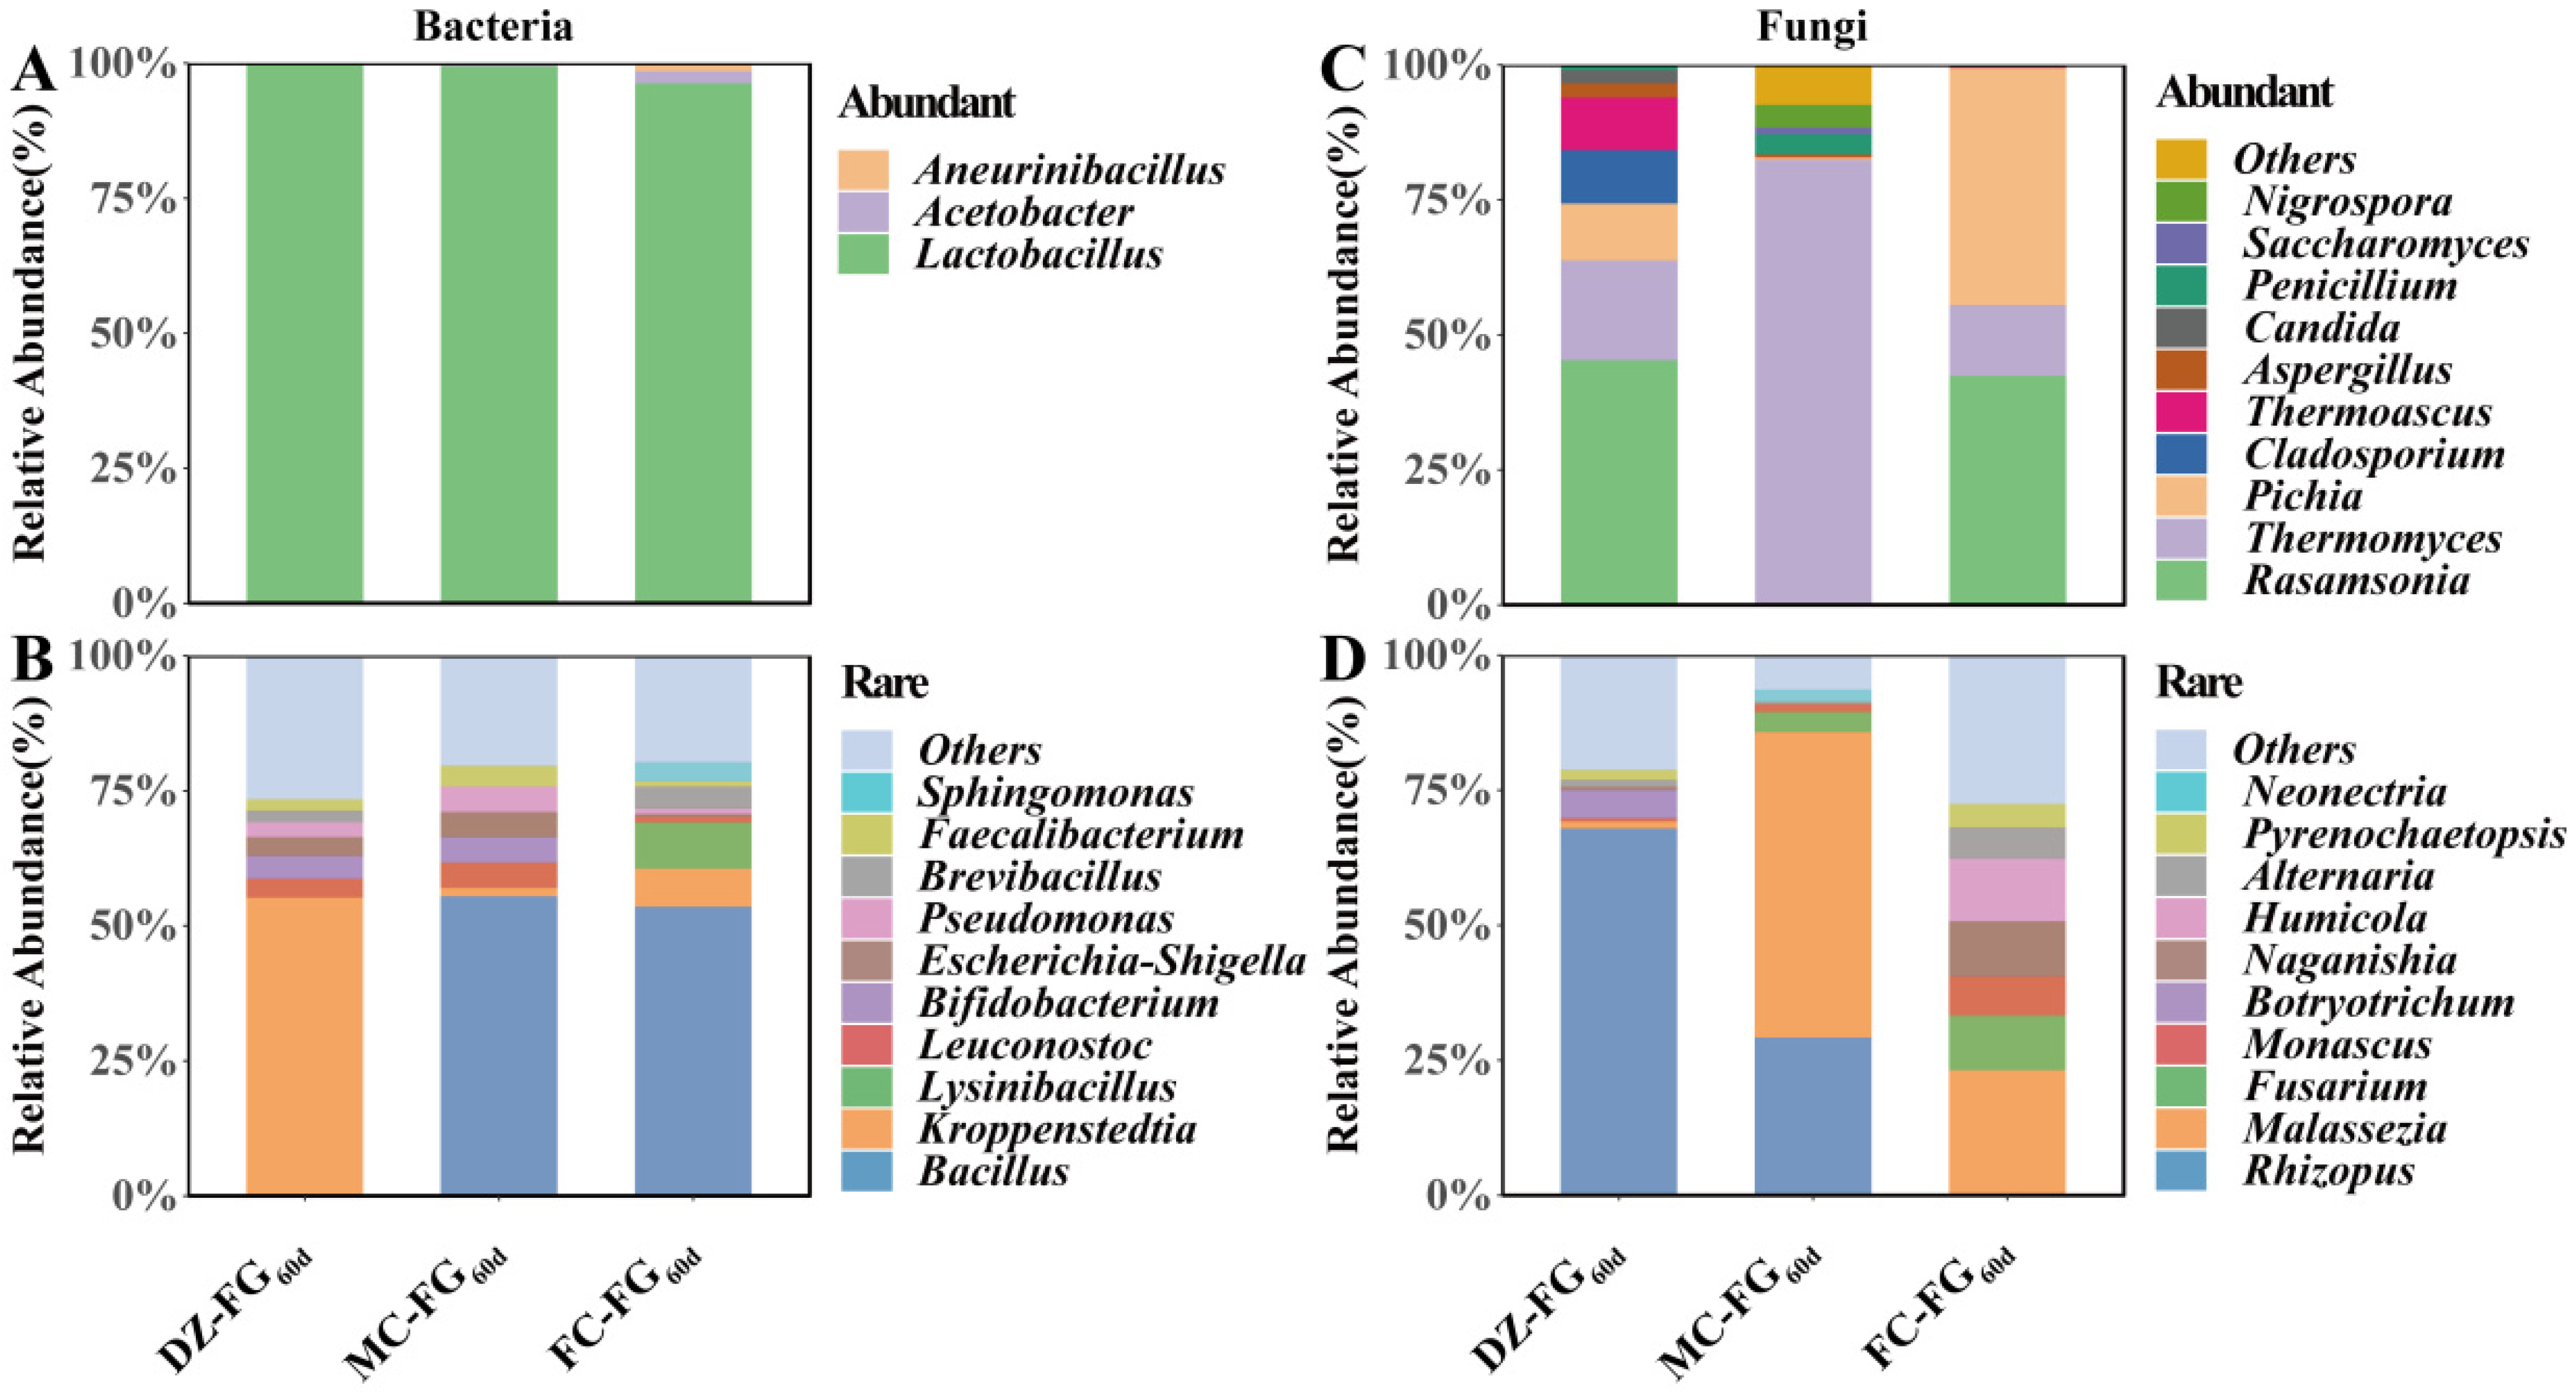
3.4. Distribution of Abundant and Rare Microbial Taxa

The samples were divided into three groups: Daqu and PM cultures (DQ, MC, and FC), FG0d (DZ-FG0d, MC-FG0d, and FC-FG0d), and FG60d (DZ-FG60d, MC-FG60d, and FC-FG60d). In reference to the definition provided by the previous study [35], the samples within the same group were categorized into the following six classes: Always abundant taxa (AAT): Within the same group, the relative abundance of ASVs was ≥1% in all samples. Conditionally abundant taxa (CAT): Within the same group, the relative abundance of ASVs was ≥1% in some samples but never rare (<0.01%) in any samples. Always rare taxa (ART): Within the same group, the relative abundance of ASVs was <0.01% in all samples. Conditionally rare taxa (CAT): Within the same group, the relative abundance of ASVs was <0.01% in some samples but never abundant (≥1%) in any samples. Moderate taxa (MT): Within the same group, the relative abundance of ASVs was between 0.01% and 1% in all samples. Conditionally rare and abundant taxa (CRAT): Within the same group, the relative abundance of ASV ranged from rare (<0.01%) to abundant (≥1%). AAT, CAT, and CRAT were classified as abundant taxa, while ART and CRT were categorized as rare taxa [36].
The distribution of abundant and rare taxa in the microbiota revealed that 10.92% of bacterial ASVs and 14.81% of fungal ASVs were classified as abundant taxa (AT), accounting for 94.39% and 98.37% of the total sequence counts, respectively, in Daqu and PM cultures (Table 4). Conversely, 86.55% of bacterial ASV and 77.78% of fungal ASV were identified as rare taxa (RT), comprising only 5.17% and 1.14% of the total sequence counts, respectively. This pattern of a lower proportion of ASVs but a higher proportion of sequence counts for AT and opposition for RT was consistent across both the initial and final FG, indicating a similar microbial composition trend [37].
In Daqu, as well as two types of PM cultures, 13 genera of AT bacteria were identified, including Thermoactinomyces, Limosilactobacillus, Kroppenstedtia, Weissella, etc., which dominated in DQ, while Bacillus and Aneurinibacillus shared in both MC and FC, and Lysinibacillus also dominated in the latter (Figure 3A). Kroppenstedtia, known for its high amylase and lipase secretion and organic acid metabolism [38], along with Bacillus, was highlighted as a functional bacteria in Daqu [39]. Aneurinibacillus, notable for its cellulose degradation of various enzymes, such as alkyl or aryl transferases, methyl transferases, and secretion abilities, was first detected in PM cultures, contributing to the formation of methyl esters [40]. Therefore, its role in the Baijiu brewing process warrants further exploration. Lysinibacillus showed the potential to efficiently degrade ethyl carbamate and its precursor, urea [17]. Limosilactobacillus was predominant in the early Daqu manufacturing process, converting substrates into lactic acid and ethanol [41]. The bacterial RT comprised 103 genera, with the dominated Ligilactobacillus, Acinetobacter, etc., in DQ, and Enhydrobacter, Bacteroides, Alistipes, etc., dominated in MC, as well as Clostridium_sensu_stricto_3 in FC (Figure 3B).
These starters contained eight genera of Abundant fungi, with Thermomyces and Thermoascus being common in both DQ and MC, and the order of RA was decreased in sequence (Figure 3C). The third most Abundant fungus was Pichia in DQ and Aspergillus in MC, respectively. Curvularia was uniquely abundant in FC, indicating a variation in dominant fungal genera across starters. In both Thermomyces and Thermoascus, known for their temperature tolerance and hydrolase production, the former produced temperature tolerance cellulases and proteases, while the latter produced hydrogen peroxide, endoglucanases, and glucosidases. Therefore, it can increase the yield and quality of fresh Baijiu by enhancing the ability to degrade macromolecular substrates, as well as retarding the toxicity of hydrogen peroxide to cells when the RA of these dominant microorganisms increases [42,43]. The fungal RT consisted of 42 genera, with the highest RA Stropharia in DQ and the most dominant Cladosporium, Malassezia, and Naganishia in MC, as well as the overwhelmingly dominant Helvella in FC (Figure 3D).
There were 11 genera classified as AT bacterial microbiota in the initial FG, but the RA of these microorganisms was different among samples, although their composition was similar. In each of DZ-FG0d and MC-FG0d, the RA of Thermoactinomyces, Bacillus, and Limosilactobacillus was higher, while that of Aneurinibacillus exceeded 60% in FG-FG0d (Figure 4A). The RT bacterial microbiota comprised 65 genera. The species and genus with higher RA were completely different among samples, in which Sphingomonas, Aquabacterium, and Pelomonas, as well as Acinetobacter and Cronobacter, were higher in DZ-FG0d and MC-FG0d, respectively, but Brevibacillus and Clostridium_sensu_stricto_1 dominated in FC-FG0d (Figure 4B).
The fungal AT comprised 7 genera, including Thermomyces, Pichia, Thermoascus, etc. (Figure 4C), while the RT of the fungal microbiota involved 35 genera, in which Millerozyma, Penicillium, and Geomyce dominated in DZ-FG0d and unidentified fungi were predominant in both MC-FG0d and FC-FG0d (Figure 4D).
By the time fermentation finished, the bacterial microbiota had belonged to AT and comprised three genera: Lactobacillus, with RA > 95%, which agreed with the result reported by the previous study [44], dominated, followed by Aneurinibacillus (Figure 5A). The bacterial microbiota belonging to RT involved 41 genera: Kroppenstedtia and Bacillus dominated in DZ-FG60d and both MC-FG60d and FC-FG60d, respectively (Figure 5B).
The AT fungal microbiota consisted of 11 genera: Rasamsonia and Cladosporium were transformed into AT in DZ-FG60d, along with Thermomyces, Pichia, and Thermoascus, which were also AT in the initial phase (Figure 5C). However, RA of Thermomyces accounted for 82.38% in MC-FG60d, while Rasamsonia, Thermomyces, and Pichia dominated in FC-FG60d. Rasamsonia is shared in both DZ-FG60d and FC-FG60d and is often detected in FG of strong-flavor Baijiu [26], and the contribution characterization needs to be explored further. RT of the fungal microbiota comprised 27 genera, of which Millerozyma evolved into Rhizopus in DZ-FG60d and enhanced RA of Malassezia significantly in MC-FG60d, as were that of Malassezia, Fusarium, Humicola, Naganishia, etc., in FC-FG60d (Figure 5D). Among these species and genera classified as RT fungal microbiota, Malassezia and Fusarium were major functional fungi [37], which might improve the quality of the base liquor as their RA enhanced.

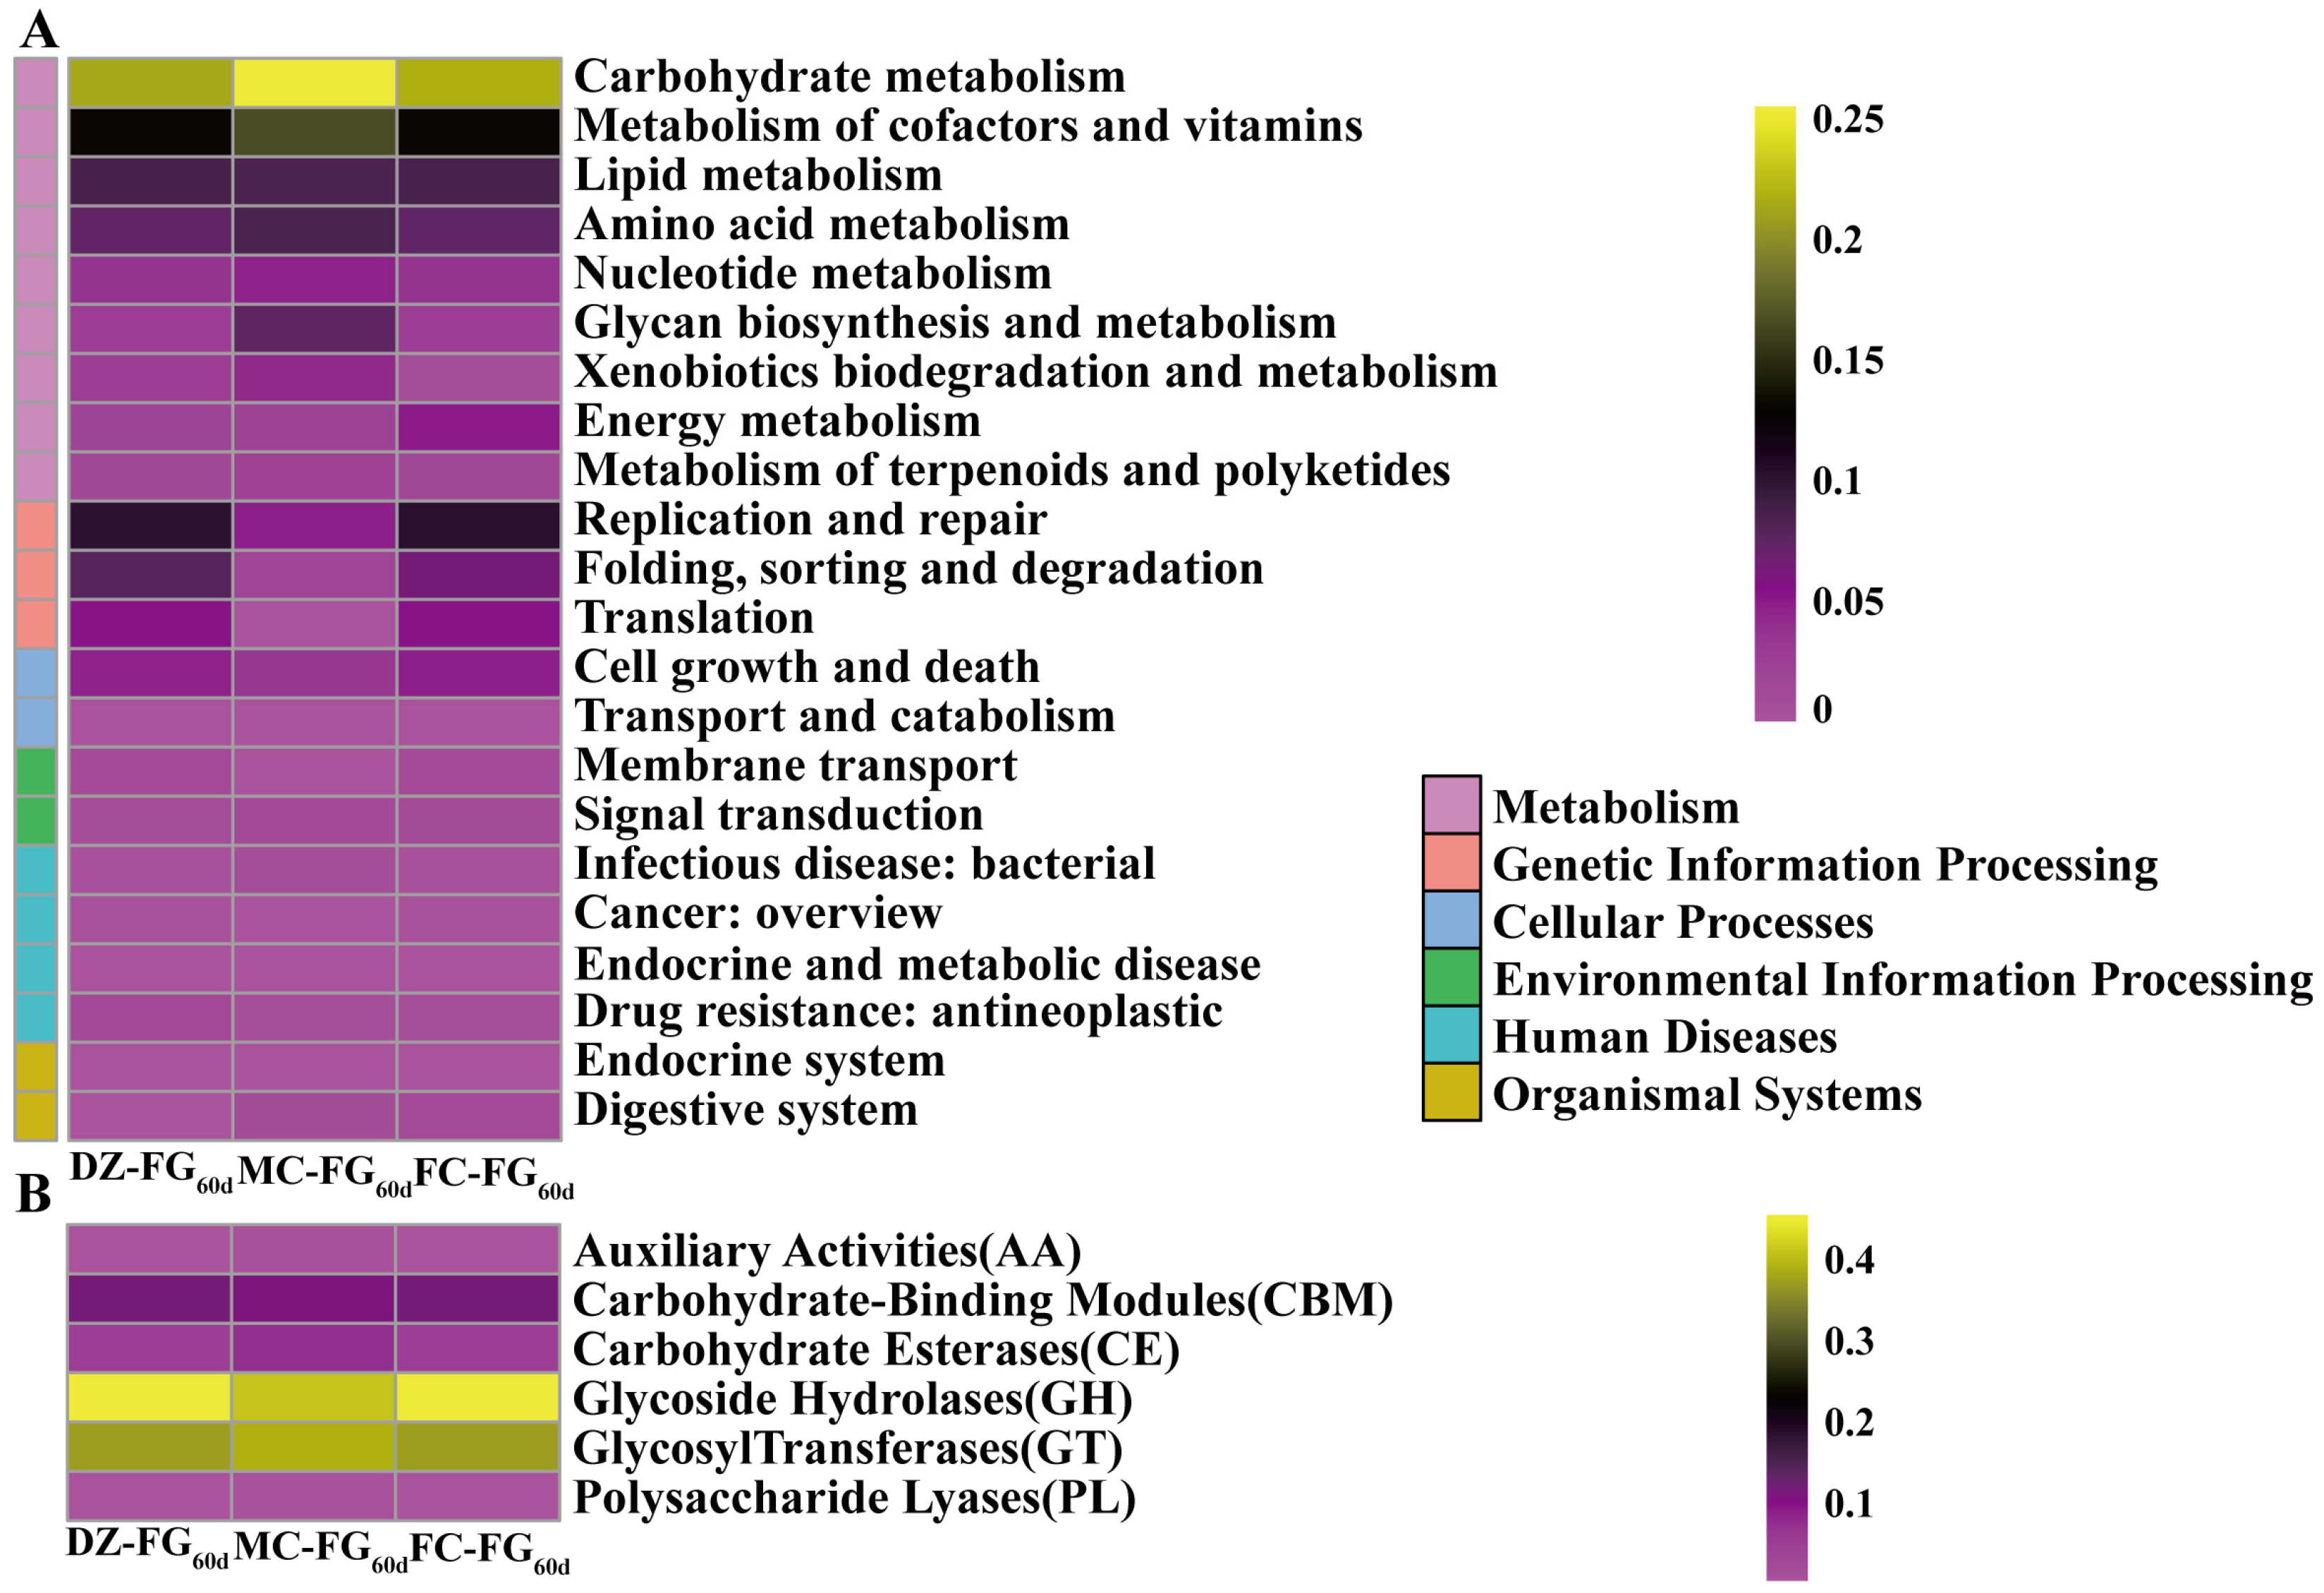
3.5. Differences in Microbiota Composition and Functional Annotation among FG by Metagenomic Sequencing

As shown in Figure 6A, a total of 220 shared species were detected in FG60d, of which 8, 17, and 75 unique species were found in DZ-FG60d, FC-FG60d, and MC-FG60d, respectively. Among these species identified, the bacteria dominated, primarily consisting of Lactobacillus and Acetilactobacillus, which accounted for 99.02%, 99.4%, and 98.80% of the total microbial population in DZ-FG60d, FC-FG60d, and MC-FG60d, respectively. These findings are in agreement with the results obtained by amplicon sequencing (Table 5). Specifically, Lactobacillus acetotolerans and Acetilactobacillus jinshanensis were dominant, with their combined RA reaching 97.38%, 99.26%, and 97.14%, respectively, in DZ-FG60d, FC-FG60d, and MC-FG60d. The total RA of the fungal microbiota varied from 0.06% to 0.55%, mainly comprised of Pichia and Saccharomyces, consistent with the result of amplicon sequencing. However, Rasamsonia and Thermomyces were undetected as the RA was too low in the overall analysis of bacterial and fungal microbiota.
The PCA results are displayed in Figure 6B. PC1 and PC2 accounted for 99% and 1% of the variance in species community composition, respectively. The projection on PC1 showed that DZ-FG60d and FC-FG60d were very close to each other, indicating similarity in their species communities, whereas MC-FG60d was distinctly separated from these two, highlighting a significant difference in its microbiota structure. Similarly, the PCA findings were corroborated by the results from hierarchical cluster analysis (Figure 6C). These results revealed that the microbiota structures of DZ-FG60d and FC-FG60d were similar to each other but significantly different from those of MC-FG60d.
Based on the KEGG annotation, differences in the metabolic functional profile among FG were inferred (Figure 7A). The RA of genes related to metabolism was highest, primarily enriched in carbohydrate metabolism [45], with the highest value of 87.14% observed in MC-FG60d. This was followed by genetic information processing, which had a higher RA in both DZ-FG60d and FC-FG60d. Conversely, the RA of genes related to human diseases was lower in both FC-FG60d and MC-FG60d.
Utilizing CAZy annotation, the composition of the enzymes related to carbohydrate metabolism was investigated (Figure 7B). These results revealed that the RA of expressed glycoside hydrolases (GH) and glycosyl transferases (GT) was the highest [44], and carbohydrate-binding modules (CBM) and carbohydrate esterases (CE) also showed relatively high abundance. GH enzymes catalyze the hydrolysis of glycosidic bonds to break down complex sugars and polysaccharides [46]. GT enzymes played a crucial role in polysaccharide synthesis or glycosylation processes [47] and were instrumental in the Embden–Meyerhof–Parnas (EMP) pathway and the hexose monophosphate (HMP) pathway, facilitating the use of glucose for lactic acid production [44]. In MC-FG60d, a lower RA of GH was observed, whereas GT exhibited a higher RA, correlating with its increased starch content and reduced sugar content.

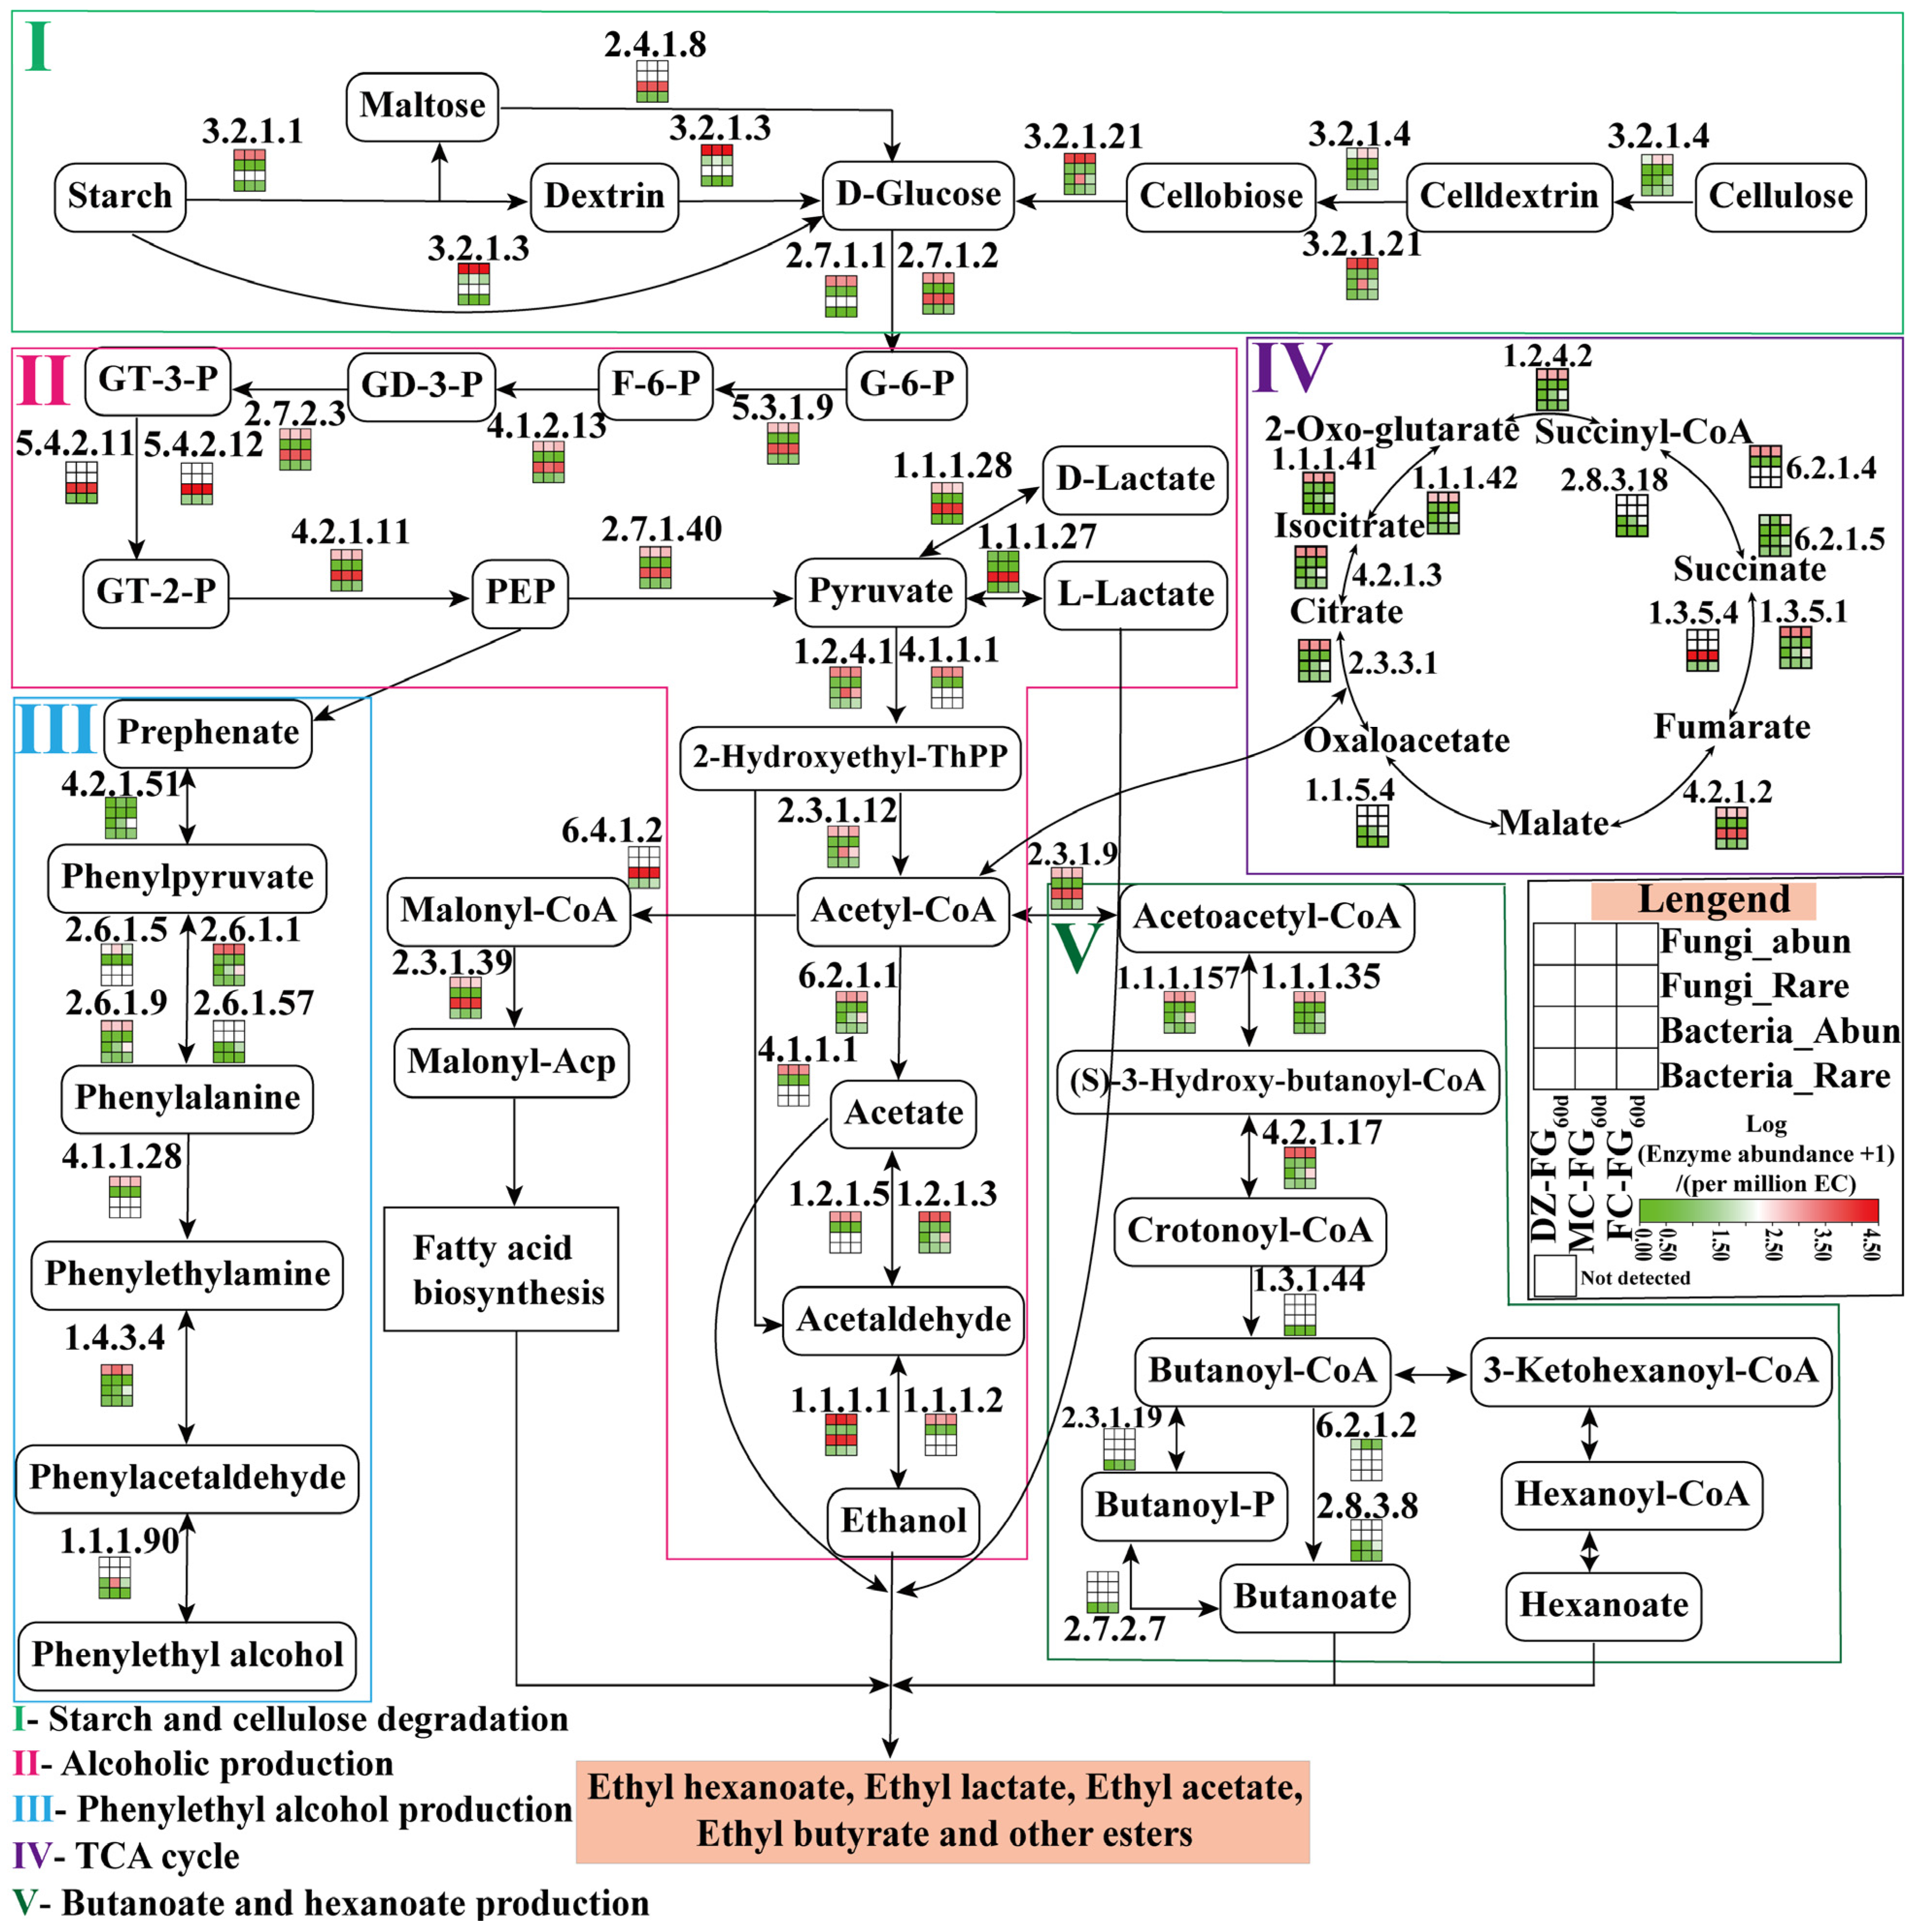
3.6. Differences in the Contribution of Abundant and Rare Taxa to Metabolic Pathways

The predictive results from PICRUSt2 indicated that the metabolic pathways associated with flavor synthesis were explored, including the degradation of starch and cellulose, ethanol production, phenylethanol production, the TCA cycle, and pathways for butyric and hexanoic acid generation (Figure 8). Starch and cellulose were broken down into glucose through the action of enzymes such as alpha-amylase (EC:3.2.1.1), glucoamylase (EC:3.2.1.3), maltose phosphorylase (EC:2.4.1.8), cellulase (EC:3.2.1.4), and beta-glucosidase (EC:3.2.1.21). Among these enzymes, maltose phosphorylase (EC:2.4.1.8) was mainly regulated by the abundant bacterial subgroups, while the others were regulated by the abundant fungal subgroups.
Glucose was converted into pyruvic acid, a key precursor for various flavor compounds, through glycolysis [48]. In aerobic conditions, pyruvic acid was transformed into acetyl-CoA, which was essential for the tricarboxylic acid (TCA) cycle and fatty acid synthesis. Under anaerobic conditions, pyruvic acid could be catalyzed by lactate dehydrogenase to produce lactic acid or undergo decarboxylation to generate acetaldehyde, which is subsequently reduced to ethanol. Lactic acid production involved both Abundant fungi and bacteria, with the L-lactic acid-producing enzyme (EC:1.1.1.27) regulated by Abundant bacteria and the D-lactic acid-producing enzyme (EC:1.1.1.28) regulated by both. Pyruvate decarboxylase (EC:4.1.1.1) was mainly regulated by Abundant fungi, while the crucial enzymes (EC:1.1.1.1 and EC:1.1.1.2) for ethanol production were co-regulated by both Abundant bacteria and fungi.
The metabolism of phenylalanine was primarily regulated by the fungal community, although the crucial enzyme (EC:1.1.1.90) for the synthesis of phenylethanol was identified exclusively in the bacterial microbiota. The TCA cycle, essential for aerobic respiration, plays a vital role in providing energy and nutrition for microbial growth and is primarily influenced by Abundant fungi. Meanwhile, the metabolism of the butyric acid pathway was strongly associated with the bacterial RT [4].

4. Conclusions

This study employed HS-SPME–GC–MS and high-throughput sequencing to systematically investigate the impact of PM cultures on the volatile components, microbial community structure, and metabolic profiles of FG. Results indicated that the addition of MC and FC enhanced the flavor of FG, notably increasing the content of esters and ethyl hexanoate. FC culture exerted a more pronounced effect, enriching key flavor components such as ethyl hexanoate, ethyl acetate, ethyl palmitate, and elaidic acid ethyl ester. PM cultures induced notable shifts in the composition of rare taxa: dominant Rare bacteria transitioned from Kroppenstedtia to Bacillus, and dominant Rare fungi shifted from Rhizopus to Malassezia, Fusarium, Humicola, and Naganishia. Through the synergistic effects of abundant and rare taxa, their metabolic functional profiles were enhanced, leading to the accumulation of flavor substances.
In conclusion, this study provides essential insights into the role of PM functional microbial cultures in influencing the flavor and microbial community dynamics of FG. These findings are instrumental in advancing the regulation of the production processes, resulting in the creation of high-quality Baijiu. This research underscores the importance of microbial diversity and interactions within PM cultures for optimizing and innovating Baijiu production.

Author Contributions

Conceptualization, Y.W., Q.T., S.Z. and R.Z.; methodology, Y.W. and C.Q.; software, Y.W., Q.T. and Z.Z.; validation, M.H.; formal analysis, S.Z., H.Q., X.W. and C.Q.; investigation, J.H., Y.D., X.W. and Y.Z.; resources, J.H. and R.Z.; data curation, Y.W., Z.Z. and Y.Z.; writing—original draft preparation, Y.W.; writing—review and editing, R.Z.; visualization, Y.W.; supervision, J.H., Q.T., H.Q., M.H. and R.Z.; project administration, Y.D.; funding acquisition, S.Z. and H.Q. All authors have read and agreed to the published version of the manuscript.

Funding

This research was funded by the Cooperation Project of Luzhou Lao Jiao Co., Ltd. and Sichuan University (21H0997) and the Luzhou Key Research and Development Project (2022-SYF-32).

Data Availability Statement

The original contributions presented in the study are included in the article, further inquiries can be directed to the corresponding author.

Conflicts of Interest

Prof. Suyi Zhang, Mr. Hui Qin, Mr. Yi Dong, Mr. Xiaojun Wang, Mr. Chuanfeng Qiu and Ms. Mengyang Huang come from Luzhou Lao Jiao Co., Ltd. And Prof. Suyi Zhang participated in the conceptualization, Formal analysis and Funding acquisition; Mr. Hui Qin participated in the Formal analysis, Supervision and Funding acquisition; Mr. Yi Dong participated in the Investigation and Project administration; Mr. Xiaojun Wang participated in the Investigation; Mr. Chuanfeng Qiu participated in the Methodology and Formal analysis; Ms. Mengyang Huang participated in the Validation and Supervision. The authors declare that this study received funding from Luzhou Lao Jiao Co., Ltd. The funder was not involved in the study design, collection, analysis, interpretation of data, the writing of this article or the decision to submit it for publication.

References

  1. Tao, Y.; Wang, X.; Li, X.; Wei, N.; Jin, H.; Xu, Z.; Tang, Q.; Zhu, X. The functional potential and active populations of the pit mud microbiome for the production of Chinese strong-flavour liquor. Microb. Biotechnol. 2017, 10, 1603–1615. [Google Scholar] [CrossRef]
  2. Gao, J.; Liu, G.; Li, A.; Liang, C.; Ren, C.; Xu, Y. Domination of pit mud microbes in the formation of diverse flavour compounds during Chinese strong aroma-type Baijiu fermentation. LWT 2021, 137, 110442. [Google Scholar] [CrossRef]
  3. Mu, Y.; Huang, J.; Zhou, R.; Zhang, S.; Qin, H.; Dong, Y.; Wang, C.; Wang, X.; Pan, Q.; Tang, H. Comprehensive analysis for the bioturbation effect of space mutation and biofortification on strong-flavor Daqu by high-throughput sequencing, volatile analysis and metabolomics. Food Chem. 2023, 403, 134440. [Google Scholar] [CrossRef] [PubMed]
  4. Mu, Y.; Huang, J.; Zhou, R.; Zhang, S.; Qin, H.; Tang, H.; Pan, Q.; Tang, H. Response and assembly of abundant and rare taxa in Zaopei under different combination patterns of Daqu and pit mud: From microbial ecology to Baijiu brewing microecosystem. Food Sci. Hum. Wellness 2024, 13, 1439–1452. [Google Scholar] [CrossRef]
  5. Qian, W.; Lu, Z.; Chai, L.; Zhang, X.; Li, Q.; Wang, S.; Shen, C.; Shi, J.; Xu, Z. Cooperation within the microbial consortia of fermented grains and pit mud drives organic acid synthesis in strong-flavor Baijiu production. Food Res. Int. 2021, 147, 110449. [Google Scholar] [CrossRef]
  6. Mao, F.; Huang, J.; Zhou, R.; Zhang, S.; Qin, H. Effects of microbial community in artificial pit mud on the formation of flavor metabolites during the fermentation of Nong-flavor Baijiu. Food Sci. 2024, 45, 125–134. (In Chinese) [Google Scholar]
  7. Deng, L.; Mao, X.; Liu, D.; Ning, X.; Shen, Y.; Chen, B.; Nie, H.; Huang, D.; Luo, H. Comparative Analysis of Physicochemical Properties and Microbial Composition in High-Temperature Daqu With Different Colors. Front. Microbiol. 2020, 11, 588117. [Google Scholar] [CrossRef] [PubMed]
  8. Liu, M.; Tang, Y.; Guo, X.; Zhao, K.; Penttinen, P.; Tian, X.; Zhang, X.; Ren, D.; Zhang, X.; Ercolini, D. Structural and Functional Changes in Prokaryotic Communities in Artificial Pit Mud during Chinese Baijiu Production. mSystems 2020, 5, e00829-19. [Google Scholar] [CrossRef]
  9. Zhang, L.; Zhou, R.; Niu, M.; Zheng, J.; Wu, C. Difference of microbial community stressed in artificial pit muds for Luzhou-flavour liquor brewing revealed by multiphase culture-independent technology. J. Appl. Microbiol. 2015, 119, 1345–1356. [Google Scholar] [CrossRef]
  10. Lu, S.W.; Wei, C.C.; Li, Z.H.; He, X.H.; Tao, Y. Effects of a new caproic acid-producing bacteria on prokaryotic community structure and the acid ester content during the culture of artifcial pit mud. Chin. J. Appl. Environ. Biol. 2020, 26, 144–151. (In Chinese) [Google Scholar]
  11. Song, J.; Tang, H.; Liang, H.; Luo, L.; Lin, W. Effect of bioaugmentation on biochemical characterisation and microbial communities in Daqu using Bacillus, Saccharomycopsis and Absidia. Int. J. Food Sci. Technol. 2019, 54, 2639–2651. [Google Scholar] [CrossRef]
  12. Zhang, W.; Si, G.; Du, H.; Li, J.; Zhou, P.; Ye, M. Directional design of a starter to assemble the initial microbial fermentation community of baijiu. Food Res. Int. 2020, 134, 109255. [Google Scholar] [CrossRef] [PubMed]
  13. He, G.; Dong, Y.; Huang, J.; Wang, X.; Zhang, S.; Wu, C.; Jin, Y.; Zhou, R. Alteration of microbial community for improving flavor character of Daqu by inoculation with Bacillus velezensis and Bacillus subtilis. LWT 2019, 111, 1–8. [Google Scholar] [CrossRef]
  14. He, G.; Huang, J.; Wu, C.; Jin, Y.; Zhou, R. Bioturbation effect of fortified Daqu on microbial community and flavor metabolite in Chinese strong-flavor liquor brewing microecosystem. Food Res. Int. 2020, 129, 108851. [Google Scholar] [CrossRef]
  15. Zhi, Y.; Wu, Q.; Du, H.; Xu, Y. Biocontrol of geosmin-producing Streptomyces spp. by two Bacillus strains from Chinese liquor. Int. J. Food Microbiol. 2016, 231, 1–9. [Google Scholar] [CrossRef] [PubMed]
  16. Zeng, Y.; Luo, H.; Yu, D.; Huang, D.; Guo, H.; Zou, Y. Screening and application of biogenic amines degrading strain derived from Luzhou-flavor Daqu. Food Ferment. Ind. 2021, 47, 145–151. (In Chinese) [Google Scholar]
  17. Cui, K.; Wu, Q.; Xu, Y. Biodegradation of Ethyl Carbamate and Urea with Lysinibacillus sphaericus MT33 in Chinese Liquor Fermentation. J. Agric. Food Chem. 2018, 66, 1583–1590. [Google Scholar] [CrossRef] [PubMed]
  18. Hu, X.; Tian, R.; Wang, K.; Cao, Z.; Yan, P.; Li, F.; Li, X.; Li, S.; He, P. The prokaryotic community, physicochemical properties and flavors dynamics and their correlations in fermented grains for Chinese strong-flavor Baijiu production. Food Res. Int. 2021, 148, 110626. [Google Scholar] [CrossRef] [PubMed]
  19. You, L.; Zhao, D.; Zhou, R.; Tan, Y.; Wang, T.; Zheng, J. Distribution and function of dominant yeast species in the fermentation of strong-flavor baijiu. World J. Microbiol. Biotechnol. 2021, 37, 26. [Google Scholar] [CrossRef]
  20. Xu, S.; Zhang, M.; Xu, B.; Liu, L.; Sun, W.; Mu, D.; Wu, X.; Li, X. Microbial communities and flavor formation in the fermentation of Chinese strong-flavor Baijiu produced from old and new Zaopei. Food Res. Int. 2022, 156, 111162. [Google Scholar] [CrossRef]
  21. Wright, R.J.; Gibson, M.I.; Christie-Oleza, J.A. Understanding microbial community dynamics to improve optimal microbiome selection. Microbiome 2019, 7, 85. [Google Scholar] [CrossRef] [PubMed]
  22. Zhao, C.; Yan, X.; Yang, S.; Chen, F. Screening of Bacillus strains from Luzhou-flavor liquor making for high-yield ethyl hexanoate and low-yield propanol. LWT 2017, 77, 60–66. [Google Scholar] [CrossRef]
  23. Mao, F.; Huang, J.; Zhou, R.; Qin, H.; Zhang, S.; Cai, X.; Qiu, C. Effects of Daqu properties on the microbial community and their metabolites in fermented grains in Baijiu fermentation system. Can. J. Microbiol. 2023, 69, 170–181. [Google Scholar] [CrossRef]
  24. Xu, Y.; Wu, M.; Zhao, D.; Zheng, J.; Dai, M.; Li, X.; Li, W.; Zhang, C.; Sun, B. Simulated Fermentation of Strong-Flavor Baijiu through Functional Microbial Combination to Realize the Stable Synthesis of Important Flavor Chemicals. Foods 2023, 12, 644. [Google Scholar] [CrossRef] [PubMed]
  25. Xu, Y.; Zhao, J.; Liu, X.; Zhang, C.; Zhao, Z.; Li, X.; Sun, B. Flavor mystery of Chinese traditional fermented baijiu: The great contribution of ester compounds. Food Chem. 2022, 369, 130920. [Google Scholar] [CrossRef]
  26. Jiao, W.; Xie, F.; Gao, L.; Du, L.; Wei, Y.; Zhou, J.; He, G. Identification of core microbiota in the fermented grains of a Chinese strong-flavor liquor from Sichuan. LWT 2022, 158, 113140. [Google Scholar] [CrossRef]
  27. Yue, W.; Sun, W.; Rao, R.S.P.; Ye, N.; Yang, Z.; Chen, M. Non-targeted metabolomics reveals distinct chemical compositions among different grades of Bai Mudan white tea. Food Chem. 2019, 277, 289–297. [Google Scholar] [CrossRef]
  28. Wu, L.; Huang, X.; Liu, S.; Liu, J.; Guo, Y.; Sun, Y.; Lin, J.; Guo, Y.; Wei, S. Understanding the formation mechanism of oolong tea characteristic non-volatile chemical constitutes during manufacturing processes by using integrated widely-targeted metabolome and DIA proteome analysis. Food Chem. 2020, 310, 125941. [Google Scholar] [CrossRef]
  29. Fan, G.; Liu, P.; Chang, X.; Yin, H.; Cheng, L.; Teng, C.; Gong, Y.; Li, X. Isolation and Identification of a High-Yield Ethyl Caproate-Producing Yeast From Daqu and Optimization of Its Fermentation. Front. Microbiol. 2021, 12, 663744. [Google Scholar] [CrossRef]
  30. Ran, Y.; Pengxiao, L.; Xu, C.; Jiangqi, X.; Huan, Y.; Guangsen, F.; Chao, T.; Xiuting, L.; Yi, G. Optimization of fermentation conditions for production of ethyl caproate in Baijiu using a selected isolate of Saccharomyces cerevisiae. Emir. J. Food Agric. 2022, 34, 59–69. [Google Scholar] [CrossRef]
  31. Xu, Y.; Wu, M.; Niu, J.; Lin, M.; Zhu, H.; Wang, K.; Li, X.; Sun, B. Characteristics and Correlation of the Microbial Communities and Flavor Compounds during the First Three Rounds of Fermentation in Chinese Sauce-Flavor Baijiu. Foods 2023, 12, 207. [Google Scholar] [CrossRef] [PubMed]
  32. Han, P.; Luo, L.; Han, Y.; Song, L.; Zhen, P.; Han, D.; Wei, Y.; Zhou, X.; Wen, Z.; Qiu, J.; et al. Microbial Community Affects Daqu Quality and the Production of Ethanol and Flavor Compounds in Baijiu Fermentation. Foods 2023, 12, 2936. [Google Scholar] [CrossRef]
  33. Li, H.; Liu, S.; Liu, Y.; Hui, M.; Pan, C. Functional microorganisms in Baijiu Daqu: Research progress and fortification strategy for application. Front. Microbiol. 2023, 14, 1119675. [Google Scholar] [CrossRef] [PubMed]
  34. Liu, C.; Gong, X.; Zhao, G.; Soe Htet, M.N.; Jia, Z.; Yan, Z.; Liu, L.; Zhai, Q.; Huang, T.; Deng, X.; et al. Liquor Flavour Is Associated with the Physicochemical Property and Microbial Diversity of Fermented Grains in Waxy and Non-waxy Sorghum (Sorghum bicolor) during Fermentation. Front. Microbiol. 2021, 12, 618458. [Google Scholar] [CrossRef] [PubMed]
  35. Liang, Y.; Xiao, X.; Nuccio, E.E.; Yuan, M.; Zhang, N.; Xue, K.; Cohan, F.M.; Zhou, J.; Sun, B. Differentiation strategies of soil rare and abundant microbial taxa in response to changing climatic regimes. Environ. Microbiol. 2020, 22, 1327–1340. [Google Scholar] [CrossRef] [PubMed]
  36. Xu, M.; Huang, Q.; Xiong, Z.; Liao, H.; Lv, Z.; Chen, W.; Luo, X.; Hao, X.; Hug, L.A.; Hug, L.A. Distinct Responses of Rare and Abundant Microbial Taxa to In Situ Chemical Stabilization of Cadmium-Contaminated Soil. mSystems 2021, 6, e01040-21. [Google Scholar] [CrossRef] [PubMed]
  37. Zhao, L.; Wang, Y.; Xing, J.; Gu, S.; Wu, Y.; Li, X.; Ma, J.; Mao, J. Distinct succession of abundant and rare fungi in fermented grains during Chinese strong-flavor liquor fermentation. LWT 2022, 163, 113502. [Google Scholar] [CrossRef]
  38. Shang, C.; Li, Y.; Zhang, J.; Gan, S. Analysis of Bacterial Diversity in Different Types of Daqu and Fermented Grains from Danquan Distillery. Front. Microbiol. 2022, 13, 883122. [Google Scholar] [CrossRef]
  39. Liu, Y.; Li, H.; Dong, S.; Zhou, Z.; Zhang, Z.; Huang, R.; Han, S.; Hou, J.; Pan, C. Dynamic changes and correlations of microbial communities, physicochemical properties, and volatile metabolites during Daqu fermentation of Taorong-type Baijiu. LWT 2023, 173, 114290. [Google Scholar] [CrossRef]
  40. Kamli, M.R.; Alzahrani, N.A.Y.; Hajrah, N.H.; Sabir, J.S.M.; Malik, A. Genome-Driven Discovery of Enzymes with Industrial Implications from the Genus Aneurinibacillus. Microorganisms 2021, 9, 499. [Google Scholar] [CrossRef]
  41. Liu, W.; Chai, L.; Wang, H.; Lu, Z.; Zhang, X.; Xiao, C.; Wang, S.; Shen, C.; Shi, J.; Xu, Z. Bacteria and filamentous fungi running a relay race in Daqu fermentation enable macromolecular degradation and flavor substance formation. Int. J. Food Microbiol. 2023, 390, 110118. [Google Scholar] [CrossRef] [PubMed]
  42. Cai, W.; Xue, Y.A.; Wang, Y.; Wang, W.; Shu, N.; Zhao, H.; Tang, F.; Yang, X.; Guo, Z.; Shan, C. The Fungal Communities and Flavor Profiles in Different Types of High-Temperature Daqu as Revealed by High-Throughput Sequencing and Electronic Senses. Front. Microbiol. 2021, 12, 784651. [Google Scholar] [CrossRef] [PubMed]
  43. Xia, Y.; Zhu, M.; Du, Y.; Wu, Z.; Gomi, K.; Zhang, W. Metaproteomics reveals protein composition of multiple saccharifying enzymes in nongxiangxing daqu and jiangxiangxing daqu under different thermophilic temperatures. Int. J. Food Sci. Technol. 2022, 57, 5102–5113. [Google Scholar] [CrossRef]
  44. Li, X.; Tan, G.; Chen, P.; Cai, K.; Dong, W.; Peng, N.; Zhao, S. Uncovering acid resistance genes in lactic acid bacteria and impact of non-viable bacteria on bacterial community during Chinese strong-flavor baijiu fermentation. Food Res. Int. 2023, 167, 112741. [Google Scholar] [CrossRef] [PubMed]
  45. Hu, X.; Wang, K.; Chen, M.; Fan, J.; Han, S.; Hou, J.; Chi, L.; Liu, Y.; Wei, T. Profiling the composition and metabolic activities of microbial community in fermented grain for the Chinese strong-flavor Baijiu production by using the metatranscriptome, high-throughput 16S rRNA and ITS gene sequencings. Food Res. Int. 2020, 138, 109765. [Google Scholar] [CrossRef] [PubMed]
  46. Iacono, R.; De Lise, F.; Moracci, M.; Cobucci-Ponzano, B.; Strazzulli, A. Glycoside hydrolases from (hyper)thermophilic archaea: Structure, function, and applications. Essays Biochem. 2023, 67, 731–751. [Google Scholar] [PubMed]
  47. Zabotina, O.A.; Zhang, N.; Weerts, R. Polysaccharide Biosynthesis: Glycosyltransferases and Their Complexes. Front. Plant Sci. 2021, 12, 625307. [Google Scholar] [CrossRef]
  48. He, M.; Jin, Y.; Zhou, R.; Zhao, D.; Zheng, J.; Wu, C. Dynamic succession of microbial community in Nongxiangxing daqu and microbial roles involved in flavor formation. Food Res. Int. 2022, 159, 111559. [Google Scholar] [CrossRef]
Figure 1. (A) Difference in the content of volatile components of FG; (B) PLS-DA of volatile components of FG60d; (C) five distinct volatiles were identified as crucial by VIP > 1; (D) displaying the differences of these five volatile compounds through heatmap.
Foods 13 01597 g001
Figure 2. PCA analysis of microbial communities. (A) Fungi; (B) bacteria.
Foods 13 01597 g002
Figure 3. Abundant and rare microbial composition of Daqu and PM cultures. (A) Abundant bacteria; (B) Rare bacteria; (C) Abundant fungi; (D) Rare fungi.
Foods 13 01597 g003
Figure 4. Abundant and rare microbial composition of FG0d. (A) Abundant bacteria; (B) Rare bacteria; (C) Abundant fungi; (D) Rare fungi.
Foods 13 01597 g004
Figure 5. Abundant and rare microbial composition of FG60d. (A) Abundant bacteria; (B) Rare bacteria; (C) Abundant fungi; (D) Rare fungi.
Foods 13 01597 g005
Figure 6. Differences in the microbial community of FG60d at the species level. (A) Based on the Venn diagram, shared and unique species in FG60d were demonstrated. The degree of differences between microbial communities in FG60d was analyzed through (B) PCA and (C) hierarchical cluster analysis.
Foods 13 01597 g006
Figure 7. Distribution of KEGG and CAZy genes in different categories of FG60d. (A) KEGG annotation; (B) CAZy annotation.
Foods 13 01597 g007
Figure 8. Functional diversity of abundant and Rare bacterial and fungal subcommunities and their contribution to major metabolic pathways of FG60d based on PICRUSt2 prediction.
Foods 13 01597 g008
Table 1. Details and abbreviation of the samples.
SampleThe Date of SamplesThe Ratios of Daqu or PM Cultures (w/w)
Daqu (DQ)MCFC
DZ-FG0dThe 0 days of DZ-FG15%--
MC-FG0dThe 0 days of MC-FG15%1%-
FC-FG0dThe 0 days of FC-FG15%-1%
DZ-FG30dThe 30th day of DZ-FG15%--
MC-FG30dThe 30th day of MC-FG15%1%-
FC-FG30dThe 30th day of FC-FG15%-1%
DZ-FG60dThe 60th day of DZ-FG15%--
MC-FG60dThe 60th day of MC-FG15%1%-
FC-FG60dThe 60th day of FC-FG15%-1%
“-“ indicates that it was not added.
Table 2. Differences in physicochemical properties of FG.
SampleMoisture (%)Starch (g/100 g)Reducing Sugar (g/100 g)Acidity (mmol/10 g)Alcohol (%)
DZ-FG0d57.96 ± 0.2623.45 ± 0.24 a1.55 ± 0.06 a0.85 ± 0.00 bND
MC-FG0d57.53 ± 0.3222.66 ± 0.22 b1.33 ± 0.03 b0.92 ± 0.04 abND
FC-FG0d57.33 ± 0.0023.90 ± 0.25 a1.39 ± 0.09 b0.95 ± 0.03 aND
DZ-FG30d64.61 ± 0.1413.97 ± 0.45 b1.15 ± 0.02 c1.00 ± 0.01 b8.43 ± 0.45 a
MC-FG30d63.55 ± 0.2315.27 ± 0.05 a1.37 ± 0.06 a1.09 ± 0.02 a7.20 ± 0.50 b
FC-FG30d64.22 ± 0.5715.86 ± 0.16 a1.25 ± 0.00 b1.00 ± 0.01 b7.70 ± 0.50 ab
DZ-FG60d65.91 ± 0.5313.16 ± 0.50 a1.18 ± 0.03 b1.88 ± 0.01 b7.00 ± 0.20
MC-FG60d64.52 ± 0.9014.33 ± 0.26 a0.84 ± 0.00 c2.11 ± 0.03 a6.47 ± 0.15
FC-FG60d63.92 ± 0.3411.60 ± 1.14 b1.60 ± 0.01 a1.83 ± 0.01 b6.70 ± 0.50
Data are presented as means ± standard deviations (n = 3). “ND” indicates that it was not detected in the sample. Values with different letters within a row are significantly different statistically (p < 0.05).
Table 3. α-diversity index difference.
SampleBacteriaFungi
Chao1Observed SpeciesShannonSimpsonChao1Observed SpeciesShannonSimpson
DQ234.06227.604.080.8469.4968.501.850.60
MC216.87215.003.580.7795.7694.402.440.66
FC141.16141.003.590.8744.8044.302.380.75
DZ-FG0d131.23130.504.600.9263.1762.102.240.64
MC-FG0d143.97142.804.780.9365.5163.201.840.50
FC-FG0d181.07161.303.410.7471.6769.602.440.66
DZ-FG60d52.3946.201.440.5549.1445.902.500.74
MC-FG60d40.2439.801.840.6254.2352.601.810.46
FC-FG60d47.0745.701.570.5137.0337.002.130.68
Table 4. Distribution of abundant and rare taxa.
ClassificationAATCATCRATARTCRTMTAbundant TaxaRare Taxa
BacteriaDaqu and PM culturesASV proportion0.84%0.84%9.24%18.49%68.07%2.52%10.92%86.55%
Relative abundance41.31%1.04%52.04%0.05%5.11%0.44%94.39%5.17%
FG0dASV proportion7.29%3.13%1.04%23.96%43.75%20.83%11.46%67.71%
Relative abundance91.03%2.25%0.96%0.03%1.35%4.38%94.24%1.38%
FG60dASV proportion2.22%0.00%4.44%60.00%31.11%2.22%6.67%91.11%
Relative abundance97.88%0.00%1.43%0.06%0.30%0.34%99.31%0.36%
FungiDaqu and PM culturesASV proportion3.70%5.56%5.56%33.33%44.44%7.41%14.81%77.78%
Relative abundance76.29%16.78%5.30%0.04%1.10%0.49%98.37%1.14%
FG0dASV proportion8.70%6.52%0.00%52.17%23.91%8.70%15.22%76.09%
Relative abundance96.92%2.27%0.00%0.05%0.27%0.49%99.19%0.32%
FG60dASV proportion2.63%18.42%7.89%50.00%21.05%0.00%28.95%71.05%
Relative abundance37.83%56.52%5.37%0.04%0.24%0.00%99.72%0.28%
Table 5. Metagenomics-based relative abundance at the genus and species level.
Top Ten Genera Based on Relative AbundanceTop Ten Species Based on Relative Abundance
GenusDZ-FG60dMC-FG60dFC-FG60dSpeciesDZ-FG60dMC-FG60dFC-FG60d
Lactobacillus97.85%33.93%97.74%Lactobacillus acetotolerans96.20%33.72%96.08%
Acetilactobacillus1.17%65.54%1.06%Acetilactobacillus jinshanensis1.18%65.54%1.06%
Pichia0.24%0.05%0.32%Lactobacillus helveticus0.74%0.04%0.74%
Saccharomyces0.12%0.01%0.22%Lactobacillus amylolyticus0.42%0.02%0.41%
Lentilactobacillus0.13%0.02%0.13%Lactobacillus crispatus0.32%0.12%0.31%
Acetobacter0.03%0.17%0.03%Pichia kudriavzevii0.24%0.05%0.32%
Ligilactobacillus0.11%0.02%0.11%Saccharomyces cerevisiae0.12%0.01%0.22%
Kroppenstedtia0.08%0.04%0.08%Ligilactobacillus acidipiscis0.11%0.02%0.11%
Loigolactobacillus0.05%0.03%0.05%Lentilactobacillus buchneri0.11%0.01%0.11%
Sphingomonas0.04%0.02%0.05%Lactobacillus amylovorus0.09%0.01%0.12%
Disclaimer/Publisher’s Note: The statements, opinions and data contained in all publications are solely those of the individual author(s) and contributor(s) and not of MDPI and/or the editor(s). MDPI and/or the editor(s) disclaim responsibility for any injury to people or property resulting from any ideas, methods, instructions or products referred to in the content.

