Article

Functional Biscuits, a Healthy Addition to Your Coffee Break—Evaluating Consumer Acceptability and Willingness to Pay

1
Department for Innovation in Biological, Agro-Food and Forest Systems (DIBAF), University of Tuscia, Via San Camillo del Lellis snc, 01100 Viterbo, Italy
2
Department of Economics, Engineering, Society and Business Organization (DEIM), University of Tuscia, Via del Paradiso 47, 01100 Viterbo, Italy
3
Department of Agriculture and Forest Sciences (DAFNE), Via San Camillo de Lellis, 01100 Viterbo, Italy
*
Author to whom correspondence should be addressed.
Foods 2024, 13(11), 1731; https://doi.org/10.3390/foods13111731
Submission received: 13 May 2024 / Revised: 24 May 2024 / Accepted: 29 May 2024 / Published: 31 May 2024

Abstract

:
An increasing number of individuals are eating out due to work and study commitments. This trend directly influences people’s food choices, especially those who frequently rely on snacks and pre-packaged foods. Consuming these foods can lead to long-term health consequences. Adding functional foods to vending machines could lead to healthier choices. Our aim is to evaluate the acceptability and willingness to pay (WTP) of workers and students for a snack pack of novel functional biscuits (FBs) made with high amylose contents. We found that the experimental flour used is effective in preventing various non-communicable diseases; two phases of analysis were carried out on 209 participants. The participants blindly tested the products and only after the sensory evaluation were they informed about the biscuits’ health contents. Firstly, the blind investigation highlighted the acceptability of the FBs compared to the conventional biscuits. Secondly, the finite mixture model on WTP revealed that some consumers are interested in the health benefits associated with high-amylose test blends and others are focused on hedonistic taste. The design of a communication strategy and industry approach should aim to assist consumers in comprehending the health benefits and sensory aspects of novel functional foods available on the market.

Graphical Abstract

1. Introduction

Eating patterns are changing significantly in the modern era [1]. An increasing number of people are regularly eating out because of work and study commitments, which has a direct impact on their food choices [2,3,4]. For convenience and efficiency, snacks and pre-packaged foods are often the choice for a short lunch or a break [5,6,7]. Typically, the snacks available at vending machines lack nutritional value and are rich in salt or sugar and low in essential nutrients. Consuming these foods can lead to an increased intake of calories, fats, and sugars, potentially resulting in adverse health effects over time [8,9,10]. Obesity, diabetes, cardiovascular issues, and a decrease in energy and concentration are linked to poor eating habits and sedentary lifestyles [11,12,13,14,15]. This trend has generated greater awareness about the importance of proper nutrition in maintaining good health mainly because of educational campaigns promoted by governments and associations, particularly in high-income countries [16].
Functional foods (FFs) are becoming more popular among consumers who are concerned about their physical well-being and looking for healthy foods on the market [17,18]. Some of the ingredients in these products have been demonstrated to improve health or provide additional benefits beyond those offered by conventional foods [19,20]. Due to the growing demand, the food industry is investing in research and development to create functional food products that have positive physiological benefits while maintaining the same shape and taste as common food products [16,21]. There is evidence that sensory aspects can be barriers to the acceptance of FF by consumers [22,23,24]. The consumer interest in these products can also be influenced by the individual characteristics of consumers including gender, age, and eating habits [25,26]. Several studies explored the FF acceptance also considering conveyed informative content [25,27,28,29]. Functional content is an intangible attribute for the consumer that cannot be immediately verified [30,31]. Therefore, market designers employ a variety of methods to convey information. By separating Nutrition Claims (NCs) from Health Claims (HCs) on the product label, it becomes simpler to identify benefits related to the message that is being communicated. HC and NC-labelled foods are perceived as healthier by consumers, and they are willing to pay more for them [22,32,33,34]. Claims that describe potential health benefits, such as reducing the risk of chronic or degenerative diseases, can help increase the willingness to pay (WTP) for FF [25,29,35].
Based on these premises, this study examines a functional snack made with a new experimental flour that is meant to prevent non-communicable diseases (NCDs). The goal of this study is to expand the literature on the subject, specifically targeting workers’ and students’ potential interest in this type of FF that could assist people who eat out in adopting healthier eating habits while on breaks without affecting taste. The focus of our study is on biscuits with a high content of amylose wheat flour, packaged as a snack of four biscuits, fitting in vending machines located in study rooms or workplaces.
Amylose content is associated with resistant starch content in foods, which plays a role similar to dietary fibre in preventing several NCDs, such as type 2 diabetes, obesity, colon cancer, and cardiovascular disorders [36]. Starch is the main component of wheat endosperm (80% dry matter) and is composed of approximately 20–25% amylose and 75–80% amylopectin. Through the manipulation of a starch biosynthetic gene, a new bread wheat line (Triticum aestivum), Cadenza SBEIIa*, with a high amylose content (contents greater than 70%) has been developed [37]. The derived flour and foods have showed a positive impact on human health by acting on NCD prevention [38,39,40]. Scientific evidence suggests that high-amylose biscuits offer better glycaemic control compared to the control counterparts [39,41]. Dell’Unto et al. [42] conducted an online survey that revealed that consumers present a potential interest in high-amylose bakery products, expressed in premium price recognition.
Starting from this insight, the goal of the present research is twofold:
(1) testing the acceptability in different information contexts through the development of sensory evaluations and (2) estimate the potential WTP, also considering the HC conveyed on the snack pack of high-amylose biscuits. Moreover, a finite mixture model was applied to investigate the potential different types of consumers in our sample to provide interesting insights for industrial and marketing improvement.

2. Materials and Methods

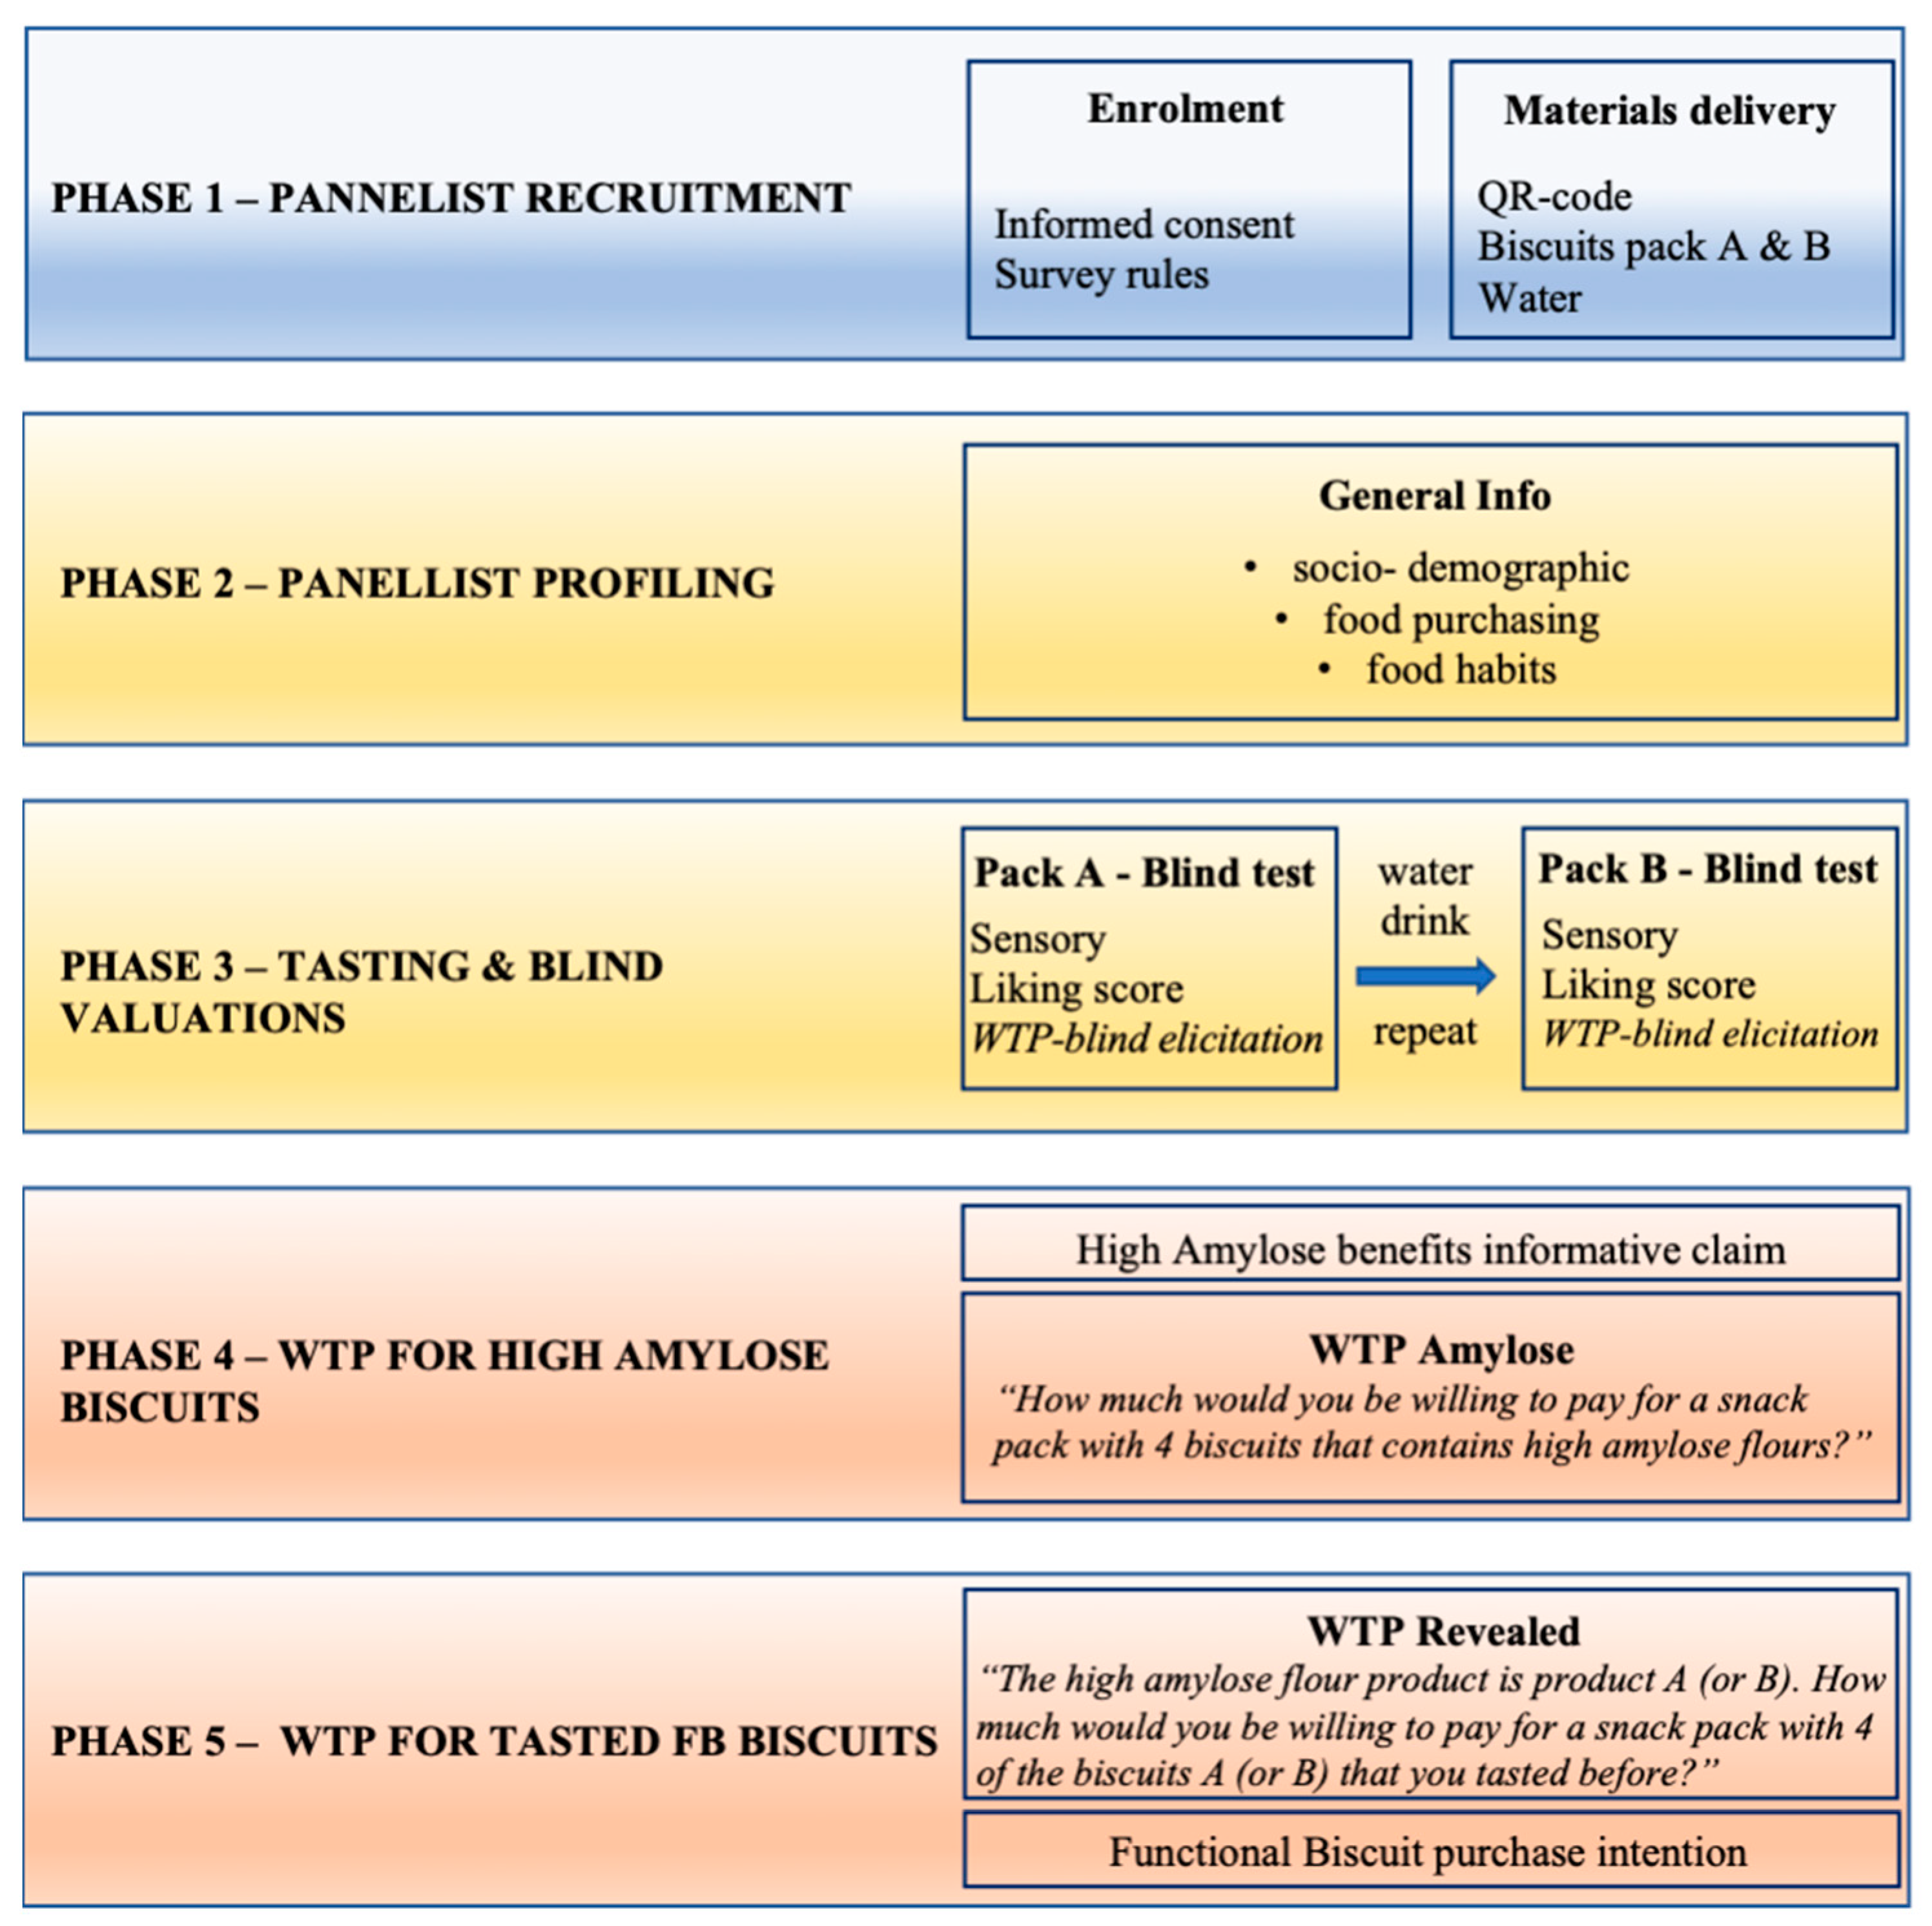
2.1. Experimental Design

Tests were performed to examine consumers’ acceptability and WTP for baked goods, such as biscuits, using flour mixtures with high amylose contents. According to the approval waived by the Ethics Committee of University of Tuscia, the participants blindly tested the products and only after the taste evaluation were they informed of the health contents of the biscuits. Informed consent was obtained from all subjects involved in the study.
Sensory studies can be utilized to collect information about market acceptance of substituting ingredients or processing new food products [43,44,45], while tasting tests can be used to investigate the perception of different sensory attributes [46,47,48]. In the literature, the RATA (Rate-All-That-Apply) methodology has been recognized as a valid technique for gathering more information and increasing the discriminative capacity relating to the sensory attributes of products [49]. It represents a variant of the CATA (Check-All-That-Apply) technique [50], which allows us to link the attribute evaluations to an intensity scale. RATA can be utilized to measure the presence, absence, and intensity scale of food attributes that are not yet on the market [47,51,52,53].
In the present research, the following three categories of items related to bakery products were identified and tested in accordance with Delicato et al.’s [54] approach: texture, taste, and appearance. Based on the results from the pilot test on 10 respondents [39], the analysis involved 14 attributes that were divided into relevant categories.

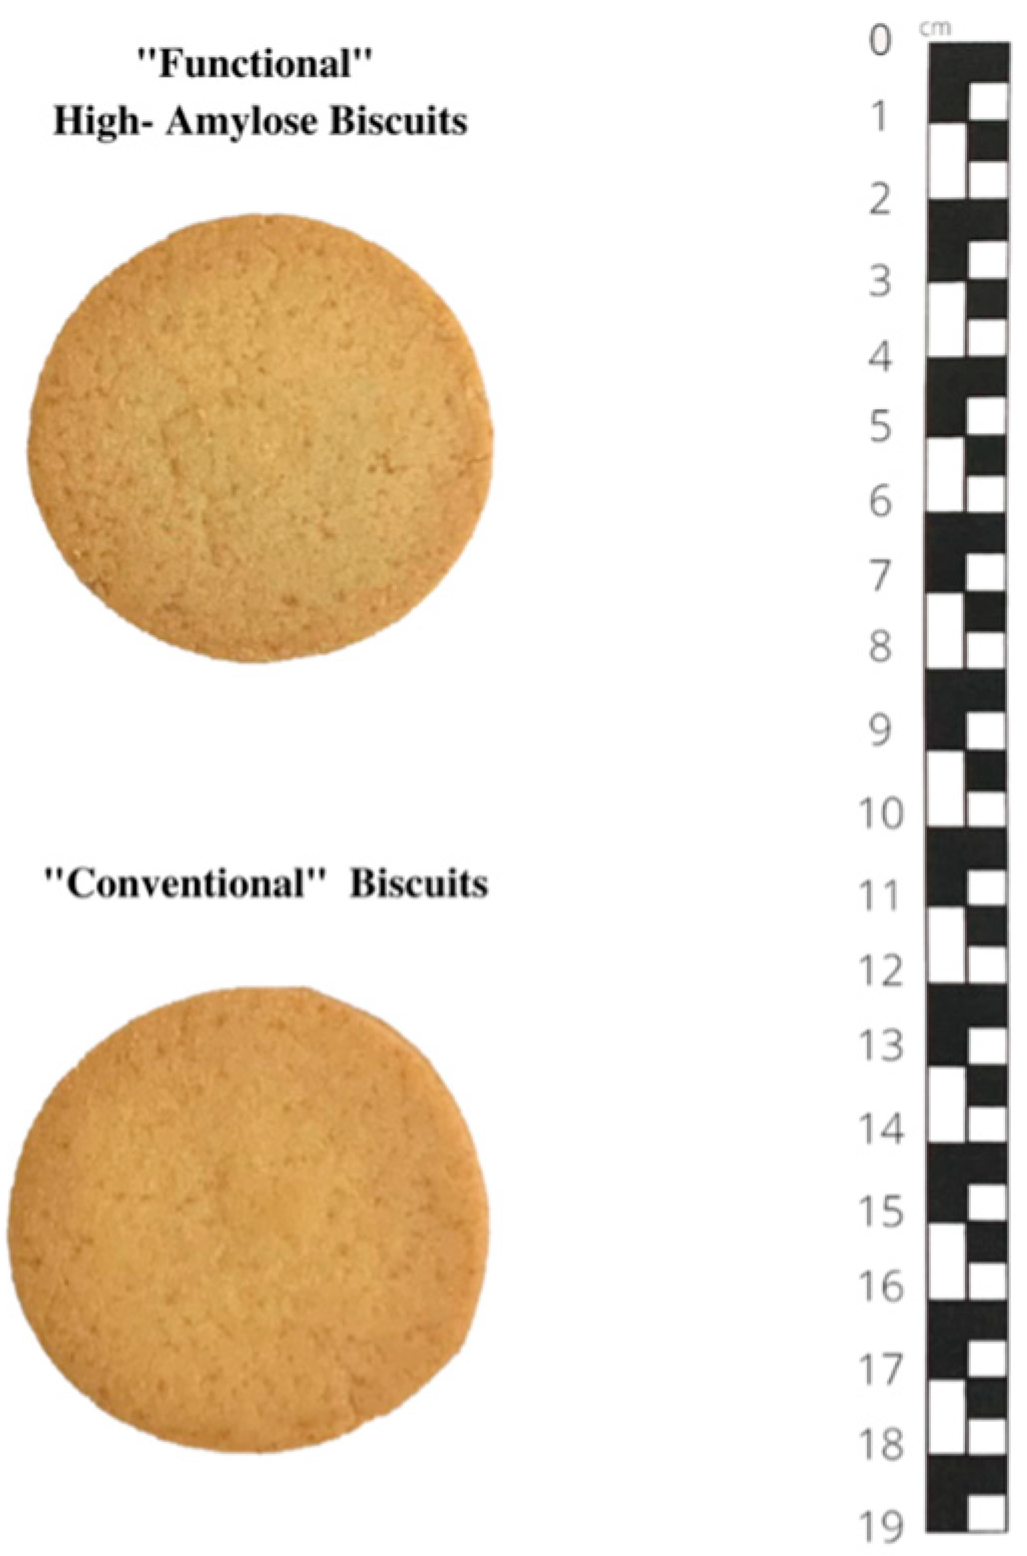
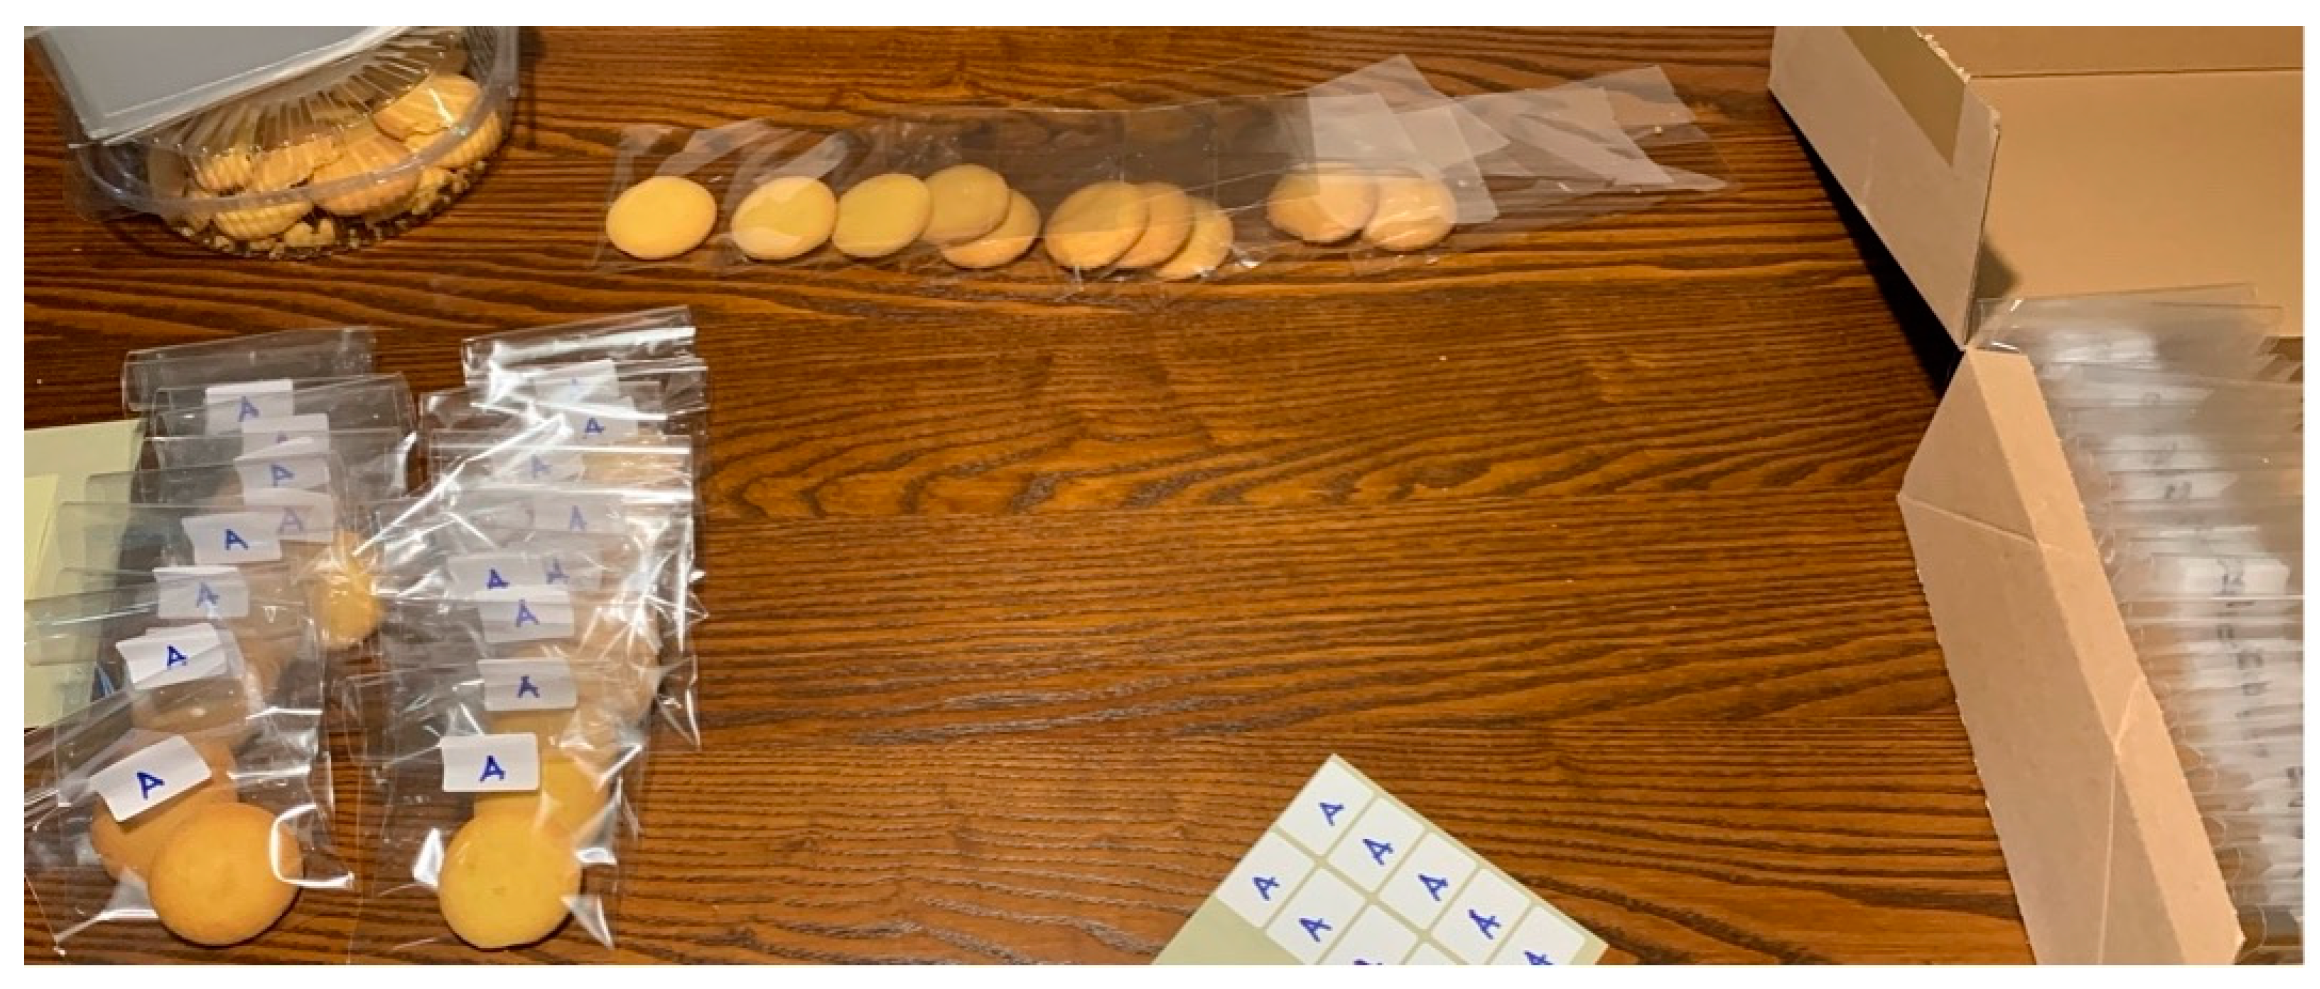
2.2. Raw Material, and Product Presentation
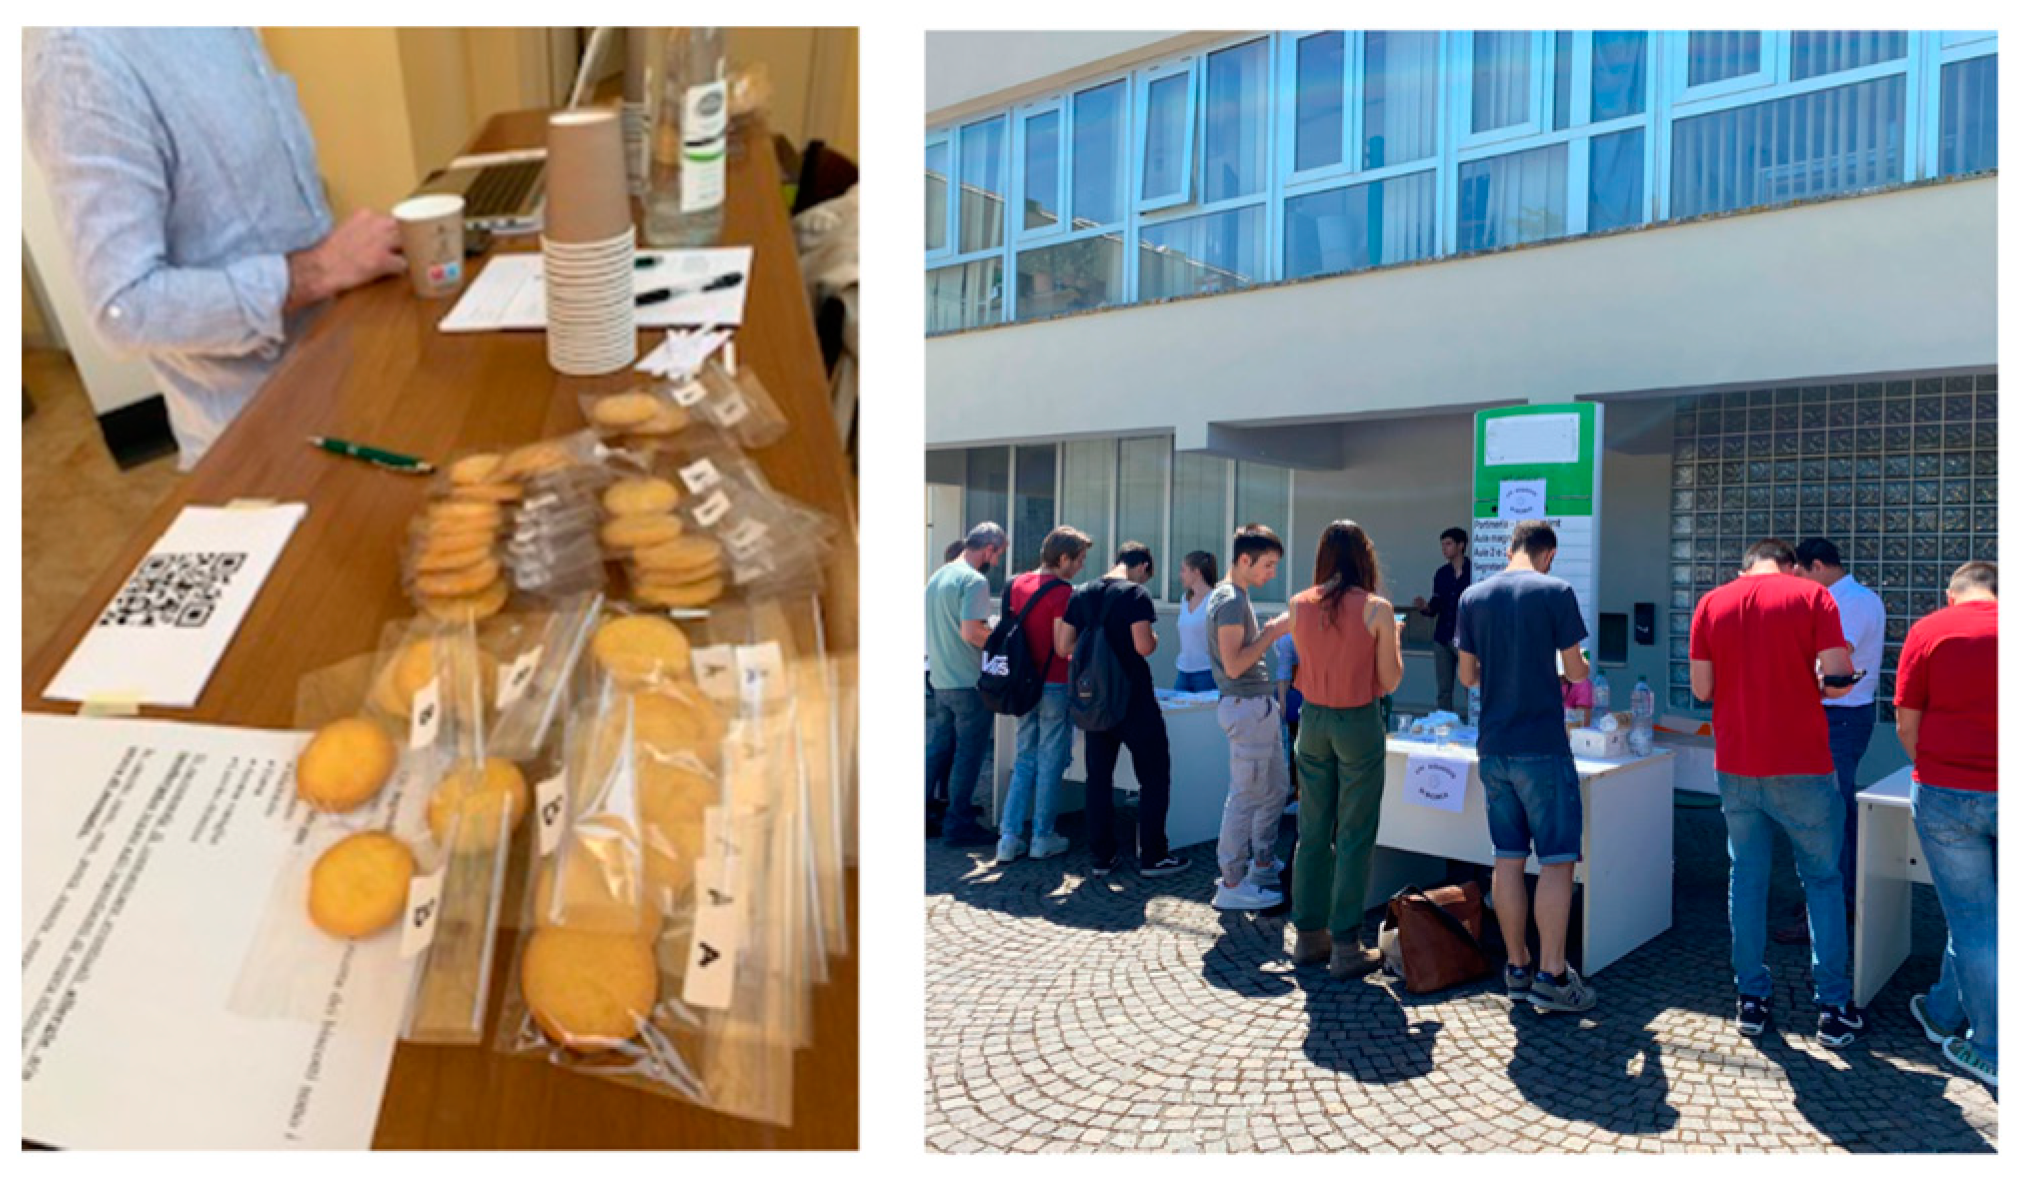
Two biscuits were prepared using distinct flour blends to test acceptability and sensory evaluation for the taste test. Functional biscuits (FBs) and conventional biscuits (CBs) had the same shape, size, and colour (Figure 1).
The experimental and conventional flours were used to make the biscuits, one enriched with amylose and resistant starch and the other with 65% commercial type 1 flour and 35% type 00 flour, to achieve the same structural chemical composition as the experimental flour. The high amylose content flour (75% vs. 30% of the conventional flour) was the novel ingredient used to make the sample test of the functional biscuits. The products were prepared in a professional bakery according to the procedures and equipment used by Di Rosa et al. [39]. The recipes differ only in the flour typology (Table 1).
Each participant received a tasting sample with one biscuit per type (Figure 2). The food packets were identical and transparent with the same amount of food (g) and only two letters (A and B) were marked to identify the taste order. Furthermore, the participants received a glass of water to avoid any influence on the tastings. The purpose of this was to clean the mouth between two tastes.

2.3. Participants

The 209 participants were recruited among students, university staff, professors and researchers and participants in an event held by the university between May and June 2022. The two sessions, on two different days, were carried out in front of two buildings of the University of Tuscia between 9.30 a.m. and 12.30 a.m. The research was carried out outdoors in compliance with COVID-19 restrictions. The study involved people of an age range between 18 and 66 years old. The focus of this study was on individuals eating away from home for work or study purposes, including both main meals and breaks. These individuals might not be attentive to the health implications of the food they consume outside of their home [6,8].
Participants with food allergies/intolerances (e.g., lactose, eggs, and gluten) were excluded from the study.

2.4. Experimental Procedures

The experimental procedure included five phases (see Figure 3), which are described in detail below:
To welcome participants and collect the necessary materials for the survey, two identical workstations were set up with the same number and arrangement of products (Figure 4). To avoid bias, the participants were not informed about this difference.
The survey began after participants filled out the informed consent form following the Declaration of Helsinki guidelines and received a unique code. This code was only used to prevent the same person from answering the questionnaire multiple times, not to identify the interviewees.
By scanning the QR code on the workstation, the questionnaire was accessed using a personal smartphone.

Questionnaire

Google Forms was used to create the survey, which consisted of two questionnaires, A and B. The two biscuits were tasted in opposite order for each subgroup. In questionnaire A, the ‘functional’ biscuit was the first one to be tasted (A), while in group B, the biscuit with high amylose was tasted second (marked with letter B). All participants rated two biscuits with an ever-increasing degree of information. The analyses involved both sensorial tasting and WTP elicitation through open/closed questions at the different information levels provided.
The questionnaire included 6 sections as shown in Table 2 below:
The 1–9 Likert scale was used in Section 2 to measure the attributes that can impact food purchasing habits (1—not at all; 9—very often). Participants’ familiarity and consumption of snacks were measured by examining the frequency of purchases and average price of snacks purchased from vending machines (Section 3). The two biscuits were blindly tested by the respondents in Section 4. The sensory evaluation is based on the 1–9 Likert scale (1—not at all; 9—very often) according to RATA methodology.
The WTP for a snack pack of 4 biscuits was measured using an open question in the following different informational situations:
  • WTP BLIND: the blind test involved the participants estimating their WTP for each of the two biscuits tasted without any information about the product. (Phase 3—Section 4): “How much would you be willing to pay for a snack pack with 4 of these biscuits you just tasted?”
  • WTP AMYLOSE: respondents declared their WTP after the health claim informed them on the properties of high amylose but did not mention any relationship with the tasted biscuits. (Phase 4—Section 5): “How much would you be willing to pay for a snack pack with 4 biscuits that contains high amylose flour?”
  • WTP REVEALED (WTP-R): after identifying which biscuit contained amylose, the WTP of the respondent was identified. (Phase 5—Section 6): “The high amylose flour biscuit is product X. How much would you be WTP for a snack pack with 4 of the biscuits X that you tasted before?”

2.5. Data Analysis

2.5.1. Sample Acceptability of Functional Biscuits

Blind test data were utilized to evaluate the acceptability of functional biscuits by measuring sensory attributes, liking level, and WTP. Paired t-tests were used to compare these biscuits to the conventional biscuits [55,56,57].

2.5.2. Heterogeneity Analysis

Functional product acceptance and WTP can be influenced by variables such as purchasing habits and individual characteristics [17,27,28,32,58,59].
As suggested by Teuber et al. [60], our research considers the frequency of purchasing a snack as a proxy of familiarity with the investigated product. In this analysis, four levels of purchase frequency of snack packs of biscuits were considered (1: very rarely; 4: very often).
As our research is on functional foods, the variables also included purchasing habits such as caloric content and healthiness, developed using a Likert scale (1: not at all; 9: very often). For the variables examined, the presence of multicollinearity was excluded. The correlation matrix showed that none of the selected items had a correlation index higher than 0.65.
The finite mixture model (FMM) was selected to examine the potential influence of these factors on consumer preferences and WTP. Marketing literature frequently employs mixture models to target consumers [61,62,63,64,65].
The FMM approach can simultaneously calculate the clustering process and OLS regression estimation. Using FMM, it is possible to divide the sample into different consumers groups by investigating the factors that affect WTP for functional biscuits. In the analyses, socio-demographic characteristics, familiarity and average purchase price were used as grouping factors. Furthermore, among the socio-demographics, the student dummy (1 = students, 0 = otherwise) was considered a work category. The WTP REVEALED of functional biscuits was analyzed by considering purchasing habits, FB liking level and WTPInfoAMYLOSE (WTPiA).
To assess the interest in amylose HC, WTP amylose was used, but by eliminating the potential anchoring effect that the WTP BLIND could generate. The WTPinfoAMYLOSE (WTPiA) variable was calculated as follows:
WTPinfoAMYLOSEi = WTPi amylose − ΔWTPi blind
where ΔWTPi blind was calculated between the WTP BLIND for the CB and FB, considering that the t-tests did not reveal significant differences.
The FMM estimated a regression for each of the sample data clusters. The expectation–maximization algorithm, defined by Dempster et al. [66], estimates the coefficients of each class without prior information on clustering. The function of wtpi is the set of personal factors x1 of the i-th individual characterized by x2 socio-demographic characteristics in a sample of size n. The objective function of maximum likelihood relating wtpi and x1 is as follows:
Πnπijf(wtpi|xi1, zi = 1)
where πij is the probability of observation i = 1,…, n that belongs to a given group j = 1, …, K, where K represents the number of groups that are endogenously determined in the model, and zi is a non-observable latent variable that determines if an observation is involved in one group or another. The likelihood combines the conditional likelihood of each latent class weighted by the associated latent-class probability. For each observation, the probability of inclusion in group j, πij, is a function of zi, which assumes values 0 or 1 to define the exclusion or inclusion of the ith observation in the specific jth group as follows:
πij = π (zi = 1) = exp(zi)/Ʃj = 1,K exp (zi)
Equation (3) yields the expectation step of the algorithm.
Given that it is unknown which group a certain observation comes from, the observed sample is incomplete since zi is a latent and non-observable variable. zi can be approximated by the set of variables x2i. A multinomial logit model computes πij as follows:
πij = h(xij) = exp (g(xi2))/Ʃj = 1,K exp (g(xj2))
where g(xi2) is the function relating the probability of being in the j class to the xi1 characteristics.
The linear model explains the dependent variable wtpi as a function of the factors in xi1. The expectation–maximization algorithm allows the contemporaneous estimation of the probability to belong to a group πij together with the regression coefficients βj in each of the K groups, breaking the objective function iterating between the estimated expected probability of belonging to a specific group, E(πij) in (4), and the estimates of the regression coefficients for each group (βj) in (2). STATA15.1 software was utilized for the estimation of all models (StataCorp LP, College Station, TX, USA).

3. Results

3.1. Sample Description

Table 3 presents the main socio-economic characteristics of the interviewees. The sample is quite young because more than 70% are under 35 years old; the average age is about 30 years old. Gender is evenly distributed in the sample, with 44.50% being women. The percentage of respondents with a household size of four people is 44%, while only 9% are made up of a single person. Additionally, approximately 60% of the interviewees are students and around 30% are employees. More than 40% of respondents purchase snack packs from vending machines frequently (often/very often). Respondents prioritize healthiness (7.91), price (6.95), and certification presence (6.75) over brand (5.19) during their food purchasing processes (expressed in Likert scale 1–9).

3.2. Acceptability of Functional Biscuits (WTP, Liking, Preference and Sensory Profiling)

Unpaired two-sample t-tests (UTS-test) between subgroups A (first FB) and B (second FB) show no statistically significant differences in taste order. The two subgroups were treated as one sample of 209 individuals. Table 4 shows the paired t-test estimates for sensory attributes, liking level and WTP of functional biscuits compared to conventional ones. The sensory attributes are categorized into three macro-categories: appearance, texture, and taste. In only four attributes, the blind-condition test phase revealed significant differences. As indicated by the analyses of the attributes crumbly (p< 0.0153), chewy (p < 0.0001), crisp (p < 0.0021) and pasty (p < 0.0001), the CB presents a greater sensation of friability and crunchiness. These aspects appeared to have no impact on the general level of acceptability of FB. Paired t-tests performed on the liking level and WTP did not reveal any statistically significant differences. Without any product information, it can be concluded that the interviewees showed general acceptability of both functional and conventional biscuits.

3.3. Heterogeneity Analysis—Finite Mixture Model Regression Results

Akaike’s information criterion (AIC) and Bayesian information criterion (BIC) were used to determine the optimal number of classes, shown as K [61]. The best fit is identified in the subdivision of the sample into three classes (K = 3). The Bonferroni ANOVA test was carried out to confirm the statistical significance of the difference in the means of the estimated groups. The description of the groups is defined at the significance level of p < 0.05. Table 5 shows the FMM model estimation. It provides a description of both the factors that determine the probability of belonging to each group (π) and the role of various factors in the WTP REVEALED within each group. Table 6 shows the average value of the main variables for each group.
Table 5 shows the probability of group membership. The estimate characteristics are based on the reference group, which in our case is Group 1. The estimates reveal that individuals in Group 2 pay more for biscuit packs than the reference group. Group 3 consists predominantly of women who purchase snack packs less frequently but at a higher price than Group 1. The OLS estimates (Table 5) for the WTP REVEALED on FB provide interesting insights from the group analysis. According to our results, the FB liking level in all three groups has a positive impact on the WTP-R, which results in an increase in price from EUR 0.10 to EUR 0.20 per pack. The WTPinfoAMYLOSE (proxy for amylose HC interest) is a significant factor in influencing WTP-R.
Variables such as caloric contents, FB liking, and WTPiA play a role in affecting the WTP revealed in Group 1 (42% of the sample). According to Table 6, this group is the youngest (around 28 years old) and mostly consists of students (70%) and males (60%). It also has the lowest average WTP-R, around EUR 0.83 per pack. This group appears to prefer price and certification presence in their purchasing habits. Group 1 occasionally buys snacks in packs and spends a smaller budget than the other ones (EUR 0.99). The HC of amylose is valued on average at EUR 0.32 per pack, very close to the value declared by Group 2. We can define Group 1 as “The budget-conscious” group.
Table 5 indicates that purchasing habits, such as attention towards certified products and price, have a positive effect on the WTP-R of Group 2 (43% of the interviewees). Moreover, this group indicates the highest increase in WTP REVEALED, considering the WTPiA. In fact, by increasing the WTPinfoAMYLOSE to EUR 1, the WTP-R increases by almost the same amount (EUR 0.90). Group 2’s statistics (Table 6) show that men and women are evenly divided, with the highest average age (33 years old). About EUR 1.40 per pack is the value declared by the components for the WTP REVEALED. Hence, this group frequently buys snack packs with an average price of EUR 1.15 and, as a result, is known as “The snack-addicted” group.
In Group 3 (15% of the sample), various factors influence the WTP REVEALED (Table 5). Our observation regarding purchasing habits shows that paying attention to healthy food and the food brand decreases the WTP-R (EUR 0.50 and EUR 0.13 per pack, respectively), but paying attention to certification (EUR 0.23), calorie content (EUR 0.10) and price (EUR 0.13) increases the WTP-R. According to Table 6, this group, which is the most satisfied in terms of FB liking level, has the highest correlation between the approval of the functional biscuit and the WTP-R with an increase of EUR 0.20 per point. The group is composed of 60% women, with an average age of around 30 years. Despite paying EUR 1.35 per pack (the highest value), they rarely purchase snacks. This group has the highest WTP-R value (around EUR 2.40 per pack). Group 3 is identified as “The health-focused” group due to the emphasis on health. It can be deduced from the healthiness and calorie content values of food purchasing habits and from the WTPiA value, which is the highest (approximately EUR 0.50 per pack).

4. Discussion

This exploratory study is designed to gain insight into the acceptance of a functional snack made with high amylose content flour and how various factors influence the willingness to pay for them by various consumer groups.
The blind tasting test was fundamental to understand any sensory differences between the two biscuits, without potential biases that could be due to personal information or attitudes. Empirical evidence from the research supports the acceptability of novel functional biscuits among the sample of consumers. Respondents observed slight distinctions in sensory aspects between FB and CB during the blind tasting, including chewiness, crumbliness, crunchiness, and pastiness. Amylose and starch’s ability to absorb water is what drives these differences [40,67]. FB biscuits are significantly higher in amylose and starch compared to conventional ones. According to a study by Di Rosa et al. [39], biscuits with a high level of amylose contain more resistant starch, approximately 10 times more than the conventional biscuits. Despite the texture differences between the two biscuits, the tasting test revealed that it did not affect the overall liking level. As Delicato et al. [54] suggest, it is feasible to substitute certain levels of conventional ingredients with functional ones in baked goods, such as biscuits, without affecting consumer acceptance. Furthermore, the declaration of willingness to pay between the two biscuits without any additional information did not show significant differences. Once the health claim about the FB nutritional content was communicated, the differences were observed.
This leads us to the second topic of our analysis. According to the heterogeneity analysis results, the sensory acceptability of a biscuit is connected to the functional content’s healthiness, resulting in a greater WTP. The FMM allowed the sample to be divided into sub-groups of consumers. The product being investigated in this research is a biscuit, a daily food product that has a strong hedonic value for consumers. Using this approach, other studies have investigated the market segmentation of products that have a strong prevalence in the hedonic sphere, such as wine [62,63,64]. Bertail and Caillavet [61] instead use the FMM to analyze consumers of everyday food products such as fruits and vegetables.
Our findings suggest that health claims about high levels of amylose and taste-experienced content may have a positive impact on WTP. This is aligned with the outcomes obtained by Lawless et al. [68], who observed a higher WTP when the consumer tastes the product and then receives the health-related information. The satisfaction of the experiential content, expressed as the FB liking level, seems to be linked to a greater propensity to spend more, confirming the claims of the reference literature, including work by Verbeke (2006). This highlights the importance of including novel FF aspects connected to taste evaluation in WTP analysis. Furthermore, combining the experiential content with the amylose HC is considered positively as “new taste knowledge” of the health benefits provided by functional biscuits. Consumers become more inclined to spend more on a tasty but also healthy product after learning which biscuit is functional. This result is consistent with other studies stating that consumers recognize a greater WTP for products with clear indications related to sustainability aspects [69,70,71] or to HC for functional products [25,29,42,72,73]. Our sample’s purchasing habits may have a different impact on their WTP, according to the FMM results. “The budget-conscious” group is represented by young students who, during their purchasing habits, pay attention to price. In the case of purchases with a limited budget, their behaviour leads them to search for better quality, as indicated by the attention towards certifications, which are recognized as having an essential role in the transmission of information and validation of credence attributes [35,74,75,76,77]. Looking at WTPinfoAMYLOSE, our insights seem to demonstrate an evolution over time of young consumers who are more aware of the effects that a balanced diet can have on their health, contrary to what was analyzed, e.g., [26,78,79]. However, their WTP-R for functional biscuits remains the lowest among the different groups, and it is probably even lower than the market price for conventional snacks. “The snack-addicted” group represents the consumers most familiar with snacks and their WTP is also strongly influenced by HC. Similar results were provided, for example, by Teuber et al. [60], who suggested that consumers declared higher WTP when they are more confident with the product and health claims. We should consider that specific food categories, such as biscuits, are primarily considered hedonistic by a segment of consumers, as demonstrated by studies by Dean et al. [80], Papoutsi et al. [23], and VanKleef et al. [72]. Considering that snacks from vending machines during study/work breaks are commonly chosen for their hedonistic contents, these findings are worth highlighting [8,12,81]. Based on our results, this group of consumers may be attracted to this type of food that improves their health while still maintaining their expected hedonistic qualities. The majority of female participants in “The health-focused” group have validated that women are more attentive to the health aspects of HCs on food products. Previous studies, such as [32,73,82], have documented similar findings. Furthermore, research on snacks has demonstrated that women consume snacks less frequently than men and choose healthier alternatives, which supports the attitudes of this segment of the sample [2,83,84,85].
The study emphasizes that our sample’s consumers are interested in functional products that they commonly consume and have a hedonic value that should not be ignored. This supports the findings of Ares and Gámbaro [86] that FF development should be tailored to age groups and consumer preferences. The positive result on the acceptance of innovative blends with high amylose content is an encouraging result for the food industry to overcome the barriers of taste that have often hindered the choice of FFs by the market [23,28]. Functional food appreciation can grow by consumers thanks to the evolution of food technology and the improvement of recipes. To ensure that consumers perceive that the taste of a biscuit has been preserved, it is crucial to emphasize this aspect in dedicated communication plans. Moreover, the other groups in our survey seem to be interested in the health benefits associated with high-amylose experimental flour blends. The importance of indicating the correct health claim to consumers cannot be overstated or understated [87]. A communication strategy is essential to ensure clear and impactful messages on the essential information identified from our analysis. This strategy should also be designed to validate the credence attributes of this novel product, such as functional content, hedonistic content, and taste, which can only be confirmed after purchase.

5. Conclusions

This research highlights that functional high-amylose biscuits are accepted despite some sensory differences, but there are different consumer groups that are affected by different factors in their WTP. The analysis revealed the importance of maintaining the hedonic content and taste even in a functional snack and conveying the correct information. This study confirms that it is essential to accurately identify target consumers who can appreciate the product and are willing to pay more for it. Our sample’s interest in this novel product, even though it is not representative of the entire population due to non-probability sampling, is a significant insight. Vending machines could offer a healthier option, without compromising on the hedonistic pleasure, for those who prefer sweet snacks during study and/or work breaks. This snack can help prevent several non-communicable diseases that are often associated with their lifestyle such as type 2 diabetes, obesity, colon cancer, and cardiovascular disorders.
It is important to note some significant limitations in our paper. In addition to the non-representative nature of the sample, our analysis is intended as a preliminary analysis on high-amylose experimental flour. The objective of presenting the product for blind tasting and testing the potential HC to be delivered to consumers was achieved by using anonymous packaging. Future research must examine packaging with tested claims. Moreover, the analysis did not foresee any real market consequences that could therefore have led to bias of overestimation of the declared WTP values. The WTP estimates may be considered as plausible trends rather than precise numbers. Considering the limitations of this study, future empirical work could also expand the analysis on high-amylose products. It would be interesting to understand if this type of product is also accepted at different ages such as adolescence and pre-adolescence and in other categories of workers with a sedentary lifestyle. Furthermore, high-amylose flour is suitable for further testing of other bakery products. By analysing responses for various types of products and age groups of consumers, it is possible to assess and tailor products to different target consumers.

Author Contributions

Conceptualization, E.S.R. and E.B.; Data curation, E.S.R., R.P. and M.N.; Formal analysis, E.S.R.; Funding acquisition, E.B. and F.S.; Investigation, E.S.R., R.P., M.N. and S.P.; Methodology, E.S.R. and E.B.; Project administration, E.B. and F.S.; Resources, E.B. and F.S.; Supervision, E.B.; Validation, E.B. and C.C.; Visualization, E.S.R. and E.B.; Writing—original draft, E.S.R. and E.B.; Writing—review and editing, R.P. and C.C. All authors have read and agreed to the published version of the manuscript.

Funding

This work was supported by the project “Frumilosio” of Regione Lazio (Italy) “L.R. 13/2008-art. 7 Progetti di Gruppi di Ricerca” (Domanda n. 85-2017-14 994-L.R. 13/2008 Prot. 14 994).

Institutional Review Board Statement

The ethical review and approval are waived by Ethics Committee of University of Tuscia for this research due to the full compliance of the study with the principles stated in the Declaration of Helsinki and the avoidance of any form of risk or actual harm (physical or psychological) to participants.

Informed Consent Statement

Informed consent was obtained from all subjects involved in the study.

Data Availability Statement

The original contributions presented in the study are included in the article, further inquiries can be directed to the corresponding author.

Acknowledgments

The authors would like to thank Massimo Filzi and Vincenzo Campana (Campana srl) for cultivating the HA grains, Mirko Volpato and Grandi Molini Italiani SpA for providing HA flour, and Stefania Veronese (Midi srl) for producing the HA and control biscuits.

Conflicts of Interest

The authors declare no conflicts of interest.

List of Abbreviations

FFFunctional Foods
WTPWillingness To Pay
NCNutrition Claims
HCHealth Claims
NCDsNon-Communicable Diseases
FBFunctional Biscuit
CBConventional Biscuit
CATACheck-All-That-Apply Technique
RATARate-All-That-Apply
UTS-testUnpaired Two-Sample T-Tests
FMMFinite Mixture Model
OLSOrdinary Least Squares
WTP-RWTP REVEALED
WTPiAWTPinfoAMYLOSE

References

  1. Popkin, B.M.; Adair, L.S.; Ng, S.W. Global Nutrition Transition and the Pandemic of Obesity in Developing Countries. Nutr. Rev. 2012, 70, 3–21. [Google Scholar] [CrossRef] [PubMed]
  2. El Ansari, W.; Stock, C.; Mikolajczyk, R.T. Relationships between food consumption and living arrangements among university students in four European countries—A cross-sectional study. Nutr. J. 2012, 11, 28. [Google Scholar] [CrossRef] [PubMed]
  3. Hilger, J.; Loerbroks, A.; Diehl, K. Eating behaviour of university students in Germany: Dietary intake, barriers to healthy eating and changes in eating behaviour since the time of matriculation. Appetite 2017, 109, 100–107. [Google Scholar] [CrossRef] [PubMed]
  4. Orfanos, P.; Naska, A.; Rodrigues, S.; Lopes, C.; Freisling, H.; Rohrmann, S.; Sieri, S.; Elmadfa, I.; Lachat, C.; Gedrich, K.; et al. Eating at restaurants, at work or at home. Is there a difference? A study among adults of 11 European countries in the context of the HECTOR* project. Eur. J. Clin. Nutr. 2017, 71, 407–419. [Google Scholar] [CrossRef]
  5. Escoto, K.H.; Laska, M.N.; Larson, N.; Neumark-Sztainer, D.; Hannan, P.J. Work hours and perceived time barriers to healthful eating among young adults. Am. J. Heal. Behav. 2012, 36, 786–796. [Google Scholar] [CrossRef] [PubMed] [PubMed Central]
  6. Lima, J.P.M.; Costa, S.A.; Brandão, T.R.S.; Rocha, A. Food Consumption Determinants and Barriers for Healthy Eating at the Workplace—A University Setting. Foods 2021, 10, 695. [Google Scholar] [CrossRef] [PubMed]
  7. Pinho, M.G.M.; Mackenbach, J.D.; Charreire, H.; Oppert, J.-M.; Bárdos, H.; Glonti, K.; Rutter, H.; Compernolle, S.; De Bourdeaudhuij, I.; Beulens, J.W.J.; et al. Exploring the relationship between perceived barriers to healthy eating and dietary behaviours in European adults. Eur. J. Nutr. 2018, 57, 1761–1770. [Google Scholar] [CrossRef] [PubMed]
  8. Baskin, E.; Gorlin, M.; Chance, Z.; Novemsky, N.; Dhar, R.; Huskey, K.; Hatzis, M. Proximity of snacks to beverages increases food consumption in the workplace: A field study. Appetite 2016, 103, 244–248. [Google Scholar] [CrossRef] [PubMed]
  9. Gregori, D.; Foltran, F.; Ghidina, M.; Berchialla, P. Understanding the influence of the snack definition on the association between snacking and obesity: A review. Int. J. Food Sci. Nutr. 2010, 62, 270–275. [Google Scholar] [CrossRef] [PubMed]
  10. Hartmann, C.; Siegrist, M.; van der Horst, K. Snack frequency: Associations with healthy and unhealthy food choices. Public Health Nutr. 2013, 16, 1487–1496. [Google Scholar] [CrossRef] [PubMed]
  11. Bos, C.; A van der Lans, I.; van Rijnsoever, F.J.; van Trijp, H.C. Heterogeneity in barriers regarding the motivation, the opportunity and the ability to choose low-calorie snack foods and beverages: Associations with real-life choices. Public Health Nutr. 2016, 19, 1584–1597. [Google Scholar] [CrossRef] [PubMed]
  12. Lima, J.; Costa, S.; Rocha, A. How do university workers eat at the workplace? Nutr. Food Sci. 2018, 48, 194–205. [Google Scholar] [CrossRef]
  13. Plasek, B.; Temesi, Á. The credibility of the effects of functional food products and consumers’ willingness to purchase/willingness to pay—Review. Appetite 2019, 143, 104398. [Google Scholar] [CrossRef] [PubMed]
  14. Skoczek-Rubińska, A.; Bajerska, J. The consumption of energy dense snacks and some contextual factors of snacking may contribute to higher energy intake and body weight in adults. Nutr. Res. 2021, 96, 20–36. [Google Scholar] [CrossRef] [PubMed]
  15. World Health Organisation. WHO Factsheet on Healthy Diet (No 394). 2016. Available online: http://www.who.int/mediacentre/factsheets/fs394/en/ (accessed on 26 January 2024).
  16. Stelick, A.; Sogari, G.; Rodolfi, M.; Dando, R.; Paciulli, M. Impact of sustainability and nutritional messaging on Italian consumers’ purchase intent of cereal bars made with brewery spent grains. J. Food Sci. 2021, 86, 531–539. [Google Scholar] [CrossRef]
  17. Nystrand, B.; Olsen, S. Relationships between functional food consumption and individual traits and values: A segmentation approach. J. Funct. Foods 2021, 86, 104736. [Google Scholar] [CrossRef]
  18. Szakos, D.; Ózsvári, L.; Kasza, G. Health-related nutritional preferences of older adults: A segmentation study for functional food development. J. Funct. Foods 2022, 92, 105065. [Google Scholar] [CrossRef]
  19. Vecchio, R.; Van Loo, E.J.; Annunziata, A. Consumers’ willingness to pay for conventional, organic and functional yogurt: Evidence from experimental auctions. Int. J. Consum. Stud. 2016, 40, 368–378. [Google Scholar] [CrossRef]
  20. Zhang, L.; García-Pérez, P.; Martinelli, E.; Giuberti, G.; Trevisan, M.; Lucini, L. Different fractions from wheat flour provide distinctive phenolic profiles and different bioaccessibility of polyphenols following in vitro digestion. Food Chem. 2022, 404, 134540. [Google Scholar] [CrossRef]
  21. Roberfroid, M.B. Global view on functional foods: European perspectives. Br. J. Nutr. 2002, 88 (Suppl. S2), S133–S138. [Google Scholar] [CrossRef]
  22. Ballco, P.; Gracia, A. Tackling nutritional and health claims to disentangle their effects on consumer food choices and behaviour: A systematic review. Food Qual. Prefer. 2022, 101, 104634. [Google Scholar] [CrossRef]
  23. Papoutsi, G.S.; Klonaris, S.; Drichoutis, A. The health-taste trade-off in consumer decision making for functional snacks. Br. Food J. 2019, 123, 1645–1663. [Google Scholar] [CrossRef]
  24. Verbeke, W. Functional foods: Consumer willingness to compromise on taste for health? Food Qual. Prefer. 2006, 17, 126–131. [Google Scholar] [CrossRef]
  25. Bruschi, V.; Teuber, R.; Dolgopolova, I. Acceptance and willingness to pay for health-enhancing bakery products—Empirical evidence for young urban Russian consumers. Food Qual. Prefer. 2015, 46, 79–91. [Google Scholar] [CrossRef]
  26. Siró, I.; Kápolna, E.; Kápolna, B.; Lugasi, A. Functional food. Product development, marketing and consumer acceptance—A review. Appetite 2008, 51, 456–467. [Google Scholar] [CrossRef] [PubMed]
  27. Ballco, P.; Jurado, F.; Gracia, A. Do health claims add value to nutritional claims? Evidence from a close-to-real experiment on breakfast biscuits. Food Qual. Prefer. 2020, 85, 103968. [Google Scholar] [CrossRef]
  28. Pappalardo, G.; Lusk, J.L. The role of beliefs in purchasing process of functional foods. Food Qual. Prefer. 2016, 53, 151–158. [Google Scholar] [CrossRef]
  29. Viscecchia, R.; Nocella, G.; De Devitiis, B.; Bimbo, F.; Carlucci, D.; Seccia, A.; Nardone, G. Consumers’ trade-off between nutrition and health claims under regulation 1924/2006: Insights from a choice experiment analysis. Nutrients 2019, 11, 2881. [Google Scholar] [CrossRef]
  30. Janssen, M.; Hamm, U. Product labelling in the market for organic food: Consumer preferences and willingness-to-pay for different organic certification logos. Food Qual. Prefer. 2012, 25, 9–22. [Google Scholar] [CrossRef]
  31. Lähteenmäki, L. Claiming health in food products. Food Qual. Prefer. 2013, 27, 196–201. [Google Scholar] [CrossRef]
  32. Ballco, P.; De Magistris, T. Spanish consumer purchase behaviour and stated preferences for yoghurts with nutritional and health claims. Nutrients 2019, 11, 2742. [Google Scholar] [CrossRef]
  33. Grasso, S.; Asioli, D. Consumers’ Preferences for Upcycled Ingredients: A Case Study with Biscuits. Food Qual. Prefer. 2020, 84, 103951. [Google Scholar] [CrossRef]
  34. Jurado, F.; Gracia, A. Does the valuation of nutritional claims differ among consumers? Insights from Spain. Nutrients 2017, 9, 132. [Google Scholar] [CrossRef] [PubMed]
  35. Vecchio, R.; Annunziata, A. Willingness-to-pay for sustainability-labelled chocolate: An experimental auction approach. J. Clean. Prod. 2015, 86, 335–342. [Google Scholar] [CrossRef]
  36. Zhong, Y.; Zhu, H.; Liang, W.; Li, X.; Liu, L.; Zhang, X.; Yue, H.; Xue, J.; Liu, X.; Guo, D. High-amylose starch as a new ingredient to balance nutrition and texture of food. J. Cereal Sci. 2018, 81, 8–14. [Google Scholar] [CrossRef]
  37. Botticella, E.; Sestili, F.; Sparla, F.; Moscatello, S.; Marri, L.; Cuesta-Seijo, J.A.; Falini, G.; Battistelli, A.; Trost, P.; Lafiandra, D. Combining mutations at genes encoding key enzymes involved in starch synthesis affects the amylose content, carbohydrate allocation and hardness in the wheat grain. Plant Biotechnol. J. 2018, 16, 1723–1734. [Google Scholar] [CrossRef]
  38. Bojarczuk, A.; Skąpska, S.; Khaneghah, A.M.; Marszałek, K. Health benefits of resistant starch: A review of the literature. J. Funct. Foods 2022, 93, 105094. [Google Scholar] [CrossRef]
  39. Di Rosa, C.; De Arcangelis, E.; Vitelli, V.; Crucillà, S.; Angelicola, M.; Trivisonno, M.C.; Sestili, F.; Blasi, E.; Cicatiello, C.; Lafiandra, D.; et al. Effect of Three Bakery Products Formulated with High-Amylose Wheat Flour on Post-Prandial Glycaemia in Healthy Volunteers. Foods 2023, 12, 319. [Google Scholar] [CrossRef] [PubMed]
  40. Hallström, E.; Sestili, F.; Lafiandra, D.; Björck, I.; Östman, E. A Novel Wheat Variety with Elevated Content of Amylose Increases Resistant Starch Formation and May Beneficially Influence Glycaemia in Healthy Subjects. Food Nutr. Res. 2011, 55, 7074. [Google Scholar] [CrossRef] [PubMed]
  41. Luhovyy, B.L.; Mollard, R.C.; Yurchenko, S.; Nunez, M.F.; Berengut, S.; Liu, T.T.; Smith, C.E.; Pelkman, C.L.; Anderson, G.H. The effects of whole grain high-amylose maize flour as a source of resistant starch on blood glucose, satiety, and food intake in young men. J. Food Sci. 2014, 79, H2550–H2556. [Google Scholar] [CrossRef]
  42. Dell’Unto, D.; Meccariello, G.; Cortignani, R. Healthy food consumption in the COVID-19 era: Empirical evidence from Italian consumers choices on functional products. Econ. Agro-Aliment. 2023, 25, 11–34. [Google Scholar] [CrossRef]
  43. Lawless, H.T.; Heymann, H. Sensory Evaluation of Food: Principles and Practices; Springer Science & Business Media: New York, NY, USA, 2013; ISBN 978-1-4615-7845-1. [Google Scholar]
  44. Świąder, K.; Marczewska, M. Trends of using sensory evaluation in new product development in the food industry in countries that belong to the EIT regional innovation scheme. Foods 2021, 10, 446. [Google Scholar] [CrossRef]
  45. Wansink, B. Response to “Measuring consumer response to food products”. Sensory tests that predict consumer acceptance. Food Qual. Prefer. 2003, 14, 23–26. [Google Scholar] [CrossRef]
  46. Ares, G.; Deliza, R.; Barreiro, C.; Giménez, A.; Gámbaro, A. Comparison of two sensory profiling techniques based on consumer perception. Food Qual. Prefer. 2010, 21, 417–426. [Google Scholar] [CrossRef]
  47. Ares, G.; Bruzzone, F.; Vidal, L.; Cadena, R.S.; Giménez, A.; Pineau, B.; Hunter, D.C.; Paisley, A.G.; Jaeger, S.R. Eval-uation of a rating-based variant of check-all-that-apply questions: Rate-all-that-apply (RATA). Food Qual. Prefer. 2014, 36, 87–95. [Google Scholar] [CrossRef]
  48. Sinesio, F.; Cammareri, M.; Cottet, V.; Fontanet, L.; Jost, M.; Moneta, E.; Palombieri, S.; Peparaio, M.; del Castillo, R.R.; Civitelli, E.S.; et al. Sensory Traits and Consumer’s Perceived Quality of Traditional and Modern Fresh Market Tomato Varieties: A Study in Three European Countries. Foods 2021, 10, 2521. [Google Scholar] [CrossRef]
  49. Ng, M.; Chaya, C.; Hort, J. Beyond liking: Comparing the measurement of emotional response using EsSense Profile and consumer defined check-all-that-apply methodologies. Food Qual. Prefer. 2013, 28, 193–205. [Google Scholar] [CrossRef]
  50. Adams, J.; Williams, A.; Lancaster, B.; Foley, M. Advantages and uses of check-all-that- apply response compared to traditional scaling of attributes for salty snacks. In Proceedings of the 7th Pangborn Sensory Science Symposium, Minneapolis, MN, USA, 12–16 August 2007. [Google Scholar]
  51. Bruzzone, F.; Vidal, L.; Antúnez, L.; Giménez, A.; Deliza, A.; Ares, G. Comparison of intensity scales and CATA questions in new product development: Sensory characterisation and directions for product reformulation of milk desserts. Food Qual. Prefer. 2015, 44, 183–193. [Google Scholar] [CrossRef]
  52. Giacalone, D.; Bredie, W.L.P.; Bom Frøst, M. “All-In-One Test’’ (AI1): A rapid and easily applicable approach to consumer product testing. Food Qual. Prefer. 2013, 27, 108–119. [Google Scholar] [CrossRef]
  53. Grasso, S.; Monahan, F.; Hutchings, S.; Brunton, N. The effect of health claim information disclosure on the sensory characteristics of plant sterol-enriched turkey as assessed using the Check-All-That-Apply (CATA) methodology. Food Qual. Prefer. 2017, 57, 69–78. [Google Scholar] [CrossRef]
  54. Delicato, C.; Schouteten, J.J.; Dewettinck, K.; Gellynck, X.; Tzompa-Sosa, D.A. Consumers’ perception of bakery products with insect fat as partial butter replacement. Food Qual. Prefer. 2020, 79, 103755. [Google Scholar] [CrossRef]
  55. Dixon, W.J.; Massey, F.J., Jr. Introduction to Statistical Analysis, 4th ed.; McGraw–Hill: New York, NY, USA, 1983. [Google Scholar]
  56. Preece, D.A. T is for trouble (and textbooks)—A critique of some examples of the paired-samples t-test. J. R. Stat. Soc. Ser. D Stat. 1982, 31, 169–195. [Google Scholar] [CrossRef]
  57. Senn, S.J.; Richardson, W. The first t-test. Stat. Med. 1994, 13, 785–803. [Google Scholar] [CrossRef] [PubMed]
  58. Küster, I.; Vila, N. Health/Nutrition food claims and low-fat food purchase: Projected personality influence in young consumers. J. Funct. Foods 2017, 38, 66–76. [Google Scholar] [CrossRef]
  59. Santeramo, F.G.; Carlucci, D.; De Devitiis, B.; Seccia, A.; Stasi, A.; Viscecchia, R.; Nardone, G. Emerging trends in European food, diets and food industry. Food Res. Int. 2017, 104, 39–47. [Google Scholar] [CrossRef] [PubMed]
  60. Teuber, R.; Dolgopolova, I.; Nordström, J. Some like it organic, some like it purple and some like it ancient: Consumer preferences and WTP for value-added attributes in whole grain bread. Food Qual. Prefer. 2016, 52, 244–254. [Google Scholar] [CrossRef]
  61. Bertail, P.; Caillavet, F. Fruit and Vegetable Consumption Patterns: A Segmentation Approach. Am. J. Agric. Econ. 2008, 90, 827–842. [Google Scholar] [CrossRef]
  62. Caracciolo, F.; Furno, M. Hedonic Functions, Heterogeneous Consumers, and Wine Market Segmentation. J. Agric. Resour. Econ. 2020, 45, 299–316. [Google Scholar] [CrossRef]
  63. Caracciolo, F.; Furno, M.; D’Amico, M.; Califano, G.; Di Vita, G. Variety seeking behavior in the wine domain: A consumers segmentation using big data. Food Qual. Prefer. 2022, 97, 104481. [Google Scholar] [CrossRef]
  64. Caudill, S.B.; Mixon, F.G. Estimating class-specific parametric models using finite mixtures: An application to a hedonic model of wine prices. J. Appl. Stat. 2016, 43, 1253–1261. [Google Scholar] [CrossRef]
  65. Onwezen, M.C.; Reinders, M.J.; van der Lans, I.A.; Sijtsema, S.J.; Jasiulewicz, A.; Guardia, M.D.; Guerrero, L. A cross-national consumer segmentation based on food benefits: The link with consumption situations and food perceptions. Food Qual. Prefer. 2012, 24, 276–286. [Google Scholar] [CrossRef]
  66. Dempster, A.P.; Laird, N.M.; Rubin, D.B. Maximum likelihood for incomplete data via the EM algorithm. J. R. Stat. Soc. Ser. B Methodol. 1977, 39, 1–22. [Google Scholar] [CrossRef]
  67. De Arcangelis, E.; Trivisonno, M.C.; Angelicola, M.; Quiquero, M.; Di Nardo, V.; Falasca, L.; Sestili, F.; Messia, M.C.; Marconi, E. Milling and rheological properties of high amylose wheat. J. Cereal Sci. 2021, 102, 103335. [Google Scholar] [CrossRef]
  68. Lawless, L.J.; Nayga, R.M.; Akaichi, F.; Meullenet, J.; Threlfall, R.T.; Howard, L.R. Willingness-to-Pay for a Nutraceutical-Rich Juice Blend. J. Sens. Stud. 2012, 27, 375–383. [Google Scholar] [CrossRef]
  69. Caso, G.; Blasi, E.; Cembalo, L.; Vecchio, R. This cookie will save the planet! The effect of a private sustainability claims on consumers’ expectations. Heliyon 2023, 9, e14206. [Google Scholar]
  70. Rossi, E.S.; Zabala, J.A.; Caracciolo, F.; Blasi, E. The Value of Crop Diversification: Understanding the Factors Influencing Consumers’ WTP for Pasta from Sustainable Agriculture. Agriculture 2023, 13, 585. [Google Scholar] [CrossRef]
  71. Scholl-Grissemann, U. Do consumers care about the message a claim conveys? The magic bullet effect of organic and domestic claims on food products. J. Consum. Behav. 2017, 17, E21–E28. [Google Scholar] [CrossRef]
  72. Van Kleef, E.; Van Trijp, H.C.M.; Luning, P. Functional foods: Health claim—Food product compatibility and the impact of health claim framing on consumer evaluation. Appetite 2005, 44, 299–308. [Google Scholar] [CrossRef]
  73. Zanchini, R.; Di Vita, G.; Brun, F. Lifestyle, psychological and socio-demographic drivers in functional food choice: A systematic literature review based on bibliometric and network analysis. Int. J. Food Sci. Nutr. 2022, 73, 709–725. [Google Scholar] [CrossRef]
  74. Cecchini, L.; Torquati, B.; Chiorri, M. Sustainable agri-food products: A review of consumer preference studies through experimental economics. Agric. Econ. 2018, 64, 554–565. [Google Scholar] [CrossRef]
  75. Carrigan, M.; Attalla, A. The Myth of the Ethical Consumer—Do Ethics Matter in Purchase Behavior. J. Consum. Mark. 2001, 18, 560–577. [Google Scholar] [CrossRef]
  76. Van Loo, E.J.; Caputo, V.; Nayga, R.M., Jr.; Seo, H.S.; Zhang, B.; Verbeke, W. Sustainability labels on coffee: Consumer preferences, willingness-to-pay and visual attention to attributes. Ecological. Econ. 2015, 118, 215–225. [Google Scholar] [CrossRef]
  77. Weatherell, C.; Tregear, A.; Allinson, J. In Search of the Concerned Consumer: UK Public Perceptions of Food, Farming and Buying Local. J. Rural. Stud. 2003, 19, 233–244. [Google Scholar] [CrossRef]
  78. Hellyer, N.E.; Fraser, I.; Haddock-Fraser, J. Food choice, health information and functional ingredients: An experimental auction employing bread. Food Policy 2012, 37, 232–245. [Google Scholar] [CrossRef]
  79. Urala, N.; Lähteenmäki, L. Consumers’ changing attitudes towards functional foods. Food Qual. Prefer. 2007, 18, 1–12. [Google Scholar] [CrossRef]
  80. Dean, M.; Shepherd, R.; Arvola, A.; Vassallo, M.; Winkelmann, M.; Claupein, E.; Lähteenmäki, L.; Raats, M.; Saba, A. Consumer perceptions of healthy cereal products and production methods. J. Cereal Sci. 2007, 46, 188–196. [Google Scholar] [CrossRef]
  81. Gorton, D.; Carter, J.; Cvjetan, B.; Ni Mhurchu, C. Healthier vending machines in workplaces: Both possible and effective. New Zealand Med. J. 2010, 123, 43–52. [Google Scholar] [PubMed]
  82. Teratanavat, R.; Hooker, N.H. Consumer valuations and preference heterogeneity for a novel functional food. J. Food Sci. 2006, 71, S533–S541. [Google Scholar] [CrossRef]
  83. El Ansari, W.; Suominen, S.; Samara, A. Eating Habits and Dietary Intake: Is Adherence to Dietary Guidelines Associated with Importance of Healthy Eating among Undergraduate University Students in Finland? Cent. Eur. J. Public Health 2015, 23, 306–313. [Google Scholar] [CrossRef] [PubMed]
  84. Gil, M.; Rudy, M.; Stanisławczyk, R.; Duma-Kocan, P.; Żurek, J. Gender Differences in Eating Habits of Polish Young Adults Aged 20–26. Int. J. Environ. Res. Public Health 2022, 19, 15280. [Google Scholar] [CrossRef] [PubMed] [PubMed Central]
  85. Sprake, E.F.; Russell, J.M.; Cecil, J.E.; Cooper, R.J.; Grabowski, P.; Pourshahidi, L.K.; Barker, M.E. Dietary patterns of university students in the UK: A cross-sectional study. Nutr. J. 2018, 17, 90. [Google Scholar] [CrossRef]
  86. Ares, G.; Gámbaro, A. Influence of gender, age and motives underlying food choice on perceived healthiness and willingness to try functional foods. Appetite 2007, 49, 148–158. [Google Scholar] [CrossRef]
  87. Annunziata, A.; Vecchio, R. Functional foods development in the European market: A consumer perspective. J. Funct. Foods 2011, 3, 223–228. [Google Scholar] [CrossRef]
Figure 1. Functional “high-amylose” and conventional biscuits.
Foods 13 01731 g001
Figure 2. Material preparation.
Foods 13 01731 g002
Figure 3. Experiment phases.
Foods 13 01731 g003
Figure 4. Workstation arrangement.
Foods 13 01731 g004
Table 1. Ingredients and quantities used in the recipes of the biscuits’ formulations tested in the study.
IngredientsFunctional
High-Amylose Biscuits
Conventional Biscuits
High-amylose wheat flour (g)2000--
“Conventional” wheat flour (g)--2000
Butter (g)10501050
Salt (g)1010
White sugar (g)400400
Eggs (g)280280
Vanilla extract (g)44
Maltitol (g)300300
Table 2. Questionnaire sections.
Questionnaire SectionsInformation
1 Socio-demographic informationAge, gender, household size, work categories
2 Food purchasing processesHealthiness, certification, brand, price, calorie content, quality, brand, packaging
3 Snack pack purchasingPurchasing frequency, price
4.a Blind biscuit condition evaluation—biscuit ISensory attributes, liking level, WTP
4.b Blind biscuit condition evaluation—biscuit IISensory attributes, liking level, WTP
5 Amylose informationWTP
6 Revealed functional biscuitWTP, purchasing intention
Table 3. Descriptive and summary statistics of the variables (Obs 209).
VariablesSample
Socio-demographic variables
Age (mean)30.55
18–25 years (%)43.06
26–35 years (%)32.54
36–45 years (%)11.00
46–55 years (%)6.70
>55 years (%)6.70
Gender (women) (%)44.50
Household size (%)
19.09
213.40
318.66
444.50
5 or more14.35
Work categories (%)
Freelance2.87
Employee (public/private)29.19
Students61.24
Retired0.96
Other5.74
Attitudinal variables
Snack-pack purchase frequency (%)
Very rarely22.97
Rarely44.02
Often30.62
Very often2.39
Purchasing habits 1
Healthiness7.91
Certification presence6.75
Calorie contents6.18
Price6.95
Brand5.19
1 Data are expressed as average scores on Likert scale 1–9 (1: not at all–9: very often).
Table 4. The t-test acceptability variables under blind conditions.
Macro CategoriesVariablesFunctional
High-Amylose Biscuits
Conventional BiscuitsPaired t-Test
(p-Value)
General acceptability
WTP 11.03 (0.59)1.04 (0.60)0.2840
Liking level 26.98 (1.53)7.05 (1.37)0.5309
Sensory attributes 2
AppearanceBig5.22 (1.58)5.25 (1.62)0.8294
Small4.39 (1.76)4.54 (1.95)0.1578
Thick4.38 (1.75)4.23 (1.79)0.1529
Thin5.31 (2.00)5.36 (1.99)0.7159
TextureCrumbly6.66 (1.59)6.97 (1.56)0.0153
Chewy2.74 (1.93)2.25 (1.57)0.0001
Crisp5.21 (2.02)5.69 (1.88)0.0021
Pasty4.97 (2.16)4.38 (2.24)0.0001
Dry4.53 (2.06)4.62 (2.15)0.5444
TasteFat5.38 (2.01)5.59 (2.14)0.1587
Savory2.70 (1.67)2.87 (1.85)0.1792
Sweet6.33 (1.51)6.42 (1.47)0.4140
Toasted4.39 (2.17)4.82 (2.06)0.0051
Bitter1.66 (1.10)1.90 (1.53)0.0207
Obs = 209; standard deviation in parentheses. 1 Data are expressed as average scores EUR/snack pack of 4 biscuits. 2 Data are expressed as average scores on Likert scale 1–9 (1: not at all–9: very often).
Table 5. Finite mixture model results (own elaborations).
VariablesGroup 1
“The Budget-Conscious”
Group 2
“The Snack-Addicted”
Group 3
“The Health-Focused”
WTP REVEALED estimates within each group and their probabilities
Coeff.
(std. errs.)
p-valueCoeff.
(std. errs.)
p-valueCoeff.
(std. errs.)
p-value
Healthiness0.01(0.03)0.744−0.04 (0.04)0.301−0.49 (0.08)0.000
Certification presence0.02 (0.02)0.2040.05 (0.02)0.0420.23 (0.05)0.000
Calorie content0.03 (0.01)0.023−0.02 (0.02)0.3020.10 (0.04)0.029
Price0.03 (0.02)0.1110.07 (0.03)0.0420.13 (0.05)0.015
Brand0.01 (0.02)0.588−0.01(0.02)0.481−0.13 (0.03)0.000
FB liking level0.08 (0.02)0.0000.11 (0.02)0.0000.18 (0.05)0.000
WTPinfoAMYLOSE0.71 (0.05)0.0000.90 (0.04)0.0000.87 (0.12)0.000
Constant−0.63 (0.23)0.006−0.01 (0.32)0.9822.30 (0.84)0.006
Factors estimates determining the probability of belonging to each group
Gender 100.52 (0.45)0.2410.96 (0.52)0.067
Age00.04 (0.03)0.1960.01 (0.04)0.763
Student 20−0.21 (0.61)0.729−0.50 (0.76)0.511
Snack purchase frequency0−0.31 (0.33)0.347−1.05 (0.40)0.009
Purchase price of snack01.52 (0.65)0.0193.32 (0.81)0.000
Constant0−2.16 (1.59)0.176−3.15 (1.82)0.083
π0.42 (0.07)0.43 (0.07)0.15 (0.03)
Log likelihood = −119.68737
Obs = 209; standard deviation in parentheses. 1 (dummy 1 = female); 2 (dummy 1 = student).
Table 6. Main variables categorized by group avg. share.
VariablesGroup 1
“The Budget-Conscious”
Group 2
“The Snack-Addicted”
Group 3
“The Health-Focused”
Gender0.35 (0.48)0.49 (0.50)0.58 (0.49)
Age28.39 (9.97)33.18 (13.10)29.46 (9.37)
Student0.70 (0.46)0.52 (0.50)0.60 (0.49)
Snack purchase frequency 12.14 (0.77)2.19 (0.76)1.94 (0.87)
Purchase price snack0.99 (0.34)1.14 (0.38)1.35 (0.44)
WTP REVEALED0.83 (0.49)1.38 (0.61)2.40 (0.79)
Healthiness 27.85 (1.25)7.86 (1.16)8.24 (0.94)
Certification presence 26.88 (1.85)6.60 (1.88)6.78 (1.74)
Calorie content 26.17 (2.08)6.10 (2.27)6.43 (1.97)
Price 26.96 (1.49)6.09 (1.32)6.92 (1.34)
Brand 25.32 (2.04)5.20 (2.05)4.79 (2.13)
FB liking level 26.99 (1.51)6.95 (1.51)7.05 (1.66)
WTPinfoAMYLOSE0.32 (0.55)0.33 (0.58)0.48 (0.58)
1 Data are expressed as average scores on scale 1–4 (1: very rarely–4: very often). 2 Data are expressed as average scores on Likert scale 1–9 (1: not at all–9: very often).
Disclaimer/Publisher’s Note: The statements, opinions and data contained in all publications are solely those of the individual author(s) and contributor(s) and not of MDPI and/or the editor(s). MDPI and/or the editor(s) disclaim responsibility for any injury to people or property resulting from any ideas, methods, instructions or products referred to in the content.

