Article

Pulsed Electric Field Pretreatments Affect the Metabolite Profile and Antioxidant Activities of Freeze− and Air−Dried New Zealand Apricots

1
Centre for Future Foods, Auckland University of Technology, Private Bag 92006, Auckland 1142, New Zealand
2
Department of Food Science, University of Otago, PO Box 56, Dunedin 9054, New Zealand
*
Author to whom correspondence should be addressed.
Foods 2024, 13(11), 1764; https://doi.org/10.3390/foods13111764
Submission received: 3 April 2024 / Revised: 19 May 2024 / Accepted: 22 May 2024 / Published: 4 June 2024
(This article belongs to the Section Food Engineering and Technology)

Abstract

:
Pulsed electric field (PEF) pretreatment has been shown to improve the quality of dried fruits in terms of antioxidant activity and bioactive compounds. In this study, apricots were pretreated with PEF at different field strengths (0.7 kV/cm; 1.2 kV/cm and 1.8 kv/cm) at a frequency of 50 Hz, and electric pulses coming in every 20 µs for 30 s, prior to freeze−drying and air−drying treatments. PEF treatments were carried out at different field strengths. The impact of different pretreatments on the quality of dried apricot was determined in terms of physical properties, antioxidant activity, total phenolic content, and metabolite profile. PEF pretreatments significantly (p < 0.05) increased firmness of all the air−dried samples the most by 4–7−fold and most freeze−dried apricot samples (44.2% to 98.64%) compared to the control group. However, PEF treatment at 1.2 kV/cm did not have any effect on hardness of the freeze−dried sample. The moisture content and water activity of freeze−dried samples were found to be significantly lower than those of air−dried samples. Scanning electron microscopy results revealed that air drying caused the loss of fruit structure due to significant moisture loss, while freeze drying preserved the honeycomb structure of the apricot flesh, with increased pore sizes observed at higher PEF intensities. PEF pretreatment also significantly increased the antioxidant activity and total phenol content of both air−dried and freeze−dried apricots. PEF treatment also significantly (p < 0.05) increased amino acid and fatty acid content of air−dried samples but significantly (p < 0.05) decreased sugar content. Almost all amino acids (except tyrosine, alanine, and threonine) significantly increased with increasing PEF intensity. The results of this study suggest that PEF pretreatment can influence the quality of air−dried and freeze−dried apricots in terms antioxidant activity and metabolites such as amino acids, fatty acids, sugar, organic acids, and phenolic compounds. The most effective treatment for preserving the quality of dried apricots is freeze drying combined with high−intensity (1.8 kv/cm) PEF treatment.

1. Introduction

Apricots (Prunus armeniaca L.) can be grown in the temperate zones of the world [1,2] They were originally grown on wild Chinese hillsides and later cultivated in Armenia [3] In 2020, the worldwide apricot cultivation area was 562,475 hectares, and the total apricot yield amounted to 3.72 million metric tons [4]. The leading producer of apricots is Turkey, with other major contributors being Uzbekistan, Iran, Algeria, Italy, Afghanistan, Spain, Greece, Pakistan, and Morocco. [5]. Apricots are rich in vitamin A precursors [6]. However, apricots are seasonal fruits that are highly perishable and experience huge losses throughout the production chain [7]. Drying is a typical preservation technique for extending food shelf life and ensuring food security. Apricots are traditionally pretreated with sulphur dioxide before sun drying to preserve their natural reddish yellow colour [8]. However, hot air drying involves long drying times and often causes undesirable quality issues. Freeze drying on the other hand can maintain the fruit quality, but its high energy consumption requirement significantly increases cost [7].
Pulsed electric field (PEF) is a non−thermal technology that has been used as a pretreatment prior to drying of fruits. It can increase cell permeabilisation, which leads to reduced drying time, and can release bioactive components in plant tissues [9]. Cell membrane permeability can lead to the release of intracellular compounds. Depending on the fruit structure, this may either increase the availability of antioxidants or cause their degradation. These bioactive components can increase the nutritional value of dried fruit. In addition, PEF can reduce the degradation of heat−sensitive compounds.
Previous studies have mainly focused on the effect of PEF on drying of fruits in terms of antioxidant activity, drying efficiency, and changes in physical properties. PEF pretreatment at low energy levels has been reported to improve the quality of freeze−dried red bell peppers and strawberries in terms of rehydration capacity, shrinkage reduction and texture [10]. A combination of osmotic dehydration (55 °C, 60 min), PEF (2.8 kV/cm, 750 p) and air−drying (60 °C) treatment compared to conventional air−dried goji berry decreased total processing time by 180 min (33%), improved colour retention, as well as increased antioxidant capacity and total phenolic content [11]. PEF treatments at a specific setting (1.25 kV/cm, 100 Hz, 20 µs) led to an increase in the drying rate, β−carotene content and antioxidant activity in air−dried apricots [7]. Previous study further observed that the moisture content in freeze−dried apples subjected to PEF treatment (1.07 kV/cm, 2 Hz) was reduced by about 82% compared to untreated apples [12].
PEF treatment prior to drying can influence antioxidant activity of fruits. Air−drying (70 °C) apple tissue subjected to PEF pretreatments (3.5 and 6 kJ/kg) led to a significant decrease (p < 0.05) in antioxidant activity using DPPH and iron−ion−reducing power assays [13]. Similarly, PEF pretreatment (1.0 and 3.0 kJ/kg) prior to convective and microwave–convective drying of red bell pepper resulted in a significant (p < 0.05) decrease in antioxidant activity, as determined by DPPH and ATBS assays [14]. However, PEF pretreatments applied to mango peels (at 1.5 kV cm−1, 3.0 kV cm−1 and 4.5 kV cm−1) at varying air−drying temperatures (50, 60 and 70 °C) resulted in a significant (p < 0.05) increase in antioxidant activity with increasing temperature. Moreover, the combination of 70 °C and 4.5 kV cm−1 yielded the highest antioxidant activity, as evaluated using DPPH, ABTS and FRAP assays [15].
PEF treatment can strongly influence the tissue firmness of fruit and vegetables through electroporation [16]. This phenomenon is attributed to changes in cell membrane permeability arising from the effect of PEF on cell structure [17]. Hot air−dried kiwifruit pretreated with PEF (1.92 kJ/kg) had significantly (p < 0.05) decreased firmness compared to the control group [17] Similar findings were reported for freeze−dried strawberries and bell peppers, where PEF pretreatments at 1.5, 3 and 6 kJ/kg significantly (p < 0.05) decreased firmness [10]. Moreover, the specific energy input and storage time (30 days) did not have a significant effect on hardness compared to the control group. On the other hand, PEF−pretreated hot air−dried pumpkin showed a significant (p < 0.05) increase in hardness compared to the control group. Similarly, PEF treatment of carrots and parsnips at 65.2 ± 0.7 kJ/kg and 65.8 ± 1.6 kJ/kg, respectively, significantly (p < 0.05) increased in hardness when dried at 70 °C [18].
PEF can be used to increase the extraction of polyphenols from fruits. Previous studies have shown that PEF treatment can enhance the migration of polyphenol compounds from cells to the surrounding matrix and prevent polyphenol degradation by inactivation of polyphenoloxidase [19,20,21,22].The study on the effect of PEF treatment on major polyphenol compounds in Rosa canina fruits found that PEF treatments at 1.7 kv/cm 0.389 kJ/kg and 2.0 kv/cm 0.457 kJ/kg significantly (p < 0.05) increased quercetin 3−O−glucoside, quercetin 3−O−rutinoside, eriodictyol 7−O−rutinoside and catechin content in these fruits compared to control samples [20]. Similarly, PEF treatments at 1.7 kv/cm 0.389 kJ/kg and 2.0 kv/cm 0.457 kJ/kg significantly (p < 0.05) increased quercetin 3−rutinoside, quercetin 3−glucoside, kaempferol 3−glucoside, quercetin 3−glucuronide and gallic acid in Vitis vinifera fruit compared to control samples [21]. PEF treatment (3 kV/cm; 5, 10 and 15 kJ/kg) of cranberry bush purée has also been found to significantly increase (p < 0.05) chlorogenic acid compared to control [19]. Although PEF treatment can significantly increase the levels of some polyphenol compounds in fruit at high specific energy levels, the enhancement effect may plateau or decrease at very high energy input levels. Previse study found that PEF treatment of orange peel at electric field strengths of 1 to 7 kV/cm (0.06 to 3.77 kJ/kg) significantly increased the extraction of naringin and hesperidin compared to the untreated sample (p < 0.05) [22]. The extraction of both flavonoids increased with the intensity of the electric field strength until 5 kV/cm, after which there was no significant difference (p > 0.05) between the 5 and 7 kV/cm treatments [22].
Given that both amino acids and sugars are involved in metabolic processes and can be derived from or transformed into other metabolic products, they are classified as metabolites in the broader context of biochemistry and metabolism. In terms of changes in metabolites, previous studies have shown that PEF can increase amino acids and sugar content. Previous study reported that the total free amino acids were significantly (p < 0.05) higher in grape juice treated by PEF compared to control [23]. However, PEF treatments showed no significant effects on fatty acids in this study The concentrations of essential amino acids (arginine, histidine, leucine, isoleucine, lysine, phenylalanine, and threonine) were significantly (p < 0.05) higher in samples treated at a field strength of 2.92 kV/cm compared to control. PEF processing can significantly increase the total sugar content of juices from black chokeberry [24]. The higher sugar content may be attributed to the increase in dry matter after PEF processing. However, the effects of PEF pretreatment on the metabolite profiles of fruits prior to drying have not been fully investigated.
The effects of PEF treatment on the physicochemical properties of different dried fruits are complex and diverse. Further research is needed to understand the parameters of PEF pretreatments for improving the quality and nutritional value of dried fruits. Hence, this study investigated the changes in microstructural, physical, antioxidant activity and metabolite profiles of PEF−pretreated apricots subjected to freeze and air drying. The results of this study provide valuable insights into the potential of PEF pretreatment to improve the physical and chemical characteristics of dried fruits.

2. Materials and Methods

2.1. Apricot Samples

Fresh apricots were purchased from Bidfood, Dunedin, New Zealand in February 2020. These apricots belonged to the Sundrop cultivar that was obtained from Roxburgh, South Island, New Zealand. Apricots with similar size and weight were selected for the experiment. In total, twenty−four apricot fruits were used in this study.

2.2. PEF Treatment and Drying

PEF processing was carried out using the ELCRACK HVP apparatus designed by the German Institute of Food Technologies, Quakenbruck, Germany. The apparatus was a batch mode reactor. Hence, PEF treatment for the apricot samples was carried out in two batches with eight replicates each. The PEF chamber dimensions were 100 mm in length, 80 mm in width and 50 mm in height. Only two fruits were treated per batch at a time. Four different field strength levels of PEF pretreatments were carried out in this study: (i) no PEF, (ii) low PEF (0.7 kV/cm), (iii) medium PEF (1.2 kV/cm) and (iv) high PEF (1.8 kV/cm), with a frequency of 50 Hz and electric pulses of 20 µs for 30 s. These PEF parameters were chosen based on the desired effect of different PEF intensities. The induction of the stress response was achieved with intensities of 0.5–1.5 kV/cm and energy inputs of 0.5–5 kJ/kg. The improvement of mass transfer was targeted with intensities of 0.7–3 kV/cm and energy inputs of 1–20 kJ/kg [25]. The control apricot samples with no PEF treatment were submerged in a water bath for 30 s with no pulse electric fields passing through these samples.
The PEF−treated apricot samples were cut in half and pitted (removal of the seed) after PEF processing. One half of the apricot samples were subjected to air drying and the other half to freeze drying. Directly after PEF treatment, the apricot samples were air dried at 70 °C for 12 h. For freeze drying, the apricot samples were frozen directly after PEF treatment using a blast chiller (Irinox MultiFresh® blast chiller MF 45.1, Madonna di Loreto, 6/B, Corbanese, Italy) for 12 h at −20 °C. Then, the samples were moved to a VirTis 35L general purpose freeze dryer (VirTis SP scientific sentry 2.0; SP Industries, 935 Mearns Road, Warminster, PA, USA). The entire procedure lasted for 72 h, with the vacuum set at 0.05 mbar. During the sublimation phase, the temperature was maintained at approximately 0 °C, while in the secondary drying phase, the temperature was increased to 30 °C. Sample treatments used in this study are summarised in Table 1.

2.3. Physical Analysis

2.3.1. Texture Evaluation

The texture evaluation of dried apricot involved using a TA.XTplus texture analyzer equipped with a Film Support Rig (HDP/FSR) on a heavy−duty platform (HDP/90), with all tests conducted at a constant temperature of 22 °C. Three samples of apricot were analyzed for each treatment, resulting in a total of 24 measurements. The texture parameters measured included hardness, adhesiveness, resilience, cohesion, springiness, gumminess, and chewiness. Penetrometer tests were carried out with a cylindrical probe of 2 mm in diameter, with penetration of samples to a depth of 10 mm at a speed of 0.5 mm/s. Additionally, compression tests used a 21 mm compression plate (P/50). The texture analyzer was configured in compression mode, with a pretest speed of 2.0 mm/s, a test speed of 1.0 mm/s and a posttest speed of 10.0 mm/s. The target mode of the texture analyzer was set to measure at a depth of 5 mm.

2.3.2. Scanning Electron Microscopy Imaging Analysis

The micromorphology of dried apricots was analyzed using a Hitachi SU−70 scanning electron microscope (SEM). The detector was positioned at a working distance of 15.5 mm from the samples, with an accelerating voltage of 5 kV applied to each sample. A platinum coating was applied to the samples before scanning using the Hitachi E−1045 Ion Sputter. For visualization, the micrographs were represented with a 1 mm scale for the skin and a 100 μm scale for the pulp.

2.3.3. Moisture Content and Water Activity

Moisture content was determined by subtracting the weight of the dried apricot sample from the weight of the fresh apricot sample. Water activity was measured using an AquaLab water activity meter (Series 3TE, Decagon Devices Inc., Pullman, WA, USA). Each measurement was performed in triplicate.

2.4. Chemical Analysis

2.4.1. Sample Extraction Prior to Antioxidant Analysis

An apricot sample (0.1 g) was weighed in a centrifuge tube and extracted with 4 mL 50% methanol. The sample was homogenized for 1 min using a vortex and then centrifuged at 1500 rpm for 15 min at 4 °C. The supernatant liquid was extracted and transferred into a 10 mL volumetric flask. The same step was repeated using 70% acetone. After that, deionized water was added to the volumetric flask containing methanol and acetone extracts and water added to the 10 mL mark and mixed completely. The samples were further diluted by a factor of 10. The extracts were stored in a freezer at −20 °C to minimize sample oxidation.

2.4.2. Cupric−Reducing Antioxidant Capacity (CUPRAC)

The cupric−reducing antioxidant capacity (CUPRAC) assay measures the antioxidant capacity of sample extracts, following the method described by Apak et al. [26]. In this assay, ascorbic acid (0.1 g) was dissolved and diluted to 100 mL to create a 1 g/L stock solution. Using this stock solution, standard solutions were prepared with final concentrations of 80, 40, 20, 10, 5, 2.5 and 0 mg/L. The absorbance at 450 nm was measured to generate a standard curve.
To test antioxidant capacity, 1 mL of the sample extract or distilled water was combined with 1 mL of 0.01 M CuCl2, 1 mL of 1 M NH4AC (pH 7), 1 mL of 0.075 M neocuproine and 0.1 mL of deionized water, resulting in a 4.1 mL total volume. The mixture was incubated for 5 min at room temperature, and then absorbance at 450 nm was measured using an Ultrospec 2100 Pro (Amersham Pharmacia Biotech, 800 Centennial Ave, Piscataway, NJ, USA) spectrophotometer. The antioxidant capacity was expressed as mg ascorbic acid equivalent per gram of sample. All measurements were performed in triplicate.

2.4.3. Ferric−Reducing Antioxidant Power (FRAP)

The ferric−reducing antioxidant power (FRAP) assay was applied as described by Morais et al., [27]. Ascorbic acid (0.1 g) was dissolved in water and diluted to 100 mL to prepare a 1 g/L stock solution. From this stock solution, standard solutions with concentrations of 80, 40, 20, 10, 5, 2.5 and 0 mg/L were prepared.
The FRAP reagent was prepared by mixing 10 mL of 300 mM acetate buffer, 1 mL of 10 mM TPTZ (dissolved in 10 mL of 40 mM HCl) and 1 mL of 20 mM FeCl3, incubating at 36 °C in a water bath until an orange−yellow color appeared. Afterwards, 2 mL of the FRAP reagent was added to 0.1 mL of the sample extract or distilled water, with an additional 0.9 mL of distilled water. The mixture was allowed to rest for 4 min, and the absorbance at 593 nm was measured using an Ultrospec 2100 Pro spectrophotometer. The FRAP results were expressed as mg ascorbic acid equivalent per gram of sample. Like the CUPRAC assay, the FRAP determinations were also performed in triplicate.

2.4.4. Total Phenolic Content (TPC)

The total phenolic content was determined using the Folin–Ciocalteau method by Singleton et al. [28]. The air−dried and freeze−dried samples were analyzed in triplicate. The absorbance of the samples was obtained by using the FLUOstar® Omega spectrophotometer. A calibration curve was used to determine the antioxidant activity of the dried apricot samples and results were expressed in terms of ascorbic acid or Trolox equivalent in mg/g.

2.4.5. Metabolite Analysis

For metabolite analyses, two derivatisation methods were used: trimethylsilylation (TMS) and methylchloroformate (MCF). TMS and MCF derivatives were prepared [29]. Gas chromatography–mass spectrometry (GC−MS) was utilized to identify, and semi−quantify organic acids, amino acids (except arginine) and fatty acids. The parameters used for GC−MS were based on the study by Smart et al. [30].

TMS Derivatisation

The dried sample was resuspended in 80 μL of methoxyamine hydrochloride solution in pyridine (2 g/100 mL). The sample was then incubated in a microwave oven for 2.8 min, with multimode irradiation set to 400 W at 30% power output. After that, 80 μL of N−methyl−N−(trimethylsilyl) trifluoroacetamide (MSTFA) was added to the sample, which was subsequently incubated for 3 min in the microwave oven.

MCF Derivatisation

The dried sample was resuspended in 200 μL of a 1 M sodium hydroxide solution, to which 34 μL of pyridine and 167 μL of methanol were added. The mixture was vigorously mixed for 30 s after adding 20 μL of MCF, followed by another 30 s vigorous mix after a second addition of 20 μL of MCF. Chloroform (400 μL) was added to separate the MCF derivatives from the reaction mixture, followed by vigorous mixing for 10 s. The solution was then treated with 400 μL of 50 mM sodium bicarbonate solution, followed by another vigorous mix for 10 s. The upper aqueous layer was discarded, leaving the chloroform phase for further GC−MS analysis.

2.5. Statistical Analysis

Results for antioxidant activity, total phenolic content, water activity, moisture content and texture were subjected to statistical analysis using the XLSAT MX software release 2010 (Addinsoft, New York, NY, USA). The data were analysed using one−way ANOVA to examine the main effects of PEF pretreatment on apricot samples. The data were later subjected to two−way ANOVA to examine the difference between freeze−dried and air−dried apricots pretreated with PEF prior to drying. When ANOVA was significant (p values < 0.05 and/or 0.1), means were separated by pairwise comparison using the Fisher’s least significant difference test.
Heat maps for showing the intensity of different metabolites in PEF−treated and non−PEF−treated dried apricots were generated by using MetaboAnalyst (version 4.0). Heatmaps were combined with hierarchical clustering, a technique that organizes items into a hierarchical structure based on the distance or similarity between them. The outcome of a hierarchical clustering analysis is presented in a heatmap through a dendrogram, which represents the hierarchical tree structure. Sparse partial least squares–discriminant analysis (sPLS−DA) was applied to summarize the metabolite differences between the control and the PEF−pretreated (at low, medium and high PEF intensities) apricot samples that were subjected to either air drying or freeze drying using MetaboAnalyst4.0. Results from metabolite profiling were analysed separately for the different drying methods using a one−way analysis of variance (ANOVA) using the XLSAT MX software release 2010 (Addinsoft, USA).

3. Results and Discussion

Biological variability of the samples was assessed using multivariate ANOVA (MANOVA) with Wilks’ test and Rao’s approximation where sample and replicate were included as main and interaction factors. No significant difference was observed in the repetition factor and its interaction.

3.1. Physical Analysis

Moisture Content and Water Activity

Table 2 summarizes the moisture content, water activity, texture, antioxidant ability and total phenolic content of PEF−pretreated apricots at either 0.7, 1.2 or 1.8 kV/cm at 50 hz every 20 µs for 30 s that were subsequently subjected to air drying or freeze drying. The results of our study indicate that the moisture content and water activity values of freeze−dried samples were significantly lower (p < 0.05) than those of air−dried samples. Specifically, the moisture content and water activity values of air−dried samples were found to be, on average, 28% and 30% higher than those of freeze−dried samples, respectively. Similarly, previous study reported that the moisture content of air−dried pumpkin (Cucurbita moschata Duch) flour was 13% higher compared to freeze−dried samples [31].
PEF pretreatment did not have a significant impact on the moisture content and water activity of the samples, regardless of the dehydration method used. There were no significant differences in terms of moisture content and water activity between the control samples and those treated with PEF (ranging from 0.7 kV/cm to 1.8 kV/cm) and subsequently freeze dried or air dried (see Table 2). For the samples subjected to air drying, the moisture content and water activity values ranged from 27.231% to 27.47% and 0.544 to 0.571, respectively. For the samples subjected to freeze drying, the moisture content and water activity values ranged from 19.42% to 19.853% and 0.384 to 0.399, respectively.Previous study reported that goji berries pretreated with PEF and osmotic dehydration at electric field strengths ranging from 0.9 kV/cm to 1.8 kV/cm and air dried had no significant effect on water loss and water activity. Sotelo et al. (2018) also found that PEF treatments using electric field strengths ranging from 0.3 kV/cm to 2.5 kV/cm had no significant effect on the moisture content of red cherries [11]. In addition, the Aw values of apricot samples dried using both freeze−drying and air−drying methods after PEF pretreatment were all below 0.6. This suggests that there will be no microbial proliferation with storage, as reported by Fontana [32].

3.2. Texture

Texture of dried apricot samples subjected to PEF pretreatments were determined using texture profile analysis and results are summarized in Table 3. The observed differences in texture parameters between air−dried and freeze−dried samples could be attributed to variations in cell structure and water removal kinetics during the drying process. Air drying leads to denser samples due to cell shrinkage, resulting in increased hardness compared to freeze−dried samples. However, the freeze−drying process might introduce structural changes that affect the ease of breaking, contributing to the observed differences in hardness. Air−dried samples were denser than freeze−dried samples. A previous study by Acevedo et al. [33] also reported that samples dried under vacuum at 50 °C showed higher hardness values than freeze−dried samples at similar relative humidity (RH).
PEF treatment, in combination with drying methods, further influenced the texture of dried apricots. Specifically, apricots that were treated with PEF and subsequently air dried had significantly (p < 0.05) higher values for hardness, gumminess and chewiness compared to those that were freeze dried (see Table 3). In air−dried apricots, the enhanced water removal due to increased cell membrane permeability could lead to a denser, harder texture as cells collapse more fully. In freeze−dried apricots, despite increased membrane permeability, the quick transition from frozen to dry minimizes the time for significant cellular collapse, hence maintaining a softer texture [34,35,36]. Previous research by Acevedo et al. [33] also reported that untreated control samples had denser shrinkage of cell walls compared to freeze−dried samples, resulting in a larger fracture force. In this study, dehydrated cell walls provided structural integrity and mechanical resistance to freeze−dried apple discs.
PEF pretreatment can significantly impact the texture parameters of dried apricots depending on the drying method and the intensity of PEF treatment influenced texture significantly. In air−dried apricot samples, high−intensity PEF pretreatments resulted in significantly (p < 0.05) higher hardness and gumminess values compared to low− and medium−intensity PEF−treated samples. For freeze−dried apricot samples, on the other hand, hardness values significantly (p < 0.05) increased after applying PEF pretreatments at low and high intensities compared to the control sample. This can be explained by changes in the microstructure of the dried apricots, as shown in Figure 1. Interestingly, hardness significantly (p < 0.05) decreased with medium−intensity PEF pretreatments compared to low− and high−intensity PEF pretreatments.
In terms of chewiness, there was a significant increase (p < 0.05) only in high−intensity PEF−treated samples for both drying methods compared to control. High−intensity PEF treatment can have more effect on disrupting these cell walls, causing structural changes that increase the resistance to deformation during chewing, resulting in a chewier texture [25]. Air−dried samples pretreated at medium PEF intensity had significantly (p < 0.05) the lowest adhesiveness compared to all other samples. However, resilience significantly (p < 0.05) decreased in PEF−treated air−dried samples compared to the control, with no significant differences between different PEF levels. This result suggests that PEF−treated air−dried apricot does not readily return to its original shape after being deformed during chewing. PEF treatment can enhance the mass transfer, which results in moisture distribution [25]. These changes may lead to a reduction in the sample’s ability to withstand deformation and recover to its original shape, resulting in decreased resilience. For freeze−dried apricots, chewiness and gumminess values significantly increased (p < 0.05) only when subjected to high−intensity PEF (1.8 kV/cm) compared to the control. Like air drying, higher PEF intensity can increase damage to cell structure, which may result in increased chewiness and gumminess. No significant changes in adhesiveness, resilience, cohesion, and springiness were found with different PEF pretreatments in the current study.

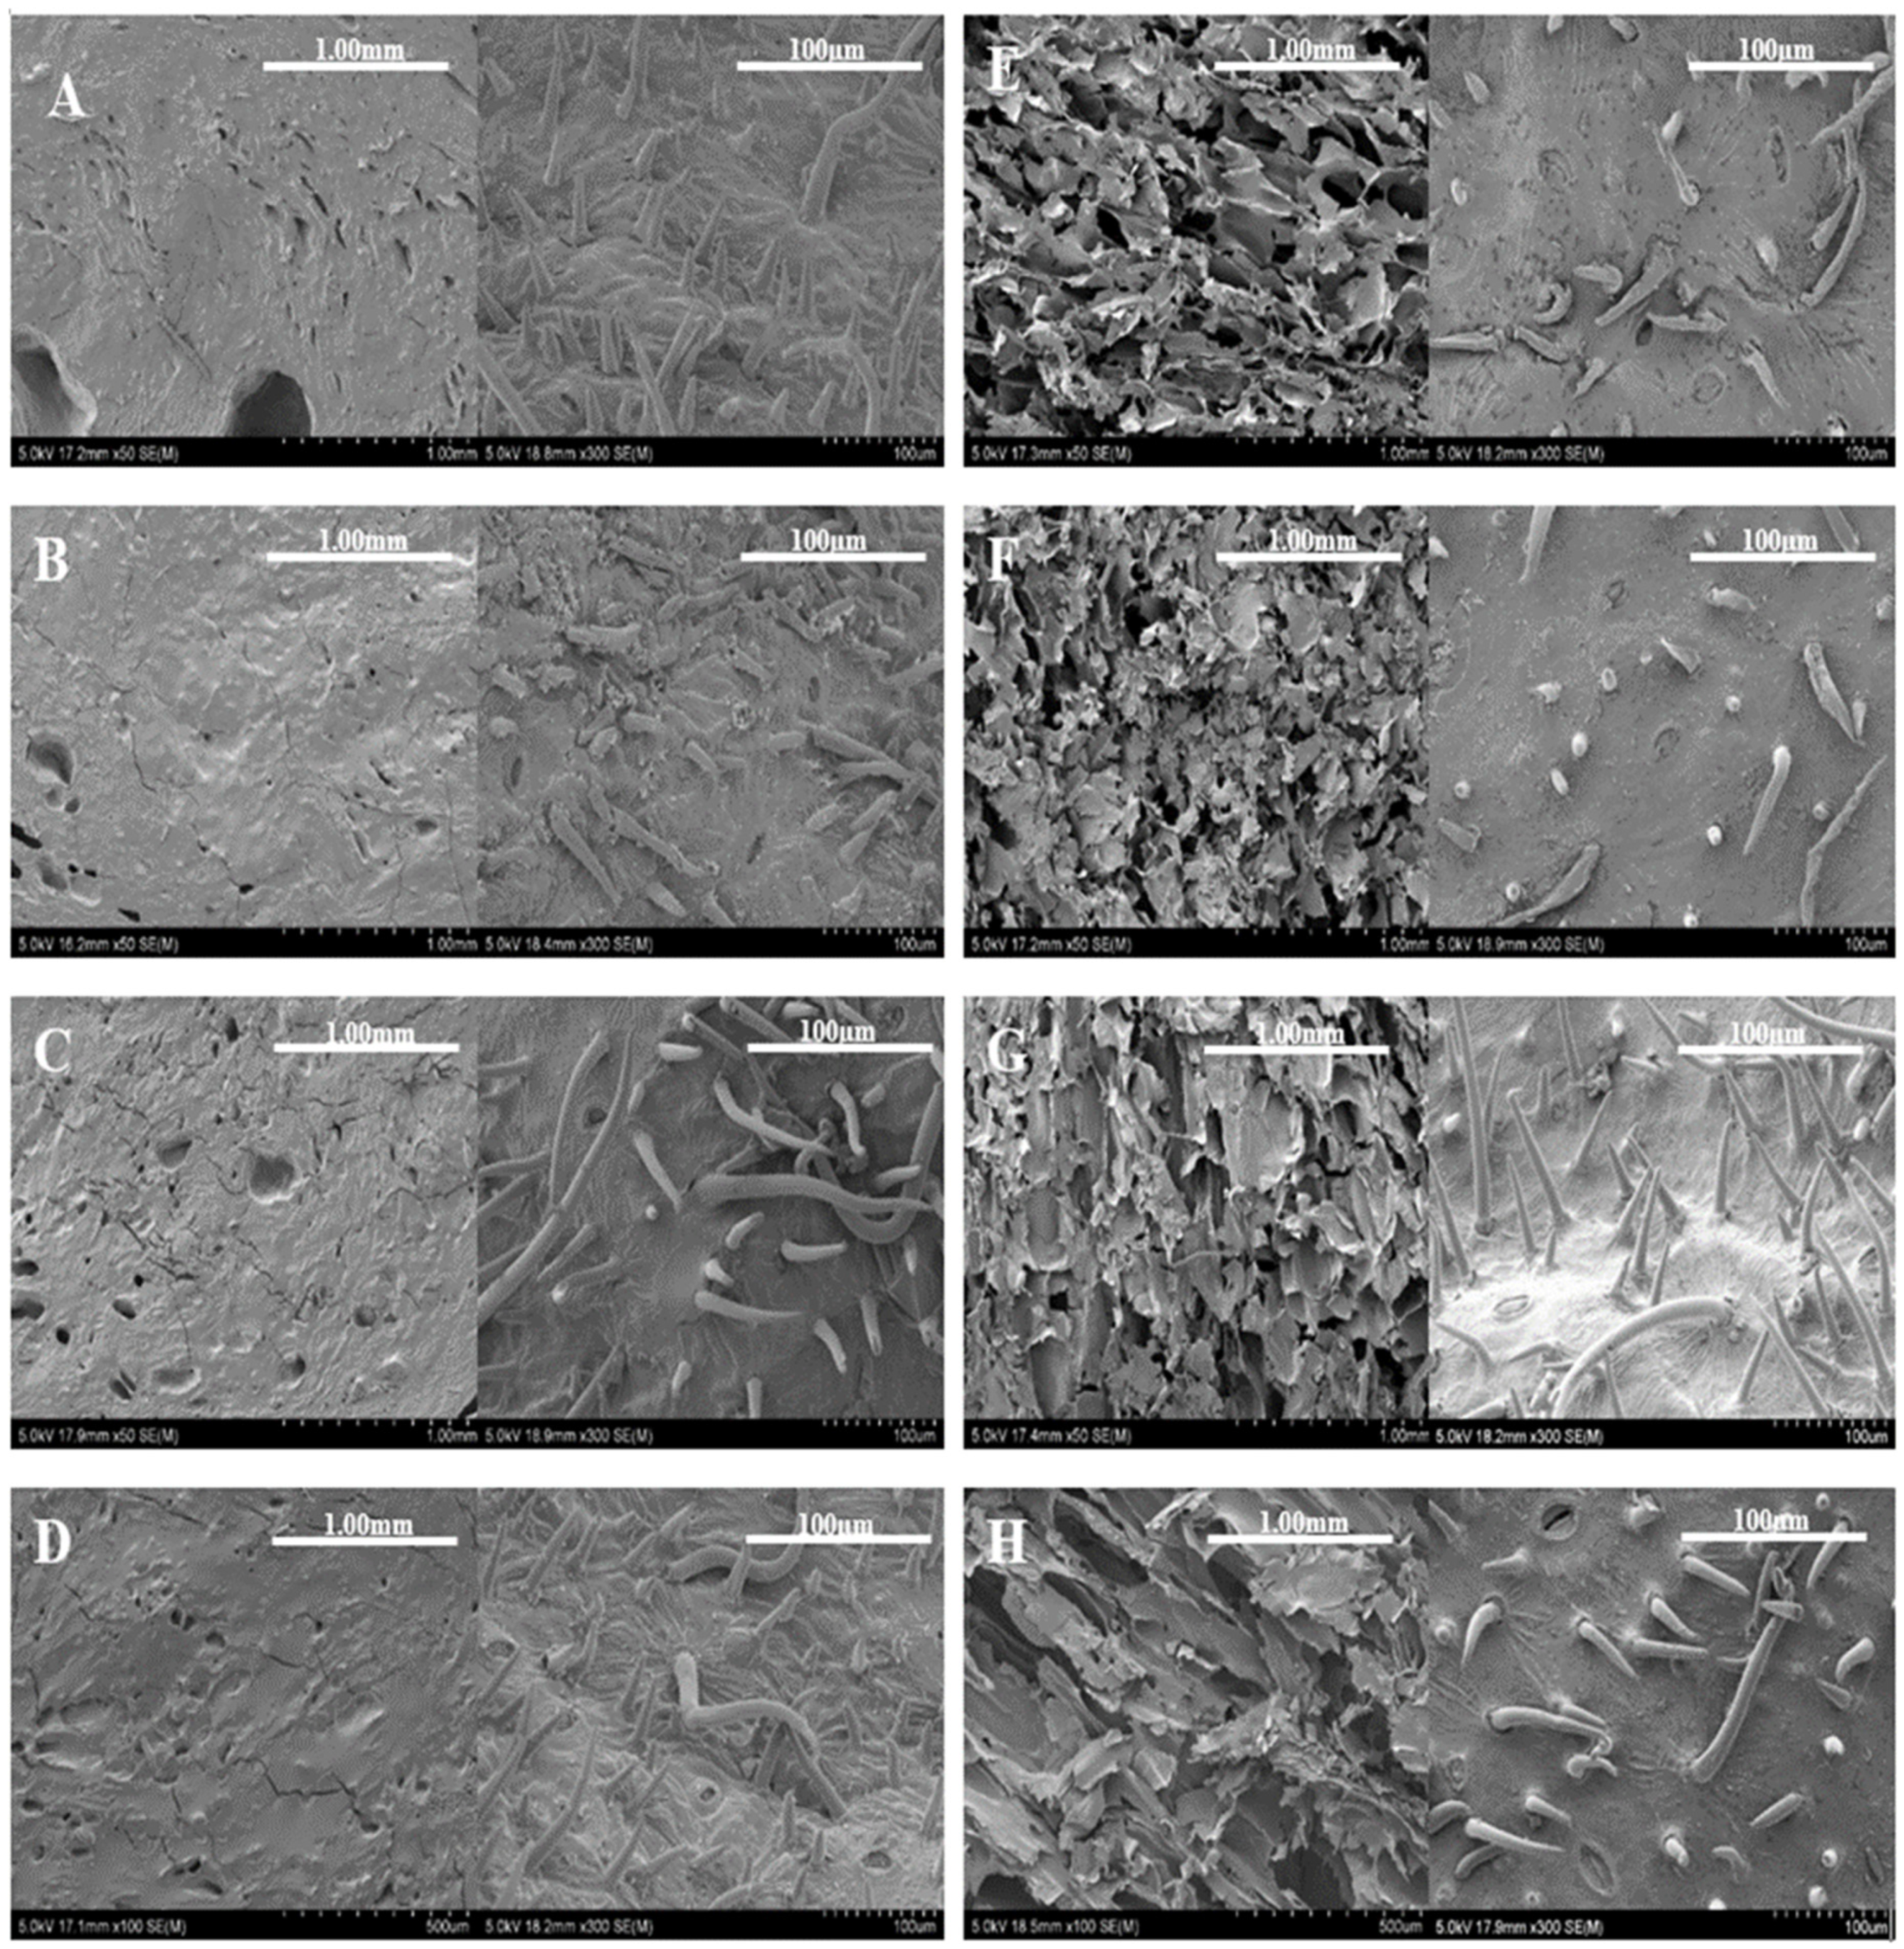
3.3. Scanning Electron Microscopy (SEM) Imaging and Analysis

Figure 1 shows the microstructure of dried apricot flesh and skin surface (A–H) after PEF pretreatments at low, medium, and high PEF intensities. During the drying process, water loss and segregation of components can result in rigidity of the cell walls. The extent of damage to the cellular walls will differ. Depending on the drying methods used, cellular wall collapse may also occur [37]. Overall, the PEF pretreatments and drying methods did not have much effect on the surface of apricot skin.
PEF pretreatments did not have a significant impact on the microstructure of air−dried apricot samples. Microstructure of air−dried apricot samples (Figure 1A–D, pulp) showed that the observed changes in structure were mainly attributed to the drying process. Specifically, the apricot flesh was tightly packed together and shrunk during the air−drying process. No noticeable differences were observed in the microstructure of different PEF−pretreated samples (Figure 1B–D, pulp) compared to the control sample (Figure 1A). Air drying caused the collapse of fruit structure. This collapse occurs due to significant moisture gradients within the product, leading to microstructural stresses that cause most of the capillaries to collapse and result in irreversible structural changes [38].
The microstructure of freeze−dried apricot samples (Figure 1E–H, pulp) showed that these samples exhibited better retention of shape, volume and honeycomb structure of apricot flesh compared to air drying. The structures of freeze−dried samples were similar, with more visible pores. This is likely due to the quick−freezing step in the freeze−drying process, which helps protect the food structure and shape, resulting in minimal volume reduction [39]. Apricot flesh with intact cytoplasmic membranes and cell walls naturally has a honeycomb structure [40]. The extent of structure collapse increased with increasing electric field strength in PEF pretreatment of the fruit (Figure 1E–H, pulp). Additionally, the cell wall structure collapsed more with increasing PEF strength, resulting in an increase in pore size. This finding is consistent with previous studies on PEF−pretreated freeze−dried apples, which also reported an increase in pore size with increasing PEF strength [12,41].

3.4. Chemical Analysis

3.4.1. Antioxidant Activities

Antioxidant results using the FRAP and CUPRAC assays varied (Table 4). The antioxidant values using the CUPRAC assay were higher in dried apricots compared to the FRAP assay for all treatments. This could be due to differences in reactions of the different assays. FRAP assay produced lower antioxidant values than the CUPRAC assay [42]. This is because the FRAP method is not fast enough to oxidize certain thiol−type antioxidants. Additionally, the FRAP assay is conducted at an unrealistic acidic pH (pH = 3.6), whereas the CUPRAC assay is conducted at a physiological pH (pH = 7). In acidic conditions, the reducing capacity may be suppressed due to protonation of antioxidant compounds, which can further contribute to the lower antioxidant values obtained from the FRAP assay.
PEF pretreatments resulted in significantly higher antioxidant values in freeze−dried samples compared to air−dried samples using the FRAP assay. Previous study also reported a significant increase in antioxidant activity using the FRAP assay for PEF−treated apricots [7]. However, the CUPRAC assay showed the opposite trend with significantly lower antioxidant values in freeze−dried samples compared to air−dried samples with the same level of PEF pretreatment. This may be due to the heat produced during air drying that promotes the synthesis of new antioxidant compounds [43]. Papoutsis et al. [44] found that increasing the drying temperature resulted in higher antioxidant capacity of lemon samples, with air−dried and vacuum−dried samples showing significantly higher antioxidant values than freeze−dried samples.
High−intensity PEF treatment resulted in significantly higher antioxidant values compared to low−intensity PEF treatment and control samples using the CUPRAC assay. The intensity and duration of the PEF treatment play a significant role in the process. High−intensity treatments can cause greater cell disruption, potentially releasing more antioxidants or leading to oxidative stress, which may degrade antioxidants [9]. Variations in frequency and pulse width can affect the amount of stress applied to the fruit cells, and the different settings can result in varying impacts on antioxidant levels (Timmermans et al., 2019). Previous studies have reported that increasing PEF intensity can enhance antioxidant activity of blackcurrant [7,45,46]. In addition, all PEF−pretreated samples that were freeze dried showed a significant increase (p < 0.05) in antioxidant values using the FRAP assay compared to control samples. Vuong et al. [47] found that the antioxidant values of freeze−dried chasteberry (Vitex agnus−castus) leaves using both the FRAP and CUPRAC methods were significantly higher than those of oven−dried samples.

3.4.2. Total Phenol Content (TPC)

Table 4 summarizes the TPC results of PEF−pretreated dried apricots, with values ranging from 0.445 to 0.527 mg GAE/g for air−dried samples and 0.466 to 0.576 mg GAE/g for freeze−dried samples. Only high−PEF pretreatments significantly (p < 0.05) increased the TPC of air−dried samples compared to control and low−PEF−treated samples. PEF treatment can help improve the extraction of TPC from date palm fruits due to the permeabilisation of the cell membrane, which can enhance mass transfer [48]. The permeabilisation of plant cells caused by PEF treatments can enhance the intracellular content extraction of various plant products, including orange juice [49], almond extract [50] and date juice [51]. However, for freeze−dried samples, PEF pretreatments resulted in no significant differences in TPC compared to the control samples.

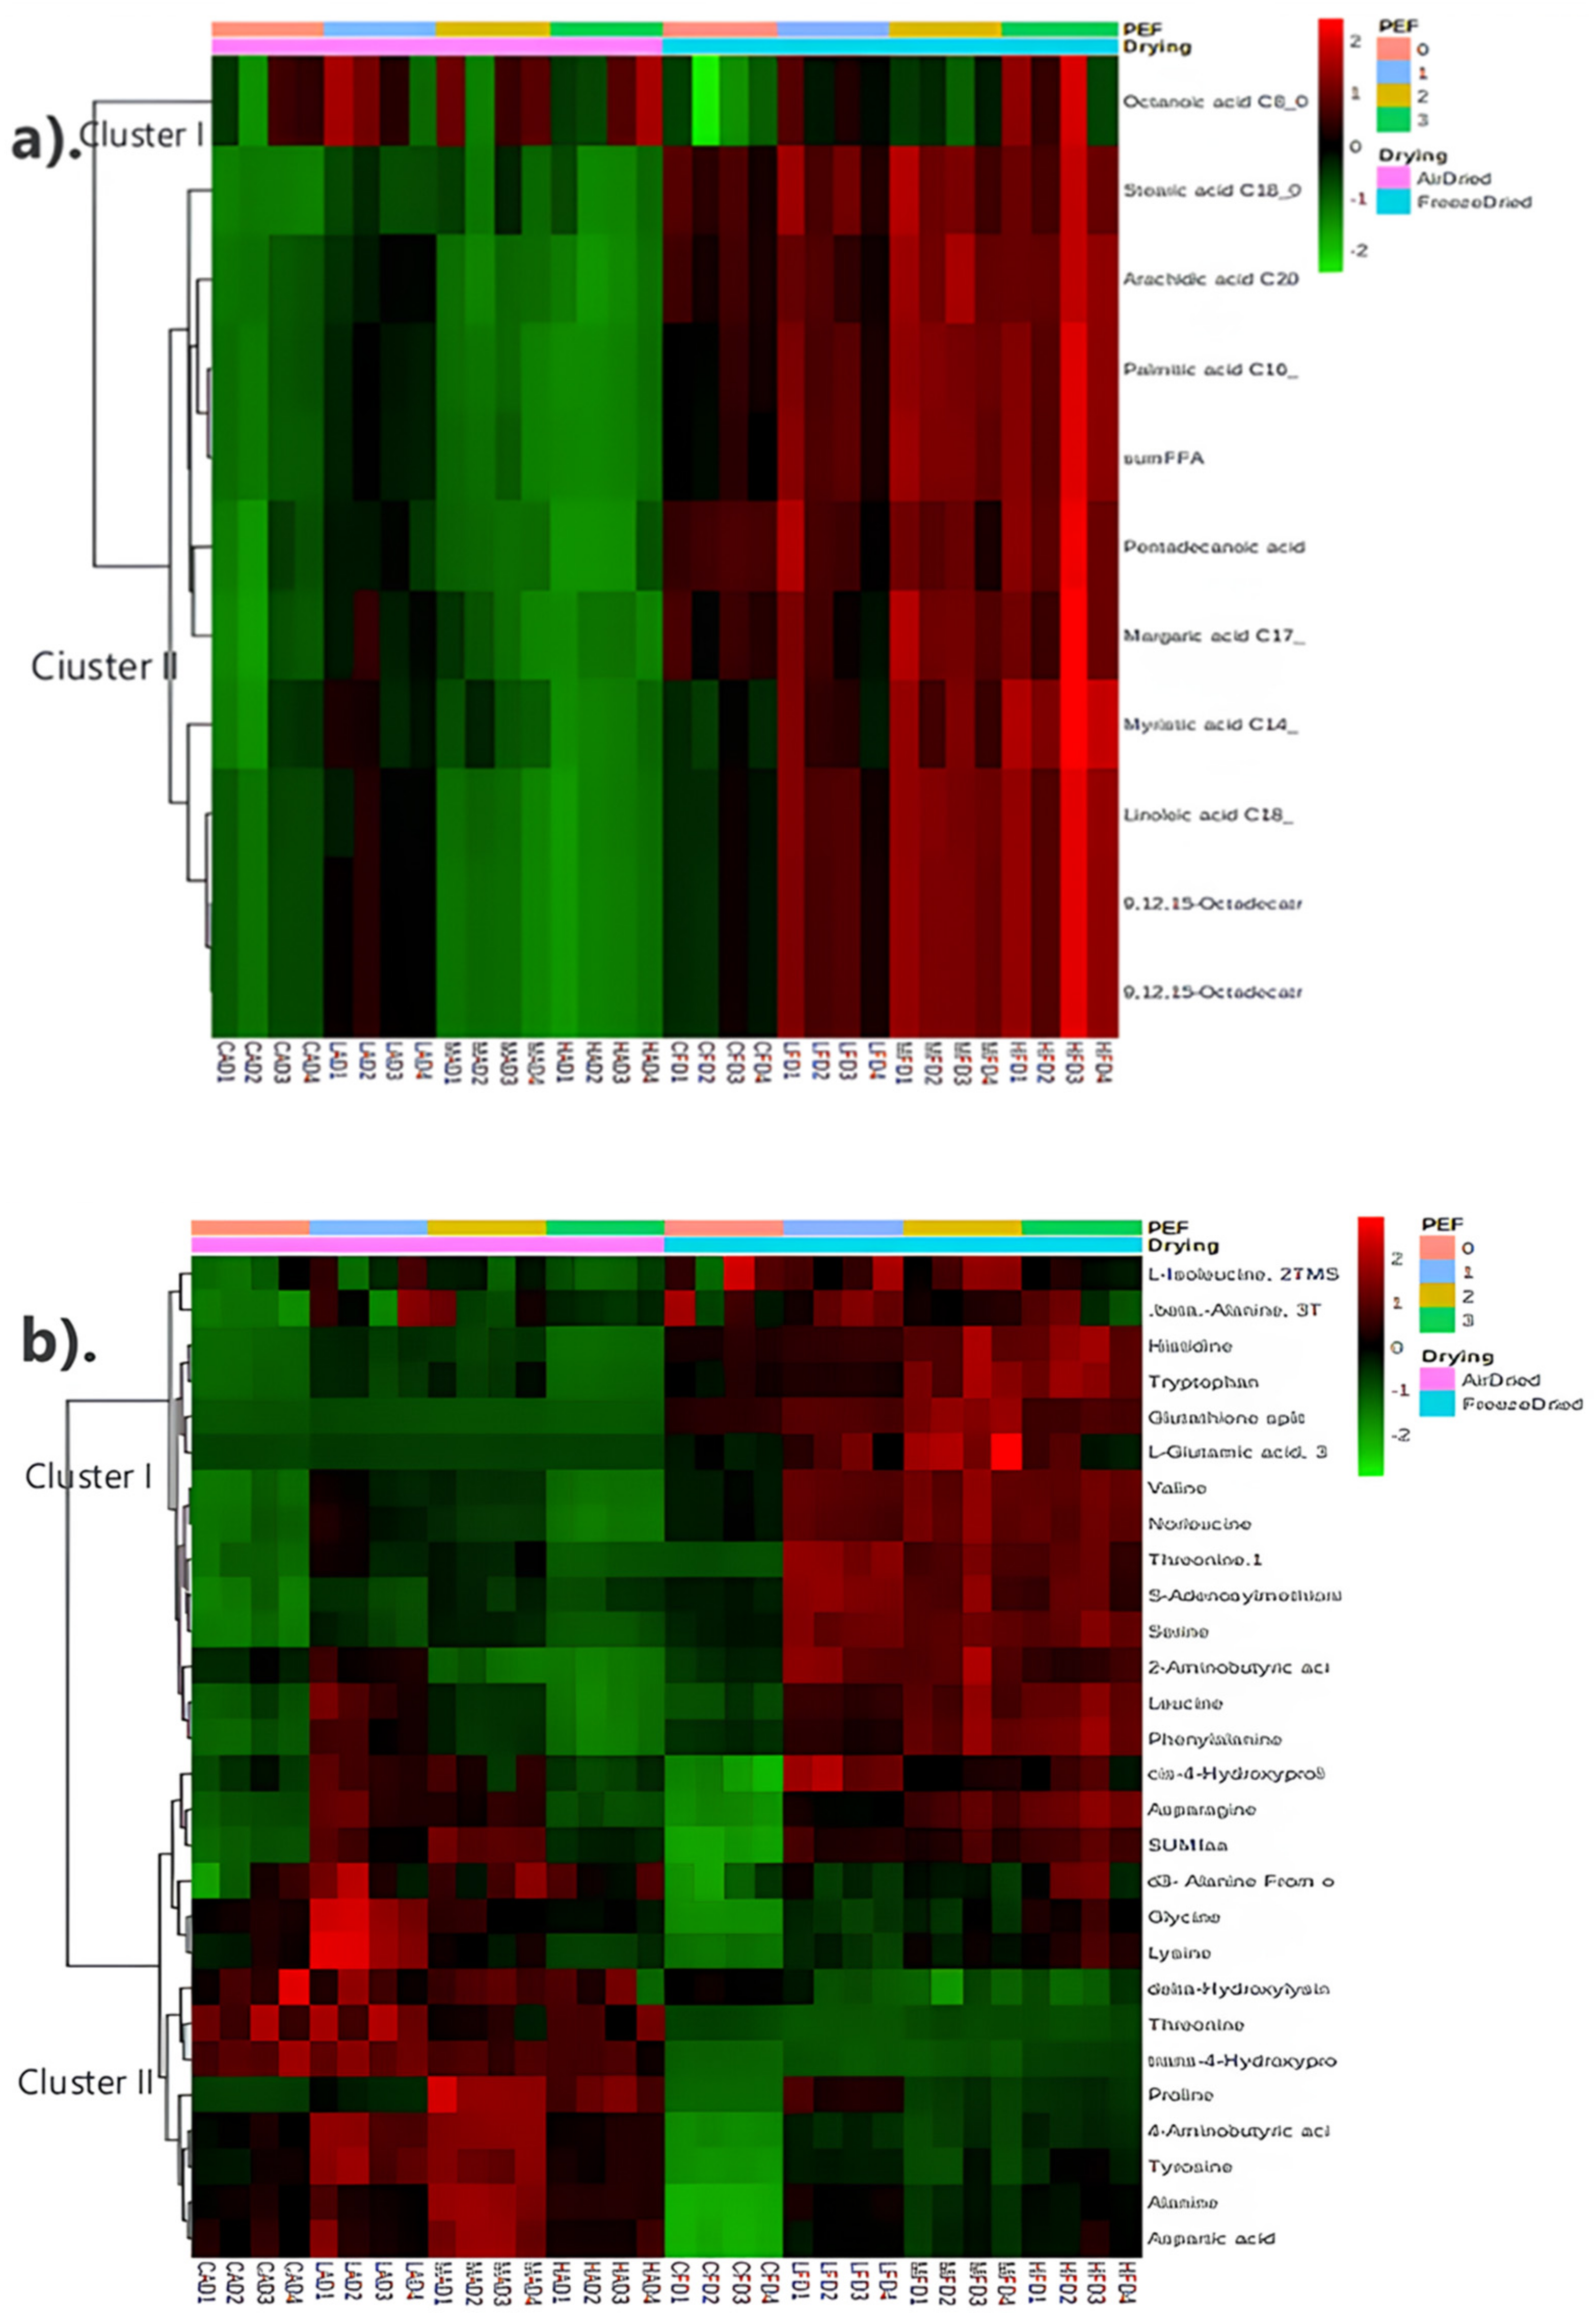
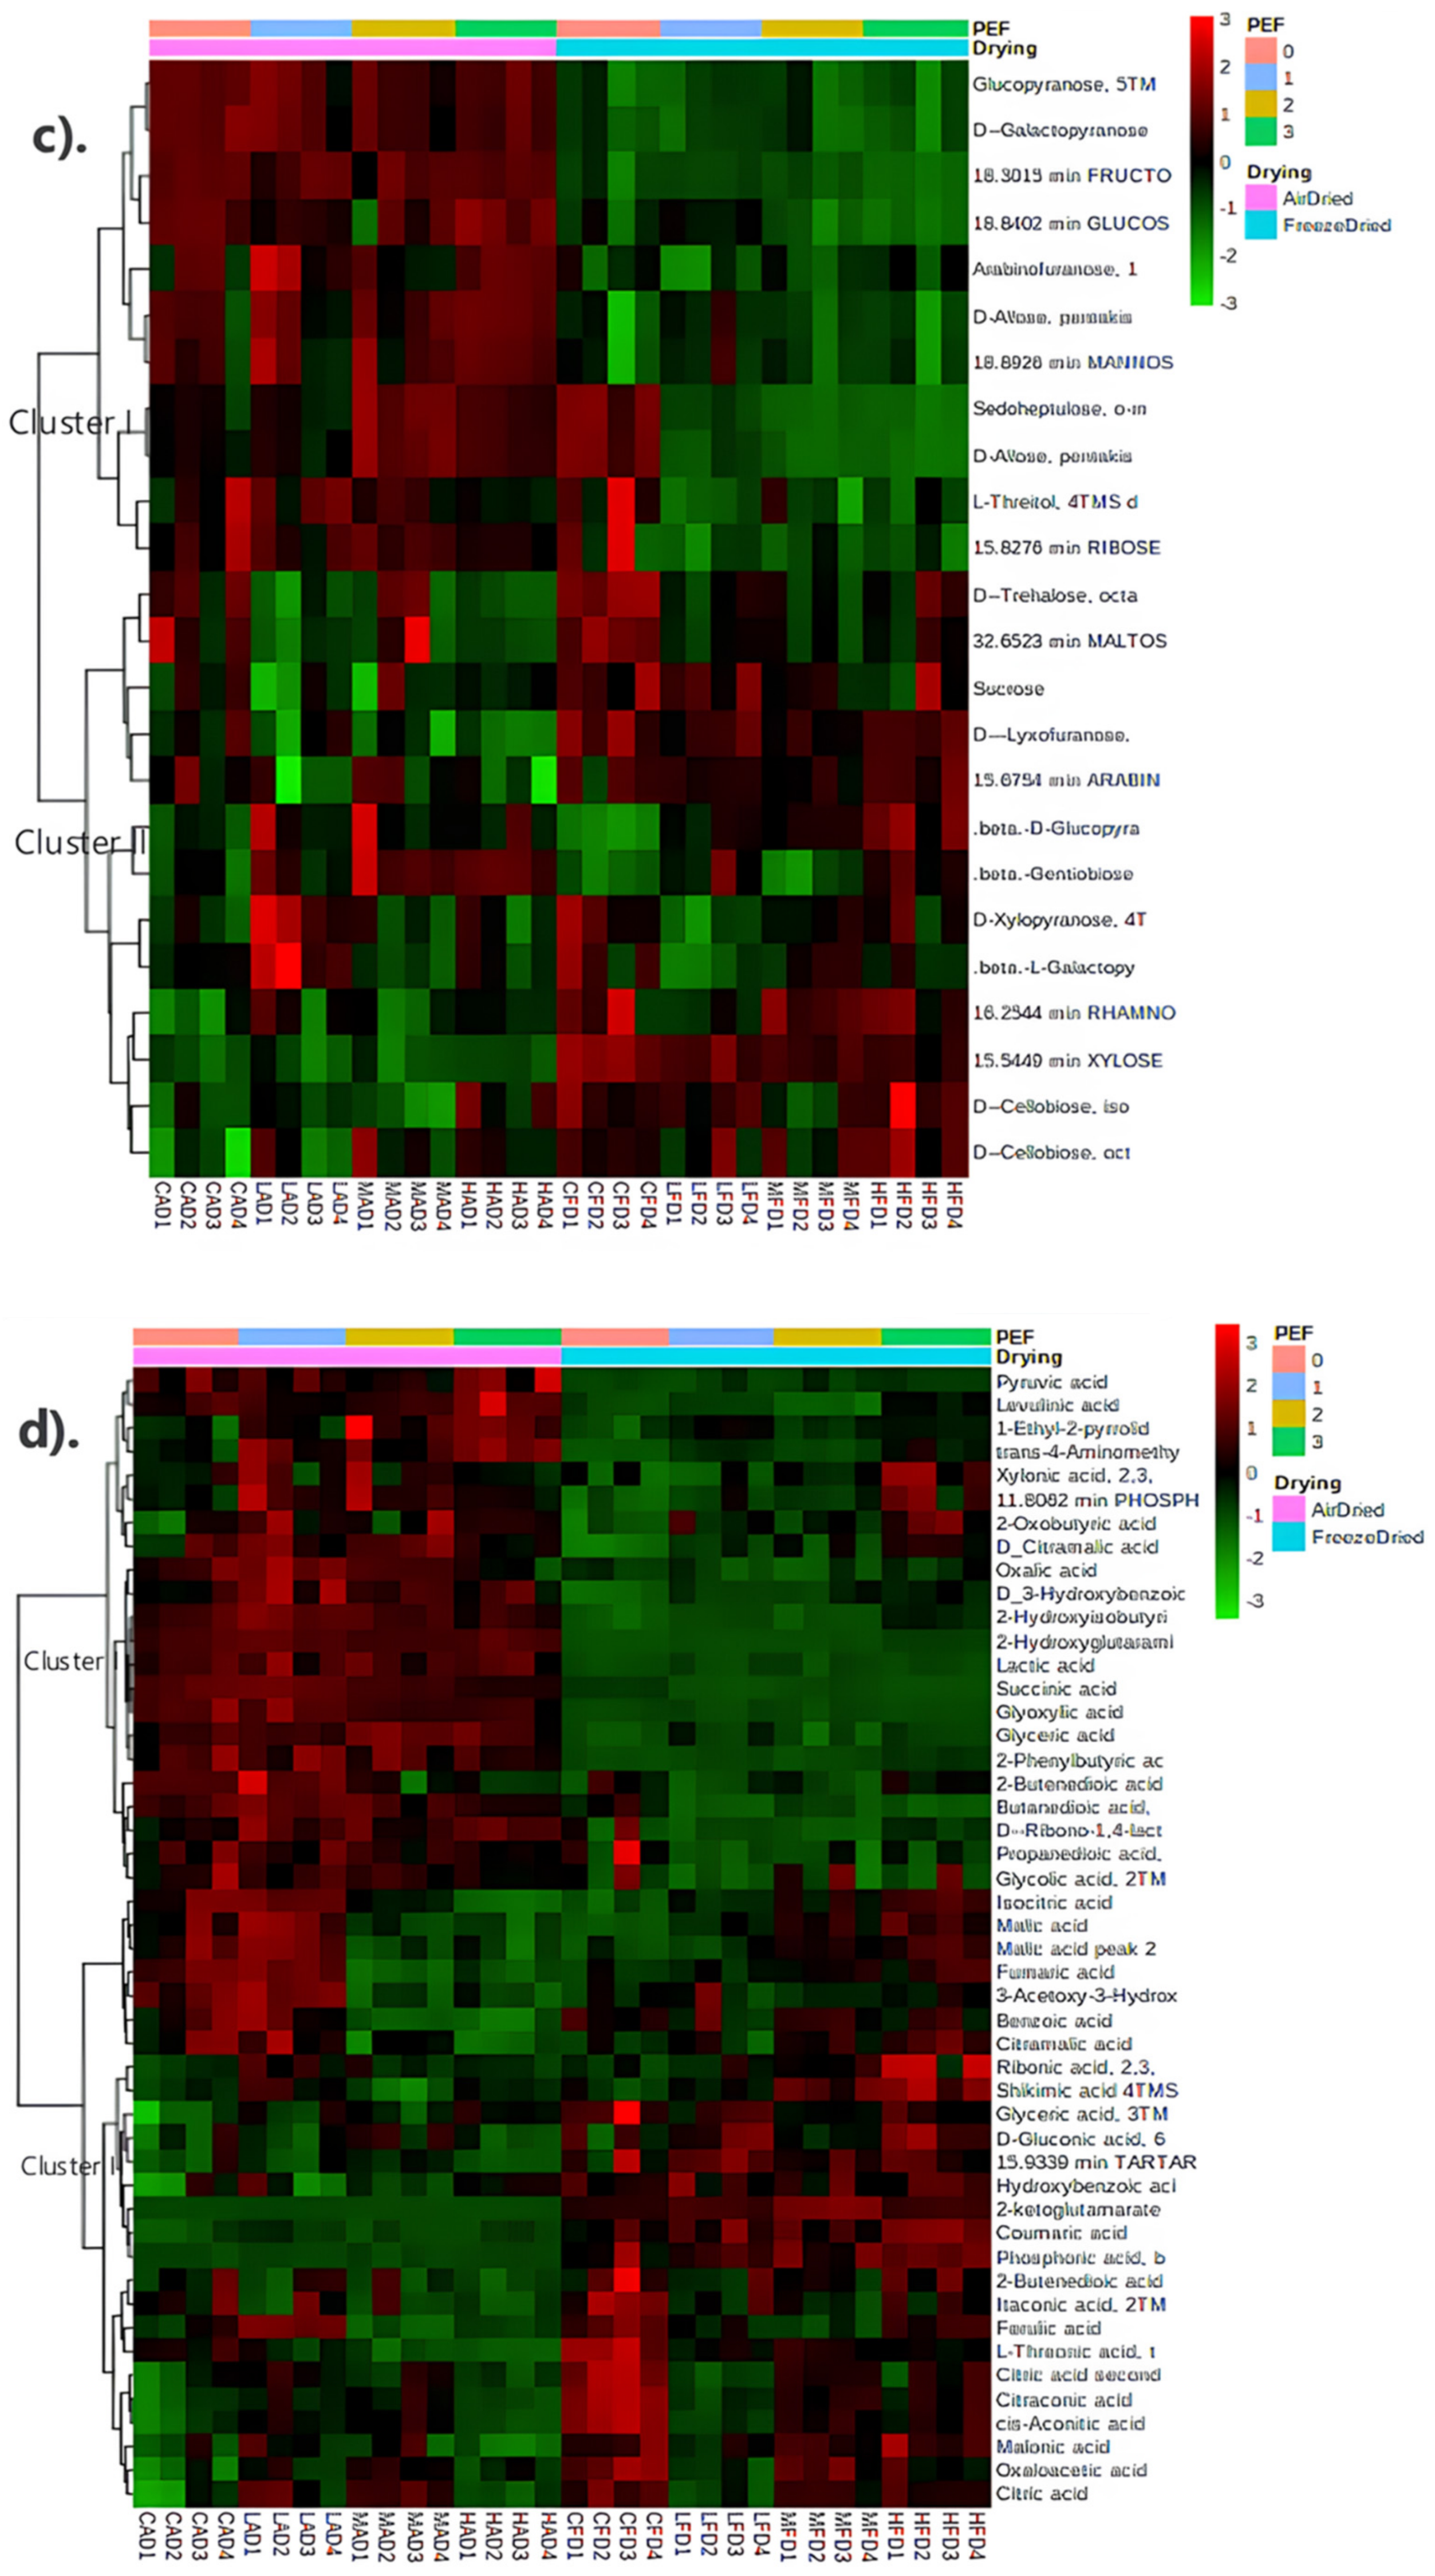
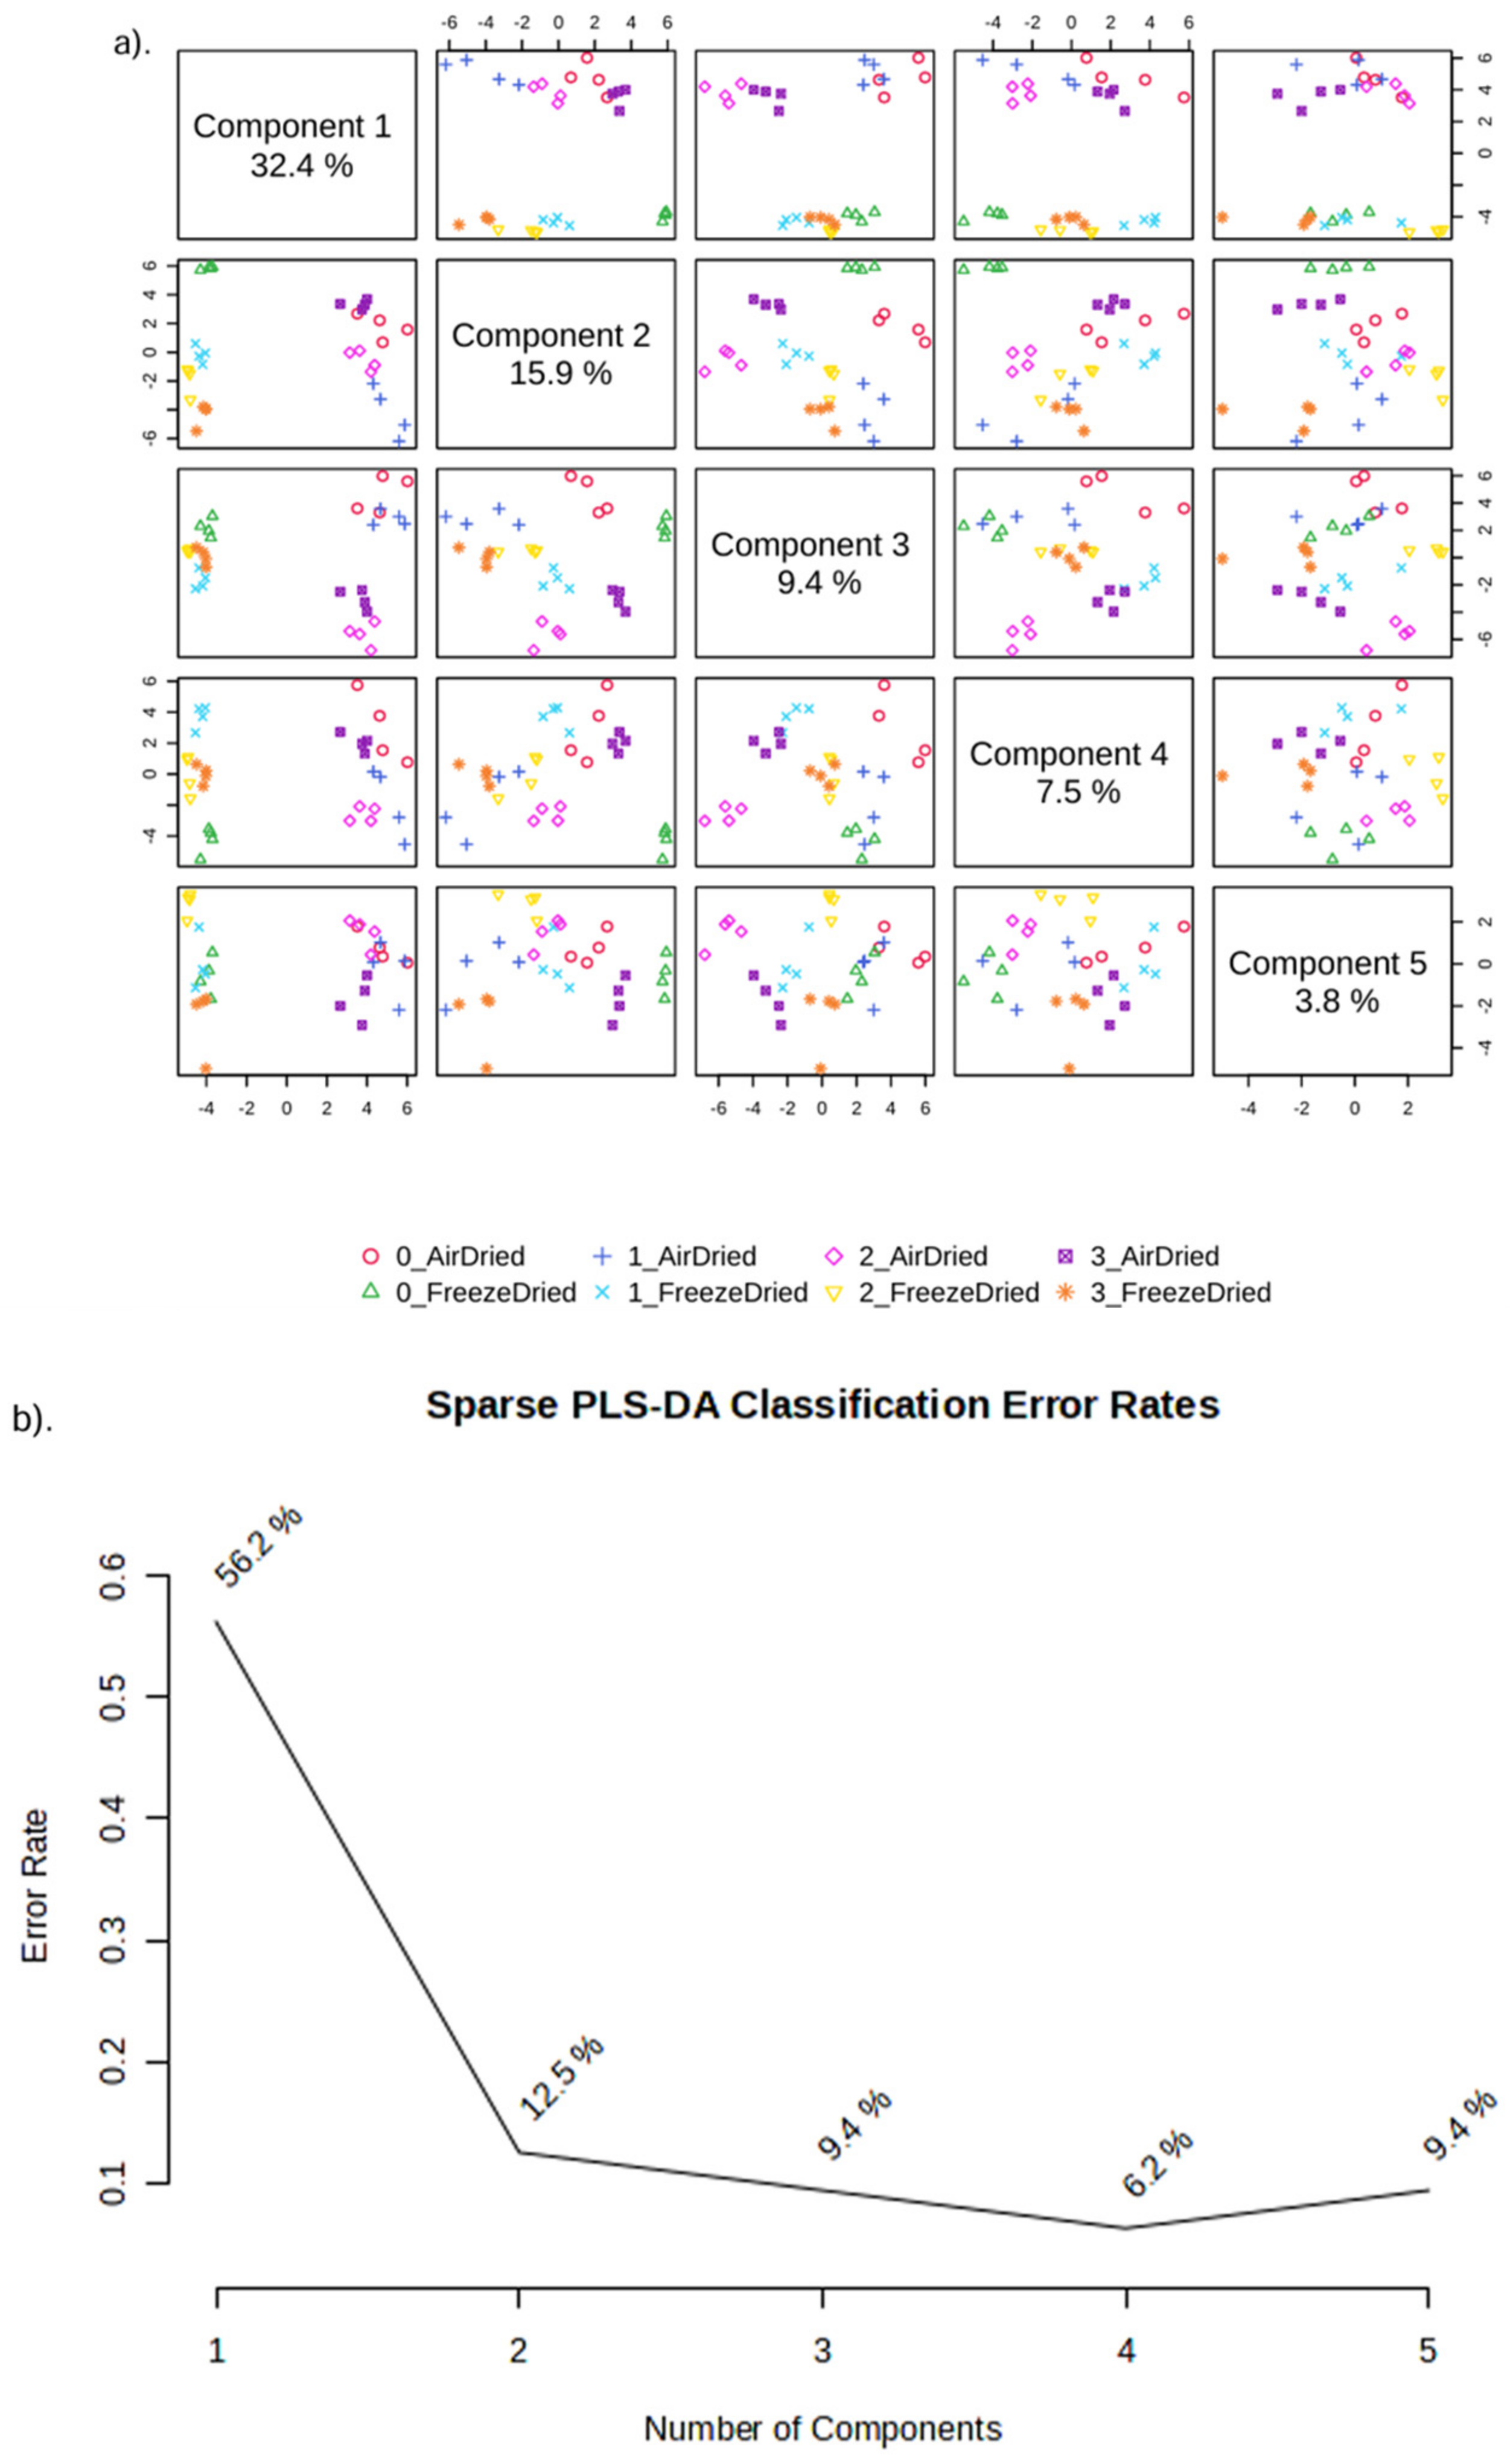
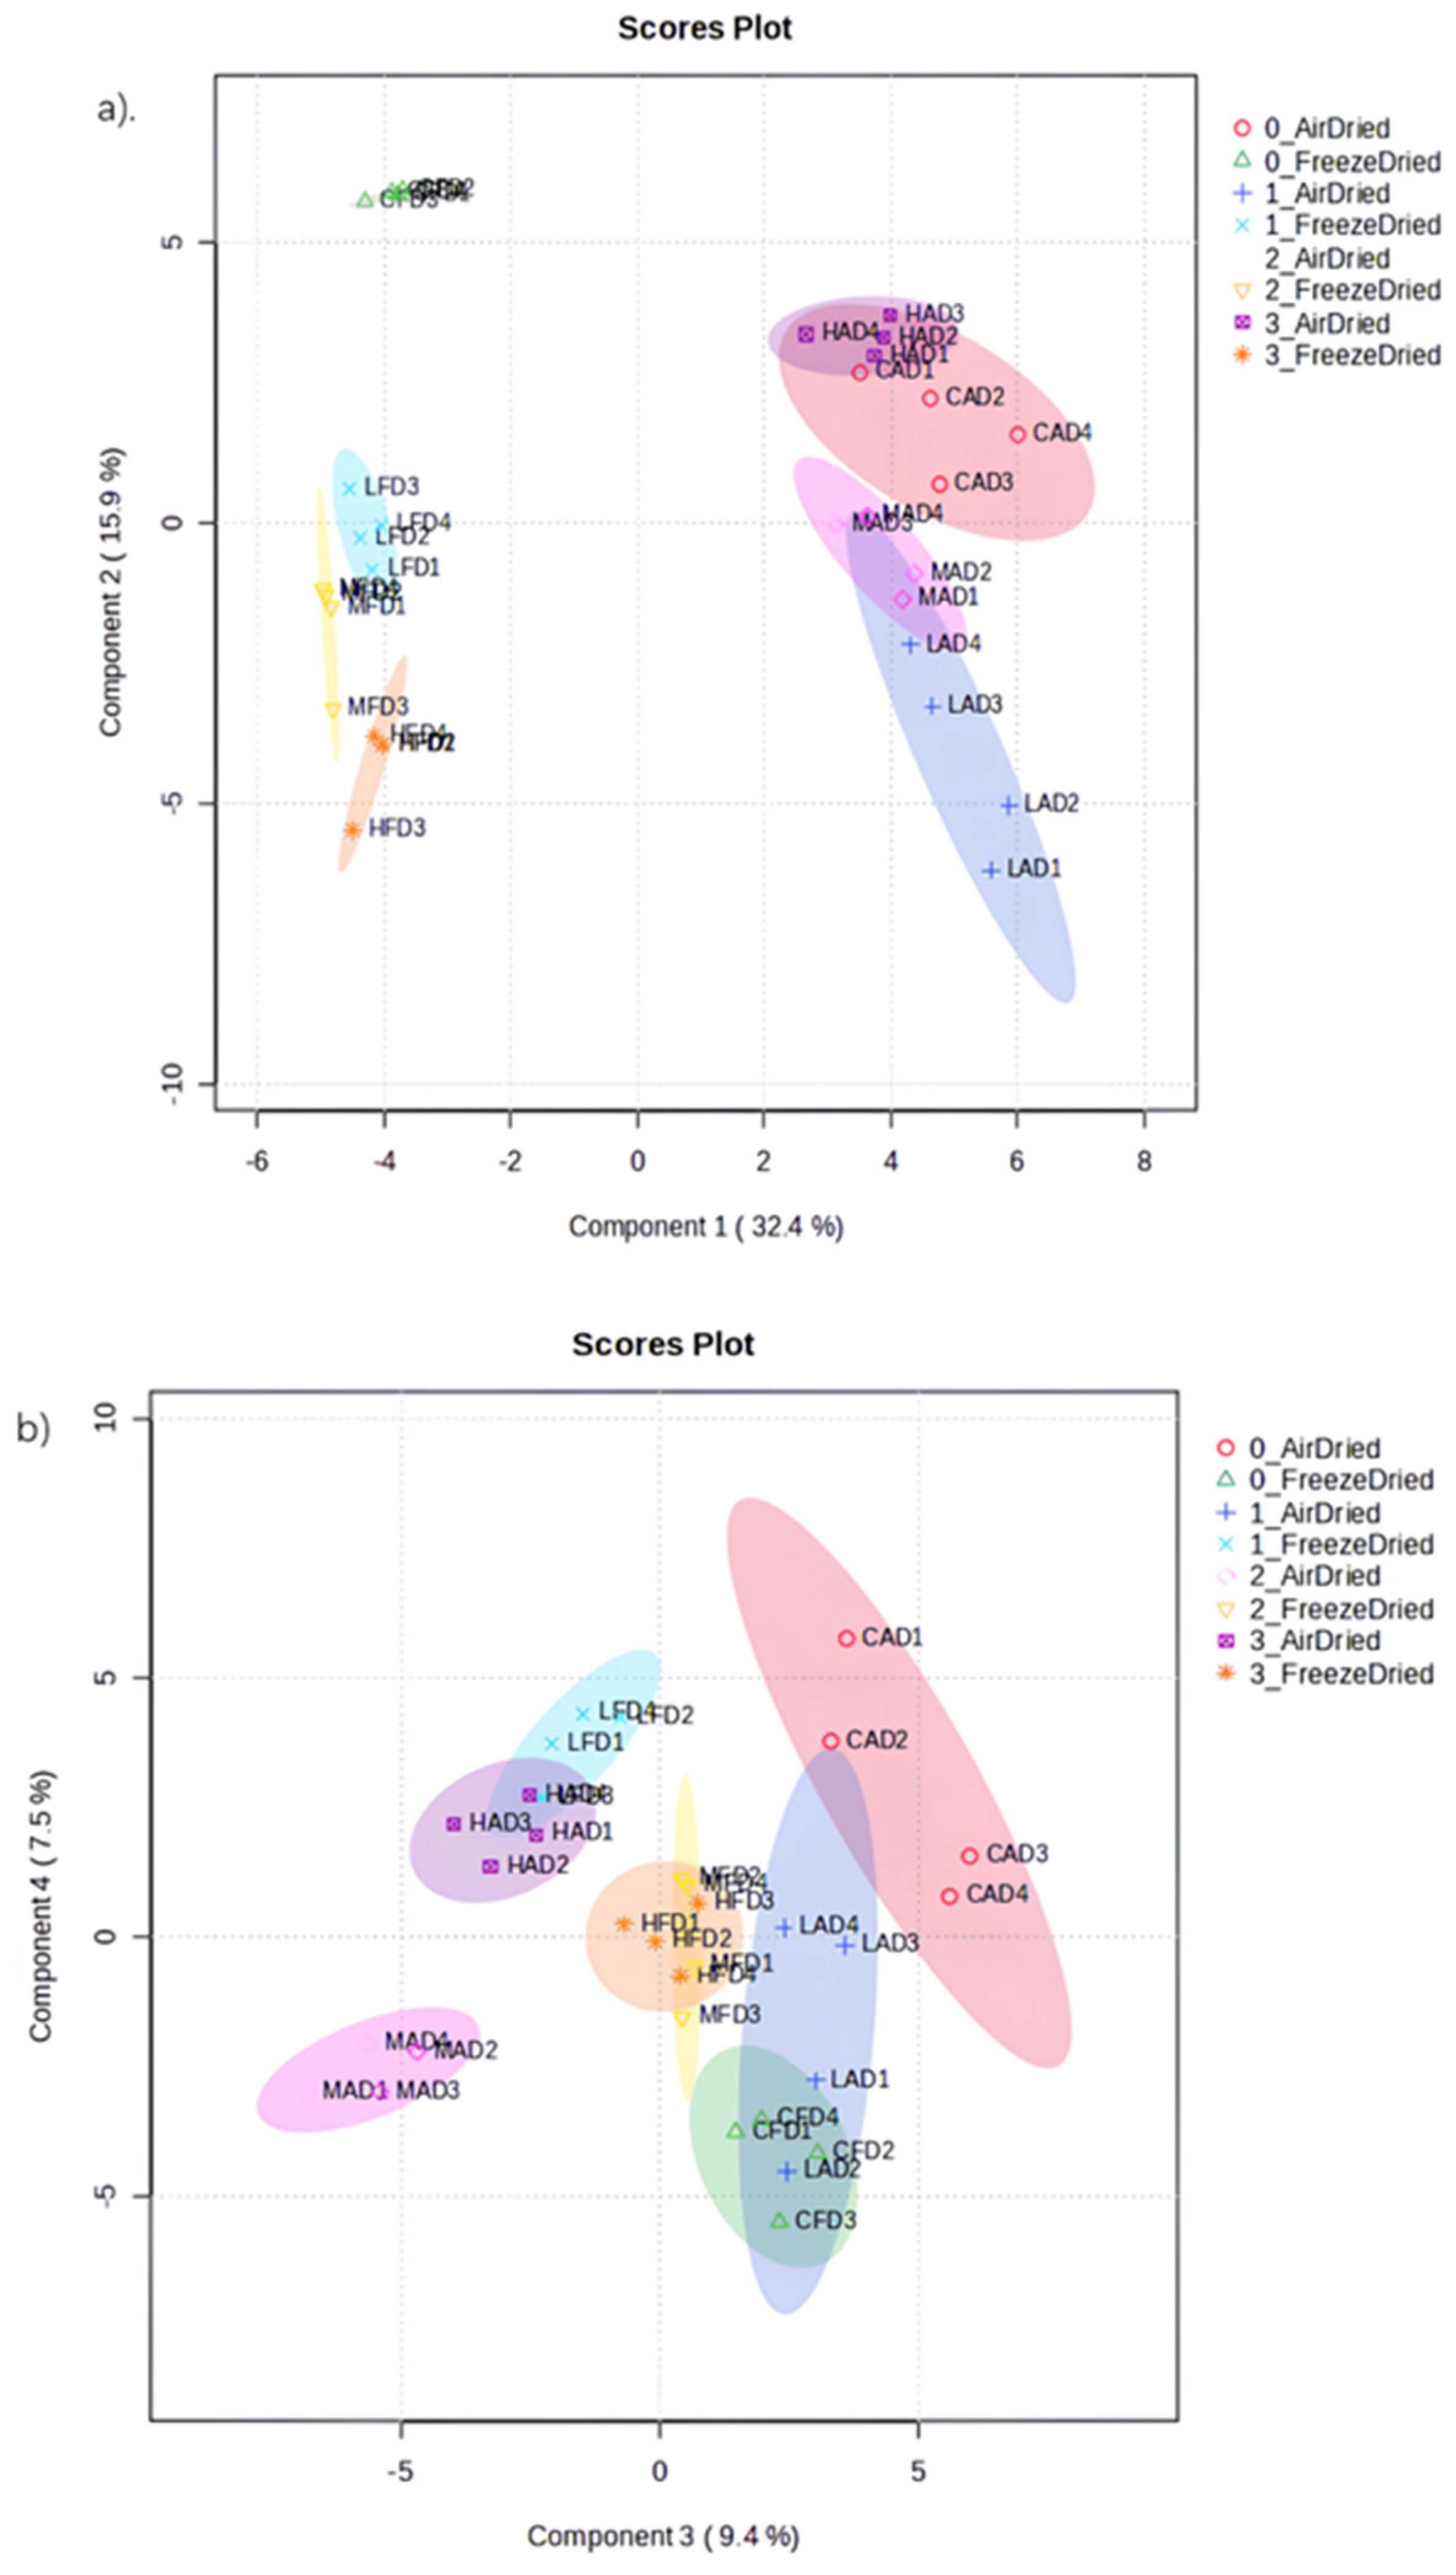
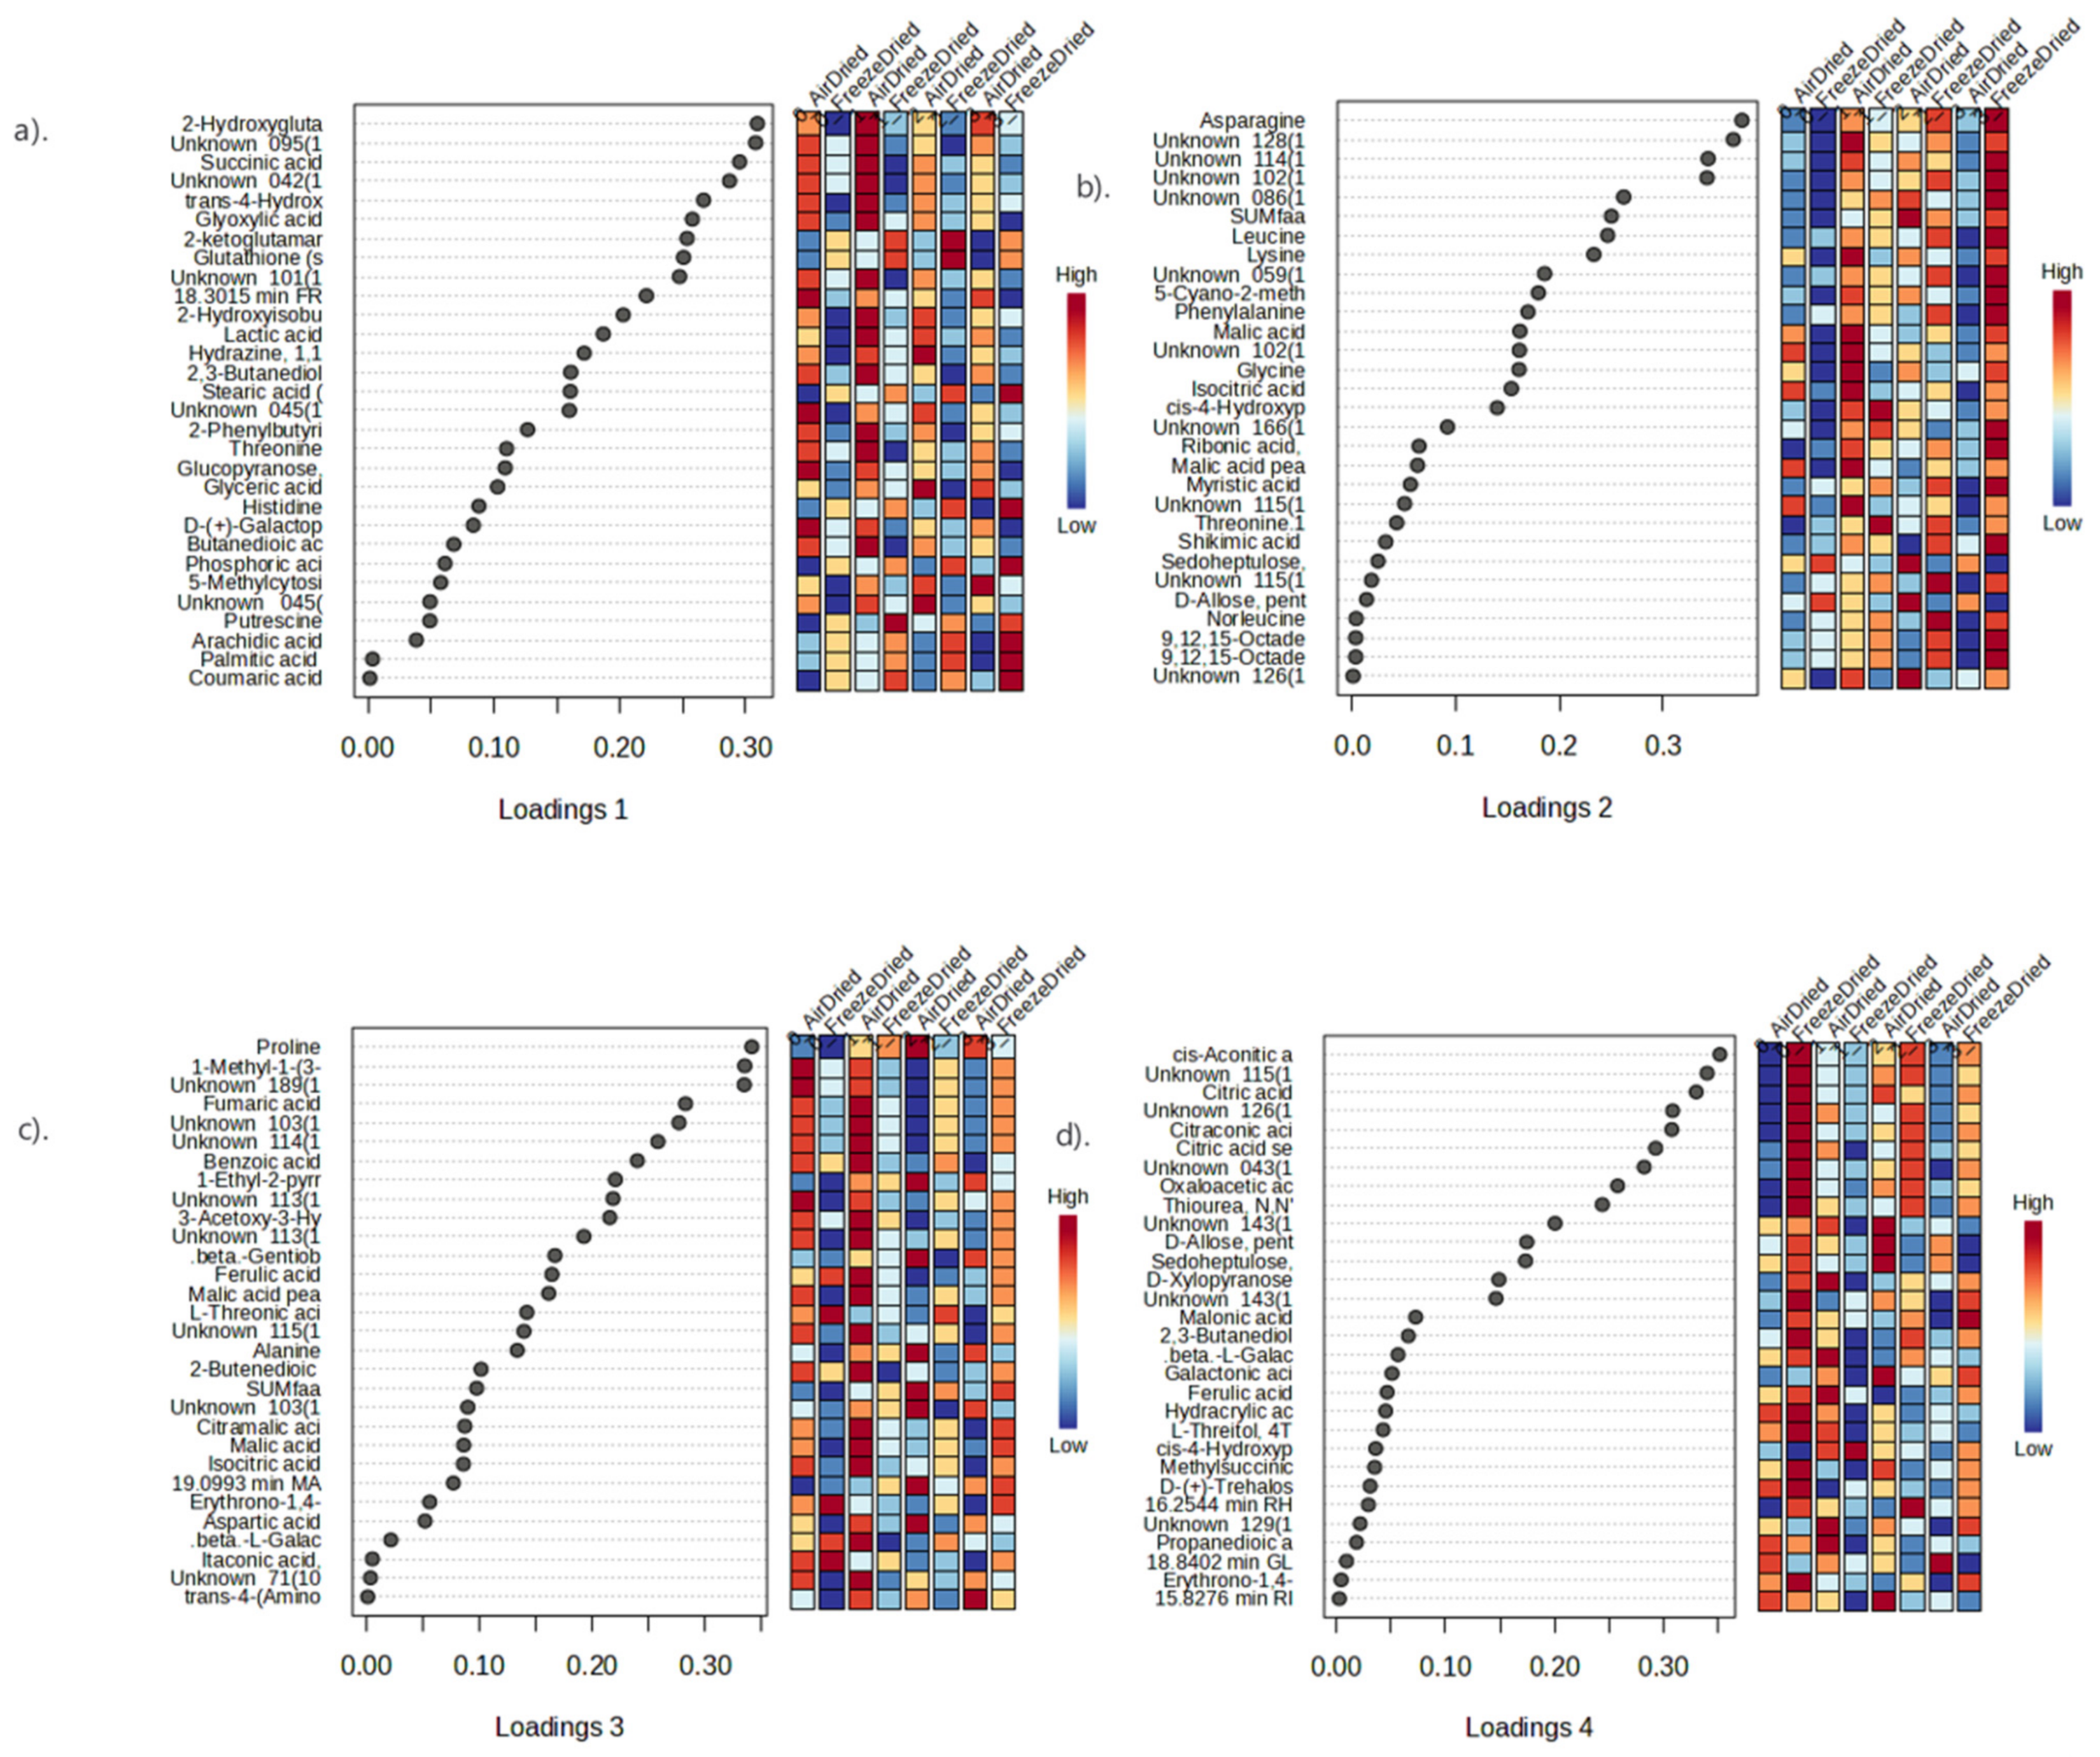
3.4.3. Metabolite Profiling

Heat maps showing the mean intensities of different metabolites as a function of the effect of PEF pretreatment on apricots that were subsequently air or freeze dried are presented in Figure 2. In Figure 2a, two distinct clusters of fatty acids differentiated air− and freeze−dried samples. The freeze−dried samples had significantly higher levels of fatty acids compared to the air−dried samples. Freeze drying is more effective in preserving the nutritional content and functional components of fruits compared to air drying [52]. Freeze drying retains more fatty acids in fruits compared to air drying. A study on lemon juice vesicles reported a loss of 67.68% in total fatty acids after air drying, 53.00% in conventional freeze drying and 36.95% in integrated freeze drying [53]. Additionally, most fatty acid levels increased with increasing PEF intensity. This could be attributed to enhanced cell permeabilization with increasing PEF intensity, which promotes the release of bioactive components in plant tissues [9]. However, there are limited studies that specifically focus on the changes in fatty acid content of PEF−pretreated fruit. PEF pretreatment of grape juice (35 kV/cm, bipolar 4 μs square pulses at 1000 Hz for 1 μs) did not result in a significant change in total fatty acids compared to the control group [23]. However, in terms of free fatty acids, no significant changes were observed except for lauric acid that decreased compared to the control group.
According to the findings presented in Figure 2b, the drying techniques used resulted in two major clusters of amino acids. The amino acids in cluster I were more abundant in freeze−dried samples, while the amino acids in cluster II were higher in air−dried samples. In freeze−dried samples, PEF pretreatment led to significantly higher levels of amino acids compared to the control group. PEF technology has been shown to influence the amino acid content of fruits and vegetables [23,54]. Zhao et al. [54] reported a significant (p < 0.05) increase in total free amino acids, especially theanine, in green tea treated with PEF (20–40 kV/cm, 200 μs). Likewise, an increase (p < 0.05) in individual amino acids such as histidine, tryptophan, asparagine, phenylalanine and ornithine in grape juice after PEF treatment was observed [23].
In cluster I shown in Figure 2c, sugar content in air−dried samples showed significantly (p < 0.05) higher sugar content than freeze−dried samples. This was confirmed by a study on lemon juice vesicles, which reported that air drying resulted in the highest total soluble sugars (17.12 ± 0.20 mg/g), which were 1.24 and 1.49 mg/g higher than those of integrated freeze drying (IFD) and conventional freeze drying (CFD), respectively [55]. These findings suggest that air drying may better preserve the sugar content in some fruits.
Figure 2d further differentiated dried apricot samples in terms of organic acid content based on the drying methods. Cluster I exhibited higher levels of organic acids in air−dried samples, while cluster II showed higher levels of organic acids in freeze−dried samples. This highlights the different impacts of freeze drying and air drying on the organic acid composition of fruits. A study on European cranberry found that lyophilized fruit had significantly higher levels of organic acids compared to fruit dried at temperatures of 35–40 °C [56]. The largest relative difference was observed in the case of ascorbic acid, with the content in the high−temperature−dried fruit averaging 5 mg/100 g of dry matter (DM), representing a 42% decrease compared to the lyophilised material. Other organic acids (quinic, citric and malic acids) exhibited an average difference of 0.9–2.1 g/100 g DM (14–17%). On the other hand, in the case of air drying, drying of gilaburu fruits at different temperatures (50, 60 and 70 °C) resulted in a significant loss of organic acids and other bioactive components, with the highest loss observed at 70 °C [57].
Sparse partial least squares–discriminant analysis (sPLS−DA) was applied to summarize the metabolite differences between the control and the PEF−pretreated (at low, medium, and high PEF intensities) apricot samples that were subjected to either air drying or freeze drying. Figure 3a,b illustrate that four components were sufficient to explain the dataset, with a 6.2% error rate in classification of the samples.
In Figure 4a, the first two latent variables explained 32.4% of the variation in the X data and 15.9% of the variation in the Y data. For component 1, the air−dried sample had a high positive score and was separated from the freeze−dried sample that had a high negative score. Furthermore, PEF−treated freeze−dried samples, especially those treated at high PEF intensities, had high negative scores for component 2 and were further separated from control freeze−dried samples that had a high positive score.
The loadings depicted in Figure 5a, and the ANOVA results (Appendix A) showed significant changes (p < 0.05) in three amino acids (threonine, trans−4−hydroxyproline and histidine) and a tripeptide (glutathione) depending on the method of drying. Threonine and hydroxyproline levels were significantly higher in air−dried samples, while the other amino acids were significantly higher in freeze−dried samples. Fatty acids (palmitic acid, stearic acid and arachidic acid) were all significantly higher in freeze−dried samples. Among the organic acids, only coumaric acid, 2−ketoglutamaric acid and phosphoric acid were significantly higher in freeze−dried samples, while the other organic acids were all significantly higher in air−dried samples. As for sugars, glucopyranose, galactopyranose and fructose were all significantly higher in air−dried samples. Similarly, Xie et al. [55] reported that air drying led to a significantly higher total amino acid content compared to integrated freeze drying (IFD) and conventional freeze drying (CFD). In addition, CFD resulted in the notably highest total organic acid content, while air drying (AD) contributed to the notably highest total soluble sugar content.
The loadings depicted in Figure 5b and the ANOVA results (Appendix A) showed significant changes in metabolites in the freeze−dried, high−PEF−treated sample compared to the non−PEF−treated freeze−dried control sample. All amino acids (glycine, leucine, norleucine, threonine, asparagine, cis−4−hydroxyproline, phenylalanine and lysine) were significantly higher in the high−intensity PEF−treated freeze−dried sample compared with the non−PEF freeze−dried control sample. Previous study reported that the total free amino acids abundant in PEF−treated alcoholic beverages made of date palm fruits were significantly (p < 0.05) higher than in the untreated control. Increasing PEF intensity (2.92 > 2.02 > 1.38 kV/cm) led to a corresponding increase in the production of free amino acids [23]. In addition, essential amino acids (arginine, histidine, leucine, isoleucine, lysine, phenylalanine and threonine) were also significantly (p < 0.05) higher in apricot samples treated with PEF at higher intensity (2.92 kV/cm) compared to control.
Myristic acid and octadecatrienoic acid, both fatty acids, were significantly higher in the high−intensity−PEF freeze−dried sample. Among the organic acids, D−citramalic acid, malic acid, isocitric acid, ribonic acid and shikimic acid were significantly higher in the high−intensity−PEF freeze−dried sample compared to the non−PEF freeze−dried control sample. However, sedoheptulose and D−allose sugars were significantly lower in high−intensity PEF−treated freeze−dried samples. Previous studies have shown that PEF treatment had no significant effect on saturated fatty acids and mono− and polyunsaturated fatty acids and only caused a slight decrease in total fatty acid content [23,58,59].
In Figure 4b, the first two latent variables explained 9.4% of the variation in the X data and 7.5% of the variation in the Y data. For component 3, the non−PEF−treated air−dried control sample had a high positive score and was distinguished from the medium−PEF−treated air−dried sample with a high negative score. The control freeze−dried sample, with a high negative score, was further separated from low−PEF−treated freeze−dried sample that had a high positive score for component 4.
The loadings depicted in Figure 5c and the results from ANOVA (Appendix A) showed a significant change in metabolites in the air−dried, medium−PEF−treated sample compared to the non−PEF−treated air−dried control sample. Alanine, aspartic acid, and proline, among the amino acids, were significantly higher in the medium−PEF−treated air−dried sample compared with the non−PEF−treated air−dried control sample. The mechanism by which PEF increases amino acids is not fully understood, but it is thought to involve disruption of organelles and vacuoles, allowing proteases to access and degrade proteins [23], as well as changes in the ζ−potential of the cell membrane, leading to the degradation of peptides [60,61].
Among the organic acids, fumaric acid, benzoic acid, methylpropionic acid, malic acid, citramalic acid, isocitric acid, ferulic acid, 2−butenedioic acid, itaconic acid, pyrrolidine carboxylic acid, threonic acid and trans−4−(aminomethyl)cyclohexanecarboxylic acid were significantly lower in medium−PEF−treated air−dried samples compared with the non−PEF−treated air−dried control samples. Gentiobiose, one of the sugars, was significantly higher in the medium−PEF−treated air−dried sample compared with the control.
The loadings depicted in Figure 5d and the results from ANOVA (Appendix A) showed a significant change in metabolites caused by low−intensity PEF treatment in freeze−dried samples compared with the non−PEF−treated freeze−dried control samples. Hydroxyproline, an amino acid, was significantly higher in the low−PEF−treated freeze−dried sample compared with the control. Among the organic acids, malonic acid, oxaloacetic acid, citraconic acid, cis−aconitic acid, citric acid, ferulic acid, propanedioic acid, hydracrylic acid, galactonic acid and methylsuccinic acid were significantly lower in low−intensity PEF−treated freeze−dried samples compared with non−PEF−treated freeze−dried control samples. The sugars D−xylopyranose, beta−L−galactopyranoside, sedoheptulose, L−threitol, D−(+)−trehalose, D−allose, glucose, rhamnose and ribose were all significantly lower in low−intensity PEF−treated freeze−dried samples except for glucose, which was significantly higher in the low−PEF−treated samples compared with the control.
Overall, the choice of drying method (air drying vs. freeze drying) significantly influenced the metabolite composition of apricot samples. Air drying tended to preserve certain amino acids and sugars better, while freeze drying resulted in higher levels of fatty acids and specific organic acids. Additionally, PEF treatment exerted further significant effects, particularly in combination with freeze drying, suggesting its potential for modulating the metabolite composition of dried apricot samples.

4. Conclusions

The study aimed to investigate the impact of pulsed electric field (PEF) treatment on the physicochemical properties of air−dried and freeze−dried apricots. The results indicated that PEF treatment had no significant effect on the moisture content or water activity of the dried fruits. However, it did have a notable influence on the texture, antioxidant activity and bioactive compounds of the dried apricots. The most effective method for preserving apricots appeared to be freeze drying combined with high−intensity PEF pretreatments. This approach not only improved texture but also preserved the antioxidant activity and bioactive compounds, enhancing both consumer appeal and health benefits.
Air drying with high−intensity PEF resulted in increased firmness, gumminess, and chewiness, potentially leading to a denser texture that may be less appealing. On the other hand, freeze drying resulted in improved texture. Freeze−dried apricots treated with high−intensity PEF (1.8 kV/cm) not only resulted in desirable texture but also exhibited significant increases in antioxidant activity, amino acids, and fatty acids. Future research could further investigate the different PEF intensities and their specific effects on the sensory properties of freeze−dried apricots. In this way, the research can further provide valuable information for optimizing the drying process in relation to the sensory attributes and consumer perception of dried apricots.

Author Contributions

Conceptualization, Y.L., I.O., S.Y.L., K.K. and N.H.; methodology, Y.L., I.O., S.Y.L., K.K. and N.H.; software, K.K.; validation, Y.L.; formal analysis, Y.L.; investigation, Y.L.; resources, Y.L., I.O., S.Y.L. and N.H.; data curation, Y.L.; writing—original draft preparation, Y.L.; writing—review and editing, Y.L. and N.H.; visualization, Y.L. and N.H.; supervision, I.O. and N.H.; project administration, Y.L., I.O., S.Y.L., R.K., K.K. and N.H. All authors have read and agreed to the published version of the manuscript.

Funding

This research received no external funding.

Institutional Review Board Statement

Not applicable.

Informed Consent Statement

Not applicable.

Data Availability Statement

The original contributions presented in the study are included in the article, further inquiries can be directed to the corresponding author.

Conflicts of Interest

The authors declare no conflict of interest.

Appendix A

Table A1. One−way ANOVA for Loading 1.
CategoryThreoninetrans-4-HydroxyprolineGlutathione (Split Peak 3)HistidinePalmitic Acid (C16_0)Stearic Acid (C18_0)Arachidic Acid (C20_0)Succinic AcidLactic AcidGlyoxylic Acid
air dried0.001 a0.000 a0.000 b0.000 b0.013 b0.017 b0.000 b0.042 a0.015 a0.001 a
freeze dried0.000 b0.000 b0.001 a0.001 a0.022 a0.028 a0.000 a0.011 b0.004 b0.000 b
Pr > F(Drying method)<0.0001<0.0001<0.0001<0.0001<0.0001<0.0001<0.0001<0.0001<0.0001<0.0001
Category2-Hydroxyisobutyric AcidGlyceric Acid2-Hydroxyglutaramic Acid MCF12-KetoglutamarateCoumaric AcidPhosphoric Acid, Bis(trimethylsilyl)monomethyl EsterButanedioic Acid, 2TMS Derivative2-Phenylbutyric Acid, TBDMS DerivativeGlucopyranose, 5TMS DerivativeD-(+)-Galactopyranose, 5TMS Derivative (Isomer 1)
air dried0.000 a0.002 a0.002 a0.001 b0.001 b0.000 b0.036 a0.002 a0.164 a0.108 a
freeze dried0.000 b0.001 b0.000 b0.015 a0.002 a0.000 a0.016 b0.000 b0.058 b0.035 b
Pr > F(Drying method)<0.0001<0.0001<0.0001<0.0001<0.0001<0.0001<0.0001<0.0001<0.0001<0.0001
Category18.3015 min FRUCTOSE Oxime12,3-ButanediolHydrazine, 1,1-Dimethyl-2-propyl- (NIST)Putrescine5-Methylcytosine, 2TMS DerivativeUnknown 045(100) 43(14.2) 57(11.6)Unknown 095(100) 126(31.0) 39(11.2)Unknown 042(100) 41(57.3) 86(37.5)Unknown 045(100) 59(89.0) 74(67.8)Unknown 101(100) 55(35.6) 117(28.9)
air dried1.873 a0.001 a0.001 a0.001 b0.005 a0.001 a0.001 a0.000 a0.016 a0.000 a
freeze dried0.937 b0.000 b0.000 b0.001 a0.000 b0.000 b0.000 b0.000 b0.010 b0.000 b
Pr > F(Drying method)<0.0001<0.0001<0.0001<0.0001<0.0001<0.0001<0.0001<0.0001<0.0001<0.0001
(a, b) describes the significant differences between means using Fishers LSD post-hoc analysis.
Table A2. One−way ANOVA for Loading 2.
CategoryGlycineLeucineNorleucineThreonine.1Asparaginecis-4-HydroxyprolinePhenylalanineLysineSUMfaaMyristic Acid (C14_0)
3_FreezeDried0.009 a0.027 a0.024 ab0.003 b0.265 a0.001 b0.011 a0.002 a0.559 a0.000 a
2_FreezeDried0.007 b0.027 a0.025 a0.003 b0.243 b0.000 b0.011 a0.002 b0.532 a0.000 b
1_FreezeDried0.006 b0.025 b0.023 b0.003 a0.205 c0.001 a0.009 b0.001 c0.531 a0.000 b
0_FreezeDried0.003 c0.018 c0.018 c0.002 c0.133 d0.000 c0.007 c0.001 d0.317 b0.000 c
Pr > F(PEF-Drying)<0.0001<0.0001<0.0001<0.0001<0.0001<0.0001<0.0001<0.0001<0.00010.000
Category9,12,15-Octadecatrienoic Acid, Methyl Ester, (Z,Z,Z)-D_Citramalic AcidMalic Acid Peak 2Isocitric AcidRibonic Acid, 2,3,4,5-Tetrakis-O-(trimethylsilyl)-, Trimethylsilyl EsterShikimic Acid (4TMS)Sedoheptulose, o-Methyloxime, Hexakis-O-(trimethylsilyl)-D-Allose, Pentakis(trimethylsilyl) Ether, Ethyloxime (Isomer 1)5-Cyano-2-methyl-4-methylthio-6-phenylpyrimidineUnknown 126(100) 141(46.7) 54(33.2)
3_FreezeDried0.012 a0.003 a0.237 a0.004 a0.020 a0.004 a0.002 b0.004 b0.001 a0.000 a
2_FreezeDried0.011 ab0.003 b0.227 a0.004 b0.011 b0.004 a0.002 b0.005 b0.000 b0.000 b
1_FreezeDried0.010 b0.003 b0.210 b0.003 c0.008 b0.003 b0.003 b0.006 b0.000 b0.000 b
0_FreezeDried0.007 c0.002 c0.204 b0.003 d0.006 b0.002 b0.012 a0.020 a0.000 c0.000 c
Pr > F(PEF-Drying)0.0000.000<0.0001<0.00010.0120.000<0.0001<0.0001<0.00010.000
CategoryUnknown 114(100) 59(15.3) 82(14.4)Unknown 086(100) 59(56.6) 128(39.3)Unknown 166(100) 139(94.5) 111(42.6)Unknown 115(100) 69(73.8) 59(62.9)Unknown 115(100) 55(17.7) 59(9.5)Unknown 059(100) 73(69.3) 77(45.8)Unknown 102(100) 58(0.86) 59(0.75)Unknown 102(100) 103(26.6) 44(19.0)Unknown 128(100) 129(0.69) 42(0.52)
3_FreezeDried0.001 a0.001 a0.000 a0.001 a0.006 a0.002 a0.005 a0.004 a0.002 a
2_FreezeDried0.001 b0.001 b0.000 b0.001 a0.006 b0.001 a0.004 a0.004 a0.002 a
1_FreezeDried0.000 c0.001 b0.000 a0.001 a0.005 c0.001 b0.004 a0.003 b0.001 b
0_FreezeDried0.000 d0.000 c0.000 b0.000 b0.005 d0.001 b0.002 b0.001 c0.001 c
Pr > F(PEF-Drying)<0.0001<0.0001<0.00010.001<0.0001<0.0001<0.0001<0.0001<0.0001
(a–d) describe the significant differences between means using Fishers LSD post-hoc analysis.
Table A3. One−way ANOVA for Loading 3.
CategoryAlanineAspartic AcidProlineSUMfaaFumaric AcidBenzoic Acid3-Acetoxy-3-Hydroxy-2-methylpropionic Acid (NIST Match 88.6)Malic AcidCitramalic AcidIsocitric Acid
1_AirDried0.093 b0.001 b0.050 c0.529 b0.106 a0.014 a0.002 a0.252 a0.000 a0.004 a
0_AirDried0.089 b0.001 b0.038 c0.391 d0.103 a0.013 a0.002 a0.230 b0.000 ab0.004 a
2_AirDried0.121 a0.002 a0.117 a0.584 a0.069 b0.006 b0.001 b0.204 c0.000 bc0.003 b
3_AirDried0.095 b0.001 b0.092 b0.451 c0.075 b0.005 b0.001 b0.201 c0.000 c0.003 c
Pr > F(PEF-Drying)<0.00010.003<0.0001<0.0001<0.00010.001<0.00010.0000.015<0.0001
CategoryFerulic Acid2-Butenedioic Acid, (E)-, 2TMS DerivativeItaconic Acid, 2TMS Derivative1-Ethyl-2-pyrrolidinecarboxylic Acid, Methyl EsterL-Threonic Acid, Tris(trimethylsilyl) Ether, Trimethylsilyl Estertrans-4-(Aminomethyl)cyclohexanecarboxylic Acid, N,N-Tris(trimethylsilyl), Trimethylsilyl Ester.beta.-L-Galactopyranoside, Methyl 6-Deoxy-, (S,S,R,R,S)-, 3TMS Derivative.beta.-Gentiobiose, Octakis(trimethylsilyl) Ether, Methyloxime (Isomer 1)19.0993 min MANNITOL1-Methyl-1-(3-octenoyloxy)-1-silacyclohexane (NIST)
1_AirDried0.002 a0.015 a0.012 a0.001 bc0.009 b0.003 ab0.004 a0.004 ab0.004 b0.019 a
0_AirDried0.002 b0.013 a0.017 a0.000 c0.011 a0.001 c0.001 b0.003 b0.003 b0.019 a
2_AirDried0.001 c0.010 b0.010 a0.001 a0.007 c0.003 b0.001 b0.005 a0.004 a0.008 b
3_AirDried0.001 bc0.009 b0.007 a0.001 ab0.007 c0.004 a0.001 b0.005 a0.004 ab0.010 b
Pr > F(PEF-Drying)<0.00010.0020.2830.0130.0010.0060.0140.0190.045<0.0001
CategoryErythrono-1,4-lactone, (E)-, 2TMS DerivativeUnknown 113(100) 85(48.1) 59(21.2)Unknown 103(100) 88(73.4) 71(66.9)Unknown 71(100) 103(73.4) 131(66.9)Unknown 115(100) 55(17.7) 59(9.5)Unknown 113(100) 59(23.1) 85(16.0)Unknown 114(100) 147(31.9) 115(27.2)Unknown 103(100) 114(81.7) 71(55.6)Unknown 189(100) 75(99.0) 113(90.9)
1_AirDried0.002 a0.041 a0.002 ab0.003 a0.007 a0.006 a0.009 a0.028 a0.004 a
0_AirDried0.002 a0.039 a0.002 b0.003 a0.007 a0.006 a0.009 a0.027 a0.004 a
2_AirDried0.001 a0.026 b0.003 a0.002 b0.006 b0.003 b0.004 b0.012 b0.002 b
3_AirDried0.001 a0.026 b0.002 a0.002 b0.004 c0.003 b0.005 b0.015 b0.002 b
Pr > F(PEF-Drying)0.202<0.00010.0130.006<0.0001<0.0001<0.0001<0.0001<0.0001
(a–d) describe the significant differences between means using Fishers LSD post-hoc analysis.
Table A4. One−way ANOVA for Loading 4.
Categorycis-4-HydroxyprolineMalonic AcidOxaloacetic AcidCitraconic Acidcis-Aconitic AcidCitric Acid Secondary PeakCitric AcidFerulic AcidPropanedioic Acid, 2TMS DerivativeHydracrylic Acid, 2TMS Derivative
0_FreezeDried0.000 c0.003 a0.000 a0.026 a0.092 a0.046 a0.353 a0.002 a0.001 a0.001 a
2_FreezeDried0.000 b0.003 ab0.000 ab0.021 b0.077 b0.040 b0.341 a0.001 b0.001 b0.001 ab
3_FreezeDried0.001 b0.003 a0.000 bc0.020 b0.076 b0.039 b0.343 a0.002 a0.001 ab0.001 ab
1_FreezeDried0.001 a0.003 b0.000 c0.017 c0.066 c0.034 c0.309 b0.002 b0.001 b0.000 b
Pr > F(PEF-Drying)<0.00010.0690.001<0.0001<0.00010.0000.001<0.00010.0970.132
CategoryGalactonic Acid, .Gamma.-Lactone, 4TMS DerivavativeMethylsuccinic Acid, 2TMS DerivativeD-Xylopyranose, 4TMS Derivative.beta.-L-Galactopyranoside, Methyl 6-Deoxy-, (S,S,R,R,S)-, 3TMS DerivativeSedoheptulose, o-Methyloxime, Hexakis-O-(trimethylsilyl)-L-Threitol, 4TMS DerivativeD-(+)-Trehalose, Octakis(trimethylsilyl) EtherD-Allose, Pentakis(trimethylsilyl) Ether, Ethyloxime (Isomer 1)18.8402 min GLUCOSE Oxime116.2544 min RHAMNOSE Oxime1
0_FreezeDried0.007 ab0.004 a0.022 a0.002 a0.012 a0.003 a0.014 a0.020 a1.503 ab0.007 ab
2_FreezeDried0.007 ab0.003 ab0.016 ab0.002 ab0.002 b0.001 ab0.005 b0.005 b1.393 bc0.007 a
3_FreezeDried0.009 a0.004 ab0.017 ab0.001 ab0.002 b0.001 b0.008 b0.004 b1.358 c0.007 ab
1_FreezeDried0.006 b0.003 b0.011 b0.001 b0.003 b0.001 b0.006 b0.006 b1.599 a0.006 b
Pr > F(PEF-Drying)0.0890.0820.0260.044<0.00010.1040.001<0.00010.0030.139
Category15.8276 min RIBOSE Oxime1Thiourea, N,N′-Di-2-propenyl- (NIST)Erythrono-1,4-lactone, (E)-, 2TMS Derivative2,3-Butanediol, O-(trimethylsilyl)-, MonoacetateUnknown 043(100) 59(16.5) 74(15.0)Unknown 126(100) 127(46.7) 59(33.2)Unknown 143(100) 157(92.0) 101(60.9)Unknown 129(100) 157(62.8) 97(29.6)Unknown 115(100) 59(65.5) 189(50.1)Unknown 143(100) 101(42.3) 201(15.1)
0_FreezeDried0.006 a0.003 a0.003 a0.002 a0.016 a0.001 a0.000 a0.000 b0.050 a0.007 a
2_FreezeDried0.005 ab0.002 b0.002 ab0.002 ab0.012 b0.001 b0.000 b0.000 b0.042 b0.005 b
3_FreezeDried0.005 ab0.002 b0.002 ab0.002 ab0.012 bc0.001 b0.000 b0.000 a0.040 b0.005 b
1_FreezeDried0.005 b0.001 b0.002 b0.001 b0.010 c0.001 c0.000 b0.000 b0.036 c0.005 b
Pr > F(PEF-Drying)0.1330.0070.0610.099<0.0001<0.00010.0190.018<0.00010.001
(a–c) describe the significant differences between means using Fishers LSD post-hoc analysis.

References

  1. İncedayi, B.; Tamer, C.E.; Sinir, G.Ö.; Suna, S.; Çopur, Ö.U. Impact of different drying parameters on color, β−carotene, antioxidant activity and minerals of apricot (Prunus armeniaca L.). Food Sci. Technol. 2016, 36, 171–178. [Google Scholar] [CrossRef]
  2. Sharma, R.; Gupta, A.; Abrol, G.S.; Joshi, V.K. Value addition of wild apricot fruits grown in North–West Himalayan regions−a review. J. Food Sci. Technol. 2014, 51, 2917–2924. [Google Scholar] [CrossRef] [PubMed]
  3. Siddiq, M.; Butt, M.S.; Greiby, I. Apricots production, processing, and nutrition. In Handbook of Fruits and Fruit Processing; John Wiley & Sons, Ltd.: Hoboken, NJ, USA, 2012; pp. 385–398. [Google Scholar]
  4. Food and Agriculture Organization. Fruit Production in the World. Available online: https://www.fao.org/faostat (accessed on 21 June 2022).
  5. Pawar, K.R.; Nema, P.K. Apricot kernel characterization, oil extraction, and its utilization: A review. Food Sci. Biotechnol. 2023, 32, 249–263. [Google Scholar] [CrossRef] [PubMed]
  6. Ali, S.; Masud, T.; Abbasi, K.S. Physico−chemical characteristics of apricot (Prunus armeniaca L.) grown in Northern Areas of Pakistan. Sci. Hortic. 2011, 130, 386–392. [Google Scholar] [CrossRef]
  7. Huang, W.; Feng, Z.; Aila, R.; Hou, Y.; Carne, A.; Bekhit, A.E.-D.A. Effect of pulsed electric fields (PEF) on physico−chemical properties, β−carotene and antioxidant activity of air−dried apricots. Food Chem. 2019, 291, 253–262. [Google Scholar] [CrossRef] [PubMed]
  8. Hansmann, C.F.; Fourie, P.C. Dehydration of apricots without sulphur dioxide. In Proceedings of the XI International Symposium on Apricot Culture, Veroia, Greece, 25 May 1997; Volume 488. [Google Scholar]
  9. Barba, F.J.; Parniakov, O.; Pereira, S.A.; Wiktor, A.; Grimi, N.; Boussetta, N.; Saraiva, J.A.; Raso, J.; Martin-Belloso, O.; Witrowa-Rajchert, D.; et al. Current applications and new opportunities for the use of pulsed electric fields in food science and industry. Food Res. Int. 2015, 77, 773–798. [Google Scholar] [CrossRef]
  10. Fauster, T.; Giancaterino, M.; Pittia, P.; Jaeger, H. Effect of pulsed electric field pretreatment on shrinkage, rehydration capacity and texture of freeze−dried plant materials. LWT 2020, 121, 108937. [Google Scholar] [CrossRef]
  11. Dermesonlouoglou, E.; Chalkia, A.; Dimopoulos, G.; Taoukis, P. Combined effect of pulsed electric field and osmotic dehydration pre−treatments on mass transfer and quality of air dried goji berry. Innov. Food Sci. Emerg. Technol. 2018, 49, 106–115. [Google Scholar] [CrossRef]
  12. Lammerskitten, A.; Wiktor, A.; Siemer, C.; Toepfl, S.; Mykhailyk, V.; Gondek, E.; Rybak, K.; Witrowa-Rajchert, D.; Parniakov, O. The effects of pulsed electric fields on the quality parameters of freeze−dried apples. J. Food Eng. 2019, 252, 36–43. [Google Scholar] [CrossRef]
  13. Ciurzynska, A.; Trusinska, M.; Rybak, K.; Wiktor, A.; Nowacka, M. The Influence of Pulsed Electric Field and Air Temperature on the Course of Hot−Air Drying and the Bioactive Compounds of Apple Tissue. Molecules 2023, 28, 2970. [Google Scholar] [CrossRef]
  14. Rybak, K.; Wiktor, A.; Kaveh, M.; Dadan, M.; Witrowa-Rajchert, D.; Nowacka, M. Effect of thermal and non−thermal technologies on kinetics and the main quality parameters of red bell pepper dried with convective and microwave–convective methods. Molecules 2022, 27, 2164. [Google Scholar] [CrossRef] [PubMed]
  15. Santos, N.C.; Almeida, R.L.; Brito, A.C.; Silva, V.M.; Albuquerque, J.C.; Saraiva, M.M.; Santos, R.M.; De Sousa, F.M.; Ribeiro, V.H.; Carvalho, R.D.; et al. Effect of pulse electric field (PEF) intensity combined with drying temperature on mass transfer, functional properties, and in vitro digestibility of dehydrated mango peels. J. Food Meas. Charact. 2023, 17, 5219–5233. [Google Scholar] [CrossRef]
  16. Lebovka, N.I.; Praporscic, I.; Vorobiev, E. Effect of moderate thermal and pulsed electric field treatments on textural properties of carrots, potatoes and apples. Innov. Food Sci. Emerg. Technol. 2004, 5, 9–16. [Google Scholar] [CrossRef]
  17. Tylewicz, U.; Mannozzi, C.; Castagnini, J.M.; Genovese, J.; Romani, S.; Rocculi, P.; Dalla Rosa, M. Application of PEF−and OD−assisted drying for kiwifruit waste valorisation. Innov. Food Sci. Emerg. Technol. 2022, 77, 102952. [Google Scholar] [CrossRef]
  18. Alam, M.R.; Lyng, J.G.; Frontuto, D.; Marra, F.; Cinquanta, L. Effect of pulsed electric field pretreatment on drying kinetics, color, and texture of parsnip and carrot. J. Food Sci. 2018, 83, 2159–2166. [Google Scholar] [CrossRef]
  19. Ozkan, G.; Stübler, A.S.; Aganovic, K.; Dräger, G.; Esatbeyoglu, T.; Capanoglu, E. Retention of polyphenols and vitamin C in cranberrybush purée (Viburnum opulus) by means of non−thermal treatments. Food Chem. 2021, 360, 129918. [Google Scholar] [CrossRef] [PubMed]
  20. Lakka, A.; Bozinou, E.; Stavropoulos, G.; Samanidis, I.; Athanasiadis, V.; Dourtoglou, V.G.; Lalas, S.I. Enhancement of polyphenols recovery from Rosa canina, Calendula officinalis and Castanea sativa using Pulsed Electric Field. Beverages 2021, 7, 63. [Google Scholar] [CrossRef]
  21. Lakka, A.; Bozinou, E.; Makris, D.P.; Lalas, S.I. Evaluation of pulsed electric field polyphenol extraction from Vitis vinifera, Sideritis scardica and Crocus sativus. ChemEngineering 2021, 5, 25. [Google Scholar] [CrossRef]
  22. Luengo, E.; Álvarez, I.; Raso, J. Improving the pressing extraction of polyphenols of orange peel by pulsed electric fields. Innov. Food Sci. Emerg. Technol. 2013, 17, 79–84. [Google Scholar] [CrossRef]
  23. Garde-Cerdán, T.; Arias-Gil, M.; Marsellés-Fontanet, A.R.; Ancín-Azpilicueta, C.; Martín-Belloso, O. Effects of thermal and non−thermal processing treatments on fatty acids and free amino acids of grape juice. Food Control 2007, 18, 473–479. [Google Scholar] [CrossRef]
  24. Oziembłowski, M.; Trenka, M.; Czaplicka, M.; Maksimowski, D.; Nawirska-Olszańska, A. Selected Properties of Juices from Black Chokeberry (Aronia melanocarpa L.) Fruits Preserved Using the PEF Method. Appl. Sci. 2022, 12, 7008. [Google Scholar] [CrossRef]
  25. Toepfl, S.; Mathys, A.; Heinz, V.; Knorr, D. Review: Potential of High Hydrostatic Pressure and Pulsed Electric Fields for Energy Efficient and Environmentally Friendly Food Processing. Food Rev. Int. 2006, 22, 405–423. [Google Scholar] [CrossRef]
  26. Apak, R.; Güçlü, K.; Özyürek, M.; Çelik, S.E. Mechanism of antioxidant capacity assays and the CUPRAC (cupric ion reducing antioxidant capacity) assay. Microchim. Acta 2008, 160, 413–419. [Google Scholar] [CrossRef]
  27. Morais, D.R.; Rotta, E.M.; Sargi, S.C.; Schmidt, E.M.; Bonafe, E.G.; Eberlin, M.N.; Sawaya, A.C.; Visentainer, J.V. Antioxidant activity, phenolics and UPLC–ESI (–)–MS of extracts from different tropical fruits parts and processed peels. Food Res. Int. 2015, 77, 392–399. [Google Scholar] [CrossRef]
  28. Singleton, V.L.; Orthofer, R.; Lamuela-Raventós, R.M. [14] Analysis of total phenols and other oxidation substrates and antioxidants by means of folin-ciocalteu reagent. In Methods in Enzymology; Elsevier: Amsterdam, The Netherlands, 1999; Volume 299, pp. 152–178. [Google Scholar]
  29. Villas-Bôas, S.G.; Noel, S.; Lane, G.A.; Attwood, G.; Cookson, A. Extracellular metabolomics: A metabolic footprinting approach to assess fiber degradation in complex media. Anal. Biochem. 2006, 349, 297–305. [Google Scholar] [CrossRef]
  30. Smart, K.F.; Aggio, R.B.M.; Van Houtte, J.R.; Villas-Bôas, S.G. Analytical platform for metabolome analysis of microbial cells using methyl chloroformate derivatization followed by gas chromatography–mass spectrometry. Nat. Protoc. 2010, 5, 1709–1729. [Google Scholar] [CrossRef] [PubMed]
  31. Que, F.; Mao, L.; Fang, X.; Wu, T. Comparison of hot air−drying and freeze−drying on the physicochemical properties and antioxidant activities of pumpkin (Cucurbita moschata Duch.) flours. Int. J. Food Sci. Technol. 2008, 43, 1195–1201. [Google Scholar] [CrossRef]
  32. Fontana, A.J., Jr. D: Minimum Water Activity Limits for Growth of Microorganisms. Water Act. Foods 2007, 406, 571–572. [Google Scholar]
  33. Acevedo, N.C.; Briones, V.; Buera, P.; Aguilera, J.M. Microstructure affects the rate of chemical, physical and color changes during storage of dried apple discs. J. Food Eng. 2008, 85, 222–231. [Google Scholar] [CrossRef]
  34. Amami, E.; Khezami, L.; Vorobiev, E.; Kechaou, N. Effect of pulsed electric field and osmotic dehydration pretreatment on the convective drying of carrot tissue. Dry. Technol. 2008, 26, 231–238. [Google Scholar] [CrossRef]
  35. Amami, E.; Vorobiev, E.; Kechaou, N. Effect of pulsed electric field on the osmotic dehydration and mass transfer kinetics of apple tissue. Dry. Technol. 2005, 23, 581–595. [Google Scholar] [CrossRef]
  36. Wiktor, A.; Śledź, M.; Nowacka, M.; Chudoba, T.; Witrowa-Rajchert, D. Pulsed electric field pretreatment for osmotic dehydration of apple tissue: Experimental and mathematical modeling studies. Dry. Technol. 2014, 32, 408–417. [Google Scholar] [CrossRef]
  37. Ramos, I.N.; Brandão, T.R.; Silva, C.L. Structural changes during air drying of fruits and vegetables. Food Sci. Technol. Int. 2003, 9, 201–206. [Google Scholar] [CrossRef]
  38. Mujumdar, A.S. Book Review: Handbook of Industrial Drying: A Review of “Publisher: CRC Press. Boca Raton, FL, 2007”. Dry. Technol. 2007, 25, 1133–1134. [Google Scholar]
  39. Ratti, C. Hot air and freeze−drying of high−value foods: A review. J. Food Eng. 2001, 49, 311–319. [Google Scholar] [CrossRef]
  40. Kovacs, E.; Meresz, P.; Kristof, Z.; Nemeth-Szerdahelyi, E. Ripening and microstructure of apricot (Prunus Armeniaca L.). Acta Aliment. 2008, 37, 23–39. [Google Scholar] [CrossRef]
  41. Parniakov, O.; Bals, O.; Lebovka, N.; Vorobiev, E. Pulsed electric field assisted vacuum freeze−drying of apple tissue. Innov. Food Sci. Emerg. Technol. 2016, 35, 52–57. [Google Scholar] [CrossRef]
  42. Apak, R.; Gorinstein, S.; Böhm, V.; Schaich, K.M.; Özyürek, M.; Güçlü, K. Methods of measurement and evaluation of natural antioxidant capacity/activity (IUPAC Technical Report). Pure Appl. Chem. 2013, 85, 957–998. [Google Scholar] [CrossRef]
  43. Tamanna, N.; Mahmood, N. Food processing and maillard reaction products: Effect on human health and nutrition. Int. J. Food Sci. 2015, 2015, 526762. [Google Scholar] [CrossRef]
  44. Papoutsis, K.; Pristijono, P.; Golding, J.B.; Stathopoulos, C.E.; Bowyer, M.C.; Scarlett, C.J.; Vuong, Q.V. Effect of vacuum−drying, hot air−drying and freeze−drying on polyphenols and antioxidant capacity of lemon (Citrus limon) pomace aqueous extracts. Int. J. Food Sci. Technol. 2017, 52, 880–887. [Google Scholar] [CrossRef]
  45. Gagneten, M.; Leiva, G.; Salvatori, D.; Schebor, C.; Olaiz, N. Optimization of pulsed electric field treatment for the extraction of bioactive compounds from blackcurrant. Food Bioprocess Technol. 2019, 12, 1102–1109. [Google Scholar] [CrossRef]
  46. Ribas-Agustí, A.; Martín-Belloso, O.; Soliva-Fortuny, R.; Elez-Martínez, P. Influence of pulsed electric fields processing on the bioaccessible and non−bioaccessible fractions of apple phenolic compounds. J. Funct. Foods 2019, 59, 206–214. [Google Scholar] [CrossRef]
  47. Vuong, Q.V.; Zammit, N.; Munro, B.R.; Murchie, S.; Bowyer, M.C.; Scarlett, C.J. Effect of Drying Conditions on Physicochemical and Antioxidant Properties of V itex agnus−castus Leaves. J. Food Process. Preserv. 2015, 39, 2562–2571. [Google Scholar] [CrossRef]
  48. Siddeeg, A.; Zeng, X.; Rahaman, A.; Manzoor, M.F.; Ahmed, Z.; Ammar, A. Effect of pulsed electric field pretreatment of date palm fruits on free amino acids, bioactive components, and physicochemical characteristics of the alcoholic beverage. J. Food Sci. 2019, 84, 3156–3162. [Google Scholar] [CrossRef]
  49. Agcam, E.; Akyıldız, A.; Akdemir Evrendilek, G. Comparison of phenolic compounds of orange juice processed by pulsed electric fields (PEF) and conventional thermal pasteurisation. Food Chem. 2014, 143, 354–361. [Google Scholar] [CrossRef] [PubMed]
  50. Manzoor, M.F.; Ahmad, N.; Ahmed, Z.; Siddique, R.; Zeng, X.-A.; Rahaman, A.; Aadil, R.M.; Wahab, A. Novel extraction techniques and pharmaceutical activities of luteolin and its derivatives. J. Food Biochem. 2019, 43, e12974. [Google Scholar] [CrossRef]
  51. Mtaoua, H.; Sánchez-Vega, R.; Ferchichi, A.; Martín-Belloso, O. Impact of high−intensity pulsed electric fields or thermal treatment on the quality attributes of date juice through storage. J. Food Process. Preserv. 2017, 41, e13052. [Google Scholar] [CrossRef]
  52. Wang, L.; Wen, H.; Yang, N.; Li, H. Effect of vacuum freeze drying and hot air drying on dried mulberry fruit quality. PLoS ONE 2023, 18, e0283303. [Google Scholar] [CrossRef]
  53. Hu, J.; Sun, X.; Yang, F.; Vidyarthi, S.K.; Xiao, H.; Liu, C.; Duan, X.; Wang, H. Changes in, and correlation analysis of, volatile compounds, key enzymes, and fatty acids in lemon juice vesicles during freeze drying and hot−air drying. J. Sci. Food Agric. 2023, 103, 6330–6339. [Google Scholar] [CrossRef]
  54. Zhao, W.; Yang, R.; Wang, M.; Lu, R. Effects of pulsed electric fields on bioactive components, colour and flavour of green tea infusions. Int. J. Food Sci. Technol. 2009, 44, 312–321. [Google Scholar] [CrossRef]
  55. Xie, H.; Zhao, R.; Liu, C.; Wu, Y.; Duan, X.; Hu, J.; Wang, H. Dynamic changes in volatile flavor compounds, amino acids, organic acids, and soluble sugars in lemon juice vesicles during freeze−drying and hot−air drying. Foods 2022, 11, 2862. [Google Scholar] [CrossRef] [PubMed]
  56. Sikora, F.; Lachowicz, S.; Kapusta, I.; Dylawerski, M.; Zyska, W.; Ochmian, I. Changes in the Quality of Old Apple Cultivars After Freeze−Drying. Acta Univ. Cibiniensis Ser. E Food Technol. 2020, 24, 175–185. [Google Scholar] [CrossRef]
  57. Dönmez, A.; Kadakal, Ç. Hot−air drying and degradation kinetics of bioactive compounds of gilaburu (Viburnum opulus L.) fruit. Chem. Ind. Chem. Eng. Q. 2023, 30, 59–72. [Google Scholar] [CrossRef]
  58. Manzoor, M.F.; Ahmed, Z.; Ahmad, N.; Aadil, R.M.; Rahaman, A.; Roobab, U.; Siddeeg, A. Novel processing techniques and spinach juice: Quality and safety improvements. J. Food Sci. 2020, 85, 1018–1026. [Google Scholar] [CrossRef] [PubMed]
  59. Gabrić, D.; Barba, F.; Roohinejad, S.; Gharibzahedi, S.M.T.; Radojčin, M.; Putnik, P.; Bursać Kovačević, D. Pulsed electric fields as an alternative to thermal processing for preservation of nutritive and physicochemical properties of beverages: A review. J. Food Process Eng. 2018, 41, e12638. [Google Scholar] [CrossRef]
  60. Chen, Y.; Zeng, X.; Dong, X.; Yang, H.-F. Effects of aging−acceleration by electric field on free amino acid of claret. Liquor Mak. Sci. Technol. 2004, 4, 80–81. [Google Scholar]
  61. Zeng, X.; Gao, D.; Li, G.; Yu, S. The effect of high electric field on enhancing pork’s delicate flavor. Food Sci. 1997, 18, 37–40. [Google Scholar]
Figure 1. Scanning electron microscopy of the pulp structure (left) and surface of apricot skin (right) after PEF pretreatment and drying processes. (AH): Different drying and PEF pretreatment conditions: (A) air drying, control, (B) air drying, low−intensity PEF, (C) air drying, medium−intensity PEF, (D) air drying, high−intensity PEF; (E) freeze drying, control, (F) freeze drying, low−intensity PEF, (G) freeze drying, medium−intensity PEF, (H) freeze drying, high−intensity PEF. Low−intensity PEF: 0.7 kV/cm, 50 Hz every 20 µs for 30 s; Medium−intensity PEF: 1.2 kV/cm, 50 Hz every 20 µs for 30 s; High−intensity PEF: 1.8 kV/cm, 50 Hz every 20 µs for 30 s.
Foods 13 01764 g001
Figure 2. Heat maps showing the intensity of different metabolites in PEF−treated and non−PEF−treated dried apricots: (a) Fatty acids, (b) Amino acids, (c) Sugars and (d) Organic acids. Shades of green to red represent increasing intensity of the metabolites. The first row of each heat map indicates the intensity of PEF treatment: low (1), medium (2), high (3) and control (0).
Foods 13 01764 g002aFoods 13 01764 g002b
Figure 3. sPLS−−DA model showing: (a) Overview of score plots of dried apricot samples preprocessed with different PEF treatments as explained by five components of the selected metabolites; (b) Performance of the model evaluated using cross−validation. Numbers 0, 1, 2 and 3 indicate (i) No PEF, (ii) Low PEF (0.7 kV/cm), (iii) Medium PEF (1.2 kV/cm) and (iv) High PEF (1.8 kV/cm) treatments, respectively.
Foods 13 01764 g003
Figure 4. Two−dimensional (2−D) score plots showing dried apricot samples pretreated under different PEF conditions as explained by the components: (a) 1 and 2; and (b) 3 and 4 using the sPLS−DA model with selected metabolites: Numbers 0, 1, 2 and 3 indicate (i) No PEF, (ii) Low PEF (0.7 kV/cm), (iii) Medium PEF (1.2 kV/cm) and (iv) High PEF (1.8 kV/cm) treatments, respectively.
Foods 13 01764 g004
Figure 5. Loading plots of the top−ranked features. The loadings plot shows the variables selected by the sPLS−DA model for a given component. The variables are ranked by the absolute values of their loadings. Where: a, b, c and d correspond to loadings for components 1, 2, 3 and 4, respectively.
Foods 13 01764 g005
Table 1. Pulse electric field pre-treatments of apricot samples dried using either air-drying or freeze-drying.
NoIDPEFDryingReplicate
1C−AD1No PEFAir drying1
2C−AD2No PEFAir drying2
3C−AD3No PEFAir drying3
4L−AD1Low PEFAir drying1
5L−AD2Low PEFAir drying2
6L−AD3Low PEFAir drying3
7M−AD1Medium PEFAir drying1
8M−AD2Medium PEFAir drying2
9M−AD3Medium PEFAir drying3
10H−AD1High PEFAir drying1
11H−AD2High PEFAir drying2
12H−AD3High PEFAir drying3
13FDC1No PEFFreeze drying1
14FDC2No PEFFreeze drying2
15FDC3No PEFFreeze drying3
16FDL1Low PEFFreeze drying1
17FDL2Low PEFFreeze drying2
18FDL3Low PEFFreeze drying3
19FDM1Medium PEFFreeze drying1
20FDM2Medium PEFFreeze drying2
21FDM3Medium PEFFreeze drying3
22FDH1High PEFFreeze drying1
23FDH2High PEFFreeze drying2
24FDH3High PEFFreeze drying3
C, L, M and H indicate control, low PEF (0.7 kV/cm), medium PEF (1.2 kV/cm), and high PEF (1.8 kV/cm). AD and FD indicate air drying and freeze drying, respectively.
Table 2. Moisture content and water activity of different PEF−pretreated apricots at either 0.7, 1.6 or kV/cm for 50 hz every 20 µs for 30 s that were then subjected to air drying or freeze drying.
PEF IntensityMoisture ContentAw
Air drying
1Control27.256 ± 1.868 Aa0.544 ± 0.009 Aa
2Low PEF27.231 ± 0.869 Aa0.559 ± 0.014 Aa
3Medium PEF27.47 ± 0.507 Aa0.57 ± 0.014 Aa
4High PEF27.354 ± 0.943 Aa0.571 ± 0.016 Aa
p value (PEF condition)Pr > Fp > 0.05p > 0.05
p value (drying method)Pr > F*****
Freeze drying
1Control19.716 ± 0.460 Ab0.384 ± 0.010 Ab
2Low PEF19.853 ± 0.302 Ab0.399 ± 0.024 Ab
3Medium PEF19.546 ± 0.165 Ab0.392 ± 0.010 Ab
4High PEF19.42 ± 0.865 Ab0.399 ± 0.017 Ab
p value (PEF condition)Pr > Fp > 0.05p > 0.05
(A) describe the significant differences between different PEF treatments. (a, b) describe the significant differences between different drying methods. (**, ***) indicate (p < 0.01 and p < 0.001), respectively.
Table 3. Texture of different PEF−pretreated apricots at either 0.7, 1.6 or kV/cm for 50 hz every 20 µs for 30 s that were then subjected to air drying or freeze drying.
PEF IntensityTexture
HardnessAdhesivenessResilienceCohesionSpringinessGumminessChewiness
Air drying
1Control137.153 ± 23.637 Ca0.032 ± 0.187 Aa35.844 ± 4.027 Aa0.931 ± 0.140 Aa190.442 ± 177.722 Aa126.961 ± 22.028 Ca254.287 ± 253.539 Ba
2Low PEF716.382 ± 111.191 Ba−1.108 ± 0.824 Aa29.005 ± 0.377 Ba0.778 ± 0.010 Aa90.716 ± 2.023 Aa556.648 ± 78.866 Ba505.374 ± 76.017 ABa
3Medium PEF827.646 ± 67.560 Ba−9.289 ± 3.96 Bb24.788 ± 1.093 Ba0.753 ± 0.020 Aa92.709 ± 2.226 Aa624.145 ± 67.131 Ba579.48 ± 74.965 ABa
4High PEF1052.633 ± 11.842 Aa3.673 ± 1.681 Aa25.715 ± 2.754 Ba0.743 ± 0.056 Aa93.798 ± 11.797 Aa781.163 ± 50.504 Aa731.158 ± 83.063 Aa
p value
(PEF condition)
Pr > F*****p > 0.05p > 0.05****
p value
(drying method)
Pr > Fp > 0.05p > 0.05p > 0.05p > 0.05p > 0.05p > 0.05p > 0.05
Freeze drying
1Control237.689 ± 62.479 Ca−0.958 ± 2.972 Aa25.467 ± 5.551 Aa0.709 ± 0.041 Aa82.639 ± 14.783 Aa167.448 ± 37.869 Ba139.356 ± 43.717 Ba
2Low PEF342.77 ± 12.242 Bb−0.016 ± 0.675 Aa20.134 ± 2.539 Ab0.598 ± 0.068 Ab64.274 ± 2.671 Ab205.134 ± 28.058 Bb132.34 ± 23.158 Bb
3Medium PEF209.267 ± 2.109 Cb−0.939 ± 0.695 Aa19.219 ± 1.541 Ab0.634 ± 0.166 Aa75.807 ± 20.476 Aa132.583 ± 34.2 Bb104.974 ± 51.574 Bb
4High PEF472.137 ± 27.969 Ab−0.329 ± 0.923 Ab25.048 ± 2.55 Aa0.695 ± 0.012 Aa73.038 ± 2.854 Ab328.234 ± 20.657 Ab240.129 ± 24.603 Ab
p value
(PEF condition)
Pr > Fp > 0.05***p > 0.05p > 0.05p > 0.05***
(A, B, C) describe the significant differences between different PEF treatments. (a, b) describe the significant differences between different drying methods. (*, **, ***) indicate (p < 0.05, p < 0.01, p < 0.001), respectively.
Table 4. Antioxidant activity and TPC of different PEF−pretreated apricots at either 0.7, 1.6 or kV/cm for 50 hz every 20 µs for 30 s that were then subjected to air drying or freeze drying.
PEF IntensityAntioxidant AbilityTotal Polyphenol Content
mg of Trolox Equivalent/g Dried Powder (FRAP)mg of Trolox Equivalent/g Dried Powder (CUPRAC)mg of Gallic Acid Equivalent/g Dried Powder
Air drying
1Control0.447 ± 0.016 Bb4.742 ± 0.27 Ca0.445 ± 0.015 Ba
2Low PEF0.565 ± 0.021 Ab6.626 ± 0.174 Ba0.466 ± 0.016 Ba
3Medium PEF0.567 ± 0.016 Ab7.031 ± 0.115 ABa0.493 ± 0.030 ABa
4High PEF0.607 ± 0.02 Ab7.417 ± 0.129 Aa0.527 ± 0.020 Aa
p value (PEF condition)Pr > F***
p value (drying method)Pr > Fp > 0.05p > 0.05p > 0.05
Freeze drying
1Control0.936 ± 0.111 Ba4.363 ± 0.498 Aa0.576 ± 0.139 Aa
2Low PEF1.458 ± 0.161 Aa4.617 ± 0.154 Ab0.503 ± 0.024 Aa
3Medium PEF1.315 ± 0.074 Aa4.062 ± 0.353 Ab0.466 ± 0.014 Aa
4High PEF1.479 ± 0.048 Aa5.963 ± 0.061 Ab0.522 ± 0.006 Aa
p value (PEF condition)Pr > F*p > 0.05p > 0.05
(A, B, C) describe the significant differences between different PEF treatments. (a, b) describe the significant differences between different drying methods. (*) indicate p < 0.05.
Disclaimer/Publisher’s Note: The statements, opinions and data contained in all publications are solely those of the individual author(s) and contributor(s) and not of MDPI and/or the editor(s). MDPI and/or the editor(s) disclaim responsibility for any injury to people or property resulting from any ideas, methods, instructions or products referred to in the content.

