
A Computational Approach to Understanding and Predicting the Edulcorant Profile of Glucosyl Steviol Glycosides

Abstract
:1. Introduction
2. Materials and Methods
2.1. Preparation of Ligands
2.2. Modeling of Sweet Taste Receptors
2.3. Modeling of Bitter Taste Receptors
2.4. Molecular Docking
3. Results and Discussion
3.1. Template Optimization for the hSTR and hBTR Models
3.2. Model Building and Assessment
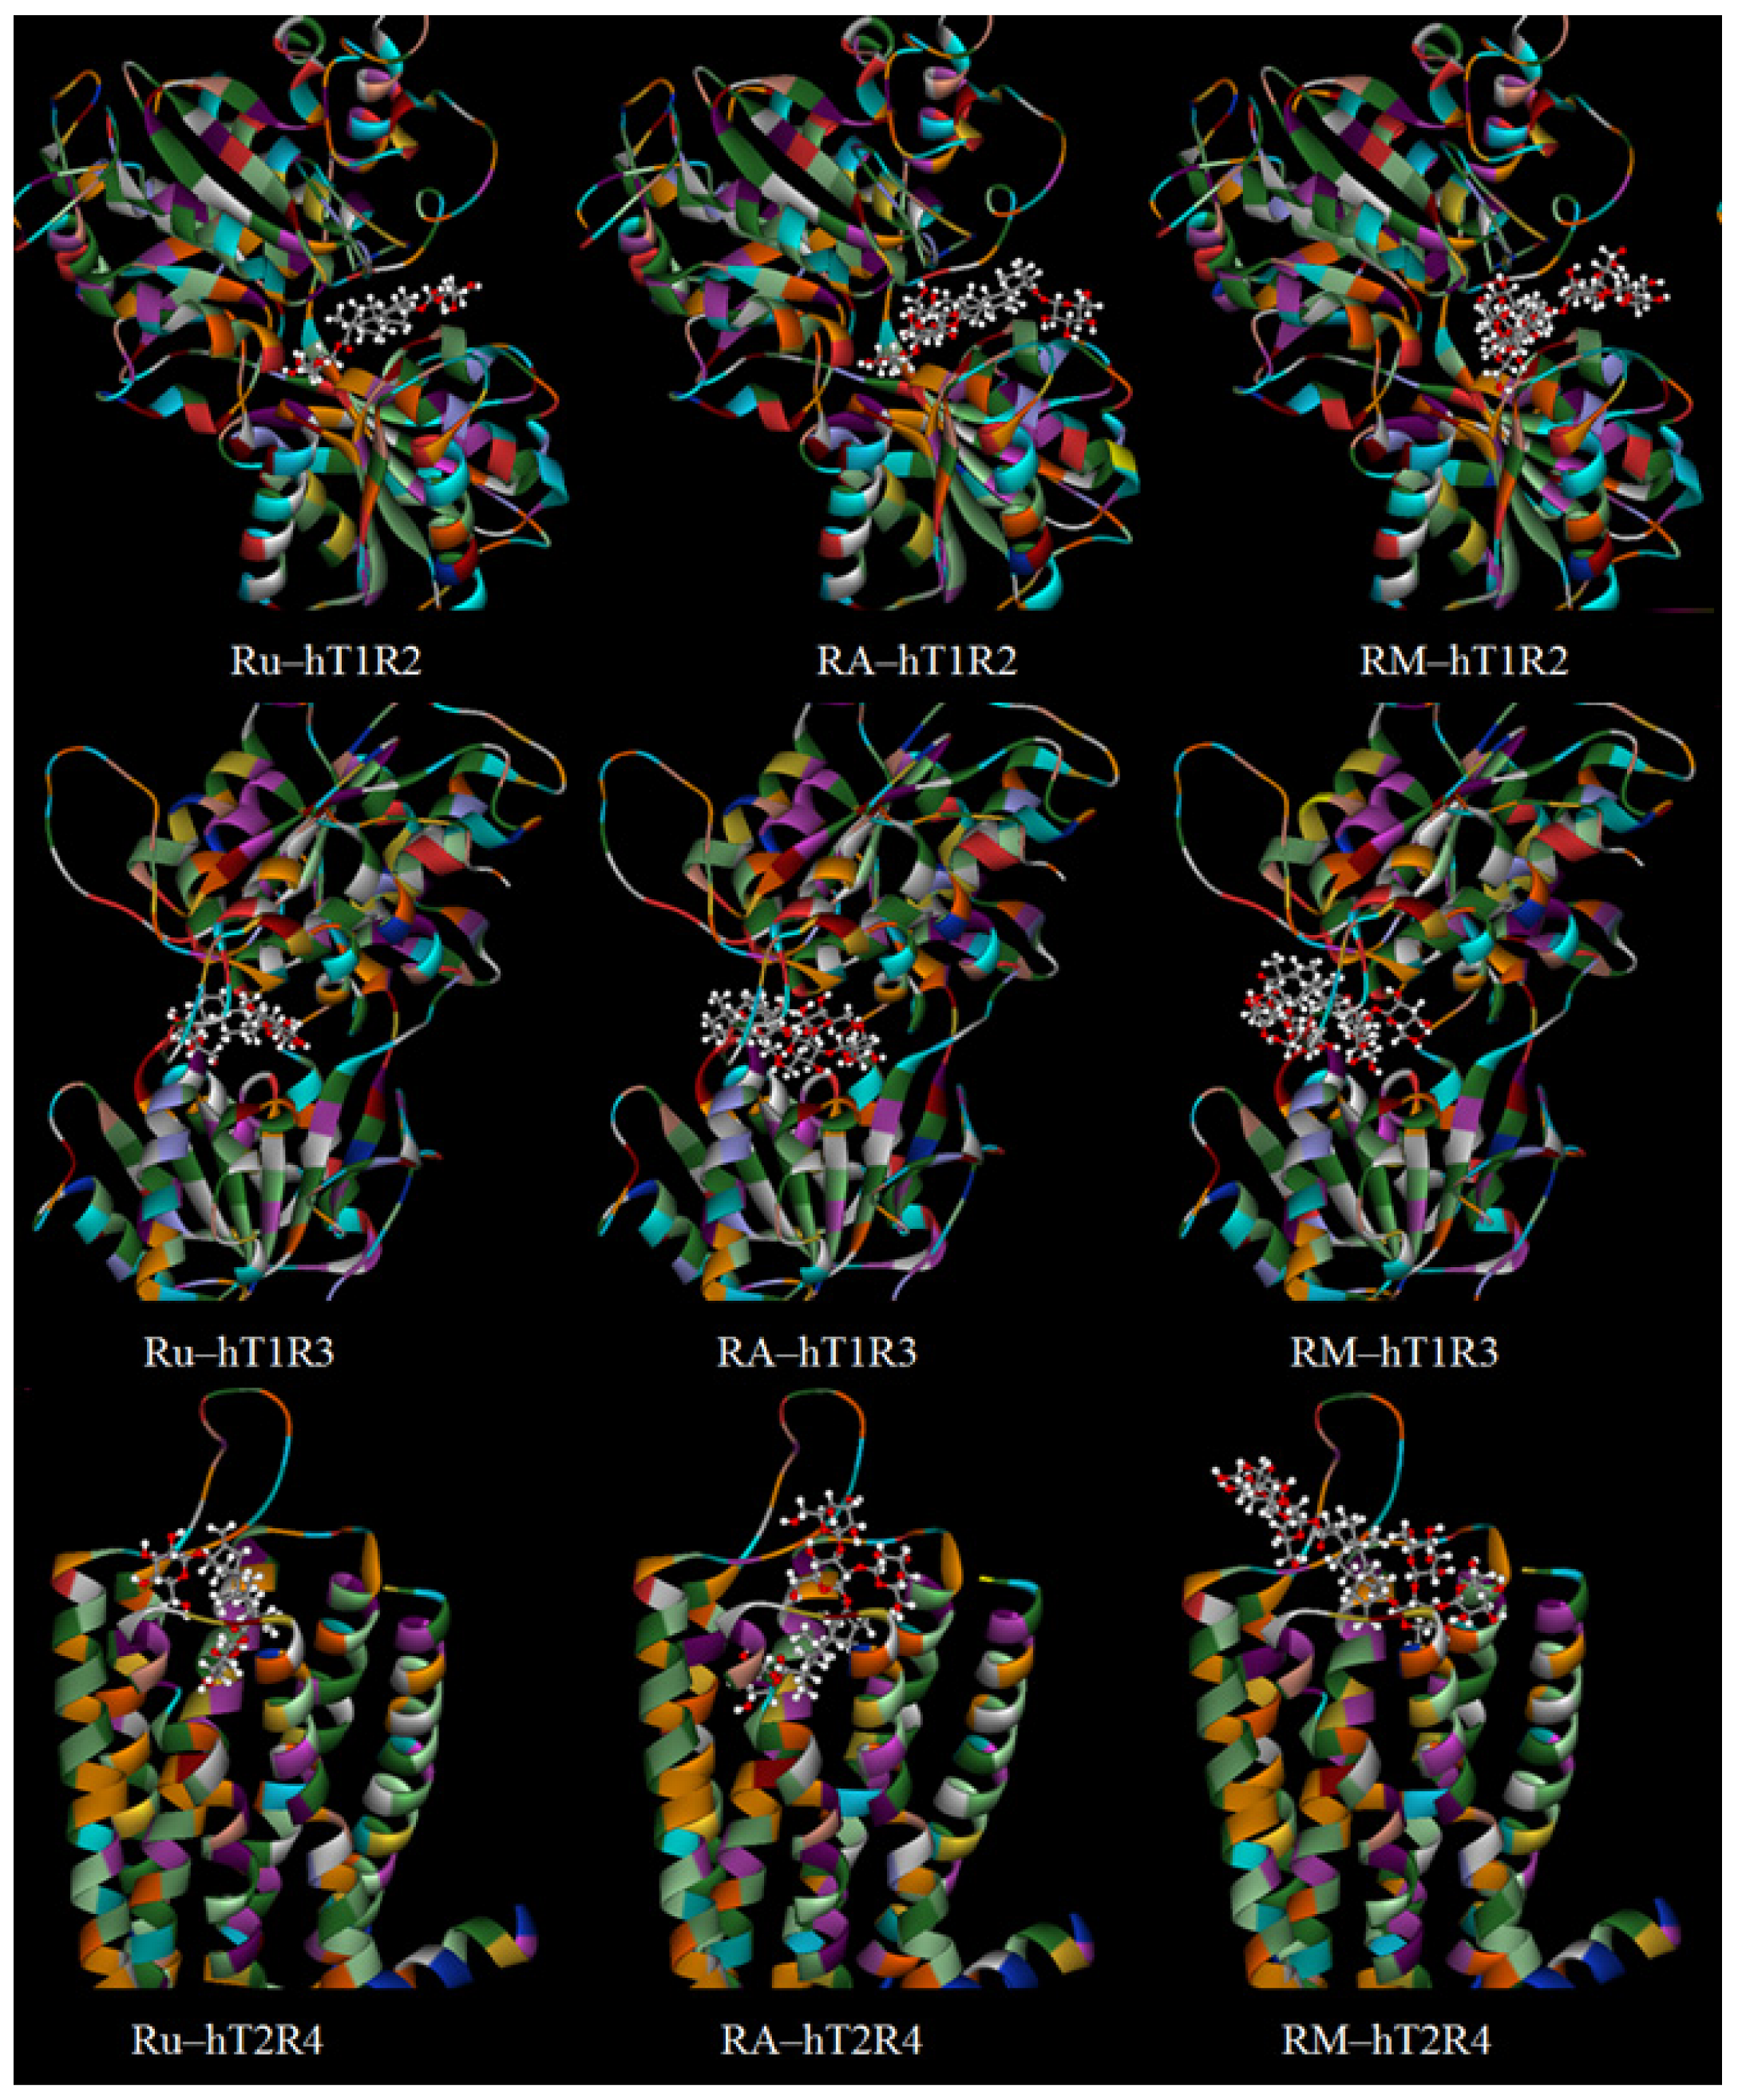
3.3. Molecular Modeling
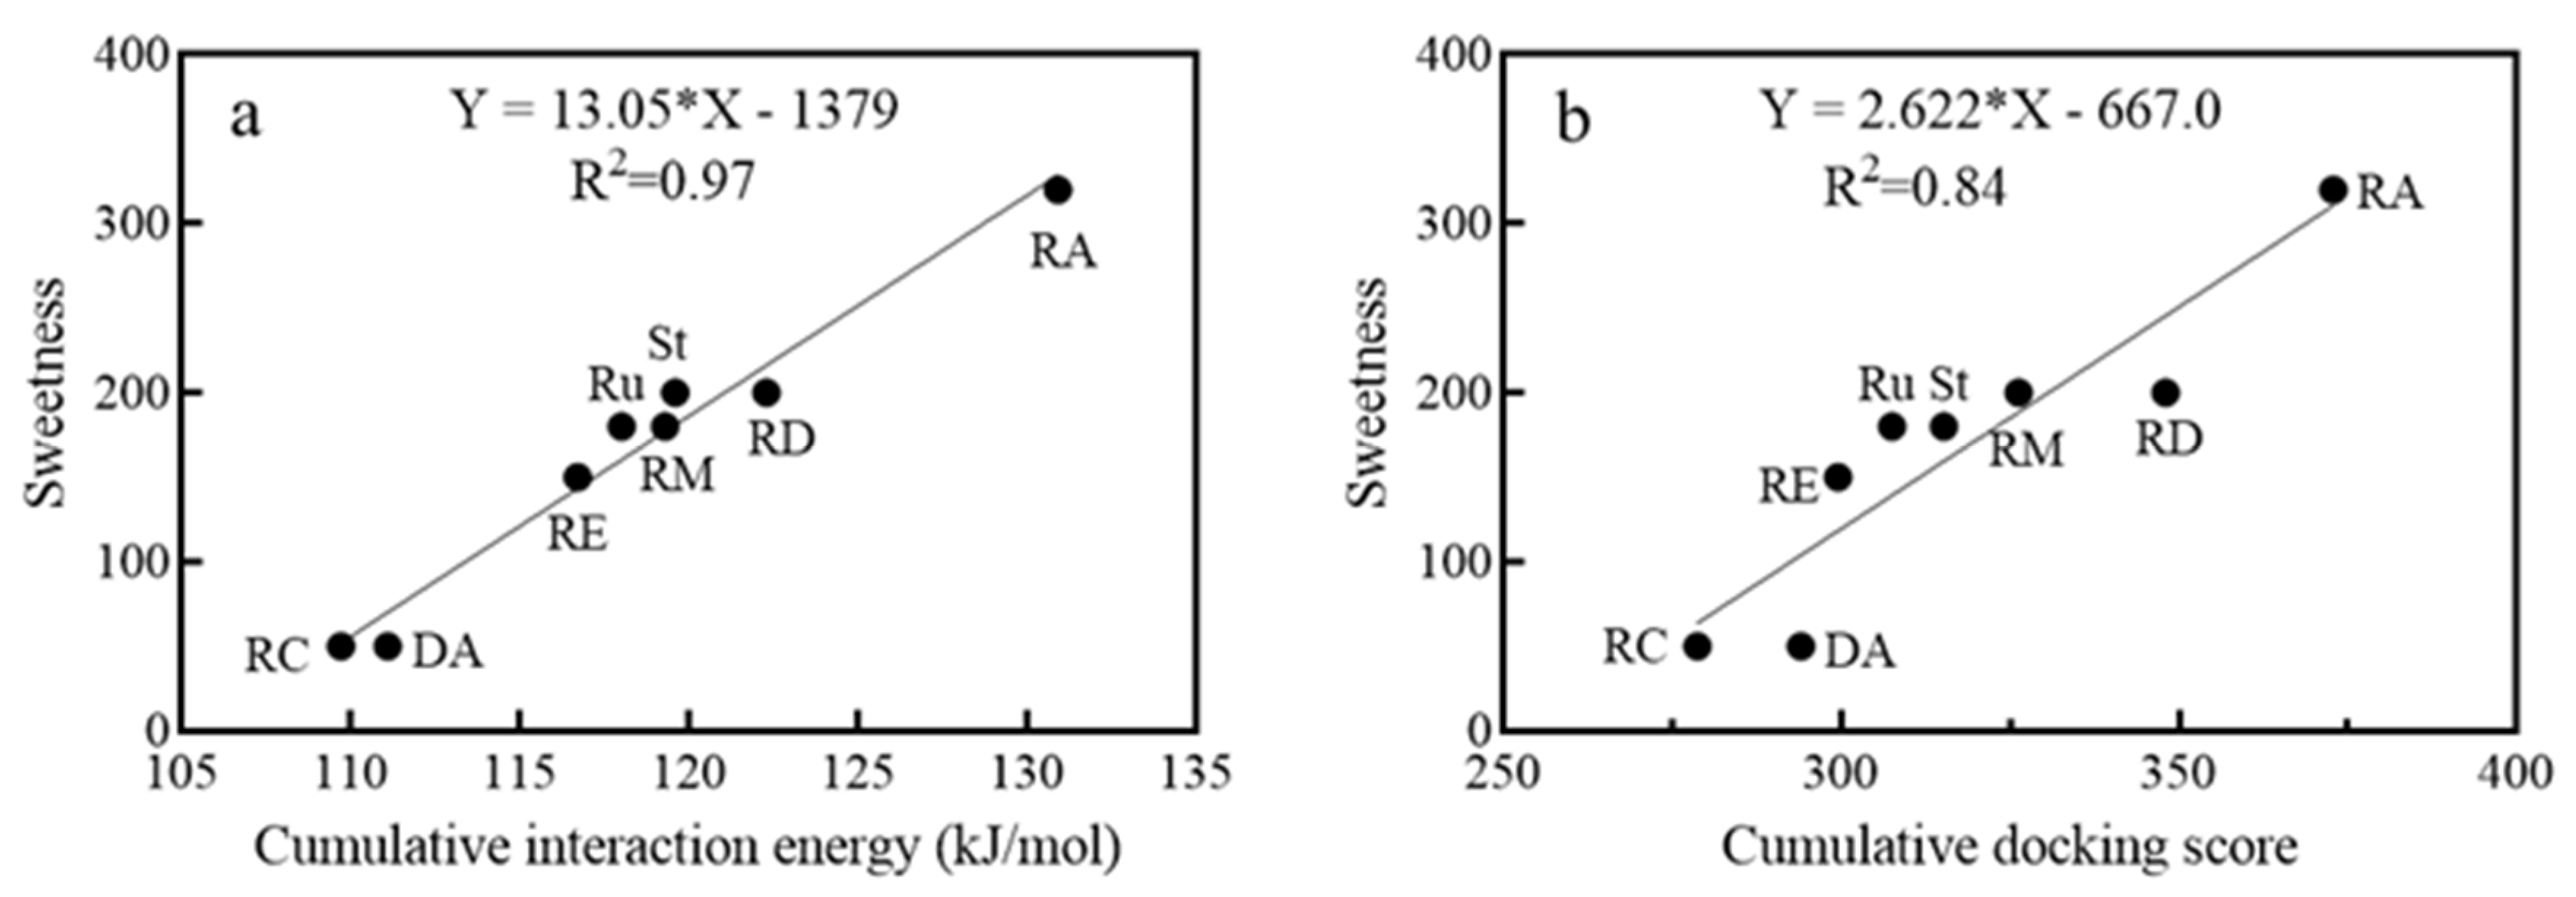
3.3.1. The Sweetness of Natural SGs and the Interaction with the Taste Receptors
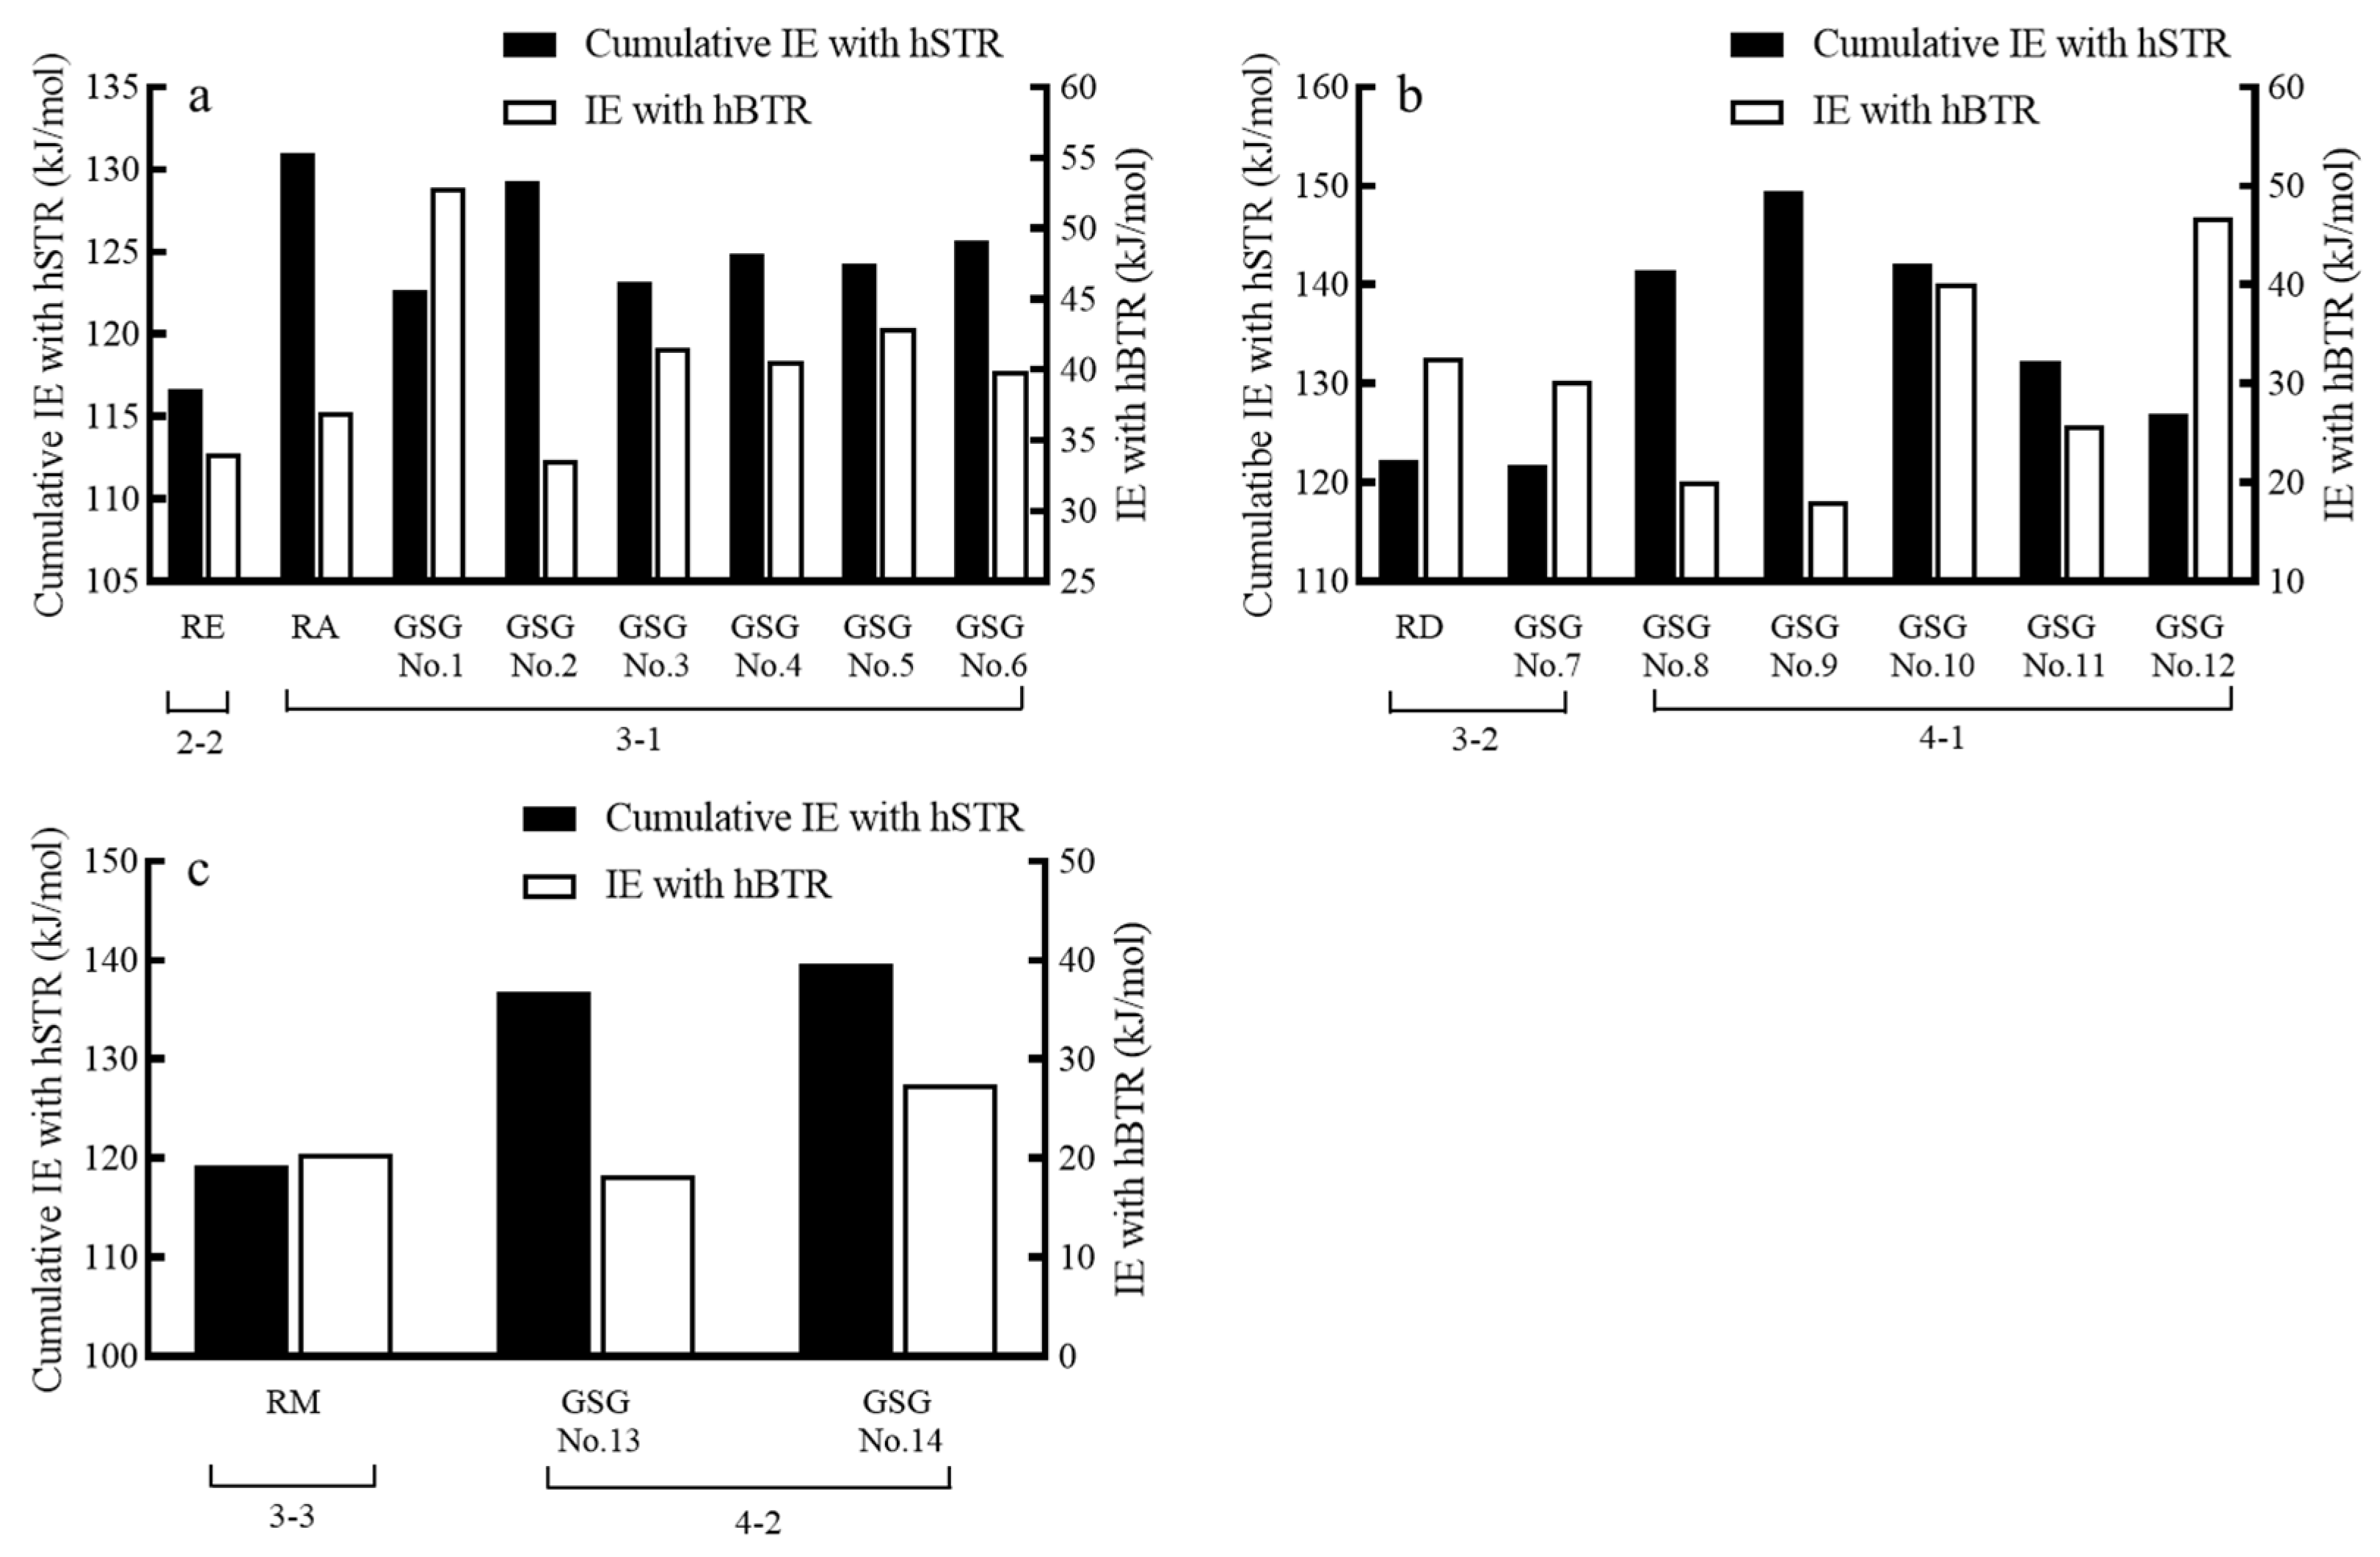
3.3.2. The Sweetness Prediction of Glycosylated Steviol Glycosides
3.3.3. Extending Prediction of Sweetness of Mogrosides
4. Conclusions
Supplementary Materials
Author Contributions
Funding
Institutional Review Board Statement
Informed Consent Statement
Data Availability Statement
Acknowledgments
Conflicts of Interest
References
- Orellana-Paucar, A.M. Steviol Glycosides from Stevia rebaudiana: An Updated Overview of Their Sweetening Activity, Pharmacological Properties, and Safety Aspects. Molecules 2023, 28, 1258. [Google Scholar] [CrossRef] [PubMed]
- Gerwig, G.J.; Te Poele, E.M.; Dijkhuizen, L.; Kamerling, J.P. Stevia glycosides: Chemical and enzymatic modifications of their carbohydrate moieties to improve the sweet-tasting quality. Adv. Carbohydr. Chem. Biochem. 2016, 73, 1–72. [Google Scholar] [CrossRef] [PubMed]
- Zhang, R.; Tang, R.; Wang, W.; Bi, J.; Xu, X.; Fan, Q.; Li, Y.; Chen, Q. Engineering of cyclodextrin glycosyltransferase improves the conversion efficiency of rebaudioside A to glucosylated steviol glycosides and increases the content of short-chain glycosylated steviol glycoside. Microb. Cell Factories 2023, 22, 113. [Google Scholar] [CrossRef] [PubMed]
- Yang, L.; Ping, Q.; Yuan, Z.; Jiang, J.; Guo, B.; Liu, C.; Rao, Y.; Shi, J.; Zhang, Y. Highly efficient synthesis of mono-β-1,6-Glucosylated Rebaudioside A derivative catalyzed by glycosyltransferase YjiC. Carbohydr. Res. 2023, 523, 108737. [Google Scholar] [CrossRef] [PubMed]
- Li, S.; Li, W.; Xiao, Q.Y.; Xia, Y. Transglycosylation of stevioside to improve the edulcorant quality by lower substitution using cornstarch hydrolyzate and CGTase. Food Chem. 2013, 138, 2064–2069. [Google Scholar] [CrossRef] [PubMed]
- Acevedo, W.; Ramirez-Sarmiento, C.A.; Agosin, E. Identifying the interactions between natural, non-caloric sweeteners and the human sweet receptor by molecular docking. Food Chem. 2018, 264, 164–171. [Google Scholar] [CrossRef] [PubMed]
- Singh, N.; Pydi, S.P.; Upadhyaya, J.; Chelikani, P. Structural Basis of Activation of Bitter Taste Receptor T2R1 and Comparison with Class A G-protein-coupled Receptors (GPCRs). J. Biol. Chem. 2011, 286, 36032–36041. [Google Scholar] [CrossRef]
- Mayank; Jaitak, V. Interaction model of steviol glycosides from Stevia rebaudiana (Bertoni) with sweet taste receptors: A computational approach. Phytochemistry 2015, 116, 12–20. [Google Scholar] [CrossRef]
- Singla, R.; Jaitak, V. Synthesis of rebaudioside A from stevioside and their interaction model with hTAS2R4 bitter taste receptor. Phytochemistry 2016, 125, 106–111. [Google Scholar] [CrossRef]
- Zhu, Z.; Zhang, W.; Li, Z.; Zhao, W.; Liu, C.; Zhu, B.; He, P.; Tang, S.; Wu, Y.; Yang, J.; et al. Rethinking Sweetener Discovering: Multiparameter Modeling of Molecular Docking Results between the T1R2-T1R3 Receptor and Compounds with Different Tastes. J. Agric. Food Chem. 2024, 72, 7336–7343. [Google Scholar] [CrossRef]
- Zhao, S.; Ma, S.; Zhang, Y.; Gao, M.; Luo, Z.; Cai, S. Combining molecular docking and molecular dynamics simulation to discover four novel umami peptides from tuna skeletal myosin with sensory evaluation validation. Food Chem. 2024, 433, 137331. [Google Scholar] [CrossRef]
- Nelson, G.; Hoon, M.A.; Chandrashekar, J.; Zhang, Y.; Ryba, N.J.; Zuker, C.S. Mammalian sweet taste receptors. Cell 2001, 106, 381–390. [Google Scholar] [CrossRef] [PubMed]
- Yuan, Y.; Yiasmin, M.N.; Tristanto, N.A.; Chen, Y.; Liu, Y.; Guan, S.; Wang, Z.; Hua, X. Computational simulations on the taste mechanism of steviol glycosides based on their interactions with receptor proteins. Int. J. Biol. Macromol. 2024, 255, 128110. [Google Scholar] [CrossRef]
- Pich, J.; Chuquichambi, E.G.; Blay, N.T.; Corradi, G.B.; Munar, E. Sweet and bitter near-threshold solutions activate cross-modal correspondence between taste and shapes of cups. Food Qual. Prefer. 2020, 83, 103891. [Google Scholar] [CrossRef]
- Nie, Y.; Vigues, S.; Hobbs, J.R.; Conn, G.L.; Munger, S.D. Distinct contributions of T1R2 and T1R3 taste receptor subunits to the detection of sweet stimuli. Curr. Biol. 2005, 15, 1948–1952. [Google Scholar] [CrossRef]
- Lemon, C.H. A non-singularity in sweet taste. Chem. Senses 2024, 49, bjae006. [Google Scholar] [CrossRef]
- Shaji, C.S.; Saraswathy, R. Taste receptors influencing effective modalities in human health—A cutting edge update on TAS1R and TAS2R receptor polymorphisms in taste perception and disease risk. Nutr. Health 2023, 02601060231186865. [Google Scholar] [CrossRef]
- Naciri, L.C.; Mastinu, M.; Crnjar, R.; Barbarossa, I.T.; Melis, M. Automated identification of the genetic variants of TAS2R38 bitter taste receptor with supervised learning. Comput. Struct. Biotechnol. J. 2023, 21, 1054–1065. [Google Scholar] [CrossRef] [PubMed]
- Lovell, S.C.; Davis, I.W.; Arendall, W.B., III; De Bakker, P.I.; Word, J.M.; Prisant, M.G.; Richardson, J.S.; Richardson, D.C. Structure validation by ca geometry: Φ, ψ and Cβ deviation. Proteins Struct. Funct. Bioinform. 2003, 50, 437–450. [Google Scholar] [CrossRef]
- Roy, A.; Kucukural, A.; Zhang, Y. I-TASSER: A unified platform for automated protein structure and function prediction. Nat. Protoc. 2010, 5, 725. [Google Scholar] [CrossRef]
- Zhang, Y. I-TASSER server for protein 3D structure prediction. BMC Bioinform. 2008, 9, 40. [Google Scholar] [CrossRef]
- Zhang, Y.; Skolnick, J. Scoring function for automated assessment of protein structure template quality. Proteins Struct. Funct. Bioinform. 2007, 68, 702–710. [Google Scholar] [CrossRef]
- Li, Y.; Zhang, Y. REMO: A new protocol to refine full atomic protein models from C-alpha traces by optimizing hydrogen-bonding networks. Proteins Struct. Funct. Bioinform. 2009, 76, 665–676. [Google Scholar] [CrossRef] [PubMed]
- Gagnon, J.K.; Law, S.M.; Brooks, C.L., III. Flexible Cdocker: Development and application of a pseudo-explicit structure-based docking method within charmm. J. Comput. Chem. 2016, 37, 753–762. [Google Scholar] [CrossRef] [PubMed]
- Wu, G.S.; Robertson, D.H.; Brooks, C.L.; Vieth, M. Detailed analysis of grid-based molecular docking: A case study of CDOCKER-A CHARMm-based MD docking algorithm. J. Comput. Chem. 2010, 24, 1549–1562. [Google Scholar] [CrossRef]
- Liu, B.; Ha, M.; Meng, X.Y.; Kaur, T.; Khaleduzzaman, M.; Zhang, Z.; Jiang, P.; Li, X.; Cui, M. Molecular Mechanism of Species-dependent Sweet Taste toward Artificial Sweeteners. J. Neurosci. 2011, 31, 11070–11076. [Google Scholar] [CrossRef] [PubMed]
- Hellfritsch, C.; Brockhoff, A.; Stähler, F.; Meyerhof, W.; Hofmann, T. Human Psychometric and Taste Receptor Responses to Steviol Glycosides. J. Agric. Food Chem. 2012, 60, 6782–6793. [Google Scholar] [CrossRef]
- Bhardwaj, V.; Singh, R.; Singh, P.; Purohit, R.; Kumar, S. Elimination of bitter-off taste of stevioside through structure modification and computational interventions. J. Theor. Biol. 2020, 486, 110094. [Google Scholar] [CrossRef]
- Kusama, S.; Kusakabe, I.; Nakamura, Y.; Eda, S.; Murakami, K. Transglucosylation into stevioside by the enzyme system from Streptomyces sp. J. Agric. Chem. Soc. Jpn. 2014, 50, 2445–2451. [Google Scholar] [CrossRef]
- Zhang, Y.D.; Li, W.; Lu, T.; Xia, Y.M. The effect of microwave irradiation on transglycosylation pathway of stevioside with starches or cyclodextrins catalyzed by a cyclodextrin glucanotransferase. J. Mol. Catal. B Enzym. 2015, 120, 151–157. [Google Scholar] [CrossRef]
- Guo, Q.; Zhang, T.; Wang, N.; Xia, Y.; Zhou, Z.; Wang, J.R.; Mei, X. RQ3, A Natural Rebaudioside D Isomer, Was Obtained from Glucosylation of Rebaudioside A Catalyzed by the CGTase Toruzyme 3.0 L. J. Agric. Food Chem. 2019, 67, 8020–8028. [Google Scholar] [CrossRef] [PubMed]
- te Poele, E.M.; Devlamynck, T.; Jäger, M.; Gerwig, G.J.; Van de Walle, D.; Dewettinck, K.; Hirsch, A.K.H.; Kamerling, J.P.; Soetaert, W.; Dijkhuizen, L. Glucansucrase (mutant) enzymes from Lactobacillus reuteri 180 efficiently transglucosylate Stevia component rebaudioside A, resulting in a superior taste. Sci. Rep. 2018, 8, 1516. [Google Scholar] [CrossRef] [PubMed]
- Geuns, J.M.C. Stevia and Steviol Glycosides; China Light Industry Press: Beijing, China, 2013; pp. 3–4. [Google Scholar]
- Wang, W. Synthesis of Monoglucosyl Rebaudioside A and Its Application. Master’s Thesis, Jiangnan University, Wuxi, China, 2020. [Google Scholar]
- Nakagita, T.; Matsuya, T.; Narukawa, M.; Kobayashi, T.; Hirokawa, T.; Misaka, T. Modeling the structure of the transmembrane domain of T1R3, a subunit of the sweet taste receptor, with neohesperidin dihydrochalcone using molecular dynamics simulation. Biosci. Biotechnol. Biochem. 2023, 87, 1470–1477. [Google Scholar] [CrossRef] [PubMed]
- Murata, Y.; Yoshikawa, S.; Suzuki, Y.A.; Sugiura, M.; Inui, H.; Nakano, Y. Sweetness characteristics of the triterpene glycosides in Siraitia grosvenori. J. Jpn. Soc. Food Sci. 2006, 53, 527–533. [Google Scholar] [CrossRef]
- Tao, R.; Cho, S. Consumer-Based Sensory Characterization of Steviol Glycosides (Rebaudioside A, D, and M). Foods 2020, 9, 1026. [Google Scholar] [CrossRef] [PubMed]
- Prakash, I.; Markosyan, A.; Bunders, C. Development of Next Generation Stevia Sweetener: Rebaudioside M. Foods 2014, 3, 162–175. [Google Scholar] [CrossRef]
- Kinghorn, A.D. Stevia: The Genus Stevia; CRC Press: Boca Raton, FL, USA, 2001. [Google Scholar]
- Geuns, J.M. Stevia and Steviol Glycosides. Euprint, Heverlee 2010. Available online: https://www.euprint.be/nl/boeken/wetenschappelijke-boeken/stevia-and-steviol-glycosides (accessed on 5 June 2024).
- Chatsudthipong, V.; Muanprasat, C. Stevioside and related compounds: Therapeutic benefits beyond sweetness. Pharmacol. Therap. 2009, 121, 41–54. [Google Scholar] [CrossRef]


| hT1R2 | hT1R3 | |||
|---|---|---|---|---|
| Sequence Identity | E-Value | Sequence Identity | E-Value | |
| 5X2M_B | 34% | 7 × 10−75 | 37% | 9 × 10−101 |
| 3LMK_A | 25% | 3 × 10⁻²⁸ | 28% | 2 × 10⁻²² |
| 2E4U_A | 26% | 1 × 10−41 | 26% | 4 × 10−43 |
| 1EWK_A | 25% | 6 × 10⁻²³ | 25% | 3 × 10⁻²⁴ |
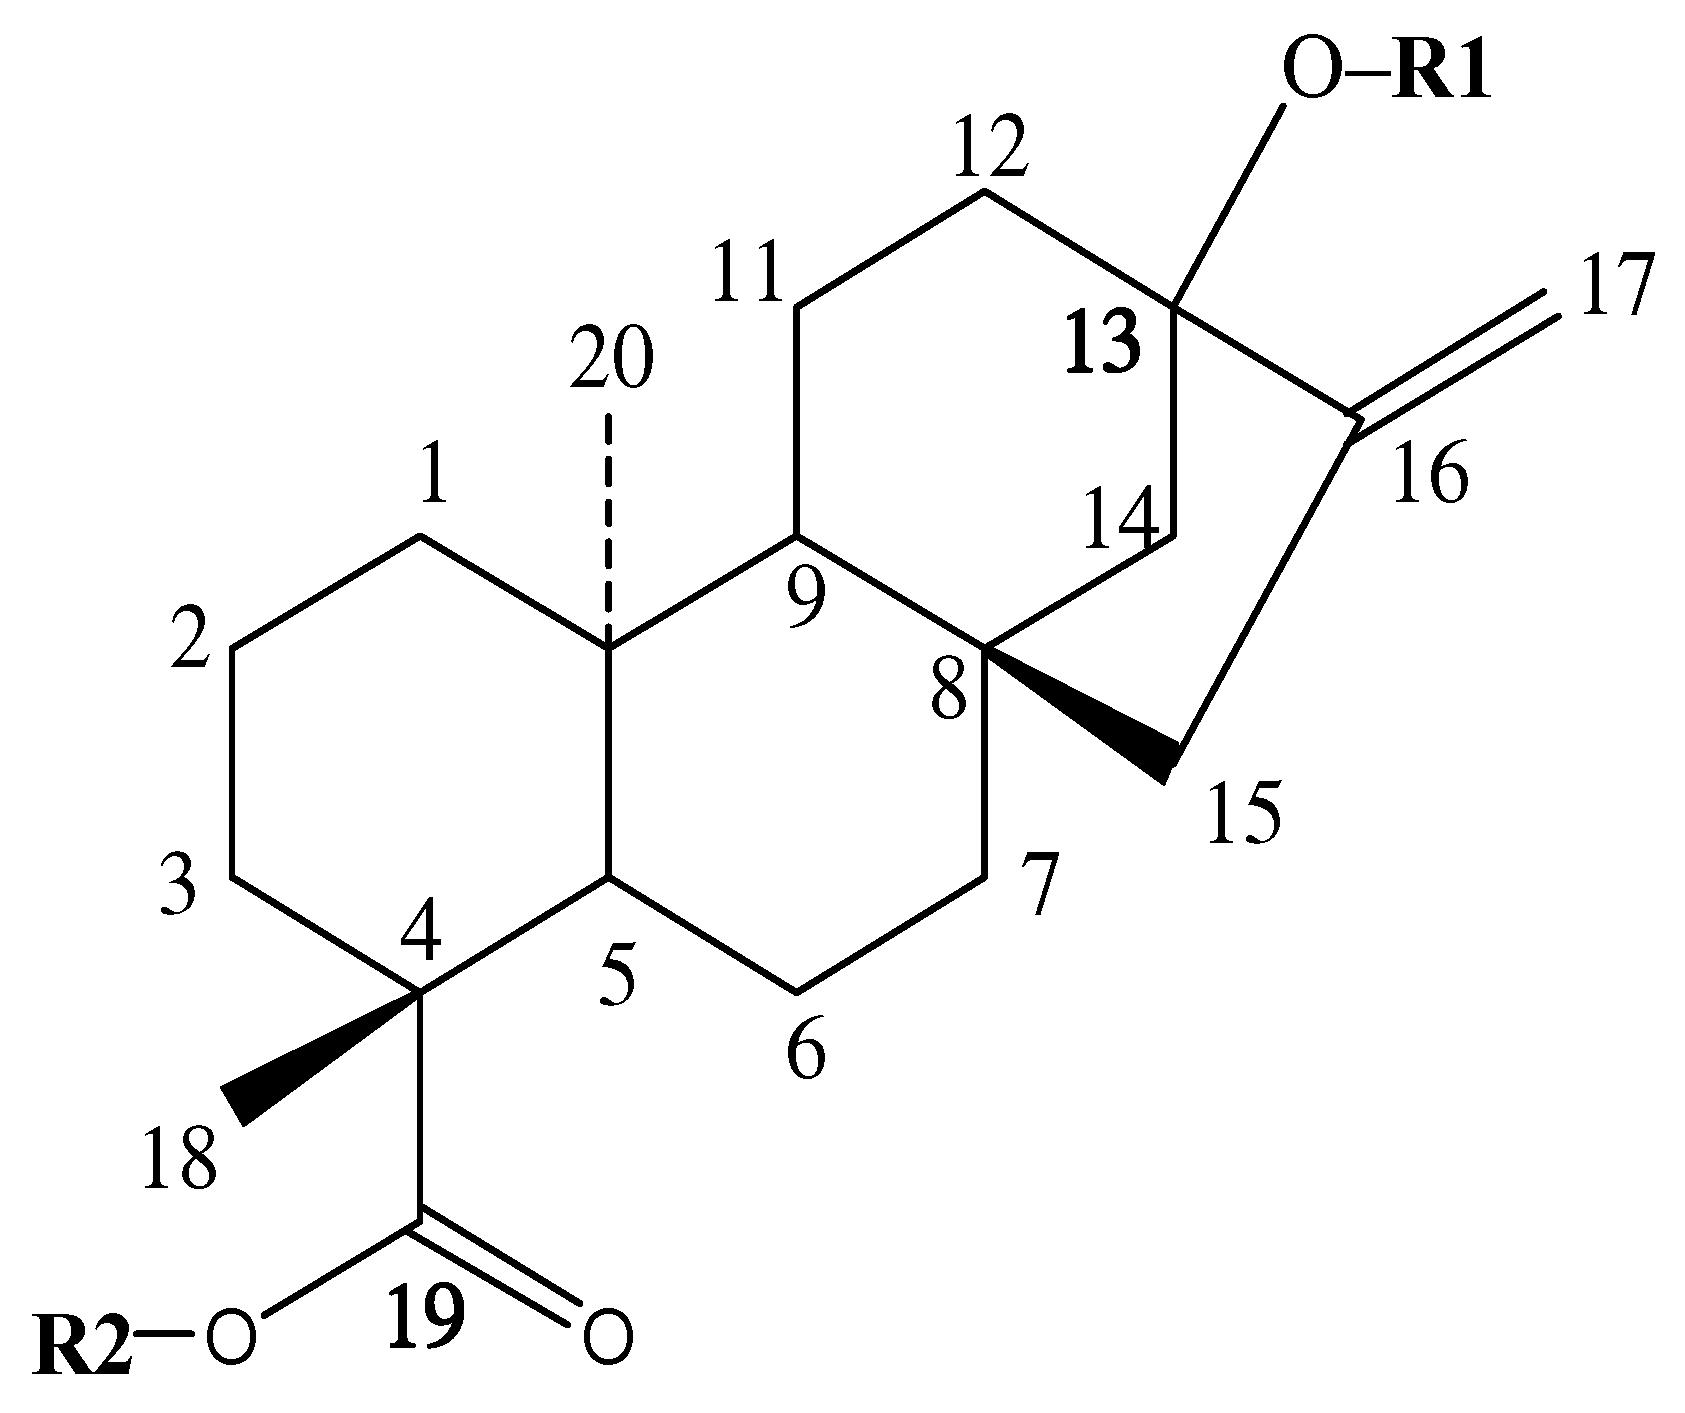
| GSG No. | GSG Classification | R1 (C-13) | R2 (C-19) |
|---|---|---|---|
| 1 | / | Glc(α1-3)Glc(β1-2)Glc(β1- | Glc(β1- |
| 2 | / | Glc(α1-4)Glc(β1-2)Glc(β1- | Glc(β1- |
| 3 | / | Glc(α1-6)Glc(β1-2)Glc(β1- | Glc(β1- |
| 4 | / | Glc(β1-2)[Glc(α1-6)]Glc(β1- | Glc(β1- |
| 5 | / | Glc(β1-3)Glc(β1-2)Glc(β1- | Glc(β1- |
| 6 | RA2 | Glc(β1-6)Glc(β1-2)Glc(β1- | Glc(β1- |
| 7 | RI | Glc(β1-2)[Glc(β1-3)]Glc(β1- | Glc(β1-3)Glc(β1- |
| 8 | / | Glc(β1-2)Glc(β1-2)[Glc(β1-3)]Glc(β1- | Glc(β1- |
| 9 | / | Glc(β1-2)Glc(β1-3)[Glc(β1-2)]Glc(β1- | Glc(β1- |
| 10 | / | Glc(α1-4)Glc(α1-4)Glc(β1-2)Glc(β1- | Glc(β1- |
| 11 | / | Glc(α1-6)Glc(β1-2)[Glc(α1-6)]Glc(β1- | Glc(β1- |
| 12 | / | Glc(β1-3)Glc(β1-2)Glc(β1- | Glc(α1-6)Glc(β1- |
| 13 | RQ3 | Glc(α1-4)Glc(β1-3)[Glc(β1-2)]Glc(β1- | Glc(α1-4)Glc(β1- |
| 14 | / | [Glc(α1-4)]2Glc(β1-2)Glc(β1- | Glc(α1-4)Glc(β1- |
| GSG No. * | IEhT1R2 (KJ/mol) | IEhT1R3 (KJ/mol) | Cumulative IEs (KJ/mol) | hT1R2-Ligand Interactions | hT1R3-Ligand Interactions | IEhT2R4 (KJ/mol) | hT2R4-Ligand Interactions |
|---|---|---|---|---|---|---|---|
| 1 | 47.32 | 75.40 | 122.72 | Lys52, Asn130, Thr229 | Ser130, Ser153, Glu284, Thr288, Gln372 | 52.87 | Met1, Phe69, Val70, Tyr147, Asn165, Thr166, Thr246 |
| 2 | 64.33 | 64.95 | 129.28 | Lys52, Asn130, Ser290 | Asn51, Asp199, Thr288, Ser289, His371 | 33.59 | Met89, Asp92, Tyr147, Ser185 |
| 3 | 49.60 | 73.57 | 123.17 | Tyr90, Ser290, Val296, Asn299 | His128, Glu131, Gly151, Glu200, Gln309, Gln372 | 41.56 | Asn165, Thr166 |
| 4 | 56.27 | 68.56 | 124.83 | Lys52, Asn130, Thr229, Glu289, Ser290, Asp294 | Ser129, Glu131, Ser153, Thr288 | 40.66 | Met1, Thr166 |
| 5 | 45.59 | 78.69 | 124.28 | Lys52, Asn130, Ser290, Asp294, Arg370 | Ser130, Glu131, Gly151, Asp199, Thr288, His371, Gln372 | 42.95 | Asp92, Ser185 |
| 6 | 50.23 | 75.43 | 125.66 | Lys52, Glu289, Ser290, Ser367, Arg370 | Asn51, Trp55, His128, Ser130, Glu131, Asp199, Asn369 | 39.91 | Asn165, Ser185. Ser243 |
| 7 | 44.87 | 76.85 | 121.72 | Ser27, Tyr90, Asn130, Ser131, Leu266, Glu289, Ser290, Asp294 | Glu28, Gly151, Glu284, Ala285, Gln309, Gln372 | 30.27 | Met89, Tyr147, Thr246 |
| 8 | 58.25 | 83.24 | 141.49 | Ser27, Asp129, Asn130, Ser131, Ser152, Tyr202, Thr229, Glu289, Arg370 | Ser130, Asp199, Glu284, Asp290, Gln309, Asn369, Gln372 | 20.10 | Met89, Asn165, Thr166, Ser185, Ser243, Met259, Ser263 |
| 9 | 66.79 | 82.76 | 149.55 | Ser27, Asn130, Ser152, Asp265, Glu289, Ser290 | Asn51, Glu284, Ala285, Asp290 | 18.06 | Phe69, Met89, Ser263 |
| 10 | 61.31 | 80.88 | 142.19 | Ala30, Tyr90, Asn130, Asp294, Arg370 | His128, Ser130, Ser153, His261, Glu284, Ala285, Thr288 | 40.05 | Met89, Tyr147, Thr246, Met259 |
| 11 | 56.92 | 75.41 | 132.33 | Lys52, Asp129, Asp200, Thr229, Glu289, Ser290, Arg370 | Asn51, Glu131, Glu284, Gln309, His371, Gln372 | 25.71 | Asp92, Tyr147, Asn165, Ser185, Ser263 |
| 12 | 45.46 | 81.55 | 127.01 | Ser27, Asp129, Asn130, Glu132 | Glu131, Gly151, Glu284, Gln309 | 46.91 | Ala9, Glu158, Met259, Ser263 |
| 13 | 60.29 | 76.58 | 136.87 | Ser27, Lys52, Asn130, Leu266, Glu289, Ser290, Ser445 | Asn51, Gly151, Ser153, Thr288, Asn369 | 18.21 | Phe69, Thr246, Ser263 |
| 14 | 52.54 | 87.06 | 139.60 | Lys52, Thr229, Glu289, Ser290, Ser367, Arg370 | Asp199, Thr288, Asp290, Asn369, Leu451 | 27.41 | Ser154, Thr166, Tyr250, Ser263 |
Disclaimer/Publisher’s Note: The statements, opinions and data contained in all publications are solely those of the individual author(s) and contributor(s) and not of MDPI and/or the editor(s). MDPI and/or the editor(s) disclaim responsibility for any injury to people or property resulting from any ideas, methods, instructions or products referred to in the content. |
© 2024 by the authors. Licensee MDPI, Basel, Switzerland. This article is an open access article distributed under the terms and conditions of the Creative Commons Attribution (CC BY) license (https://creativecommons.org/licenses/by/4.0/).
Share and Cite
Zhou, Z.; Li, W.; Wang, H.; Xia, Y. A Computational Approach to Understanding and Predicting the Edulcorant Profile of Glucosyl Steviol Glycosides. Foods 2024, 13, 1798. https://doi.org/10.3390/foods13121798
Zhou Z, Li W, Wang H, Xia Y. A Computational Approach to Understanding and Predicting the Edulcorant Profile of Glucosyl Steviol Glycosides. Foods. 2024; 13(12):1798. https://doi.org/10.3390/foods13121798
Chicago/Turabian StyleZhou, Zhuoyu, Wei Li, Haijun Wang, and Yongmei Xia. 2024. "A Computational Approach to Understanding and Predicting the Edulcorant Profile of Glucosyl Steviol Glycosides" Foods 13, no. 12: 1798. https://doi.org/10.3390/foods13121798