Abstract
The polysaccharides were extracted from the leaves of Mallotus oblongifolius (MO) using an ultrasonic-assisted extraction method in this study. The main variables affecting the yield of polysaccharides extracted from Mallotus appallatus (MOPS) were identified and optimized while concurrently investigating its antioxidant capacity, hypoglycemic activity, and digestive properties. The results indicated that the optimal ultrasound-assisted extraction of MOPS involved an ultrasound power of 200 W, a liquid-to-solid ratio of 25:1 (mL:g), an extraction temperature of 75 °C, and an ultrasound time of 45 min, leading to an extraction yield of (7.36 ± 0.45)% (m/m). The MOPS extract exhibited significant scavenging activity against DPPH and ABTS radicals with IC50 values of (25.65 ± 0.53) μg/mL and (100.38 ± 0.38) μg/mL, respectively. Furthermore, it effectively inhibited the enzymatic activities of α-glucosidase and α-amylase with IC50 values of (2.27 ± 0.07) mg/mL and (0.57 ± 0.04) mg/mL, respectively. The content of MOPS remained relatively stable in the stomach and small intestine; however, their ability to scavenge DPPH radicals and ABTS radicals and exhibit reducing power was attenuated, and the inhibition of α-amylase and α-glucosidase activity was diminished. In conclusion, the ultrasonic extraction of MOPS showed feasibility and revealed antioxidant and hypoglycemic effects. However, the activities were significantly reduced after gastric and small intestinal digestion despite no significant change in the MOPS content.
1. Introduction
Mallotus oblongfolius (MO) [Mallotus oblongifolius (Miq.) MuellArg], Euphorbiaceae, commonly known as mountain bitter tea, Maocha, etc. [1], is mainly distributed in Sumatra, the Sino–Indian Peninsula, and China’s Hainan region [2]. It is abundant in polyphenols, polysaccharides, β-sitosterol, volatile oils, and other bioactive compounds [3]. MO exhibits remarkable properties, including potent antioxidant, anti-aging, sialagogic, and anti-inflammatory effects [4]. Moreover, MO is frequently employed as a tea substitute [5]. However, the exploitation of its resources remains underutilized. Therefore, it is imperative to explore strategies for maximizing the high-value utilization of MO resources.
In recent years, the focus of MO research has predominantly centered on the analysis of chemical composition and evaluation of polyphenolic activity [6]. For example, the polyphenol extracted from MO has been demonstrated to possess robust antioxidant and antibacterial properties [7], as well as the ability to prevent ethanol damage to the gastric mucosa [8]. However, there have been no documented studies investigating MOPS. Plant polysaccharides have various activities, such as antioxidant [9,10], anti-obesity [11] and hypoglycaemic effects [12]. Consequently, they are widely used in the fields of functional food and medicine. Polysaccharides are the main active bioactive compounds in MO, and exploring the nutritional and functional properties of MOPS provides a crucial avenue for the high-value utilization of MO resources.
Plant polysaccharides can be extracted using various methods, such as hot water immersion, ultrasonic-assisted extraction [13], microwave-assisted extraction [14], and enzyme-assisted extraction [15]. The ultrasonic-assisted extraction method is particularly advantageous in terms of its operational simplicity and high efficiency in extracting the target compound [16]. The structure, content, antioxidant, and hypoglycemic properties of polysaccharides may exhibit variables in a variety of digestive tract enzymes and an acid-base environment, causing inconsistent patterns of change in gastrointestinal digestion. For example, Oolong tea polysaccharides can be slightly digested by the gastrointestinal tract [17], and Qingchengliu polysaccharides exhibit negligible effects during simulated gastrointestinal digestion [18]. Therefore, it is crucial to investigate the extraction process and gastrointestinal digestion characteristics of MOPS, which are applied in the fields of functional foods and pharmaceuticals, and thereby enhance the applicability and value proposition of MO. In this work, the ultrasonic-assisted extraction method was employed to extract MOPS from MO leaves while simultaneously identifying and optimizing the key variables influencing the yield of polysaccharides extracted from MOPS. Additionally, this study investigated the antioxidant capacity, hypoglycemic activity, and digestive properties of MOPS in order to enhance our understanding of its physiological activities and provide support for its high-value utilization.
2. Materials and Methods
2.1. Materials and Chemicals
The samples of Mallotus oblongfolius (MO) were collected in Tonggu Ling, Wenchang City, Hainan Province, in November 2022. The green fresh leaves were selected as the experimental sample. Subsequently, they were subjected to a drying process at 55 °C and subsequently crushed through a 40-mesh sieve to obtain the MO powder, which was utilized for crude polysaccharide extraction.
Glucose standard, activated carbon (Xilong Science Co., Ltd., Shanghai, China). Concentrated sulfuric acid, phenol, and hydrochloric acid (Sinopharm Chemical Reagent Co., Ltd., Beijing, China). Bovine serum albumin V, (3000 U/g), and pancreatin (4000 U/g) (Sigma-Aldrich, Saint Louis, MO, USA). Inulin (Aladdin Co. Ltd., Shanghai, China). All other reagents were of analytical grade.
2.2. Extraction of MOPS
MO powder (10 g) was added to distilled water (the liquid-to-solid ratio ranged from 10:1 to 30:1 mL/g), followed by ultrasonication (X0-5200DTS Ultrasonic Cleaning Machine Nanjing Xian’ou Instrument Manufacturing Co., Ltd., Nanjing, China). The extraction temperature ranged from 35 °C to 75 °C, while the extraction time varied between 15 and 75 min). The samples were centrifuged using a high-efficiency refrigerated centrifuge (Avanti JXN-30, Shanghai Hengfei Biotechnology Co., Shanghai, China) at 2000 r/min for 6 min to obtain the polysaccharide extract of Partridge tea. The extraction steps were repeated twice, and the extracts were combined. The crude polysaccharide extract of partridge tea was concentrated using vacuum rotary evaporation (CF312L-B Cooling Water Circulation Unit, RE212 Rotary Evaporator Japan Yamato Joon & Shanghai Co., Ltd., Shanghai, China) at 40 °C, followed by the addition of anhydrous ethanol in a volume four times that of the extract. The resulting mixture was allowed to stand at a constant temperature of 4 °C for 12 h. After that, the mixture was centrifuged at 4500 r/min for 15 min to collect the precipitate. A small quantity of water was added to dissolve the precipitate, and the Sevage method was employed for protein removal (using a 4:1 ratio of polysaccharide solution to Sevage reagent (chloroform/n-butanol volume ratio of 4:1 for the mixture of solutions)) [19]. The mixture was placed in a dispensing funnel, vigorously shaken for 15 min, and allowed to rest for 30 min, and then the protein layer and organic solvent layer were discarded. This process was repeated until no protein remained. Decolorization and concentration were performed using 4% activated carbon (ZiRBUS Freeze Dryer Shanghai Jipu Electronic Technology Co., Ltd., Shanghai, China). The resulting concentrate was collected and subjected to freeze-drying to obtain crude MOPS.
2.3. Calculation of MOPS Yield
2.3.1. Drawing of Standard Curve
Glucose content was determined by the phenol–sulfuric acid method [20] using spectrophotometer analysis (TU-1810 UV-visible Spectrophotometer Beijing Puyi General Instrument Co., Ltd., Beijing, China). The 0.01, 0.02, 0.03, 0.04, and 0.05 mg/mL of glucose standard solution were individually pipetted into separate vials with a 2 mL volume each. Subsequently, a 1 mL volume of a phenol solution containing a concentration of 6% was added to each vial, followed by vigorous shaking. The mixture was subjected to the addition of 5 mL of concentrated sulfuric acid in a vertical manner, followed by allowing it to stand for 5 min. Subsequently, the absorbance value at 490 nm was measured after immersing the sample in a water bath at 50 °C for 20 min. The regression equation for the glucose standard was established using distilled water as a blank control, with the mass concentration C (mg/mL) of glucose as the horizontal coordinate and the absorbance value A as the vertical coordinate: A = 14.226 C − 0.0163, R2 = 0.9956.
2.3.2. Determination of MOPS Content
The MOPS content was determined using the phenol–sulfuric acid method, which is consistent with the methodology described in Section 2.3.1. The polysaccharide yield was calculated using the provided equation as follows:
Herein, A is the concentration of the MOPS solution, mg/mL−1; D is the MOPS dilution; V is the volume of MOPS extract, mL; and m is the mass of MO powder, mg.
2.4. Optimization of MOPS Extraction Process
2.4.1. Single Factor Experimental Design
The extraction conditions for 5 g of MO powder were determined based on the polysaccharide extraction rate. These conditions included an ultrasonic power of 200 W, a temperature of 55 °C, a liquid-to-solid ratio of 1:20 (g/mL), and a time of 30 min. The remaining conditions were held constant, and the impacts of ultrasonic power (100, 150, 200, 250, and 300 W), temperature (35, 45, 55, 65, and 75 °C), liquid-to-solid ratio (1:10, 1:15, 1:20, 1:25, and 1:30 g/mL), and time (15, 30, 45, 60, and 75 min) on the yield of MOPS were investigated in sequence. The effects of ultrasonic power (100, 150, 200, 250, 300 W), temperature (35, 45, 55, 65, and 75 °C), liquid-to-solid ratio (1:10, 1:15, 1:20, 1:25, and 1:30 g/mL), and time (15, 30, 45, 60, and 75 min) on the extraction rate of polysaccharide was investigated to obtain the optimal conditions for each factor.
2.4.2. Response Surface Experimental Design
The polysaccharide dissolution approached equilibrium with a liquid–solid ratio of 20:1 (mL/g) while maintaining a relatively stable yield. Based on the results of the single-factor test, three factors (ultrasonic power, extraction temperature, and extraction time) that exerted a significant influence on the alteration in polysaccharide yield were selected as the experimental variables. The MOPS yield was utilized as the response variable for optimizing the extraction process of polysaccharides. The extraction process was optimized using the Box-Benhnken Design principle in Design Expert 13 software, employing a three-factor, three-level response surface test. The factors and levels of the central combination design are shown in Table 1.

Table 1.
Independent variables and their levels used in the response surface design.
2.5. Determination of Antioxidant Activity of MOPS
MOPS was formulated into different mass concentration gradients, and their antioxidant activities were determined by the DPPH [21] method, ABTS [22] method, and reducing power method [23].
2.6. Determination of Hypoglycaemic Activity of MOPS
The inhibitory effects of MOPS on α-glucosidase and α-amylase were determined to evaluate their hypoglycaemic activities [24].
2.7. The MOPS Experiment Simulates In Vitro Digestion
2.7.1. Vitro Simulation of Oral Digestion
The simulated digestion method employed in this study was based on previous research with slight modifications [25]. In total, 15 mL of the sample solution with 15 mL of oral electrolytes (0.7644 g NaCl, 1.491 g KCl, 0.1332 g CaCl2 dissolved in 1000 mL of distilled water, pH adjusted to 6.9 ± 0.05 with 1 mol/L HCl and 1 mol/L NaHCO3) was taken. Additionally, 2.3 mg of α-amylase was added to the mixture, which was thoroughly mixed and then oscillated at a constant temperature of 37 °C for a duration of 2 h. At specific time intervals (0, 30, 90, 120, and 150 min), the remaining oral digest was extracted. Subsequently, a volume of 2 mL from each time point was extracted and subjected to enzyme inactivation by heating at 100 °C for 10 min before storage for subsequent analysis.
2.7.2. Vitro Simulation of Gastric Digestion
The oral digestive fluid (20 mL) was combined with gastric electrolytes (0.22 g KCl, 0.12 g NaHCO3, 0.05 g CaCl2, 0.62 g NaCl dissolved in 200 mL of distilled water). The resulting mixture’s pH was adjusted to 2 using a solution of 1 M HCl. Subsequently, pepsin (27 mg) was thoroughly mixed into the solution and subjected to oscillation at a constant temperature of 37 °C for a duration of 2 h. In total, 2 mL of gastric digestive fluid was removed from the stomach at 0, 30, 90, and 120 min, and 2 mL of gastric digestive fluid was inactivated at 100 °C for 10 min and stored for further digestion experiments. After 150 min, an additional two milliliters were withdrawn for testing while the enzyme was again inactivated at 100 °C for 10 min. The remaining gastric digest was utilized for further digestion experiments.
2.8. Vitro Simulation of Enteral Digestion
The 20 mL of gastric digestive fluid and 20 mL of intestinal electrolytes (0.065 g KCl, 0.54 g NaCl, 0.033 g CaCl2 were dissolved in 100 mL of distilled water. The pH of the mixture was adjusted to 7 (using 1 mol/L NaHCO3) and was thoroughly mixed. Subsequently, a solution containing 160 mg of bile salts and 200 mg of pancreatic enzymes was vigorously shaken at a constant temperature of 37 °C for 2 h. The sample was then incubated at temperatures of 0, 30, 90, and 120 °C for a duration of 2 h each. At time intervals of 0, 30, 90, and 150 min during the incubation period, aliquots of the solution (2 mL) were withdrawn. Following this step, the enzyme was inactivated by heating at a temperature of 100 °C for10 min before being stored for further testing.
2.9. Statistical Analysis
Each experiment was repeated three times, and the data quality was assessed by calculating the standard deviation (SD). The experimental design was conducted using Design Expert 13 software, while graphing was performed using Origin 8.5 software. The data were analyzed for statistical significance using IBM SPSS Statistics 23 software through one-way ANOVA. A * p < 0.05 was considered indicative of a significant difference, while a ** p < 0.01 indicated a highly significant difference.
3. Results and Analysis
3.1. Results of the Single-Factor Test
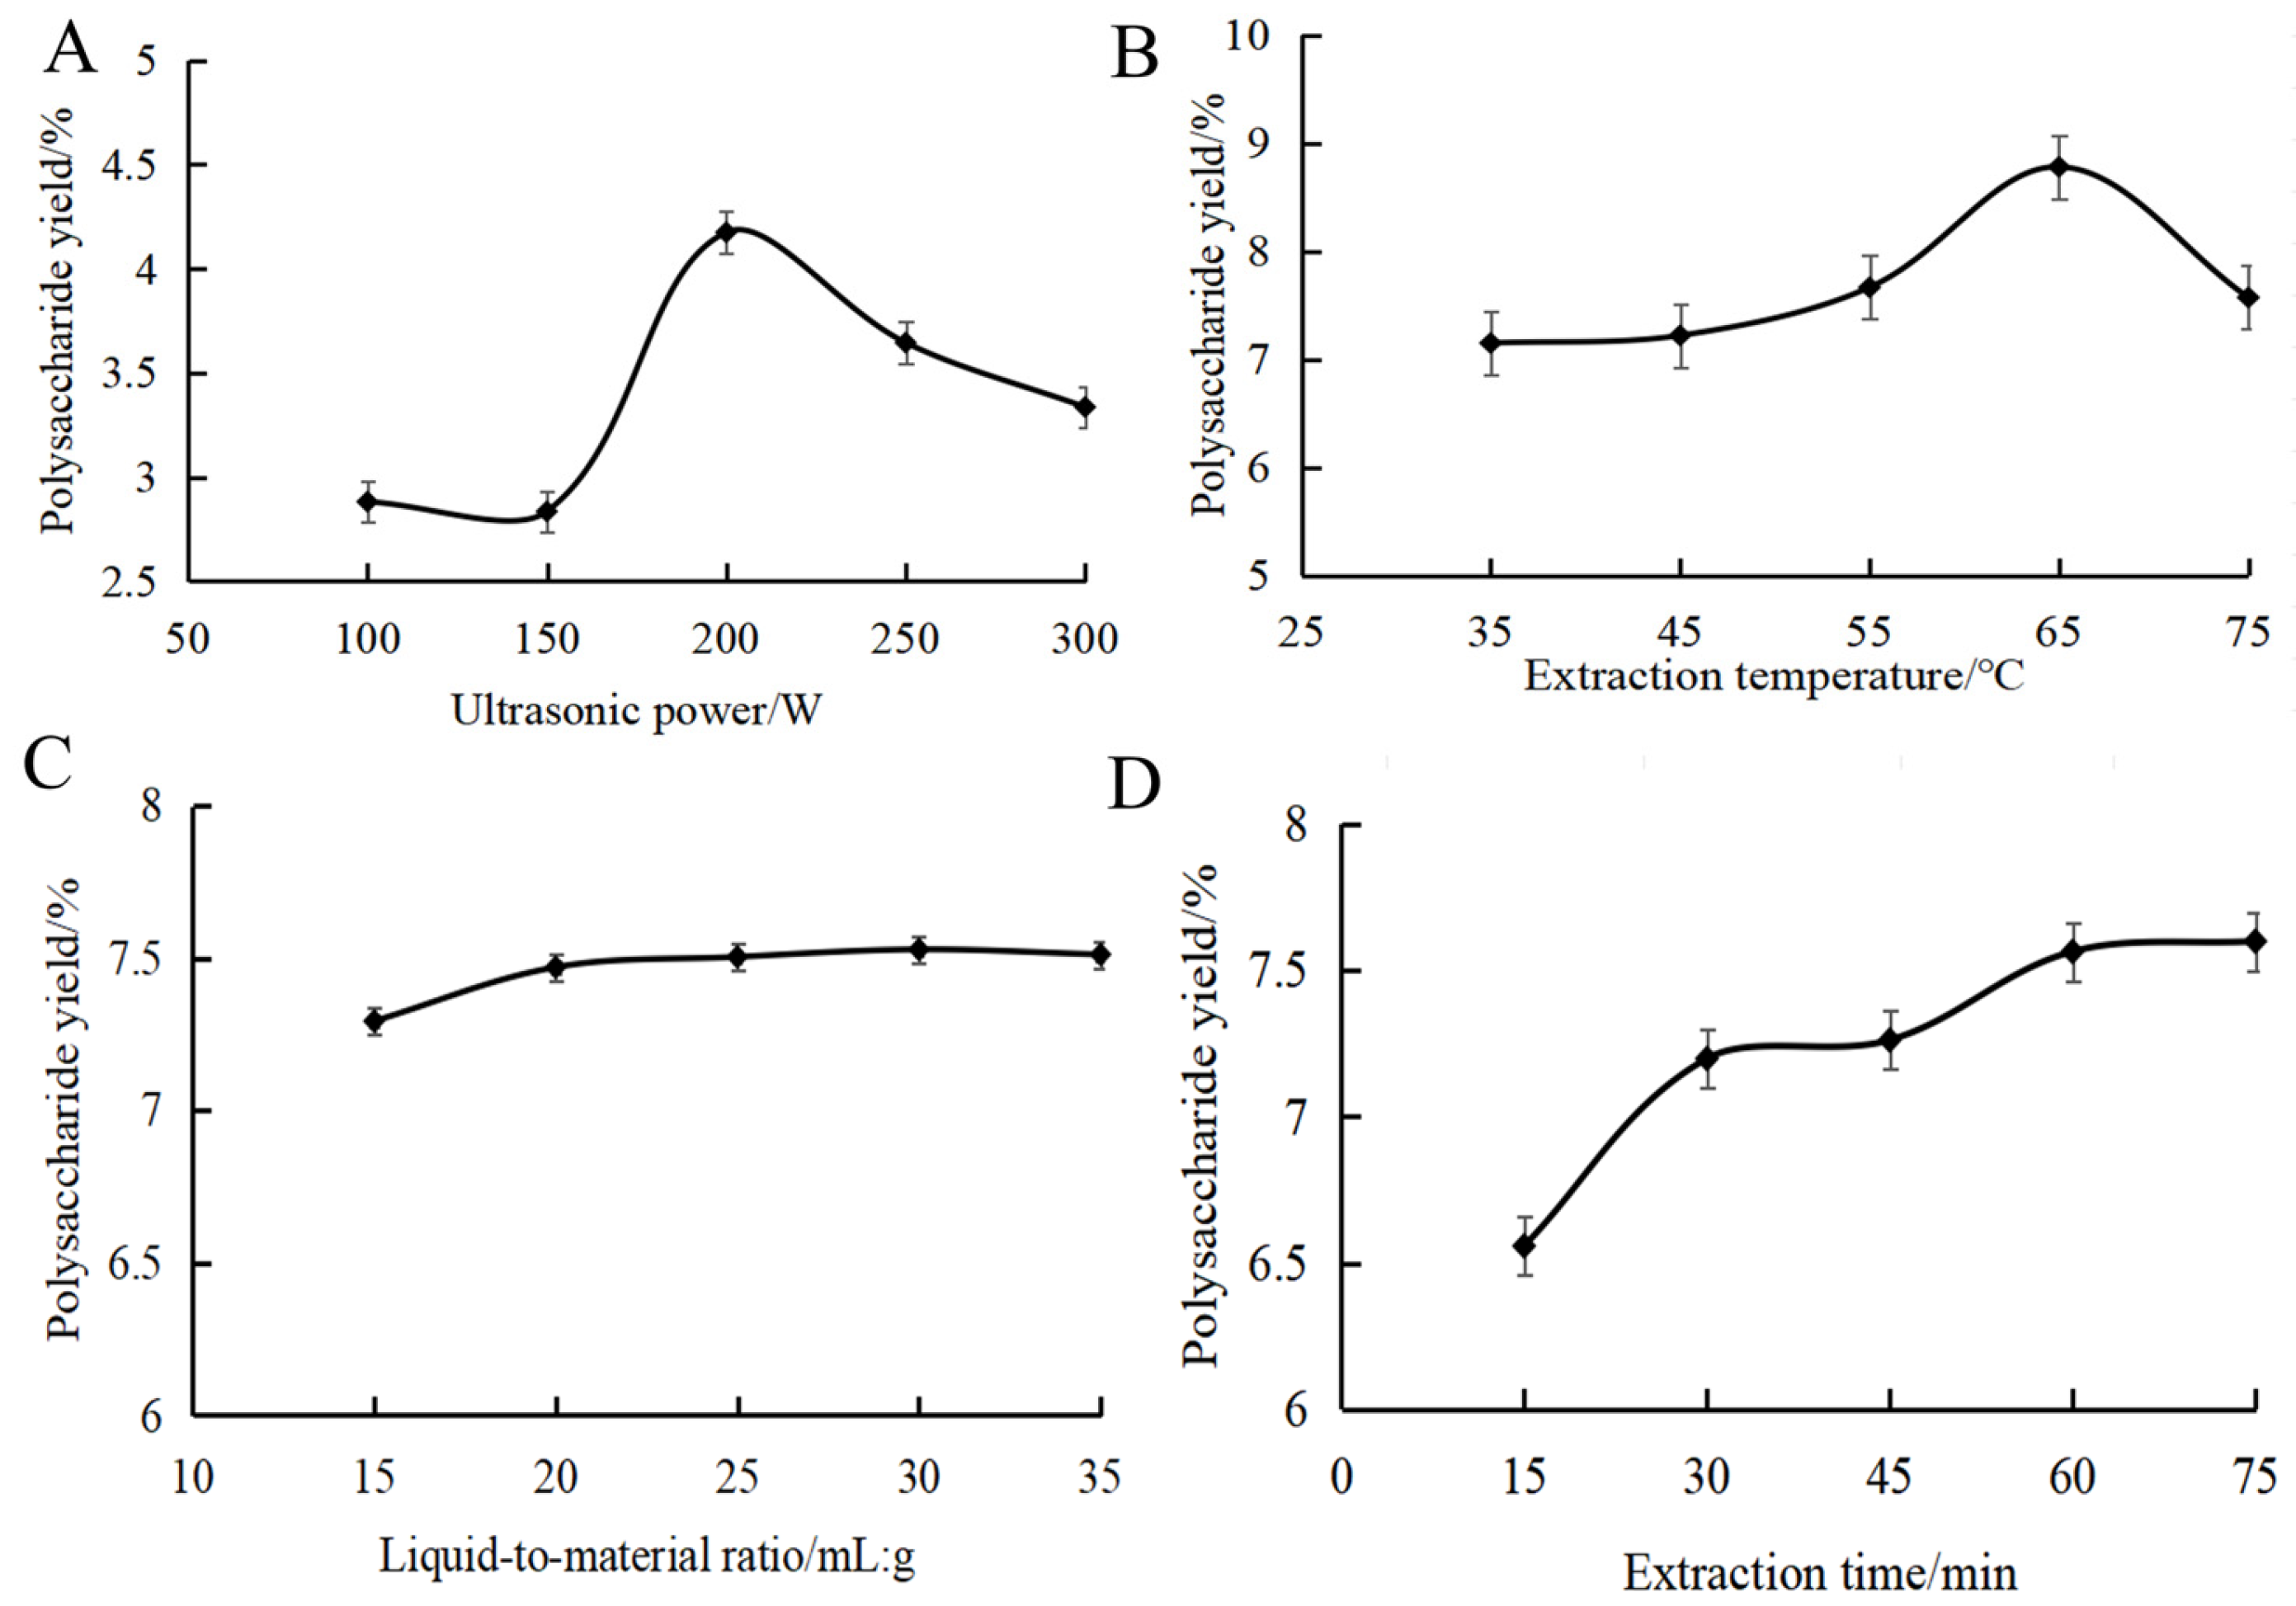
Figure 1A shows the effect of ultrasonic power on the yield of MOPS. The yield of MOPS exhibited an initial increase followed by a subsequent decrease in response to the varying ultrasonic power, ultimately reaching its peak value at 4.17 ± 0.02% when the ultrasonic power was set at 200 W. This might be because cavitation was enhanced with the increase in ultrasonic power. The mechanical vibration effect of ultrasound shattered the cell wall, releasing more polysaccharides and thereby increasing the MOPS yield. When the ultrasonic power exceeded 200 W, the intense ultrasonic action promoted the cleavage of polysaccharide molecular chains, causing a decrease in the yield [26]. It was appropriate to choose ultrasonic power at around 200 W.
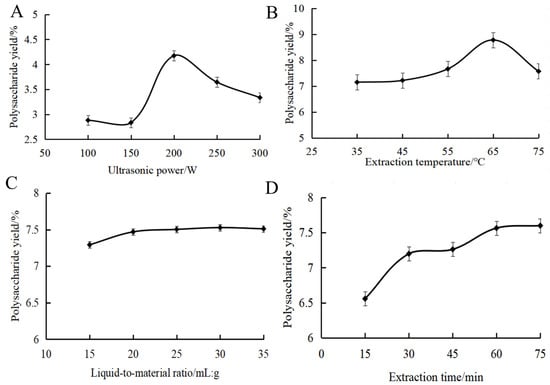
Figure 1.
Effect of ultrasonic power (A), extraction temperature (B), liquid-to-material ratio (C) and extraction time (D) on the polysaccharide yield of partridge tea.
The effect of extraction temperature on the yield of MOPS is shown in Figure 1B. As can be seen from the figure, an increase in ultrasonication time led to a rise in MOPS yield followed by a slight decrease, with the maximum polysaccharide yield achieved at 60 min (7.52 ± 0.05%). Subsequently, as the temperature continued to rise, there was a decrease in polysaccharide yield. This phenomenon can be attributed to the intensified diffusion of polysaccharide molecules and subsequent increase in solubility at temperatures above 65 °C. Excessively high temperatures above 65 °C led to the cleavage of polysaccharides, resulting in a decrease in polysaccharide yield [27]. It was appropriate to choose the extraction temperature at around 65 °C.
The effect of the liquid-to-material ratio on the yield of MOPS can be seen in Figure 1C. The MOPS yield initially increased and then reached a plateau as the liquid ratio increased. Due to increased solvent volume, the polysaccharides dissolved sufficiently at the liquid ratio below 20:1 mL/g, resulting in an enhanced yield. However, the dissolution of polysaccharides reached an equilibrium at the liquid ratio of more than 20:1 mL/g; further increasing the liquid ratio did not have a significant effect on the solubilization of polysaccharides [28]. Therefore, the liquid–liquid ratio was selected as 20:1 mL/g in this study.
The effect of the ultrasound time on the yield of MOPS can be seen in Figure 1D. As depicted, an increase in ultrasonication time led to a rise in MOPS yield followed by a slight decrease, with the maximum polysaccharide yield achieved at 60 min (7.52 ± 0.05%). This phenomenon may be attributed to enhanced cell fragmentation and the dissociation of polysaccharides, resulting in an increased yield within the first 60 min of ultrasound exposure. However, when the ultrasonic treatment time was extended beyond 60 min, the polysaccharide structure may change due to the increase in temperature, resulting in a decrease in the yield of polysaccharides [29]. Therefore, it was deemed appropriate to choose an approximate 60 min duration for the sonication.
3.2. Response Surface Optimization of MOPS Extraction Experiment
3.2.1. Regression Equations
The data in Table 2 were analyzed using the Box-Bohnken method, with the MOPS yield being considered as the response variable. The regression equation of the MOPS yield Y on the coded values of ultrasonic power (A), temperature (B), and time (C) was obtained as Y = 6.64 – 0.4715A − 0.0199B − 0.0126C + 0.0464AB + 0.0453AC + 0.1419BC + 0.2938A2 – 0.3437B2 – 0.2754C2. The results of the multiple regression equation analysis of the factors influencing the MOPS yield are presented in Table 3. From the table, it is evident that the model exhibits a highly significant p-value (<0.0001) and a non-significant misfit term (p = 0.7566 > 0.05), indicating its ability to accurately reflect the experimental conditions. Furthermore, with a coefficient of variation of 0.91% (<10%), the model demonstrates excellent experimental stability and minimal susceptibility to external factors. The regression model yielded an R2 value of 0.9846 and an adjusted R2Adj value of 0.9647, indicating a strong correlation between the experimental and actual models, with over 98% of the true values accurately predicted by the model. According to Table 3, BC exhibited a significant effect on the MOPS yield (p < 0.01). A, A2, B2, and C2 demonstrated highly significant effects on the MOPS yield (p < 0.01), while the remaining factors showed no significant effect. Therefore, the order of the three factors influencing the yield of MOPS was determined to be A > B > C, specifically ultrasonic power> extraction temperature > extraction time.
Table 2.
Response surface test design and results.
Table 3.
Variance analysis of regression model.
3.2.2. Response Surface Analysis
The response surfaces and contour plots are effective tools for visualizing the extent of interaction influence on the values of the response surface [30]. As shown in Figure 2A,D, the relationship observed between extraction temperature and time demonstrates a steep slope and an elliptical contour line, indicating a significant interaction between these two factors. However, the surface of ultrasonic power and temperature exhibits a gentle slope and round contour lines, indicating a weak interaction between the two variables, as observed in Figure 2B,E. In addition, as depicted in Figure 2C,F, the gradients of the ultrasonic power–time surfaces exhibit a gentle inclination with circular contour lines, suggesting a weak interaction between these two variables.
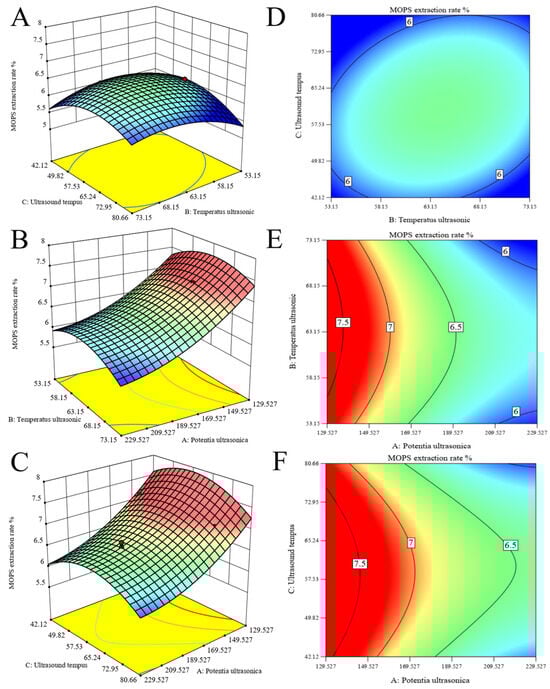
Figure 2.
Optimization of MOPS extraction. Response surface plots (A–C) and contour lines (D–F) of ultrasonic extraction interactions were obtained, and extraction temperature, extraction time, and ultrasonic power were used as independent variables to optimize polysaccharide extraction.
3.2.3. Optimized Process Validation Experiments
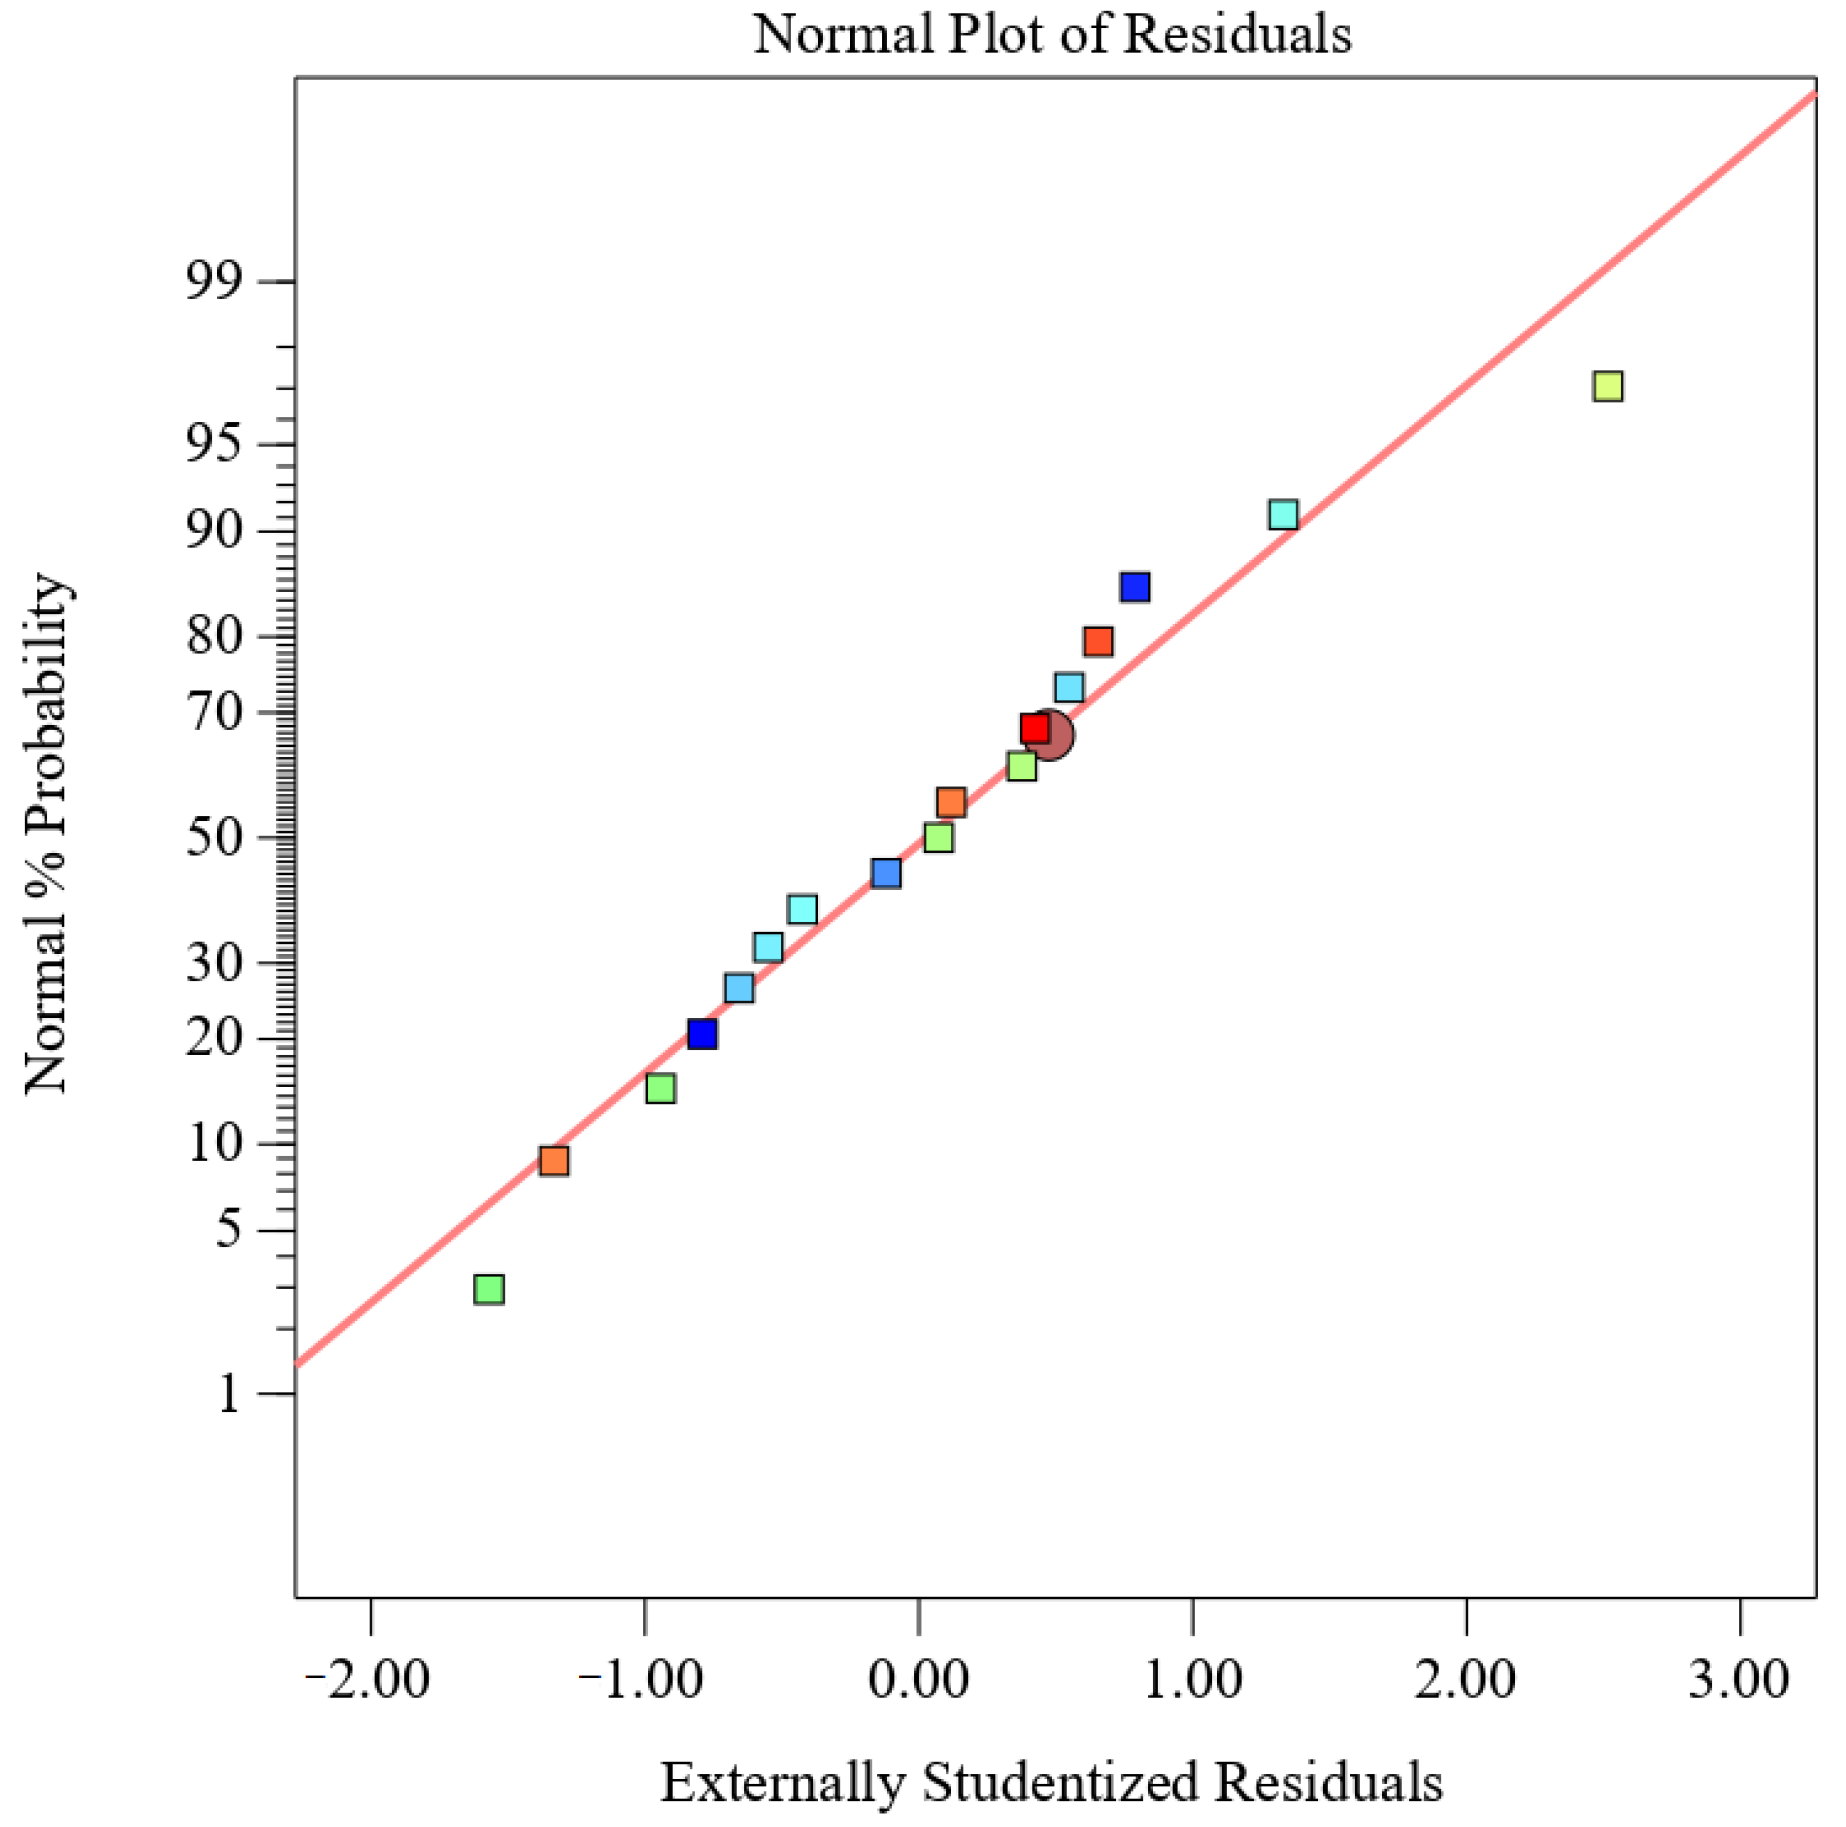
From the normal probability of residuals in Figure 3, it can be seen that the normality assumption is supported by the straight-line approximation of the residual curves, indicating the feasibility of the proposed model for predicting MOPS yield. The optimal extraction conditions for achieving the highest yield of tea polysaccharide (7.22%) were determined using Design Expert 13 software, with a power input of 218 W, temperature set at 75 °C, and an extraction time of 45 min. According to the possibility and convenience of experimental operation, the extraction conditions were adjusted to 200 W, 75 °C, and 45 min. Three replicates were conducted under these adjusted conditions, resulting in an MOPS yield of (7.36 ± 0.45)%, which was consistent with the theoretical prediction. These findings demonstrate that it was feasible to extract MOPS using these conditions.
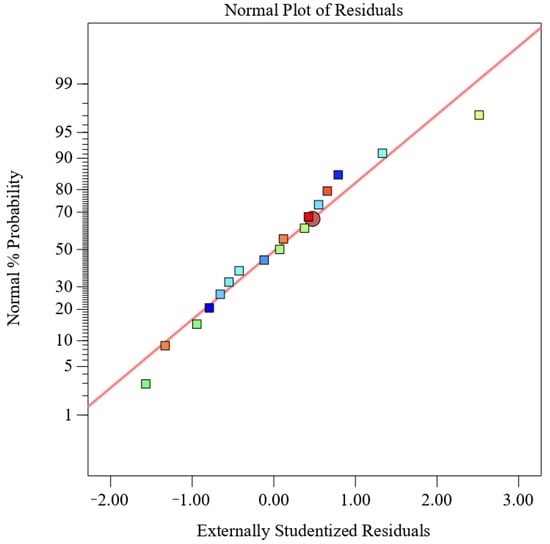
Figure 3.
Normal probability plot of residuals.
3.3. Antioxidant Effects of MOPS
3.3.1. Free radical Scavenging and Reducing Capacity of MOPS
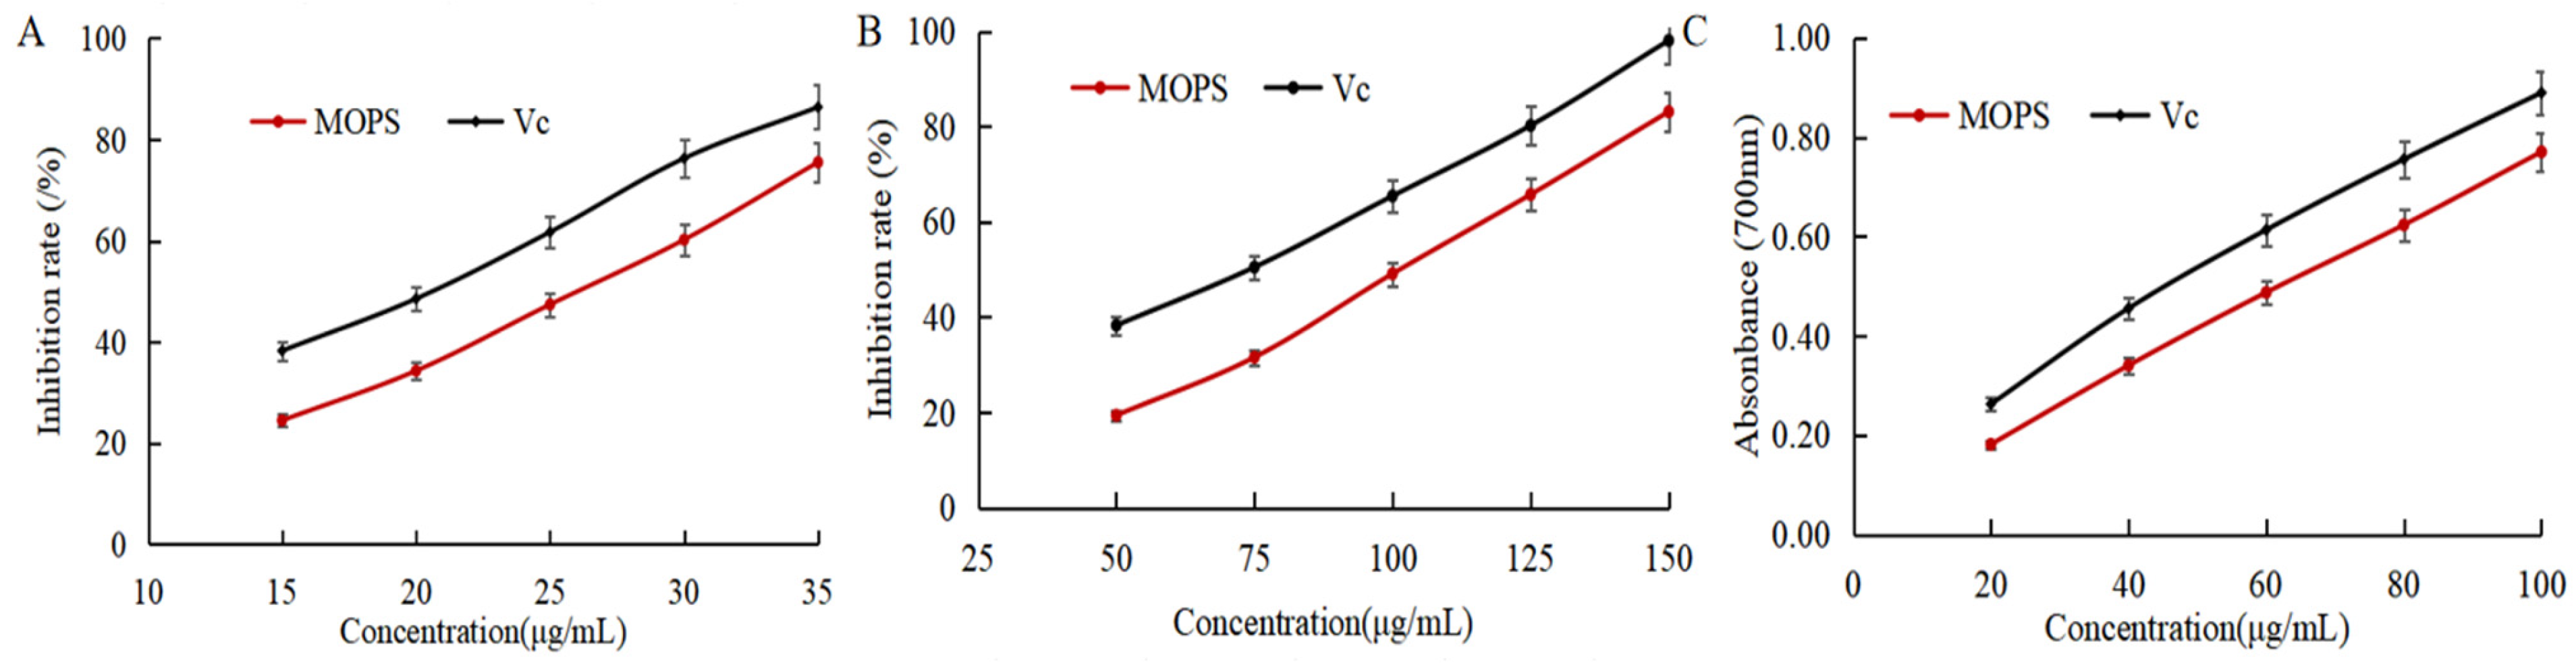
DPPH, ABTS radical scavenging capacity, and reducing power is usually used to assess the antioxidant activity index [31]. As shown in Figure 4A,B, the scavenging rate of DPPH and ABTS free radicals gradually increased with the increase in the mass concentration of MOPS. The IC50 of DPPH and ABTS radical scavenging by MOPS were (25.65 ± 0.53) and (100.38 ± 0.38) μg/mL, respectively, which were higher than the IC50 (20.79 ± 0.32) and (72.41 ± 0.59) μg/mL of Vc, indicating that the MOPS had the scavenging ability of DPPH and ABTS free radicals, but the anti-free radical ability was lower than that of Vc. The reducing power of MOPS extract and VC increased with the increase in extract mass concentration, as depicted in Figure 4C. The reduction ability of MOPS can be indirectly reflected by the absorption value at 700 nm, and the greater the absorbance, the stronger the reduction ability [32]. When the concentrations of MOPS extract and VC were 60 μg/mL, the corresponding absorbance values were 0.613 ± 0.08 and 0.636 ± 0.11, respectively, indicating that the reducing power of the MOPS extract was comparatively weaker than that of Vc.
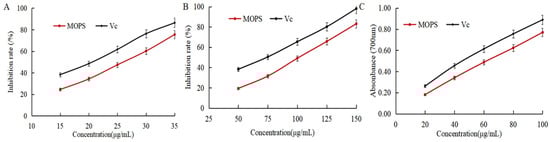
Figure 4.
Effects of MOPS on the scavenging of DPPH free radicals (A), scavenging of ABTS free radicals (B), and reducing power (C).
3.3.2. Hypoglycaemic Effect of MOPS
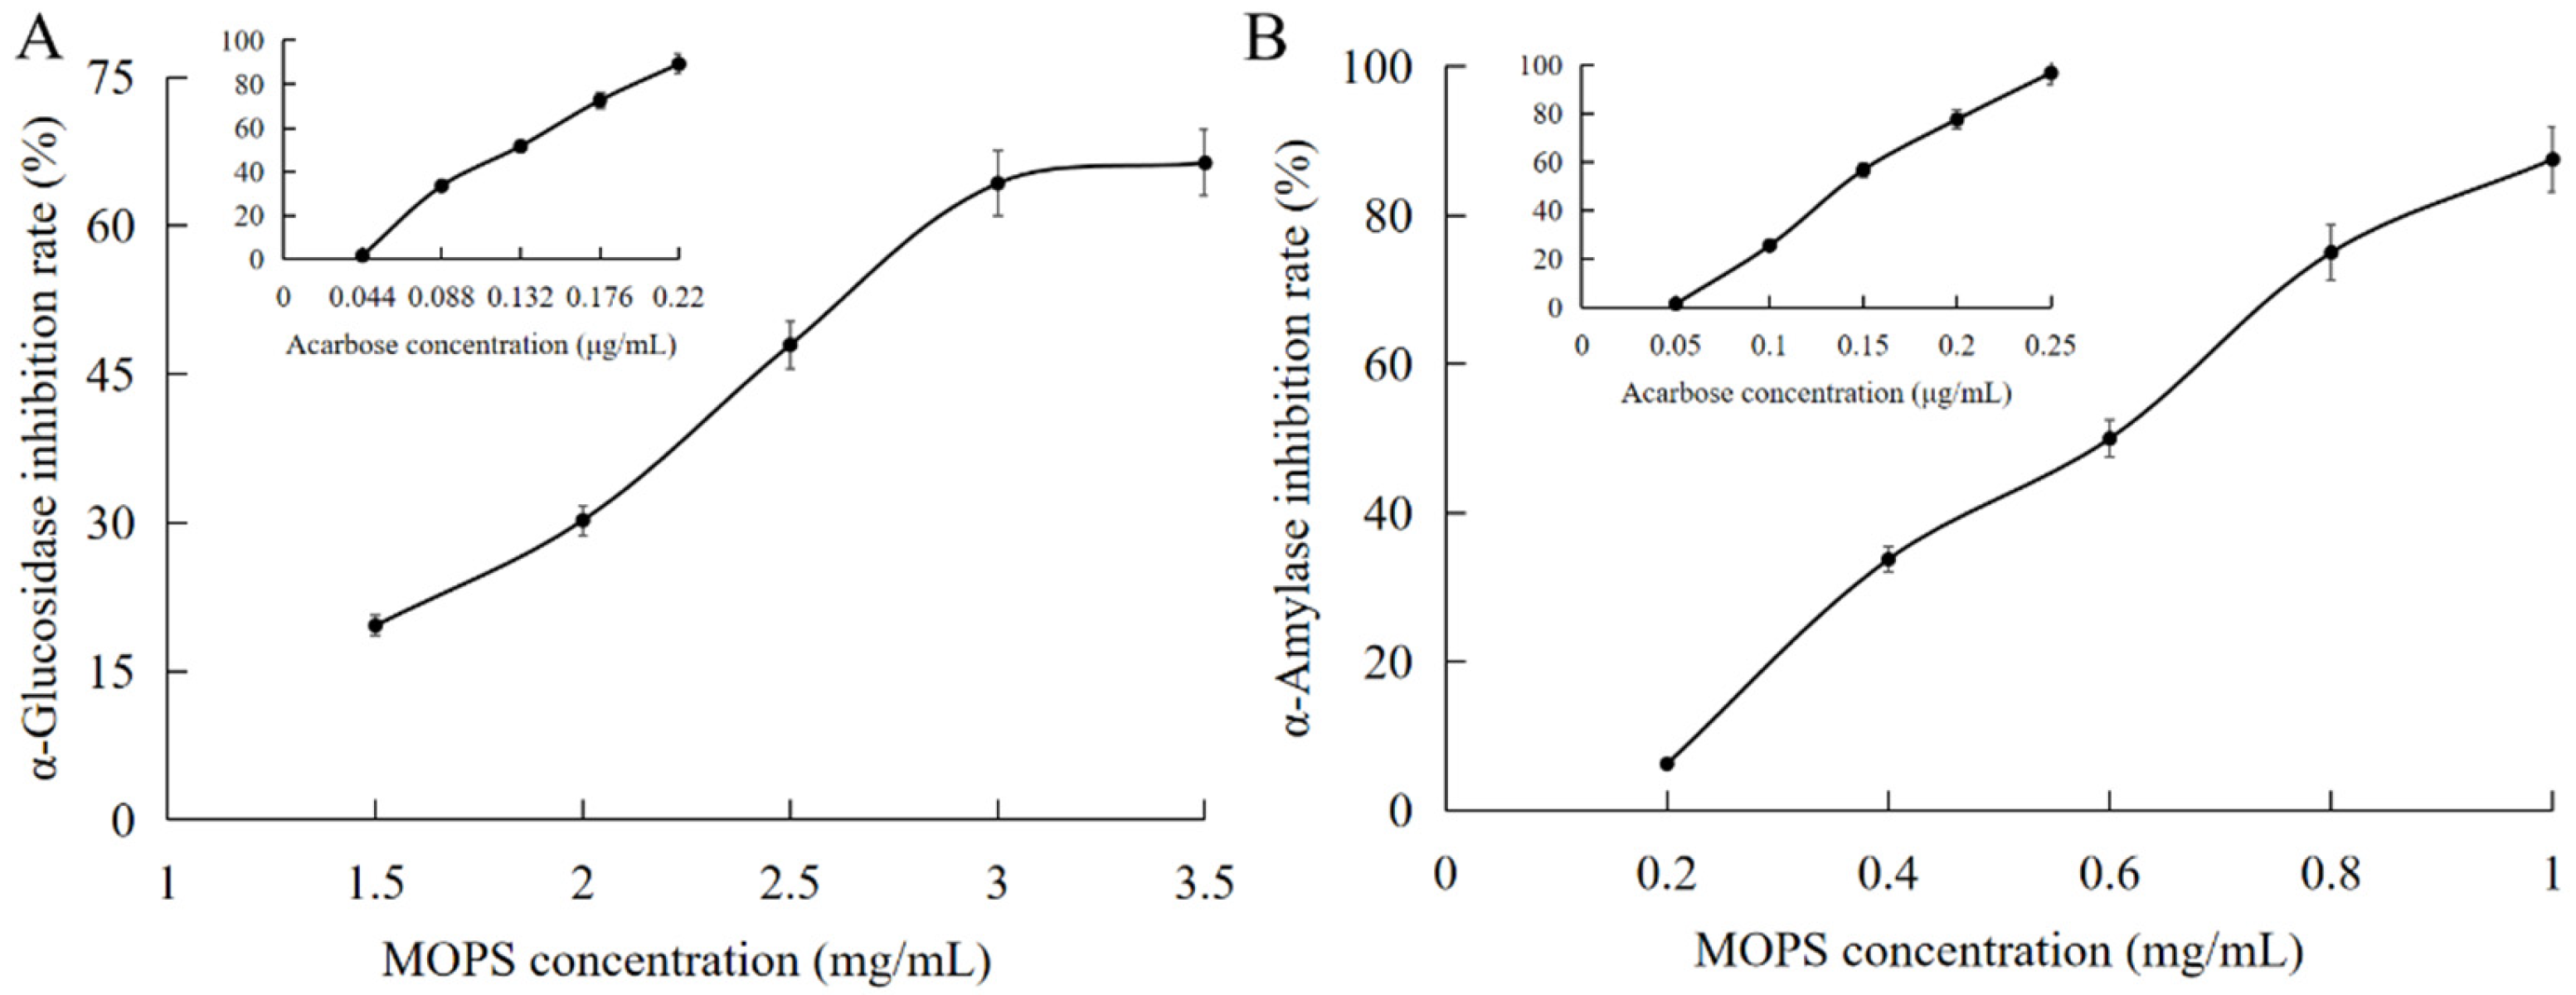
The enzymes α-glucosidase and α-amylase play pivotal roles in regulating blood glucose levels in the human body, making them crucial determinants of both hyperglycemia and hypoglycemia. Consequently, they serve as vital indicators for evaluating the efficacy of hypoglycemic intervention [33]. The inhibitory effect of MOPS on α-amylase increased significantly from (6.25 ± 0.11)% to (87.5 ± 0.44)% as the mass concentration ranged from 0.2 mg/mL to 1 mg/mL, as illustrated in Figure 5A,B. The IC50 value for this inhibition was determined to be (0.57 ± 0.04) mg/mL, which is lower than that of acarbose with an IC50 value of (0.147 ± 0.07) μg/mL, indicating a comparatively weaker potency of MOPS in inhibiting α-amylase when compared to acarbose.
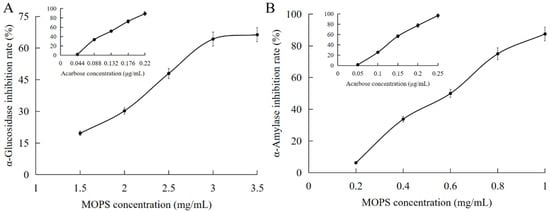
Figure 5.
Hypoglycaemic effects of MOPS. Inhibition of α- glucosidase by MOPS (A) and α-amylase activity by MOPS (B).
3.4. Simulation of In Vitro Digestion of MOPS
3.4.1. Polysaccharide Content
As presented in Table 4, it demonstrates that there are no statistically significant differences (p > 0.05) observed in the MOPS content during the simulated oral, gastric, and intestinal digestion stages. Furthermore, no significant variations were found across different time points within these digestive environments, indicating that neither the oral, gastric, or intestinal conditions exerted a substantial impact on the release, or degradation of MOPS.
Table 4.
Changes in the content of MOPS during digestion in the oral cavity, stomach and small intestine.
3.4.2. Antioxidant Properties of MOPS
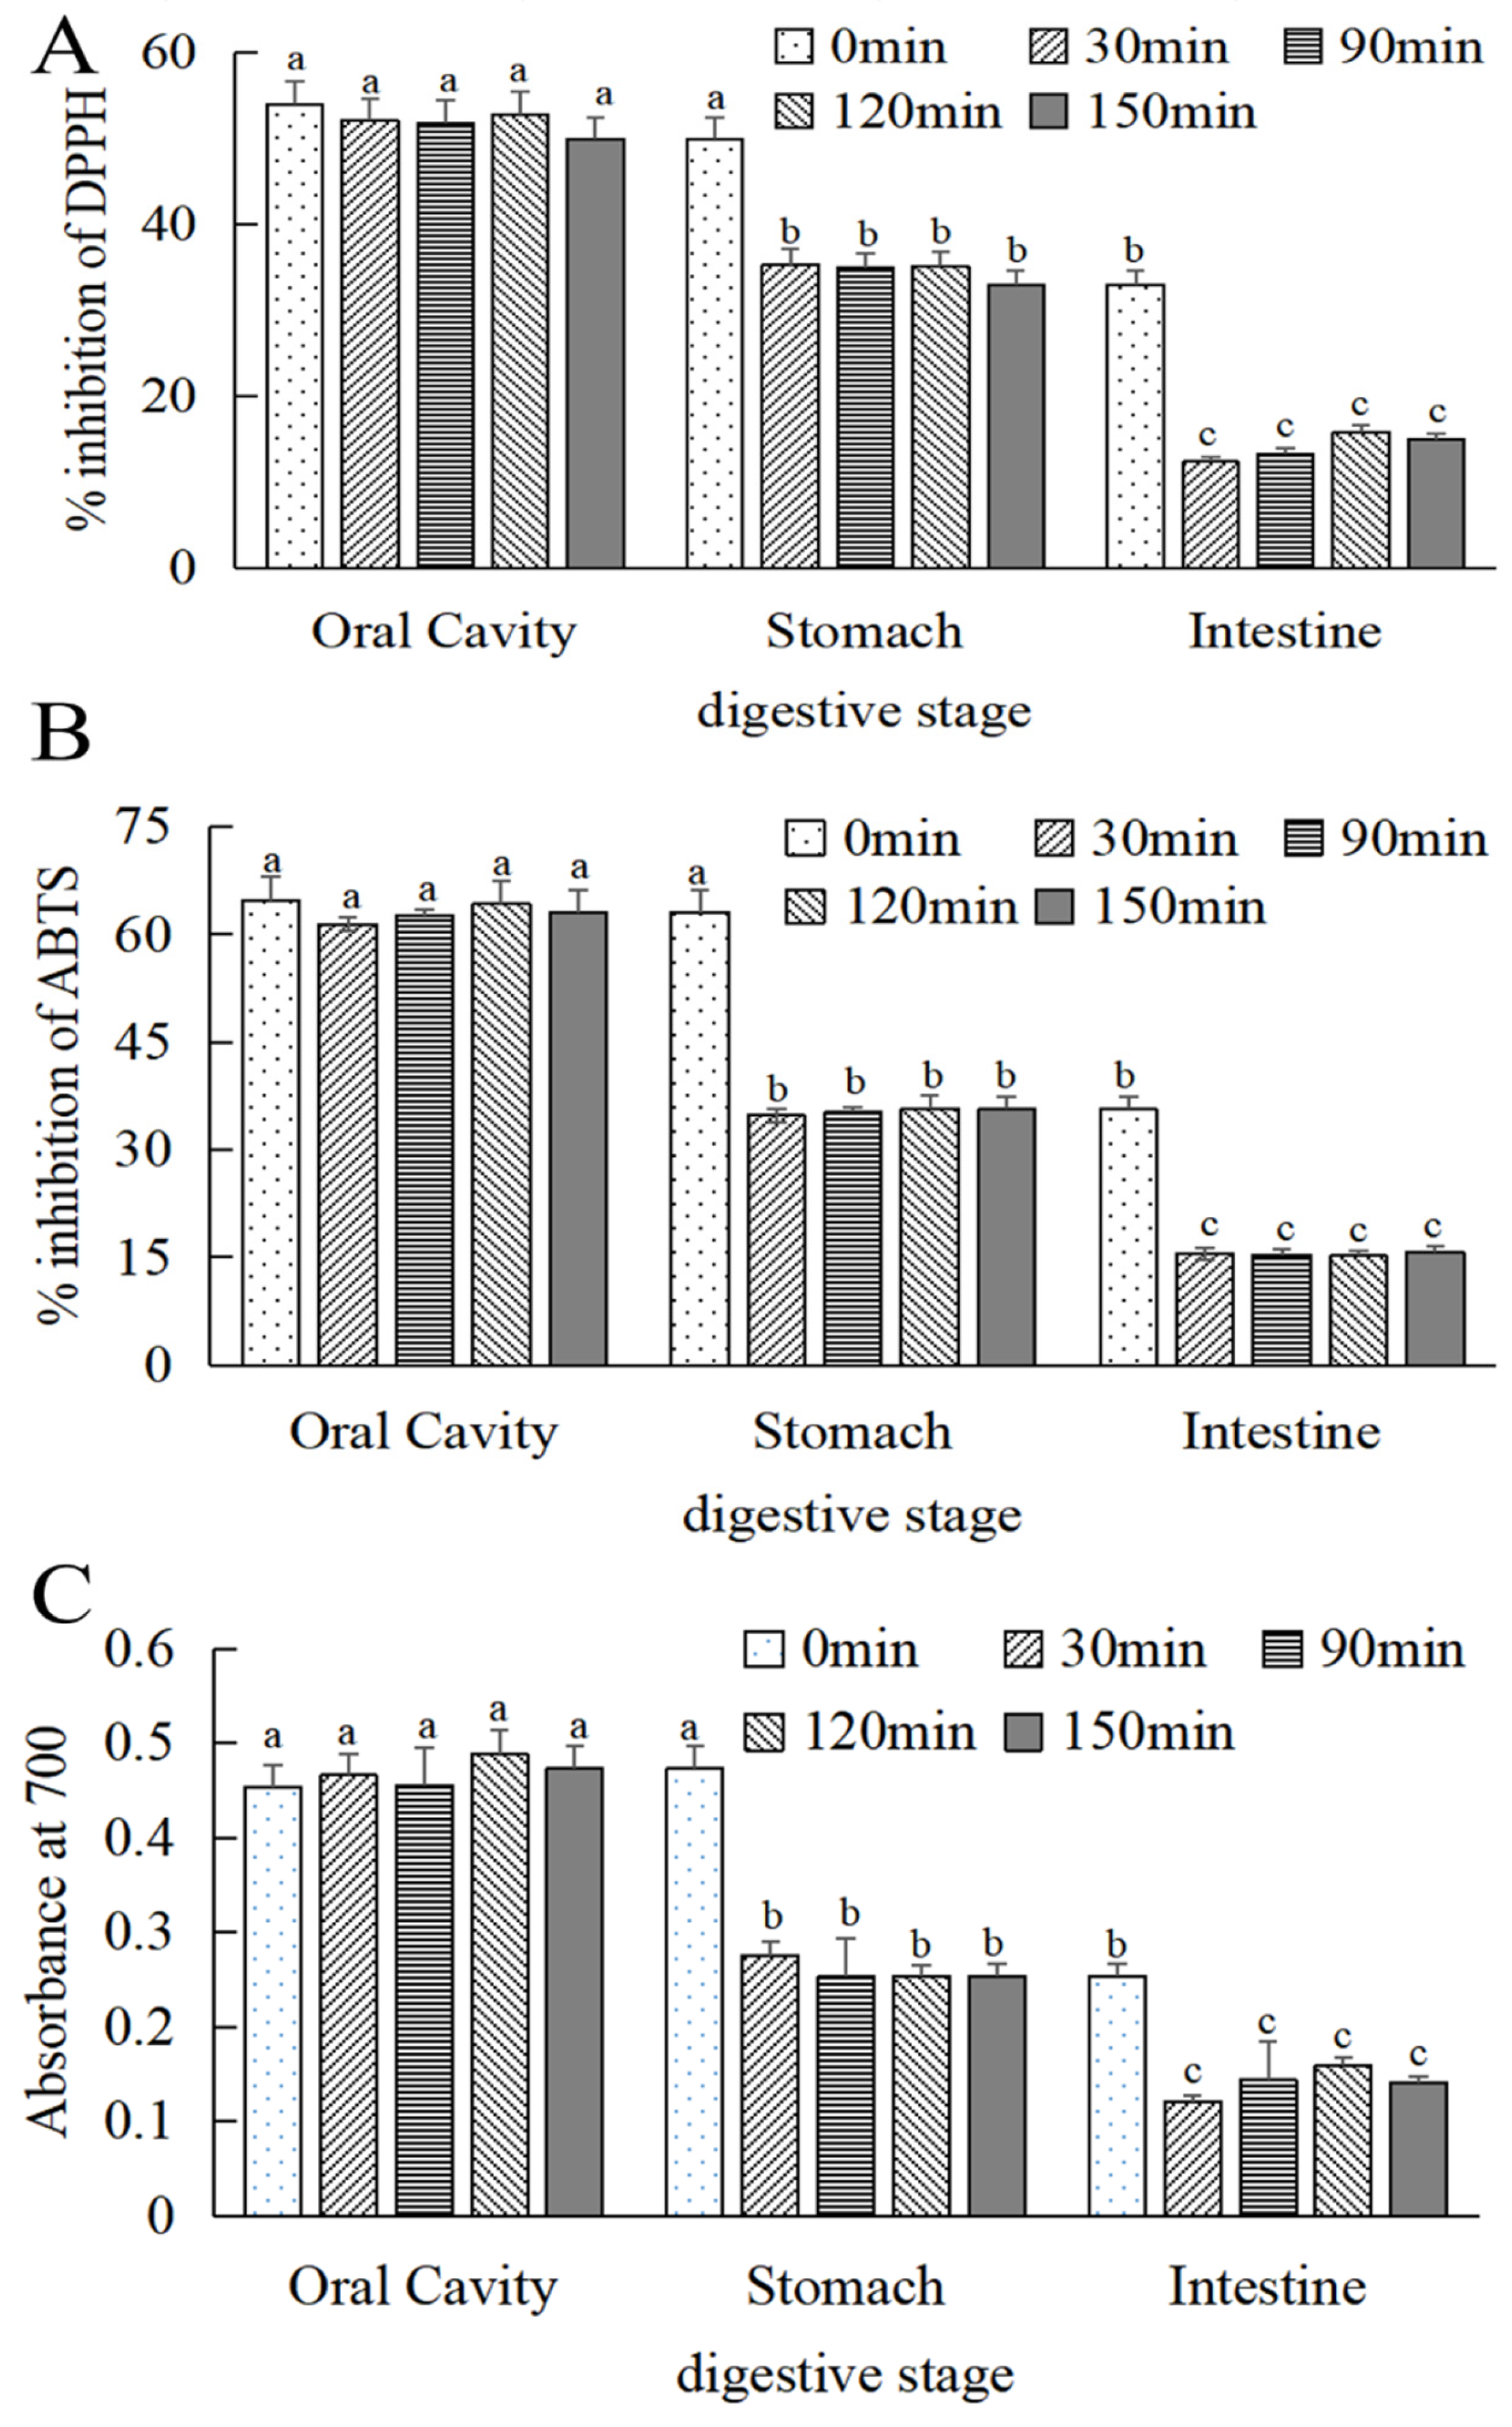
As can be seen in Figure 6A–C, the free radical scavenging effect and reduction in the power of MOPS on DPPH and ABTS were significantly reduced (p < 0.05) in simulated oral, gastric, and intestinal cavities. With the extension of digestion time, the free radical scavenging and reducing the energy of MOPS on DPPH and ABTS tended to be stable after digestion for 30 min. Compared to the simulated stomach and intestine at 0 min, the scavenging activity of DPPH decreased by (33.24 ± 0.24)% and (84.76 ± 0.87)%, respectively, after 30 min of gastric and intestinal digestion. Similarly, ABTS activity decreased by (43.55 ± 0.24)% and (75 ± 0.08)%, while the absorption value decreased by (34.6 ± 0.55)% and (52.36 ± 0.87)%, respectively.
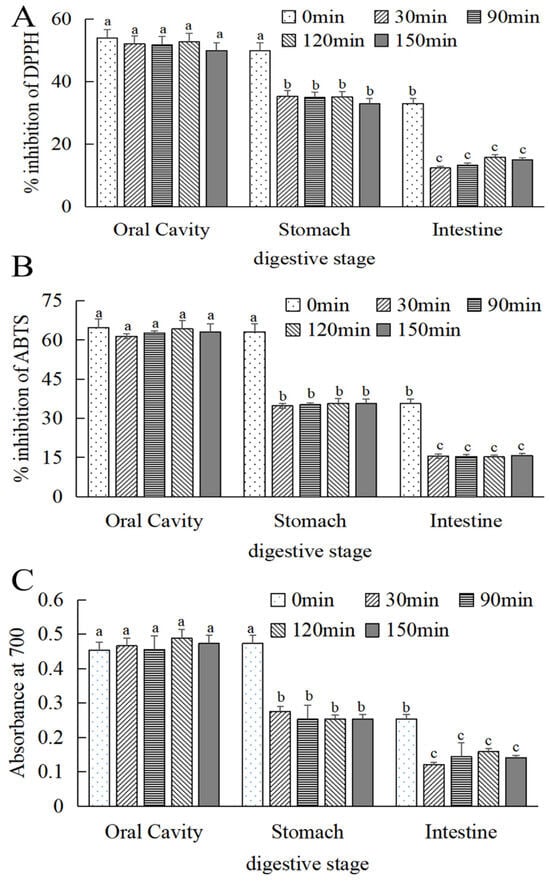
Figure 6.
Changes in antioxidant activity of MOPS at different digestive sites. (A) DPPH radical scavenging activity, (B) ABTS radical scavenging activity, and (C) iron reduction capacity. Different lowercase letters indicate significant differences between different treatments (p < 0.05).
3.4.3. Hypoglycaemic Activity of MOPS
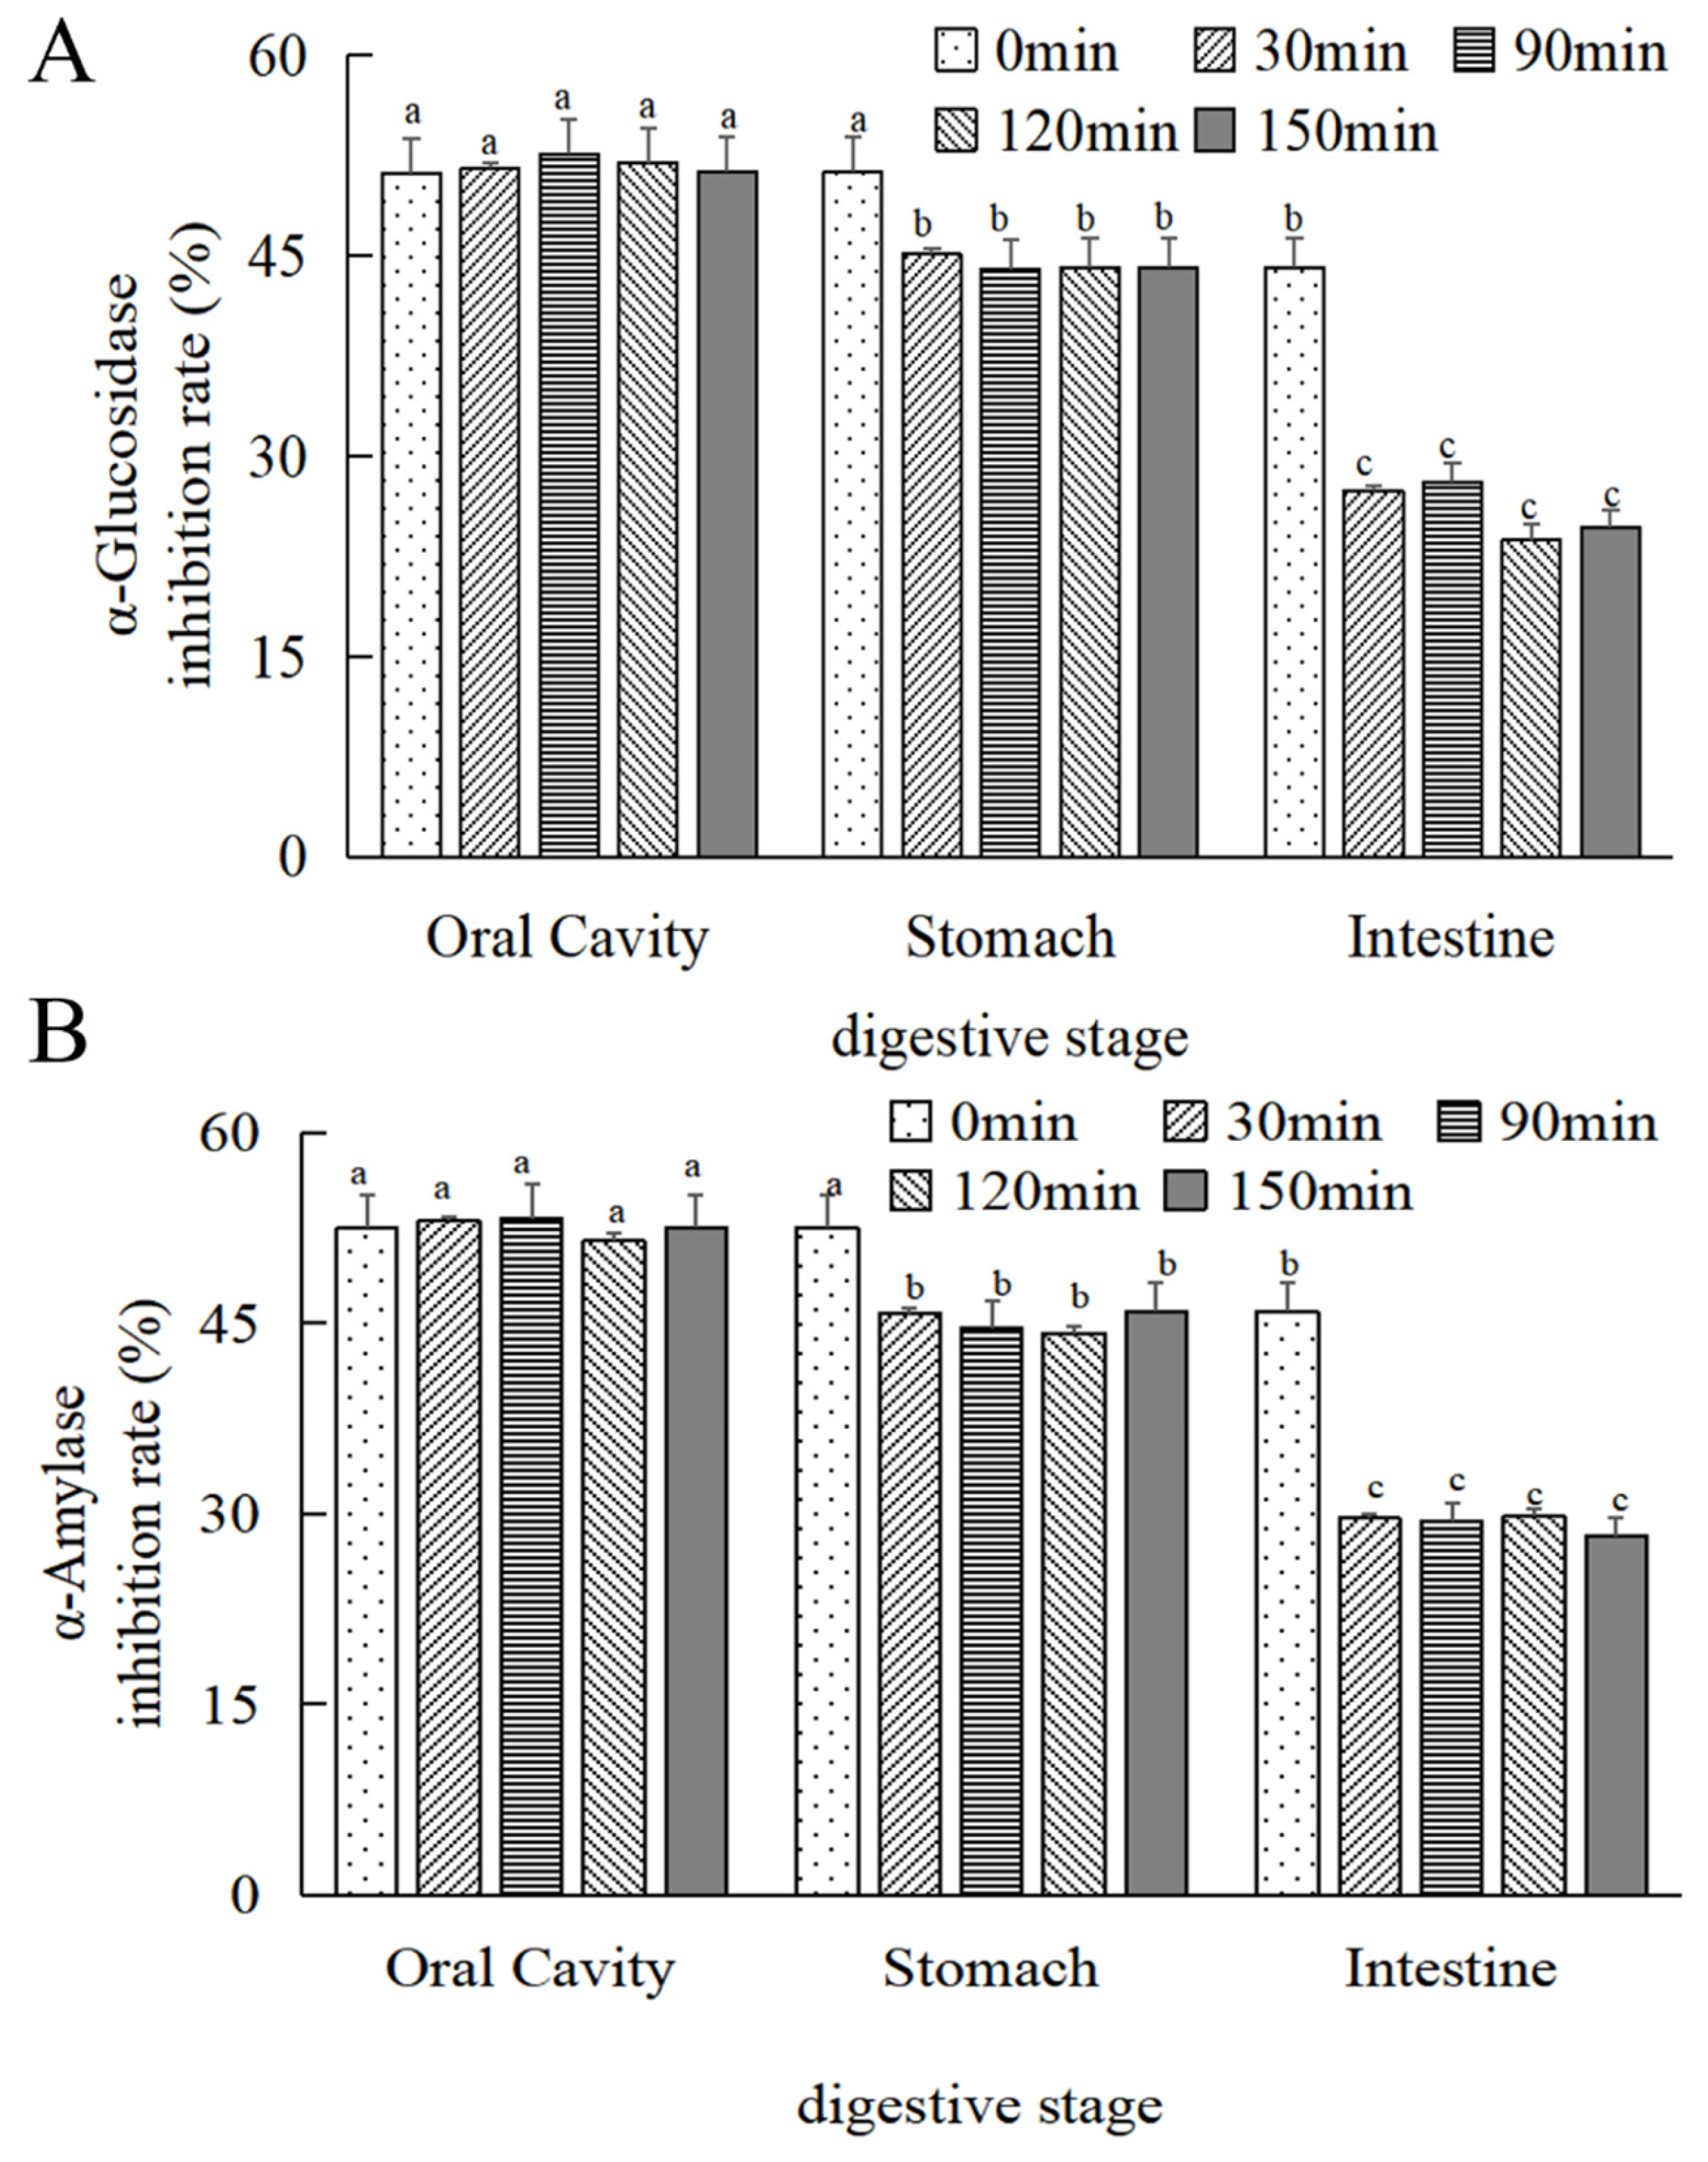
As depicted in Figure 7A,B, there was no statistically significant difference (p > 0.05) observed in the alteration of the α-glucosidase inhibitory activity of MOPS before and after oral digestion with increasing digestion time. Following 30 min of simulated gastric and intestinal digestion, a reduction in α-glucosidase inhibitory activity by (12 ± 0.55)% and (37.86 ± 0.27)%, respectively, was observed compared to the initial 0 min simulation; similarly, α-amylase inhibitory activity decreased by (7.12 ± 0.24)% and (35.47 ± 0.38)%, respectively, and was stabilized at 30 min (p > 0.05).
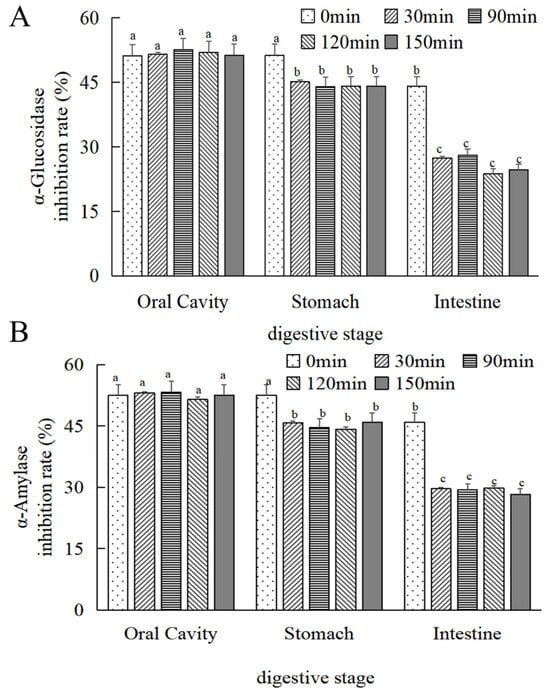
Figure 7.
Changes in the hypoglycaemic activity of MOPS at different digestive sites. (A) α-glucosidase inhibitory activity and (B) α-amylase inhibitory activity. Compared with the 0 min simulated oral cavity. Different lowercase letters indicate significant differences between different treatments (p < 0.05).
4. Discussion
The objective of this study was to examine the extraction process of MOPS. The test variables, namely ultrasonic power, extraction temperature, and extraction time, were chosen based on a one-factor approach. The yield of partridge tea polysaccharide was used as the evaluation criterion of the extraction process. The extraction process conditions were effectively optimized using the response surface method. The optimal conditions for extracting MOPS were determined as follows: ultrasonic power of 200 W, liquid-to-material ratio of 1:25, extraction temperature of 75 °C, and extraction time of 45 min.
The antioxidant activity of polysaccharides and their derivatives are usually assessed in terms of free radical scavenging and reducing capacities. The antioxidant activity of polysaccharides is influenced by various factors, including molecular weight, conformation, type of glycosidic bond, and monosaccharide composition [34]. There is a higher free radical scavenging activity of polymers with highly branched and β-glycosidic bonds [35], as well as plant polysaccharides containing high amounts of galacturonic acid [36]. Additionally, the electrophilic ketone or aldehyde groups present in glycoaldehyde augment the activity of hydrogen atoms and facilitate their dissociation from hydroxyl bonds, thereby enhancing their antioxidant effects [37]. The present study demonstrated the alterations in the in vitro DPPH and ABTS radical scavenging activity and reduced the power of MOPS (Figure 4). The in vitro antioxidant capacity exhibited an upward trend with the increasing concentration of the extracts. The IC50 values were (25.65 ± 0.53) and (100.38 ± 0.38) μg/mL for the free radical scavenging rate of DPPH and ABTS, respectively. This is consistent with the antioxidant properties of polysaccharides from large bulbous mushrooms [38]. But the IC50 values were different, probably due to variations in the structures and compositions of the polysaccharides, which caused the difference in antioxidant capacity. Following in vitro simulated oral, gastric, and intestinal digestion, the total content of MOPS exhibited no significant change (p > 0.05). This might be attributed to the non-digestible nature of MOPS, rendering it ineffective for utilization by the stomach and small intestine. This is similar to the trend of changes in the polysaccharide content of green willow after in vitro digestion [39]. Moreover, the in vitro digestion of MOPS resulted in a weakened ability to scavenge DPPH and ABTS free radicals as well as their reduction. This finding is consistent with Zhu et al.’s study on alterations in the antioxidant activity of Lobelia polysaccharides during in vitro gastrointestinal digestion. These changes might be attributed to the acidic pH conditions during oral, gastric, and intestinal digestion, leading to a reduction in the glucuronic acid content of the polysaccharides. Additionally, the digestive enzymes and temperature could also contribute to modifications in the structure and properties, which, in turn, caused changes in the activity [40]. The phenolic acids present in MOPS exhibited instability under conditions of partial acidity or alkalinity, leading to their degradation and the formation of other compounds, thereby impacting their antioxidant activity [41,42,43].
α-glucosidase and α-amylase are hydrolases located on the surface of small intestinal epithelial cells, which catalyze the hydrolysis of α-glucose to glucose by cleaving the α-1, 4-glucoside bond of α-glucosidase and α-amylase [44]. The process described leads to an elevation in the body’s blood glucose levels. The competitive inhibition of α-glucosidase activity by enzyme inhibitors effectively delays or inhibits the hydrolysis of disaccharides and oligosaccharides into monosaccharides, thereby reducing or inhibiting glucose absorption by the body and subsequently lowering postprandial blood glucose levels [45].
Polysaccharides are the most common natural α-glucosidase inhibitors. The present study investigated the inhibitory effects of MOPS on the enzymatic activities of α-glucosidase and α-amylase. The IC50 values for α-glucosidase and α-amylase were (2.27 ± 0.07) mg/mL and (0.57 ± 0.04) mg/mL, respectively. The inhibition of α-glucosidase increased from (19.61 ± 0.15)% to (66.31 ± 0.22)%, and that of α-amylase increased from (6.25 ± 0.11)% to (87.5 ± 0.44)% with increasing MOPS concentration. These results are consistent with the changes in α-glucosidase and amylase activities in response to stilbene polysaccharide and buckwheat polysaccharide [44,46]. Furthermore, a positive correlation was observed between the inhibition rate and the concentration of polysaccharides. The hypoglycemic activities of MOPS were significantly diminished (p < 0.05) after simulating oral, gastric, and intestinal digestion in vitro. This finding is consistent with the observed trend in α-glucosidase inhibitory activity during simulated in vitro gastrointestinal digestion using Birch brown porcupine polysaccharide [47]. It might be that the composition and molecular weight distribution of MOPS changed after gastrointestinal digestion, consequently affecting their hypoglycemic potential [48]. In addition, there were differences in the interaction mode of α-glucosidase and amylase with the products of MOPS after simulated digestion through different stages of the oral, gastric, and intestinal tracts, and pectin-like polysaccharides containing galacturonic acid glycan regions and rhamnogalacturonic acid regions containing neutral sugar side chains were usually found to have hypoglycaemic activity [44]. Only a minimal amount of galacturonic acid was released during the oral, gastric, and intestinal digestion process [49,50,51]. The activity of α-glucosidase and amylase may be influenced by the gastrointestinal digestive environment, while the acidic conditions can impact the polysaccharide structure, leading to alterations in its functionality.
In summary, MOPS possesses the capacity to effectively scavenge DPPH radicals and ABTS radicals, as well as inhibiting the enzymatic activities of α-glucosidase and α-amylase. Notably, no significant alterations in the MOPS content were observed within the oral cavity, stomach, and small intestine. However, MOPS, by simulated in vitro digestion, reduced the scavenging potential of DPPH radicals and ABTS radicals, as well as the reducing power, and diminished the inhibitory effects of α-amylase and α-glucosidase.
The results demonstrate that the ultrasound-assisted method was suitable for extracting MOPS with potent antioxidant and hypoglycemic properties. There was no significant change in the content of MOPS after oral, gastric, and small intestinal digestion, and their antioxidant and hypoglycemic activities were significantly attenuated during gastrointestinal digestion.
Author Contributions
Investigation, writing-original & conceptualization, G.T. and Z.D., Visualization, writing editing, data curation & methodology, G.X. and T.X., Conceptualization & formal analysis, F.L. and L.Y.; Funding acquisition, investigation, review & supervision, H.X. All authors have read and agreed to the published version of the manuscript.
Funding
This work was supported by the Finance Science and Technology Project of Hainan Province, China (SQKY2022-0020, FW20230002).
Institutional Review Board Statement
Not applicable.
Informed Consent Statement
Not applicable.
Data Availability Statement
The original contributions presented in the study are included in the article, further inquiries can be directed to the corresponding author.
Conflicts of Interest
The authors declare no conflicts of interest.
References
- Liu, T.; Chen, D.; Liu, Z.; Hou, J.M. First Report of Colletotrichum siamense Causing Anthracnose on Partridge tea (Mallotus oblongifolius) in China. Plant Dis. 2018, 102, 1669. [Google Scholar] [CrossRef]
- Li, S.R.; Song, Y.J.; Deng, R.; Li, X.W.; Cheng, Y.; Zhang, Z.Q.; Sun, F.Y.; Liu, Q.S. Mallotus oblongifolius extracts ameliorate ischemic nerve damage by increasing endogenous neural stem cell proliferation through the Wnt/beta-catenin signaling pathway. Food Funct. 2020, 11, 1027–1036. [Google Scholar] [CrossRef] [PubMed]
- Li, S.; Zhang, W.; Wang, R.; Li, C.; Lin, X.; Wang, L. Screening and Identification of Natural A-Glucosidase and A-Amylase Inhibitors from Partridge Tea (Mallotus furetianus Muell-Arg) and in Silico Analysis. Food Chem. 2022, 388, 133004. [Google Scholar] [CrossRef] [PubMed]
- Yu, S.; Duan, Z.; Li, P.; Wang, S.; Guo, L.; Xia, G.; Xie, H. Protective Effect of Polyphenols Purified from Mallotus oblongfolius on Ethanol-Induced Gastric Mucosal Injury by Regulating Nrf2 and MAPKs Pathways. Antioxidants 2022, 11, 2452. [Google Scholar] [CrossRef] [PubMed]
- Gu, W.L.; Zhong, H.F.; Wang, H.; Zhang, J.Y.; Qin, Y.L.; Zhang, C.L.; Qin, X.W.; Tan, L.H. Survey and identification and evaluation of wild Mallotus oblongfolius resources in Hainan. J. Trop. Crops 2019, 11, 6. [Google Scholar]
- Duan, Z.W.; Li, P.; Chen, T.; He, A.; Wang, S.; Xie, H. Extraction and antioxidant properties of polyphenols from Mallotus oblongfolius. Food Sci. Technol. 2020, 3, 218–223. [Google Scholar]
- Duan, Z.W.; Li, P.; He, A.; Wang, S.P.; Xie, H. Comparison of antioxidant and antibacterial properties of polyphenols extracted from Mallotus oblongfolius by different methods. J. Trop. Crops 2021, 3, 847–853. [Google Scholar]
- Chen, W.; Wu, D.; Jin, Y.; Li, Q.; Liu, Y.; Qiao, X.; Zhang, J.; Dong, G.; Li, Z.; Li, T.; et al. Pre-Protective Effect of Polysaccharides Purified from Hericium Erinaceus against Ethanol-Induced Gastric Mucosal Injury in Rats. Int. J. Biol. Macromo. 2020, 159, 948–956. [Google Scholar] [CrossRef]
- Sun, Y.J.; Ma, Y.H.; Wang, F.; Yuan, X.S.; Xu, Y.; Zhang, N.; Wang, J.K. Effects of different extraction methods on the physicochemical properties and antioxidant effects of Poria coca polysaccharides. J. Northwest Inst. Light Ind. 2021, 5, 31–38. [Google Scholar]
- Gong, W.; Tang, J.; Wei, Y.Y.; Ning, E.C.; Wei, L. Separation and purification, structural characterisation and in vitro antioxidant properties of polysaccharides from Camellia sinensis. Food Mach. 2021, 6, 184–190. [Google Scholar]
- Wu, T.; Xu, J.; Chen, Y.; Liu, R.; Zhang, M. Oolong Tea Polysaccharide and Polyphenols Prevent Obesity Development in Sprague-Dawley Rats. Food Nutr. Res. 2018, 62, 1599. [Google Scholar] [CrossRef]
- Song, L.Z.; Zhu, L.Y.; Gao, Y.S.; Li, S.F.; Zhang, Y.J. Structural characteristics and hypoglycaemic activity of tea polysaccharides. Food Sci. 2018, 19, 162–168. [Google Scholar]
- Song, J.; Shi, D.Q.; Su, H.; Feng, Y.X.; Tian, W. Optimization of Ultrasonic Extraction of Lycium Barbarum Polysaccharides Using Response Surface Methodology. Int. J. Food Eng. 2020, 16, 11. [Google Scholar] [CrossRef]
- Li, L.; Chen, B.S.; Yuan, Y. Optimisation of microwave extraction process of fig polysaccharide. Food Sci. Technol. Res. 2021, 12, 215–220. [Google Scholar]
- Chen, S.S.; Li, Y.G.; Chen, J.; Yin, Y.B.; Deng, F.F.; Zhang, J. Optimisation of polysaccharide extraction process of Alliumcepal.with Compound Enzyme Hot Water. Asia-Pac. Tradit. Med. 2016, 12, 36–39. [Google Scholar]
- Cao, M.; Hua, Z.X.; Cao, Z.; Xuan, W.F.; Wang, L. Optimisation of ultrasonic-assisted extraction process of polysaccharides from summer and autumn tea. Anhui Agric. Sci. 2023, 49, 105–109. [Google Scholar]
- Wu, D.T.; Liu, W.; Yuan, Q. Dynamic Variations in Physicochemical Characteristics of Oolong Tea Polysaccharides During Simulated Digestion and Fecal Fermentation. Food Chem. X 2022, 14, 100288. [Google Scholar] [CrossRef]
- Min, F.F.; Nie, S.P.; Wan, Y.J.; Xie, M.Y. Digestion and absorption of penicillin polysaccharides in an in vitro digestion model. Food Sci. 2013, 21, 6. [Google Scholar]
- Mar, Y.; Jalili, S.; Ganjloo, A.; Bimakr, M.; Zarringhalami, S. Optimization of Ultrasound-Assisted Extraction, Preliminary Characterization and in Vitro Antioxidant Activity of Polysaccharides from Green Pea Pods. Foods 2016, 4, 78. [Google Scholar]
- Dubois, M.; Gilles, K.A.; Hamilton, J.K.; Rebers, P.T.; Smith, F. Colorimetric Method for Determination of Sugars and Related Substances. Anal. Chem. 1956, 28, 350–356. [Google Scholar] [CrossRef]
- Yang, X.; Yang, S.; Guo, Y.; Jiao, Y.; Zhao, Y. Compositional Characterisation of Soluble Apple Polysaccharides, and Their Antioxidant and Hepatoprotective Effects on Acute Ccl4-Caused Liver Damage in Mice. Food Chem. 2013, 138, 1256–1264. [Google Scholar] [CrossRef] [PubMed]
- Mohammed, J.; Mahdi, A.; Ahmed, M.; Ma, M.; Wang, H. Preparation, Deproteinization, Characterization, and Antioxidant Activity of Polysaccharide from Medemia Argun Fruit. Int. J. Biol. Macromol. 2020, 155, 919–926. [Google Scholar] [CrossRef] [PubMed]
- Xin, Y.H.; Zhao, S.H.; Yang, J.; Zhang, T.D.; Zhang, J.H.; Wang, Y. Effect of microwave-drying on the quality and antioxidant properties of ganoderma lucidum fermented sea-buckthorn tea. Int. J. Food Eng. 2021, 17, 65–74. [Google Scholar]
- Ji, X.F.; Lv, C.X.; Lu, Y.; Ma, L.; Yu, Y.B.; Wang, W.M.; Wang, G.H.; Li, J.R. Response surface optimisation of alkaline degradation of polyproanthocyanidins from red raspberry seeds and inhibition of hypoglycaemic enzyme activity. Sci. Technol. Food Ind. 2019, 4, 7. [Google Scholar]
- Brodkorb, A.; Egger, L.; Alminger, M.; Alvito, P.; Assunção, R.; Ballance, S.; Bohn, T.; Bourlieu-Lacanal, C.; Boutrou, R.; Carrière, F.; et al. Infogest Static in Vitro Simulation of Gastrointestinal Food Digestion. Nat. Protoc. 2019, 14, 991–1014. [Google Scholar] [CrossRef] [PubMed]
- Liu, Q.; Wu, Y.; Wu, J.H.; Ai, W.N. Optimisation of ultrasound-assisted extraction of polysaccharides from Silybum marianum. Food Sci. 2012, 20, 99–103. [Google Scholar]
- Wang, Y.; Leng, F.; Liu, X.; Zhang, W.; Yang, M. Optimization of Microwave-Assisted Extraction of Water-Soluble Polysaccharides from Piteguo Fruit by Response Surface Methodology. Food Sci. Technol. Res. 2014, 20, 755–764. [Google Scholar] [CrossRef]
- Qian, Y.W.; Wer, J.; Zhang, Z.; Wang, X.; Zhang, J.; Wu, B. Response surface optimisation of seed melon polysaccharide extraction process and its in vitro hypolipidemic activity. Sci. Technol. Food Ind. 2020, 2, 101–107. [Google Scholar]
- Zhao, B.; Zhang, J.; Guo, X.; Wang, J. Microwave-Assisted Extraction, Chemical Characterization of Polysaccharides from Lilium Davidii Var. Unicolor Salisb and Its Antioxidant Activities Evaluation. Food Hydrocoll. 2013, 2, 346–356. [Google Scholar] [CrossRef]
- Zhang, X.N.; Zhao, M.; Feng, Y.M.; Zhou, H.X. Optimisation of alkaline extraction process of polysaccharides from the leaves of Tectona grandis by response surface methodology. Food Ind. 2023, 9, 85–88. [Google Scholar]
- Cao, A.Z.; Guo, Y.; Liu, Z.H.; Shang, H.M.; Zhou, H.Z.; Shang, H.M. Ultrasonic Enzyme-Assisted Extraction of Comfrey (Symphytum officinale L.) Polysaccharides and Their Digestion and Fermentation Behaviors in Vitro. Process Biochem. 2021, 112, 98–111. [Google Scholar] [CrossRef]
- Yang, Y.; Qiu, Z.; Li, L.; Vidyarthi, S.K.; Zheng, Z.; Zhang, R. Structural Characterization and Antioxidant Activities of One Neutral Polysaccharide and Three Acid Polysaccharides from Ziziphus Jujuba Cv. Hamidazao: A Comparison. Carbohydr. Polym. 2021, 261, 117879. [Google Scholar] [CrossRef]
- Zhang, W.M.; Wei, J.; Shi, X.; Zhang, B.S. Studies on hypotensive, hypoglycaemic and antioxidant activities of noni leaf. Food Res. Dev. 2013, 19, 66–70. [Google Scholar]
- Jiang, J.Y.; Kong, F.S.; Lv, H.C.; Yan, C.Y. Purification, Structural Characterization and in Vitro Antioxidant Activity of a Novel Polysaccharide from Boshuzhi. Carbohyd. Polym. 2016, 147, 365–371. [Google Scholar] [CrossRef] [PubMed]
- Zhao, D.H.; Zhang, Y.; Yuan, Z.; Lu, M.; Luo, W.Y.; Han, X.P. Study of the Protective Effect of Schizandra Chinensis Polysaccharide on Oxidative Damage of Mouse Spermatozoa in Vitro. Adv. Mater. Res. 2014, 914, 1973–1977. [Google Scholar] [CrossRef]
- Chang, S.C.; Hsu, B.Y.; Chen, B.H. Structural Characterization of Polysaccharides from Zizyphus Jujuba and Evaluation of Antioxidant Activity. Int. J. Biol. Macromol. 2010, 4, 445–453. [Google Scholar] [CrossRef]
- Guiné, R.; Cátia, F.; Correia, R.; Correia, P.; Mendes, M. Modelling the Influence of Origin, Packing and Storage on Water Activity, Colour and Texture of Almonds, Hazelnuts and Walnuts Using Artificial Neural Networks. Food Bioprocess Tech. 2015, 5, 1113–1125. [Google Scholar] [CrossRef]
- Jin, M.Z.; Huang, Q.L.; Chen, H.; Ye, M. In vitro simulated digestion of polysaccharides from Agaricus bisporus. J. Hefei Univ. Technol. Nat. Sci. 2023, 6, 859–864. [Google Scholar]
- Yin, H.; Zhao, S.; Han, S.; Gao, Q.; Gong, C.; Zhang, Q. Progress of extraction, purification, structural characterisation and bioactivity of polysaccharides from Auricularia auricula. Food Ind. 2022, 8, 269–273. [Google Scholar]
- Zhu, K.X.; Si, W.Y.; Yan, J.Z.; Qi, B.L.; Fei, X.; Gang, W.; Wen, J.D. Effects of in Vitro Saliva, Gastric and Intestinal Digestion on the Chemical Properties, Antioxidant Activity of Polysaccharide from Artocarpus heterophyllus Lam. (Jackfruit) Pulp. Food Hydrocoll. 2019, 87, 952–959. [Google Scholar] [CrossRef]
- Sharma, B.R.; Dong, Y.R. Anti-Diabetic Effects of Caulerpa Lentillifera: Stimulation of Insulin Secretion in Pancreatic Β-Cells and Enhancement of Glucose Uptake in Adipocytes. Asian Pac. J. Trop. Biomed. 2014, 7, 6. [Google Scholar] [CrossRef]
- Chen, H.; Zhang, M.; Qu, Z.; Xie, B. Antioxidant Activities of Different Fractions of Polysaccharide Conjugates from Green Tea (Camellia sinensis). Food Chem. 2008, 2, 559–563. [Google Scholar] [CrossRef]
- Wang, C.; Li, W.; Chen, Z.; Gao, X.; Yuan, G.; Pan, Y.; Chen, H. Effects of Simulated Gastrointestinal Digestion in Vitro on the Chemical Properties, Antioxidant Activity, A-Amylase and A-Glucosidase Inhibitory Activity of Polysaccharides from Inonotus Obliquus. Food Res. Int. 2018, 103, 280. [Google Scholar] [CrossRef] [PubMed]
- Yuan, Y.; Li, C.; Zheng, Q.; Wu, J.X.; Zhu, K.X.; Shen, X.R.; Cao, J. Effect of simulated gastrointestinal digestion in vitro on the antioxidant activity, molecular weight and microstructure of polysaccharides from a tropical sea cucumber (holothuria leucospilota). Food Hydrocoll. 2019, 89, 735–741. [Google Scholar] [CrossRef]
- Wan, L.J.; Zhang, L. Changes in antioxidant activity of polysaccharides from grapefruit peel in vitro digestion. Food Res. Dev. 2021, 11, 7. [Google Scholar]
- Li, J.W.; Luo, J.Y.; Cha, Y.T.; Yang, G.; Yang, T.Z.; Bao, Y.H. Hypoglycemic effect of Taraxacum officinale root extract and its synergism with Radix Astragali extract. Food Sci. Nutr. 2021, 4, 2075–2085. [Google Scholar] [CrossRef]
- Du, J.J.; Jia, Y.X. Effect of different drying methods on the bioactive compounds and bioactivities of walnut green peel. J. Food Saf. Qual. 2018, 9, 3292–3297. [Google Scholar]
- Yu, K.; Kiyohara, H.; Matsumoto, T.; Yang, H.; Yamada, H. Structural Characterization of Intestinal Immune System Modulating New Arabino-3, 6-Galactan from Rhizomes of Atractylodes Lancea Dc. Carbohydr. Polym. 2001, 46, 147–156. [Google Scholar] [CrossRef]
- Chen, H.X.; Qu, Z.S.; Fu, L.L.; Dong, P. Physicochemical Properties and Antioxidant Capacity of 3 Polysaccharides from Green Tea, Oolong Tea, and Black Tea. J. Food Sci. 2009, 74, C469–C474. [Google Scholar] [CrossRef]
- Zhang, L.; Liu, X.; Wang, Y.; Liu, G.; Cheng, L. In Vitro Antioxidative and Immunological Activities of Polysaccharides from Zizyphus Jujuba Cv. Muzao. Int. J. Biol. Macromol. 2017, 95, 1119–1125. [Google Scholar] [CrossRef]
- Wang, F.; Bao, Y.F.; Weng, Z.B.; Zhou, Z.J.; Shen, X.C. Isolation and purification of polysaccharide from Moringa oleifera leaf and its hypoglycemic activity in vitro. J. Food Saf. Qual. 2018, 9, 1592–1598. [Google Scholar]

Disclaimer/Publisher’s Note: The statements, opinions and data contained in all publications are solely those of the individual author(s) and contributor(s) and not of MDPI and/or the editor(s). MDPI and/or the editor(s) disclaim responsibility for any injury to people or property resulting from any ideas, methods, instructions or products referred to in the content. |
© 2024 by the authors. Licensee MDPI, Basel, Switzerland. This article is an open access article distributed under the terms and conditions of the Creative Commons Attribution (CC BY) license (https://creativecommons.org/licenses/by/4.0/).