Article

What Is Chalky? Investigating Consumer Language and Perception of Fine Particles in Beverages Containing Pea and Potato Starch

by
Kai Kai Ma
1,2,
Gregory R. Ziegler
2,
Helene Hopfer
1,2 and
John E. Hayes
1,2,*
1
Sensory Evaluation Center, College of Agricultural Sciences, The Pennsylvania State University, University Park, PA 16802, USA
2
Department of Food Science, College of Agricultural Sciences, The Pennsylvania State University, University Park, PA 16802, USA
*
Author to whom correspondence should be addressed.
Foods 2024, 13(12), 1852; https://doi.org/10.3390/foods13121852
Submission received: 10 May 2024 / Revised: 4 June 2024 / Accepted: 6 June 2024 / Published: 13 June 2024
(This article belongs to the Special Issue Latest Research on Flavor Components and Sensory Properties of Food)

Abstract

:
Despite its importance as an undesirable food texture, the phenomenon of chalkiness remains understudied. Chalky sensations presumably arise from fine particulates found in foods, but semantic overlap with other common descriptors of small particles, like gritty or sandy, is unclear. Here, we compare the usage of Chalky with related descriptors, and determine the effect of particle size, concentration, and xanthan content on Chalky ratings in a model beverage. A 23 factorial design with starch particle size (D90 = 33.8 and 64.6 µm), starch concentrations (10 and 20% w/v), and xanthan content (0.075 and 0.15% w/v) was used. Participants’ salivary flow rate was also assessed. A multi-sip taste test was performed where naïve consumers (n = 82; 39% men, 60% women; age range = 18–79 years) rated the intensity of Chalky, Powdery, Gritty, Sandy, Mouthdrying, and Residual mouthcoating at 0, 30, and 60 s after each of three consecutive sips. All attribute ratings were highly correlated, with Chalky, Powdery, and Residual Mouthcoating being more closely correlated with each other than Gritty or Sandy. Although Chalky was still reported 60 s after consumption, no evidence of build-up was found with repeated sips. A larger size and higher concentration increased Chalky ratings, with the low-salivary-flow group reporting greater ratings for Chalky relative to the high-flow group. Our results suggest consumer percepts of small particles are overlapping but not entirely redundant. This suggests researchers and product developers should carefully distinguish between these descriptors when trying to understand consumer perception of food products containing fine particles.

1. Introduction

Chalky is a sensory attribute arising from small particles in food that is typically seen as a defect. It is as important to study unfavorable sensations as desirable ones, as minimizing such defects can increase the acceptability of food [1]. However, chalkiness is understudied, both in terms of how consumers use this term as well as the mechanisms responsible. Commonly consumed foods that have been described as chalky include yogurt drinks, plant-based milk, fiber-fortified beverages, and medical nutrition products [2,3,4,5,6,7]. While many of these fortified foods provide extra nutrients that help meet consumers’ needs, chalkiness lowers the palatability of these products. For example, Brückner-Gühmann et al. [8] found that chalky and floury attributes from the addition of oat protein concentrate to oat-based yogurt decreased liking. Multiple studies have defined chalky as a dry, fine, powdery particulate sensation [4,9,10,11]. Other terms have also been used to describe the perception of fine particles in foods including Gritty, Powdery, and Sandy. Many of these terms have been defined similarly, as sensations associated with small particles, with references to flours [12,13,14,15]. Some of these also include descriptions related to approximate particle sizes, including sand-like or flour-like. However, it is unclear how consumers distinguish among these terms.
Stimuli that elicit chalky sensations are not well understood. In prior work, it has been regarded as a mouthfeel [2] or texture attribute [16]. A recent study by van der Stelt et al. [17] investigated the mouthfeel of medical nutrition products; they suggested other sensations like mouthdrying, residual mouthcoating, lip-coating, and throat-coating are also related to the perception of fine particles. Chalky and Powdery were considered not only as textures in the mouth pre-swallowing but also as mouth sensations after swallowing. It is unclear whether Chalky is related to mouthcoating, lip-coating, or throat-coating, in terms of how consumers use these terms or in terms of the mechanisms underlying these sensations. Many studies that attempt to quantify Chalky sensations only obtain a single rating immediately after sampling (e.g., Allgeyer et al. [2], Chakraborty et al. [4], Drake et al. [5], Shewan et al. [10], van der Stelt et al. [17]). However, these sensations may build over time. For example, Withers and colleagues [18] used sequential profiling to understand the temporal effect of repeated consumption on Chalky mouthfeel of whey and casein protein-fortified dairy beverages. With repeated consumption, they found there was a buildup in chalky ratings over time. This suggests it may be important to test how chalky sensations may change over time with repeated consumption in other food products, especially if one assumes that the particles causing this sensation might accumulate in the mouth over time.
Particle size, shape, and concentration have been implicated as key factors in the perception of fine particles in food. Early work by Tyle [19] highlighted the importance of particle size, shape, and hardness on the perception of grittiness in a suspension model. By having participants taste suspensions of inedible particles (i.e., garnet, micronized polyethylene, and mica coated with titanium dioxide) with a mean size of 5 to 80 μm, they found that increasing particle size increased grittiness, but only for harder particles. Soft and round particles were not perceived as gritty up to 80 μm, while hard and angular particles from 11 to 22 μm were perceived as gritty. Using similar methods with particles of microcrystalline cellulose (6–79 μm), Imai [20] found that particle concentration was the most important factor determining the perception of grittiness, followed by dispersion medium and particle size. The perception of grittiness increased with a higher particle concentration and lower dispersion medium viscosity. Subsequently, Imai et al. [21] showed a similar result of the effect of particle size on the perception of the graininess (similar to grittiness) of food particles. This suggests the particle size as well as the dispersion viscosity each influence the perception of fine particles, at least for gritty and grainy sensations; here, we reasoned that they may also impact the perception of Chalky.
Other work suggests terms like Mouthcoating and Mouthdrying have been used to describe chalky foods including fiber- and whey protein-enhanced foods [4,13,18]. Shewan et al. [10] found that a greater hardness of microgel particles increased the perception of particle size and chalkiness and decreased smoothness. An increase in particle concentration elevated the perception of smoothness, thickness, clearance, cloying, and mouthcoating. In a more complex model beverage fortified with soluble and insoluble fiber, a higher soluble fiber concentration did not increase the perception of chalkiness, whereas insoluble fiber did [4]. Samples with more insoluble fiber increased the perception of particles, mouthcoating, lingering, dryness, and chalkiness, where dryness had a higher score than chalkiness when a small amount of dietary fiber was added. Consistent with prior work, a larger particle size increased the perception of particles in the mouth [19,20,21]. The addition of casein and milk protein in dairy beverages also increased chalky, mouthcoating and mouthdrying perceptions [18]. If sensations of mouthcoating, mouthdrying, and chalkiness are caused by the retention of fine particles in the mouth after swallowing, then salivary flow rate, by aiding the removal of particles from the mouth after swallowing, may influence customers’ perception, possibly with differential effects across individuals. Prior work on oral tribology shows that saliva acts as a lubricant, reducing the friction caused by the presence of food particles [22]. The degree of lubrication can determine the readiness of the food for swallowing [23]. Saliva flow and composition are known to affect orosensory perception [24,25,26,27,28,29]. For example, the addition of saliva or amylase solution in custard affected mouthfeel attributes including melting, thickness, and creamy [24]. Guinard et al. [23] found that increased saliva flow can enhance the perception of the adhesiveness of peanut butter and the cohesiveness of cracker mass. Accordingly, we reasoned that salivary flow rate may also impact the perception of chalkiness.
The present study attempts to understand potential mechanisms of chalky sensation, using a model beverage sipped multiple times. The effect of starch granule size, concentration, and xanthan content were evaluated. Finally, we also evaluated the role of salivary flow rate on chalky sensations. Specifically, we hypothesized that (1) Chalky and Powdery are similar sensations while Gritty and Sandy are a different set of related but distinct sensations; (2) Chalky ratings would build over time with consecutive consumption; (3) participants with a high salivary flow rate would give lower ratings for Chalky relative to low-flow individuals.

2. Materials and Methods

2.1. Ethics Statement

All procedures, including screening, recruitment, consent, and compensation, were approved by the Institutional Review Board (IRB) at The Pennsylvania State University as an expedited protocol (STUDY00022256).

2.2. Participant Recruitment and Consent

A total of 99 participants were recruited from the campus and community surrounding the Pennsylvania State University in State College PA. Sensory tests were carried out in individual booths in the Sensory Evaluation Center in the Erickson Food Science Building at Penn State. All participants provided informed consent and were paid a small cash incentive for their time. Exclusion criteria included being below 18 years of age; currently taking medications known to alter taste or smell; having difficulty tasting and smelling; not being in good general health; having a history of choking or difficulty swallowing; having any tongue, cheek, or lip piercing; having dental work in the last month; having smoked tobacco or used nicotine-containing products in the last 30 days; not fluent in English; having a history of any condition involving chronic pain, in their mouth or elsewhere; currently using any prescription pain medication; reaction to aspartame or having phenylketonuria. Informed consent was documented electronically on the first screen of the online survey via a yes/no question.

2.3. Sample Preparation

We prepared 8 granular-starch-containing beverages to assess the effect of particle size, concentration, and xanthan content on Chalky perception; see Table 1. Pea and potato starches were chosen as they have a different range of particle sizes (mean D4,3 of potato is 42 µm; mean D4,3 of pea is 23.6 µm) but a similar circular/oval shape. We used a two-level factorial design with 10% and 20% w/v concentration of pea (Purity P 1002 Lot: BBF0065, Ingredion (Bridgewater, NJ, USA)) and potato (PENPURE 10L Lot: 2104000102, Ingredion (Bridgewater, NJ, USA)) starches and xanthan gum (Bob’s Red Millis (Milwaukie, OR, USA)) (0.075%, 0.15% w/v). A minimal amount (Table 1) of aspartame (Spectrum A1377, Lot No. 1LC0739) and vanillin (Sigma-Aldrich W310700 (St. Louis, MO, USA)) was added to the beverages to make them more palatable for participants. The beverages were prepared in reverse-osmosis (RO) water by blending xanthan gum, aspartame, vanillin, and starch in a Vitamix blender Model Pro-750 (Cleveland, OH, USA).

2.4. Design and Rationale

Ratings were collected in Compusense20 software (Guelph, ON, Canada) to understand the usage of the term Chalky relative to other terms that could be used to describe the perception of fine particles in a model beverage where the granular starch content was systematically varied. Specifically, participants were asked to rate Chalky, Powdery, Gritty, Sandy, Mouthdrying, and Residual Mouthcoating to evaluate differences in their perception of these attributes for the sample beverages. These terms were selected from recent work by our group (e.g., [30]) and others (e.g., [31]), as well as an informal tasting of samples by three of the authors; final attributes were then piloted with ~10 members of our research group to confirm their appropriateness for these specific samples.
Prior to tasting any samples, participants were asked to provide a saliva sample by chewing on a 5 × 5 cm square of parafilm (Parafilm “M”, American National CAL, Chicago, IL, USA) for 5 min while spitting in a pre-weighed tube every 30 s to measure their salivary flow rate [32]. They then completed an orientation to a general labeled magnitude scale (gLMS) [33]. The gLMS is anchored with no sensation and the strongest imaginable sensation of any kind, with additional semantic labels for barely detectable, weak, moderate, strong, and very strong at specific points [34]. To understand changes in perception during and after consumption, participants were asked to complete a multi-point consecutive consumption test that was modified from the previously described sequential profiling method [31]. Here, they were asked to consume each sample beverage in small aliquots (5 mL), labeled with three-digit codes, a total of 3 times, making ratings on a gLMS at 0, 30, and 60 s after each sip, for a total of 9 timepoints per sample. Before tasting any test samples, they were given a warm-up sample, made of a mix of pea and potato starch at 10% w/v concentration and 0.075% w/v xanthan gum, to minimize any first-sample effect. They were also instructed to hold the sample in their mouth for 5 s before swallowing the entire sample. The order of presentation of test samples was randomized. To reduce fatigue, only 4 samples were given in a single session and sessions were separated by at least 2 days. Between each sample, there was a forced 2 min break for participants to clean their palate with RO water. At the end of the second session, they were asked to define Chalky. Demographics (self-reported age, gender, race, and ethnicity) were collected at the end of the second session, as well as the consumption frequency of protein shakes or supplemental nutrition products.

2.5. Dispersion Viscosity Measurement

The dispersion viscosity data of the starch suspensions were recorded at 37 °C using a strain rheometer (ARES 400601.901, TA Instruments, New Castle, DE, USA) with a parallel plate geometry. This temperature was chosen to match the mouth temperature during consumption. A sweep test was conducted with decreasing shear rate from 10 to 0.1 s−1 in logarithmic function. The measurements were made in clockwise and counterclockwise directions, lasting about 7 min. All measurements were taken in triplicate.

2.6. Data Analysis

Data were analyzed using RStudio (version 2023.03.1). A linear mixed-effect model was applied to the Chalky ratings using ‘lme4’ [35]; fixed factors included particle size, concentration, xanthan content, salivary flow group, sip time, and rating timepoint. Participants were split into two groups (high or low salivary flow) according to the median average salivary flow rate using the measurements of the weights of their saliva on both test days. This was to test if salivary flow rate influenced Chalky ratings. Participants were a random factor in the model to take individual differences in the use of scale rating into account. Outliers more than 2.5 standard deviations from the mean residuals were removed to increase the normality of residuals. Interactions up to three-way ineractions were included in the model. A post-hoc comparison of estimated marginal means of significant interactions was made using ‘emmeans’ [36]. The effect size of all the factors in the model was calculated using ‘effectsize’ [37]. A decorrelation analysis [38] comparing Chalky ratings to other ratings was carried out by correlating the mean of the perceptions, grouped by sample beverage. Principal Component Analysis (PCA) was performed on the mean sensory ratings of each sample beverage and the PCA loadings plot was made using “SensomineR” [39], “plotrix” [40] and “ggrepel” [41]. Line plots of the estimated marginal means of sensory perception intensity and consumption time points were generated using the “ggplot2” package [42]. A statistically significant difference was defined as p < 0.05.

3. Results

3.1. Participants Characteristics

Participant demographics are summarized in Table 2. Initially, 99 participants registered for the sensory test; however, 10 participants only completed half of the test, so they were removed prior to data analysis. Another seven participants were removed as they failed the gLMS orientation. The criteria for using the gLMS as intended were based onthe proper ordering of the remembered light and sound sensations: the brightest light they had ever seen > brightness of a well-lit room > brightness of a dimly lit room; loudest sound you have ever heard > loudness of a conversation > loudness of a whisper. This allowed for a deviation of up to 5.0 units on a 100-point scale [43]. No formal power calculation was performed a priori; the sample size was based on the field norms and current guidelines for data collected from untrained consumers [44].
We saw large individual differences in the salivary flow rate of our participants, varying from 0.48 g/min to 3.98 g/min. The effect of salivary flow rate on Chalky ratings was tested by grouping participants into a high-flow group (mean = 2.43 ± 0.66 g/min) and a low-flow group (mean = 1.06 ± 0.27 g/min). The distribution of flow rates for our participants is shown in Figure 1. The low-flow group had a narrow normal distribution while the high-flow group was more variable, with the distribution skewed to the right.

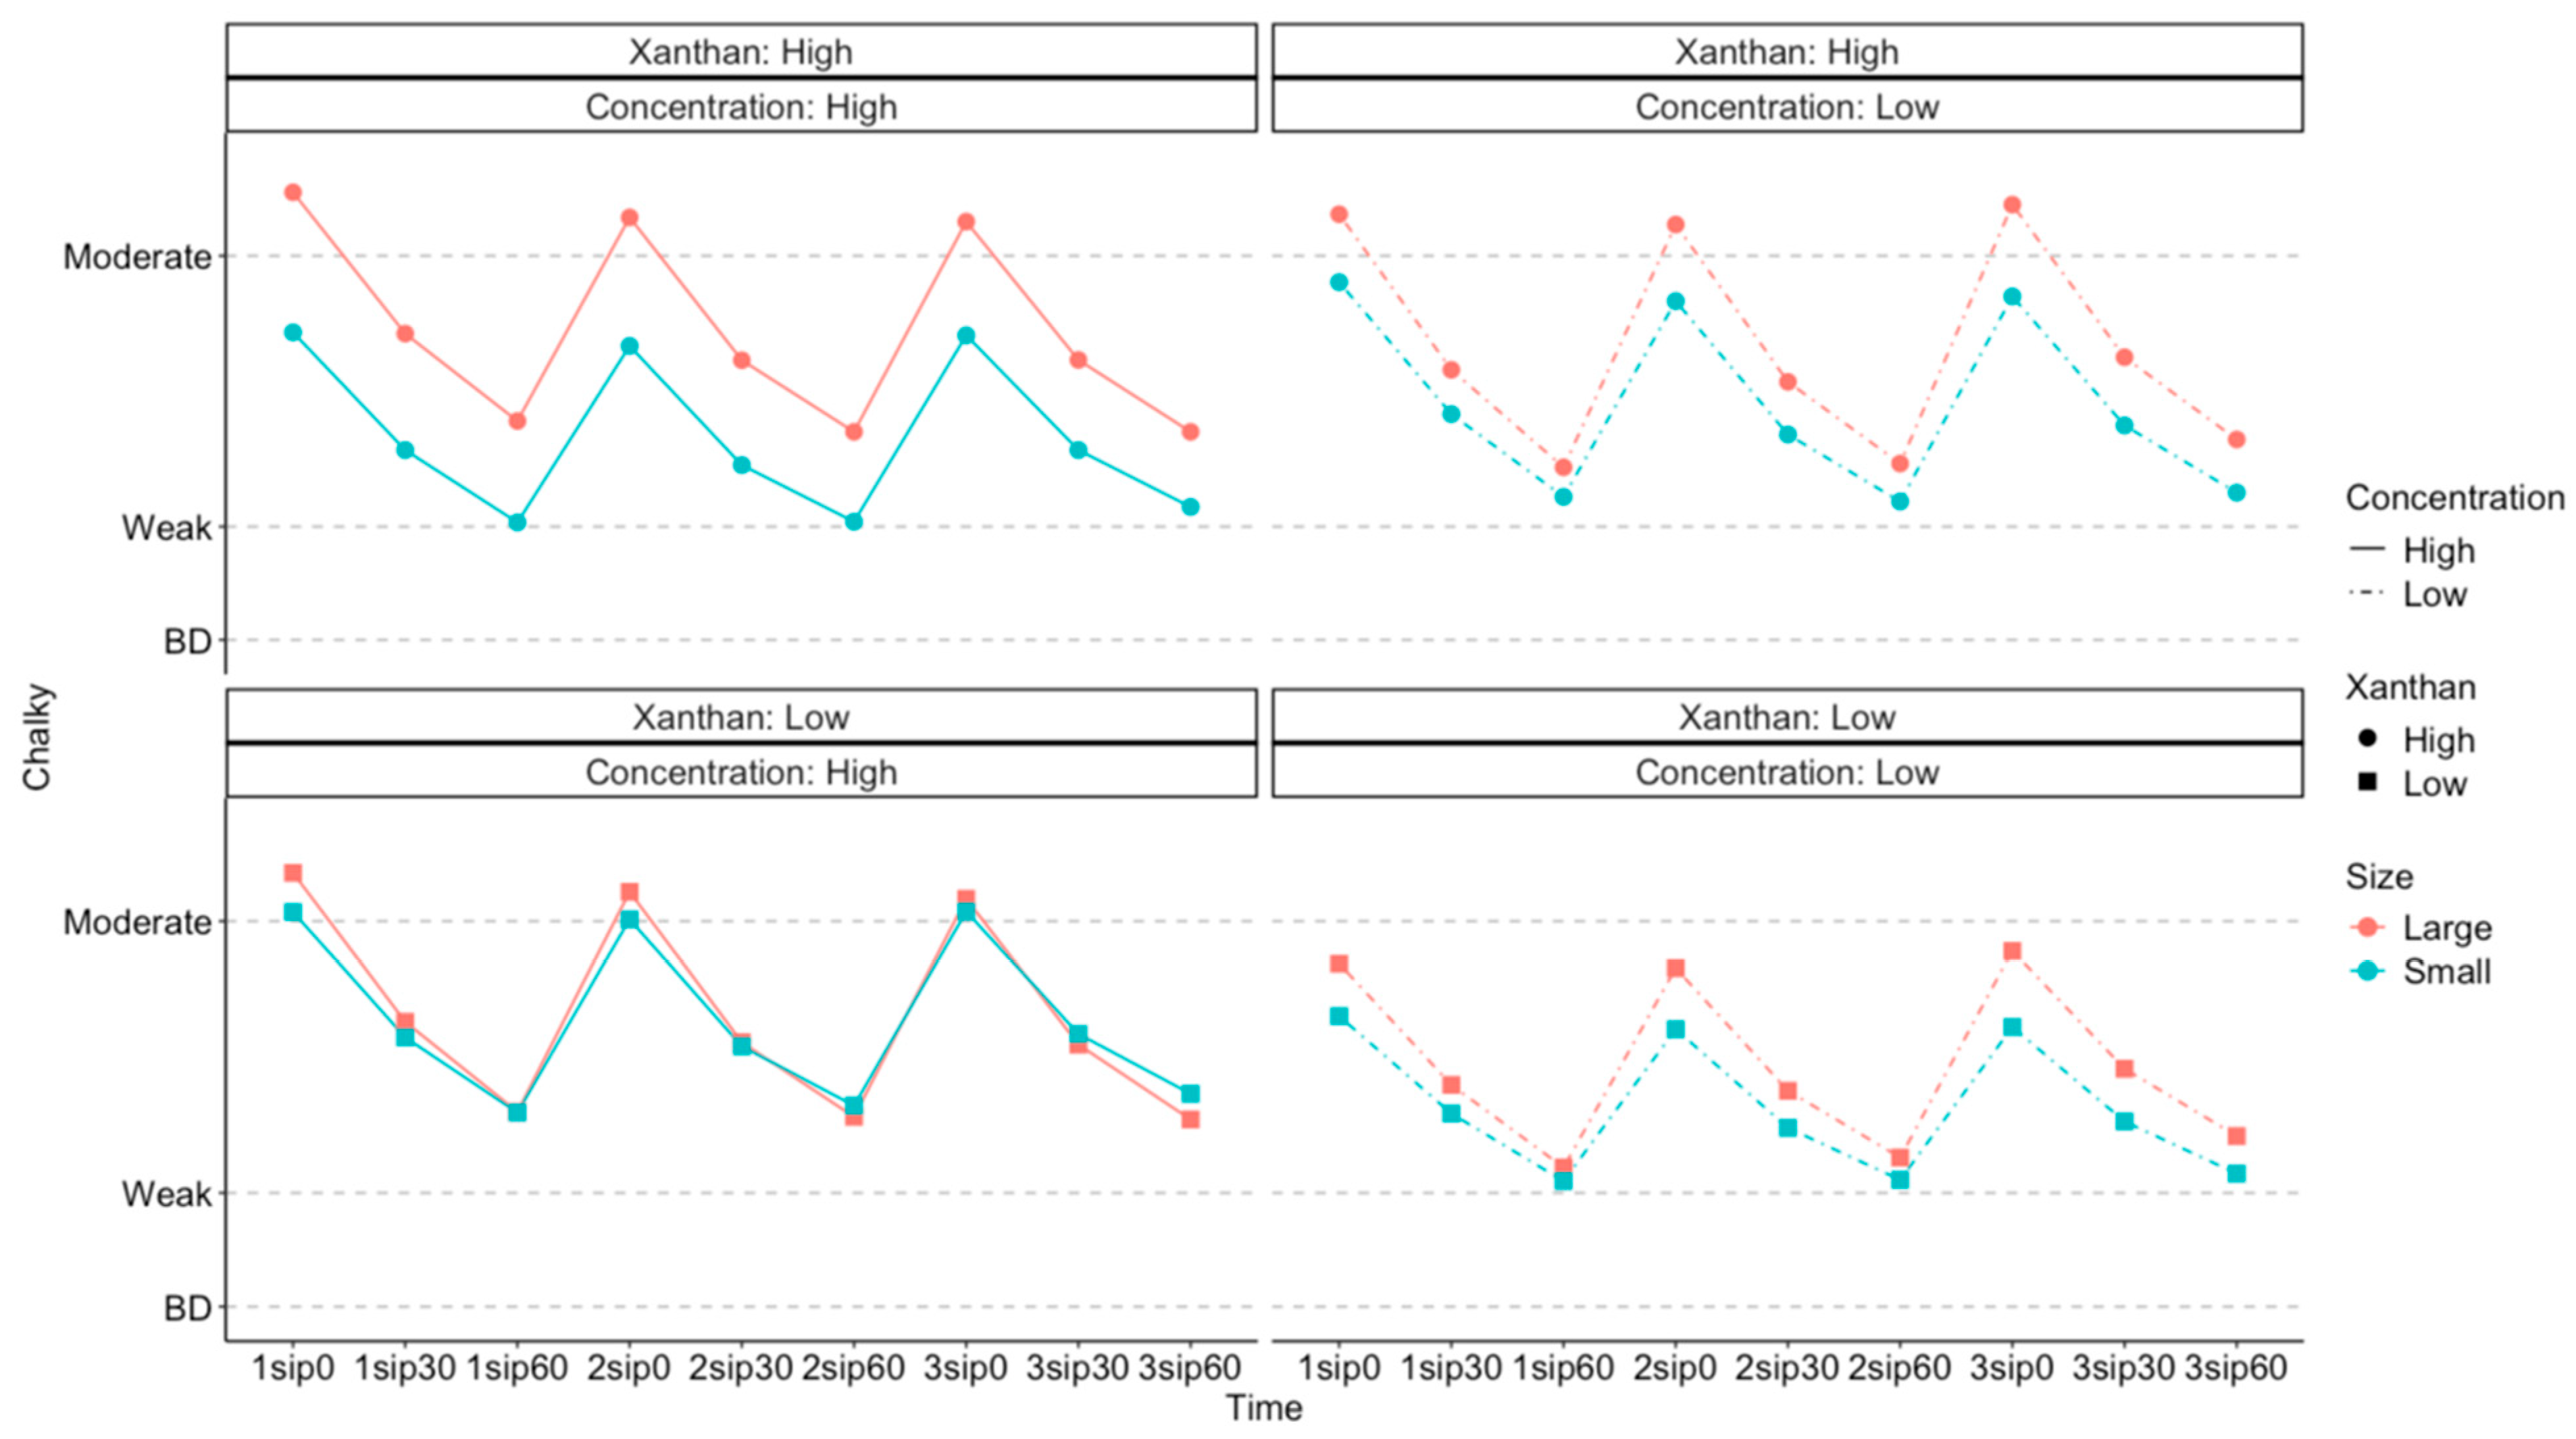
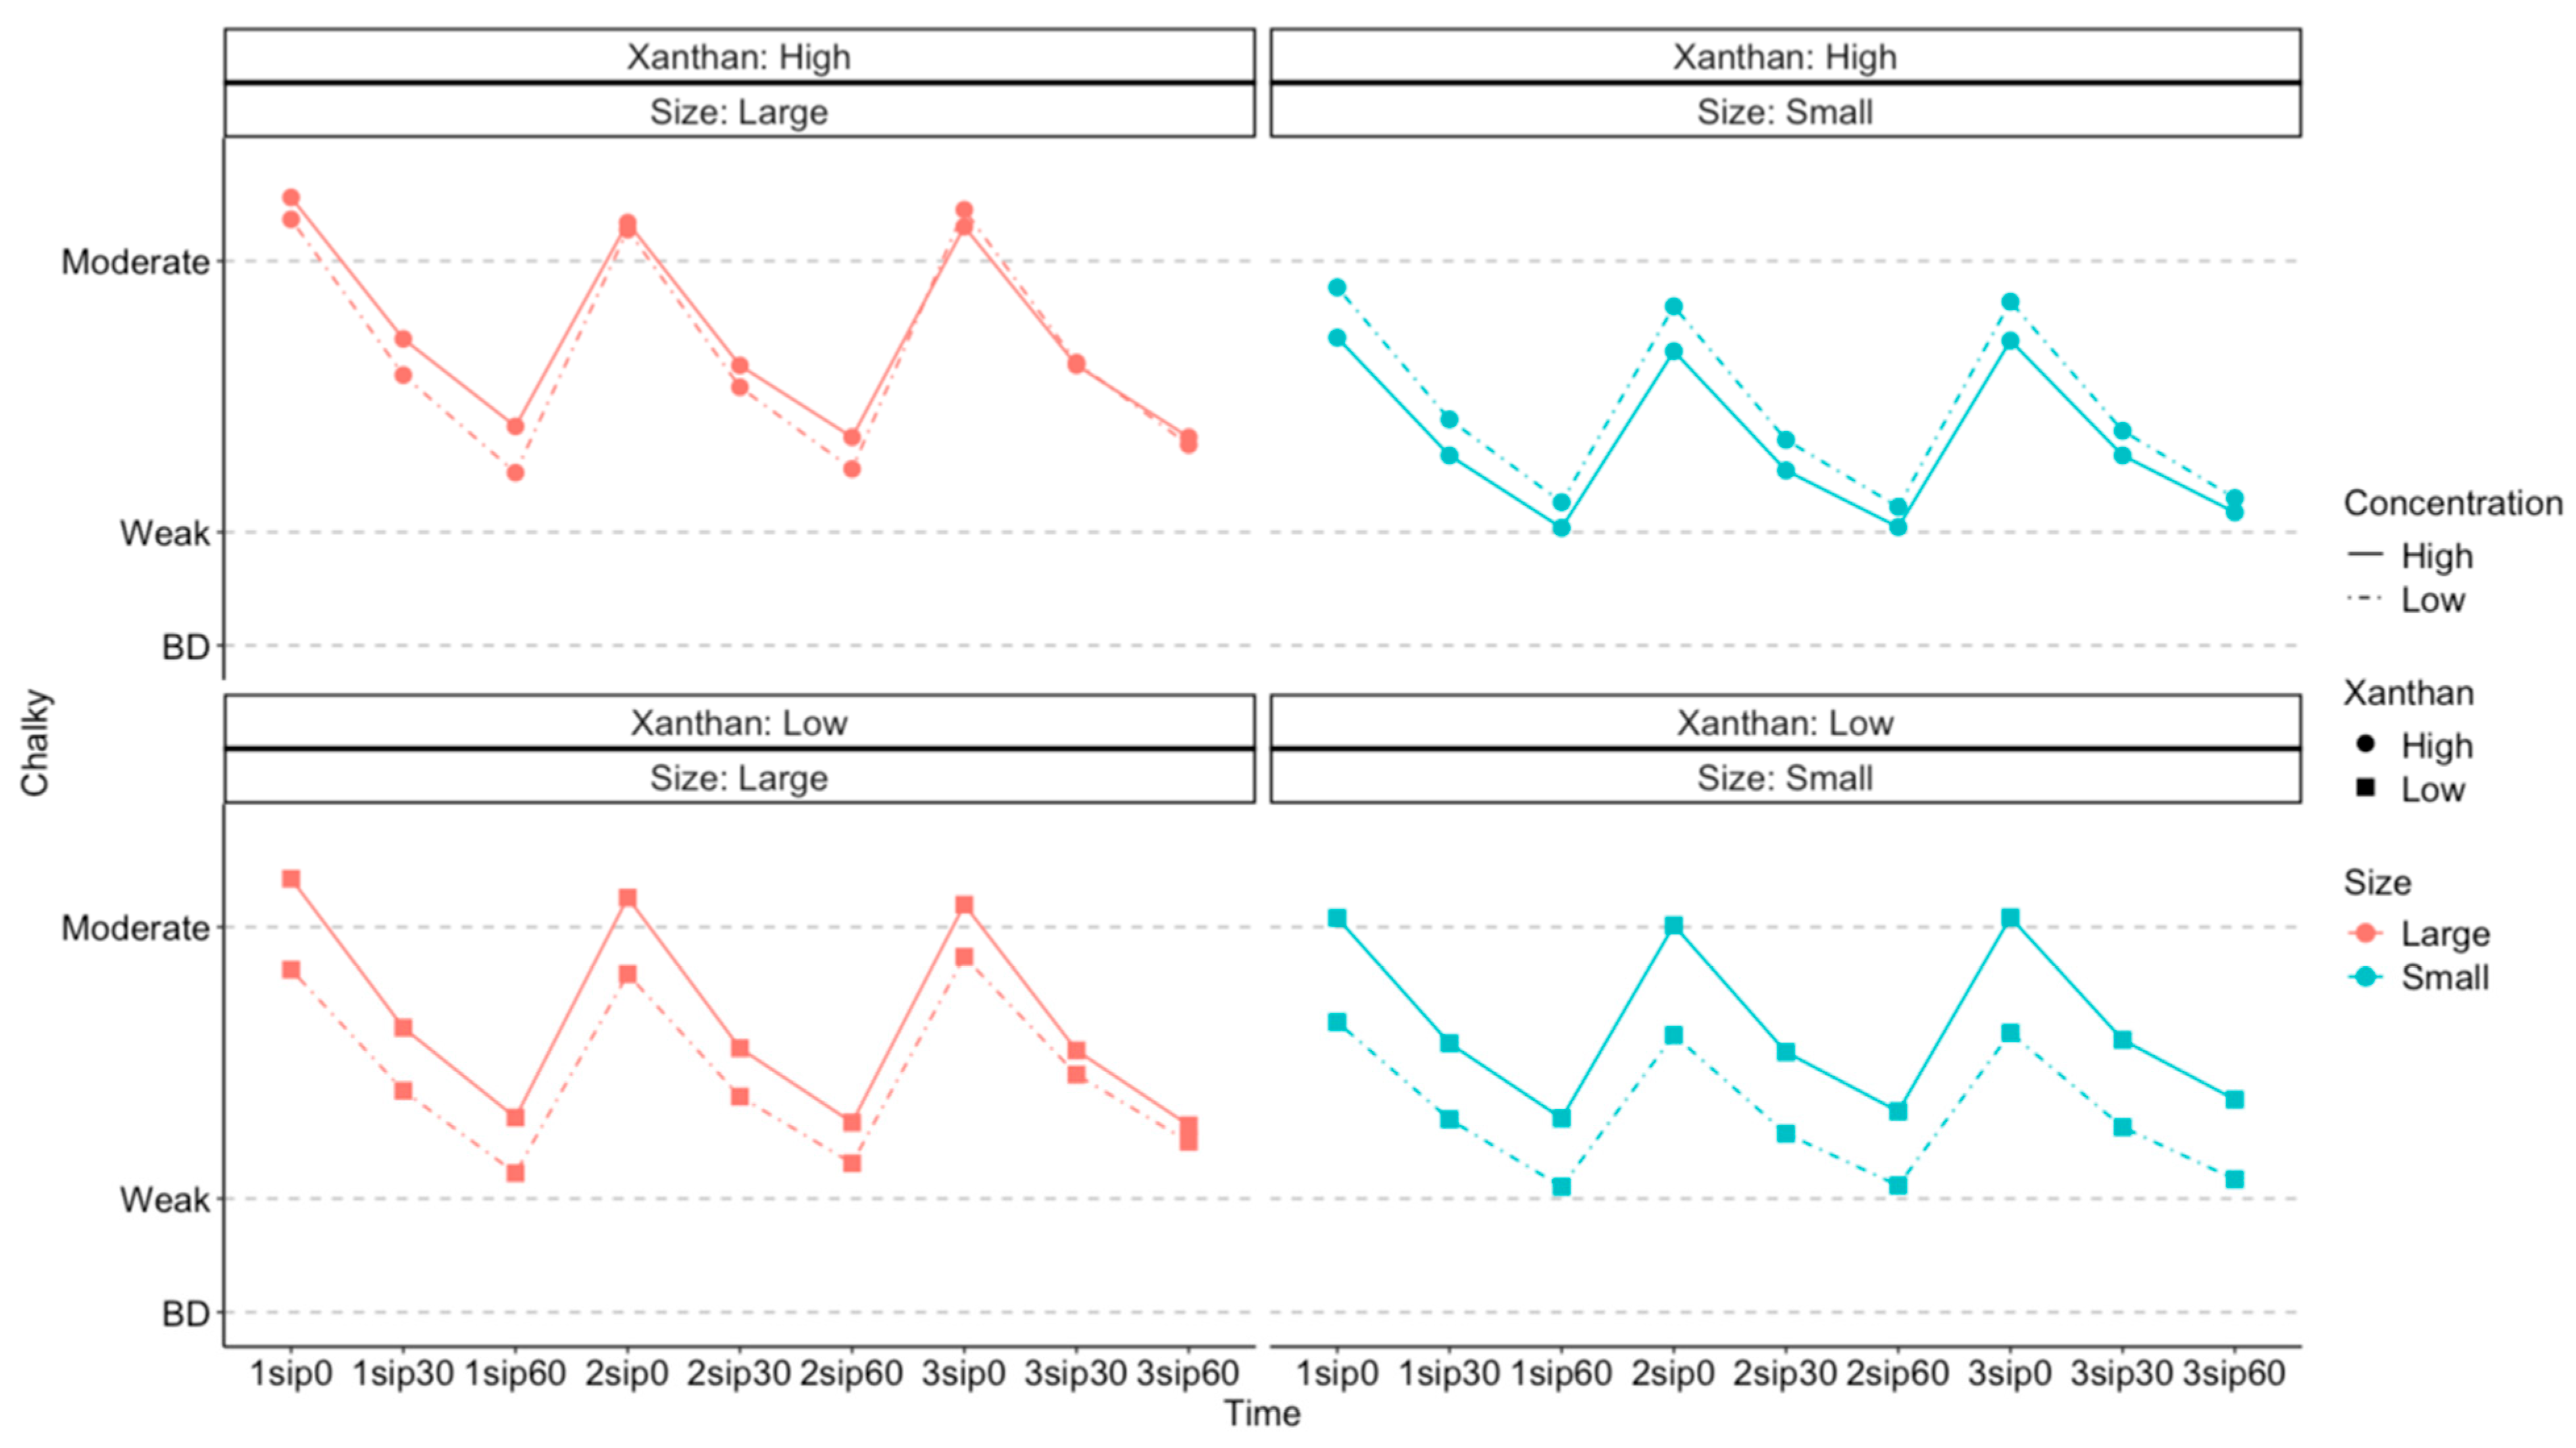
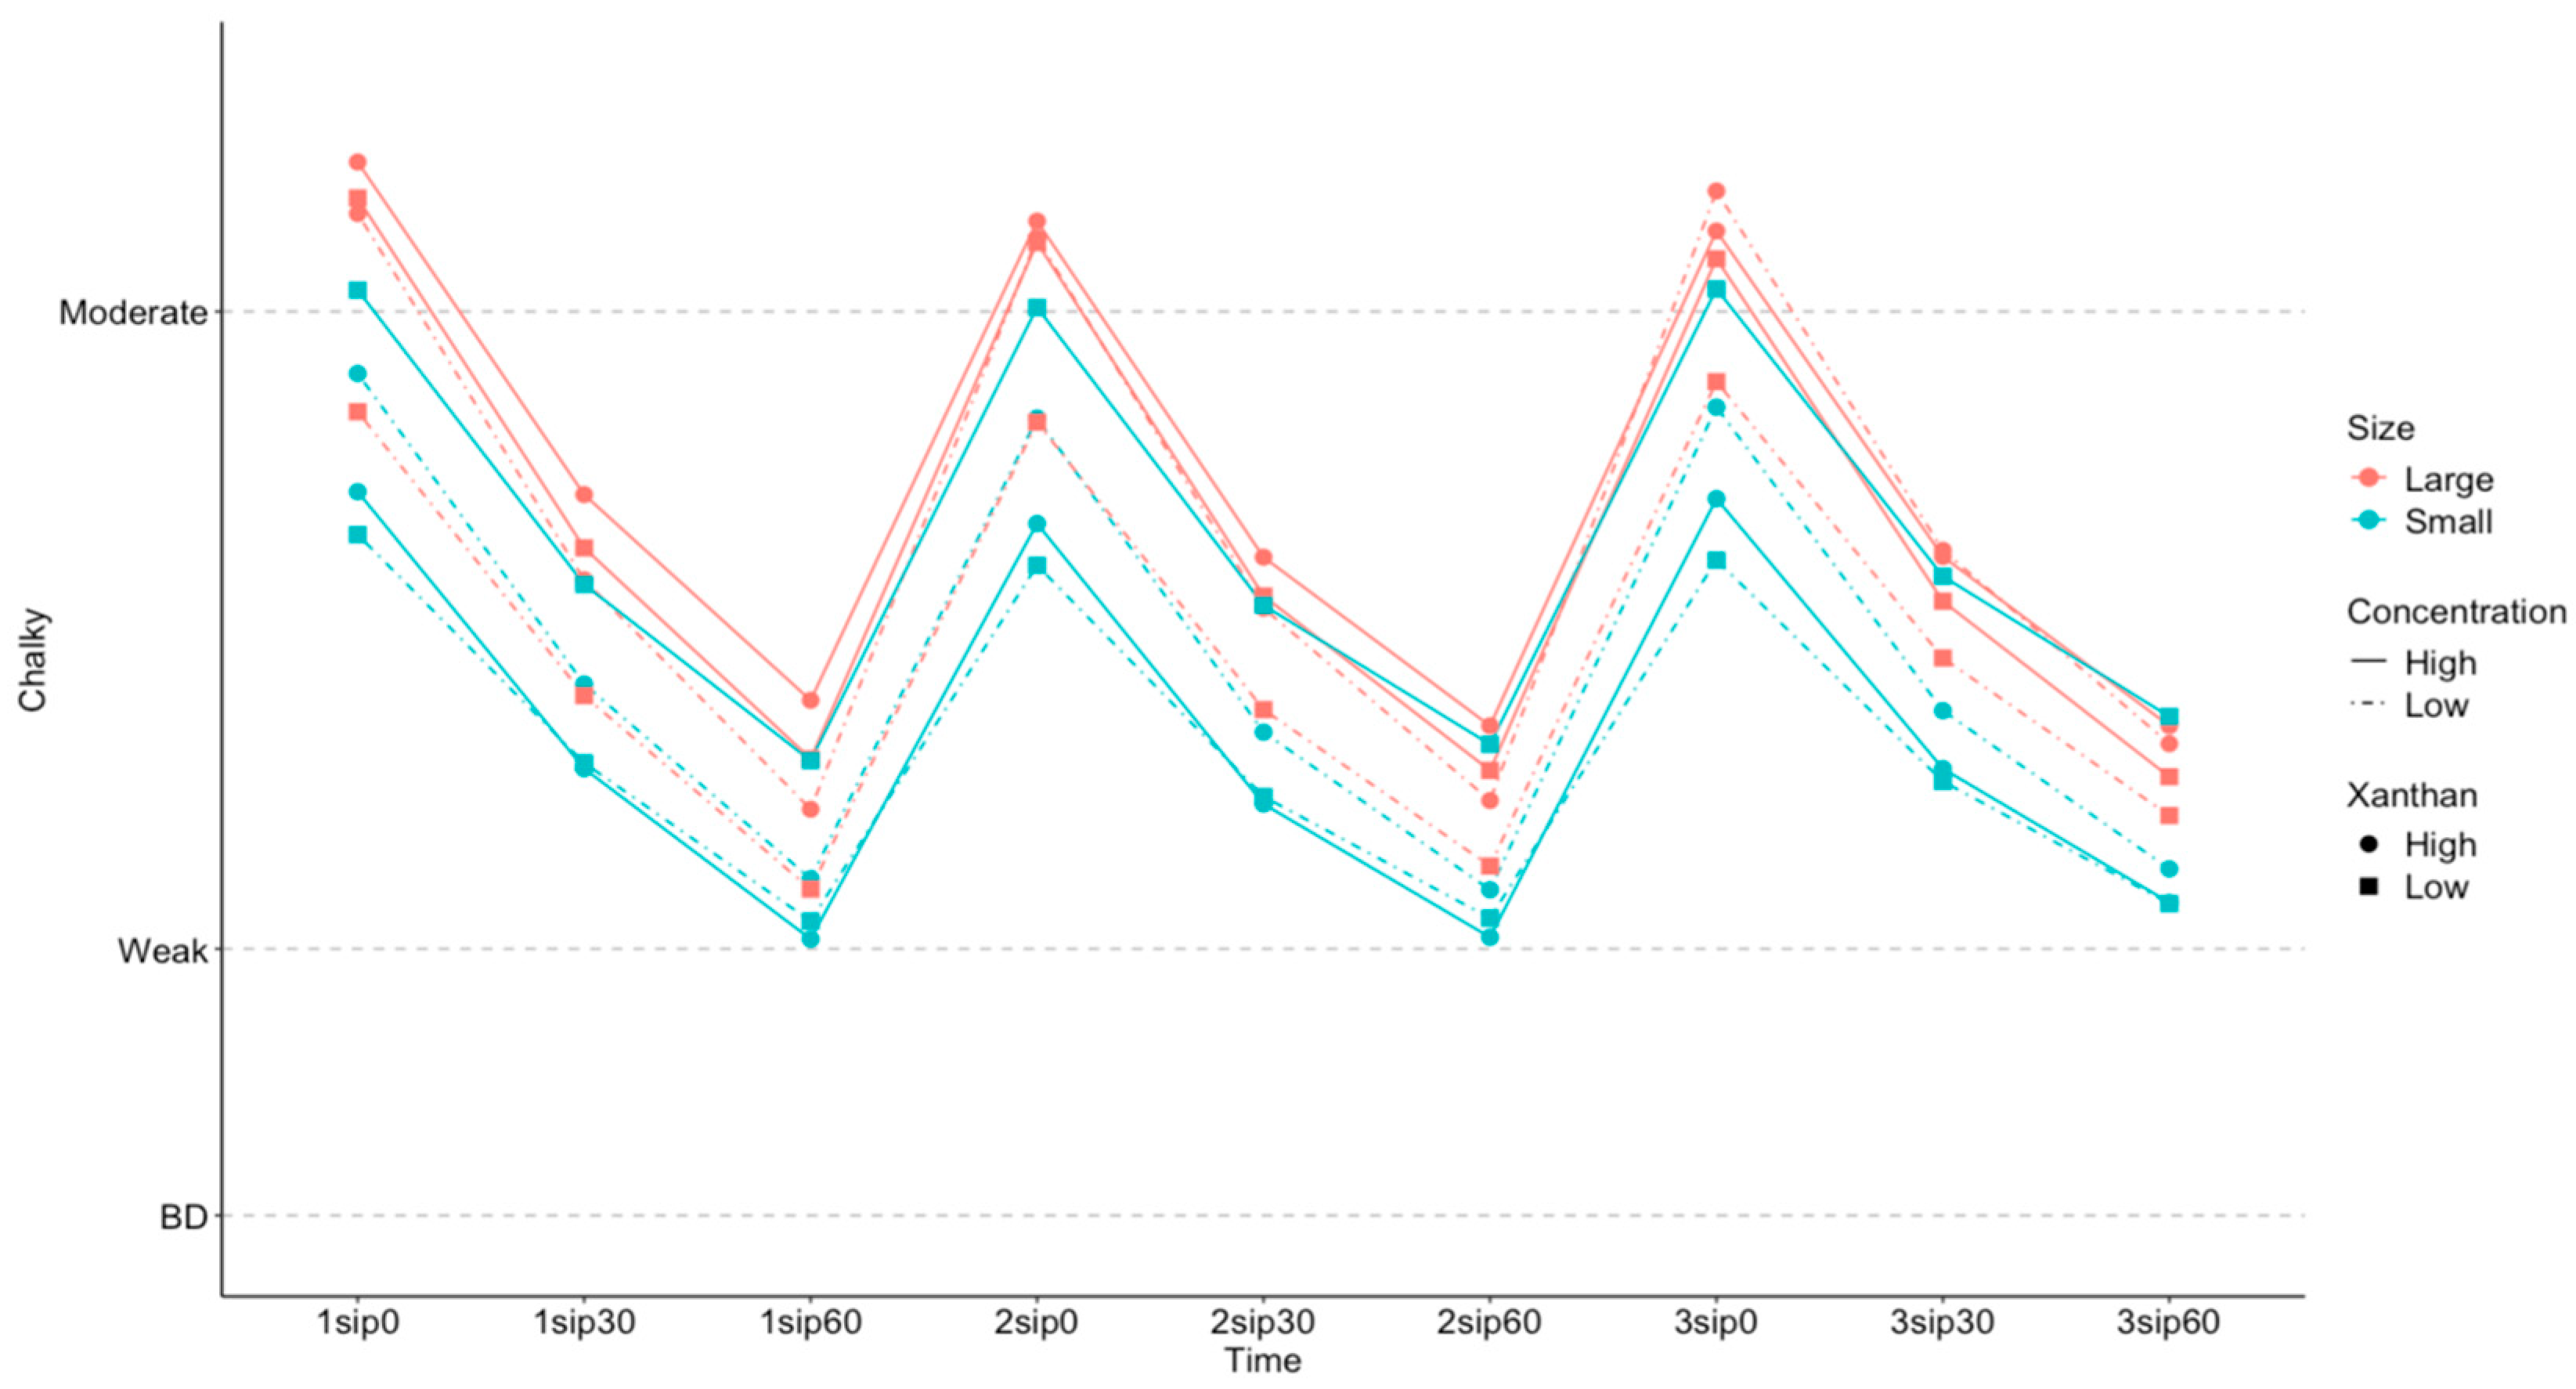
3.2. Effect of Particle Size, Concentration, and Xanthan Content on Chalky Ratings

Particle size [F (1,5626) = 269.4; p = <0.001] and concentration [F (1,5626) = 93.9; p < 0.001] each had a significant main effect on Chalky ratings. Xanthan content did not show evidence of a main effect on Chalky ratings [F (1,5626) = 3.5; p = 0.0613], but there were significant interactions with xanthan content by size [F (1,5626) = 81.0; p < 0.001] and concentration [F (1,5626) = 142.8; p < 0.001]. The three-way interaction size by concentration by xanthan content was also significant [F (1,5626) = 43.0; p < 0.001].
To facilitate interpretation of the interactions, estimated marginal means of Chalky ratings for concentration, particle size, and xanthan content are presented in Figure 2 and Figure 3. The differential effect of particle size (p < 0.001) on Chalky ratings was greatest in the high xanthan content and at a high concentration level (Figure 2, top left). Conversely, with a low xanthan content but a high concentration (Figure 2, bottom left), there was no evidence (p = 0.37) of a difference between the particle sizes. When particle concentration was low (right side of Figure 2), particle size influenced Chalky ratings, but xanthan content did not appear to alter this effect. Therefore, we can conclude that a larger particle size tends to lead to a higher Chalky rating in general, but this difference is minimized at high concentrations and low xanthan contents.
Regarding concentration effects, the differential effect (p < 0.001) on Chalky ratings was greater in the low-xanthan-content level (bottom of Figure 3). Conversely, with a high xanthan content, there was less of a difference between the concentration levels (top of Figure 3). With a smaller particle size (right side of Figure 3), the differential effect of particle concentration was greater. Therefore, we can conclude that higher particle concentration level tends to lead to a higher Chalky rating, but this difference is larger when xanthan content is low.

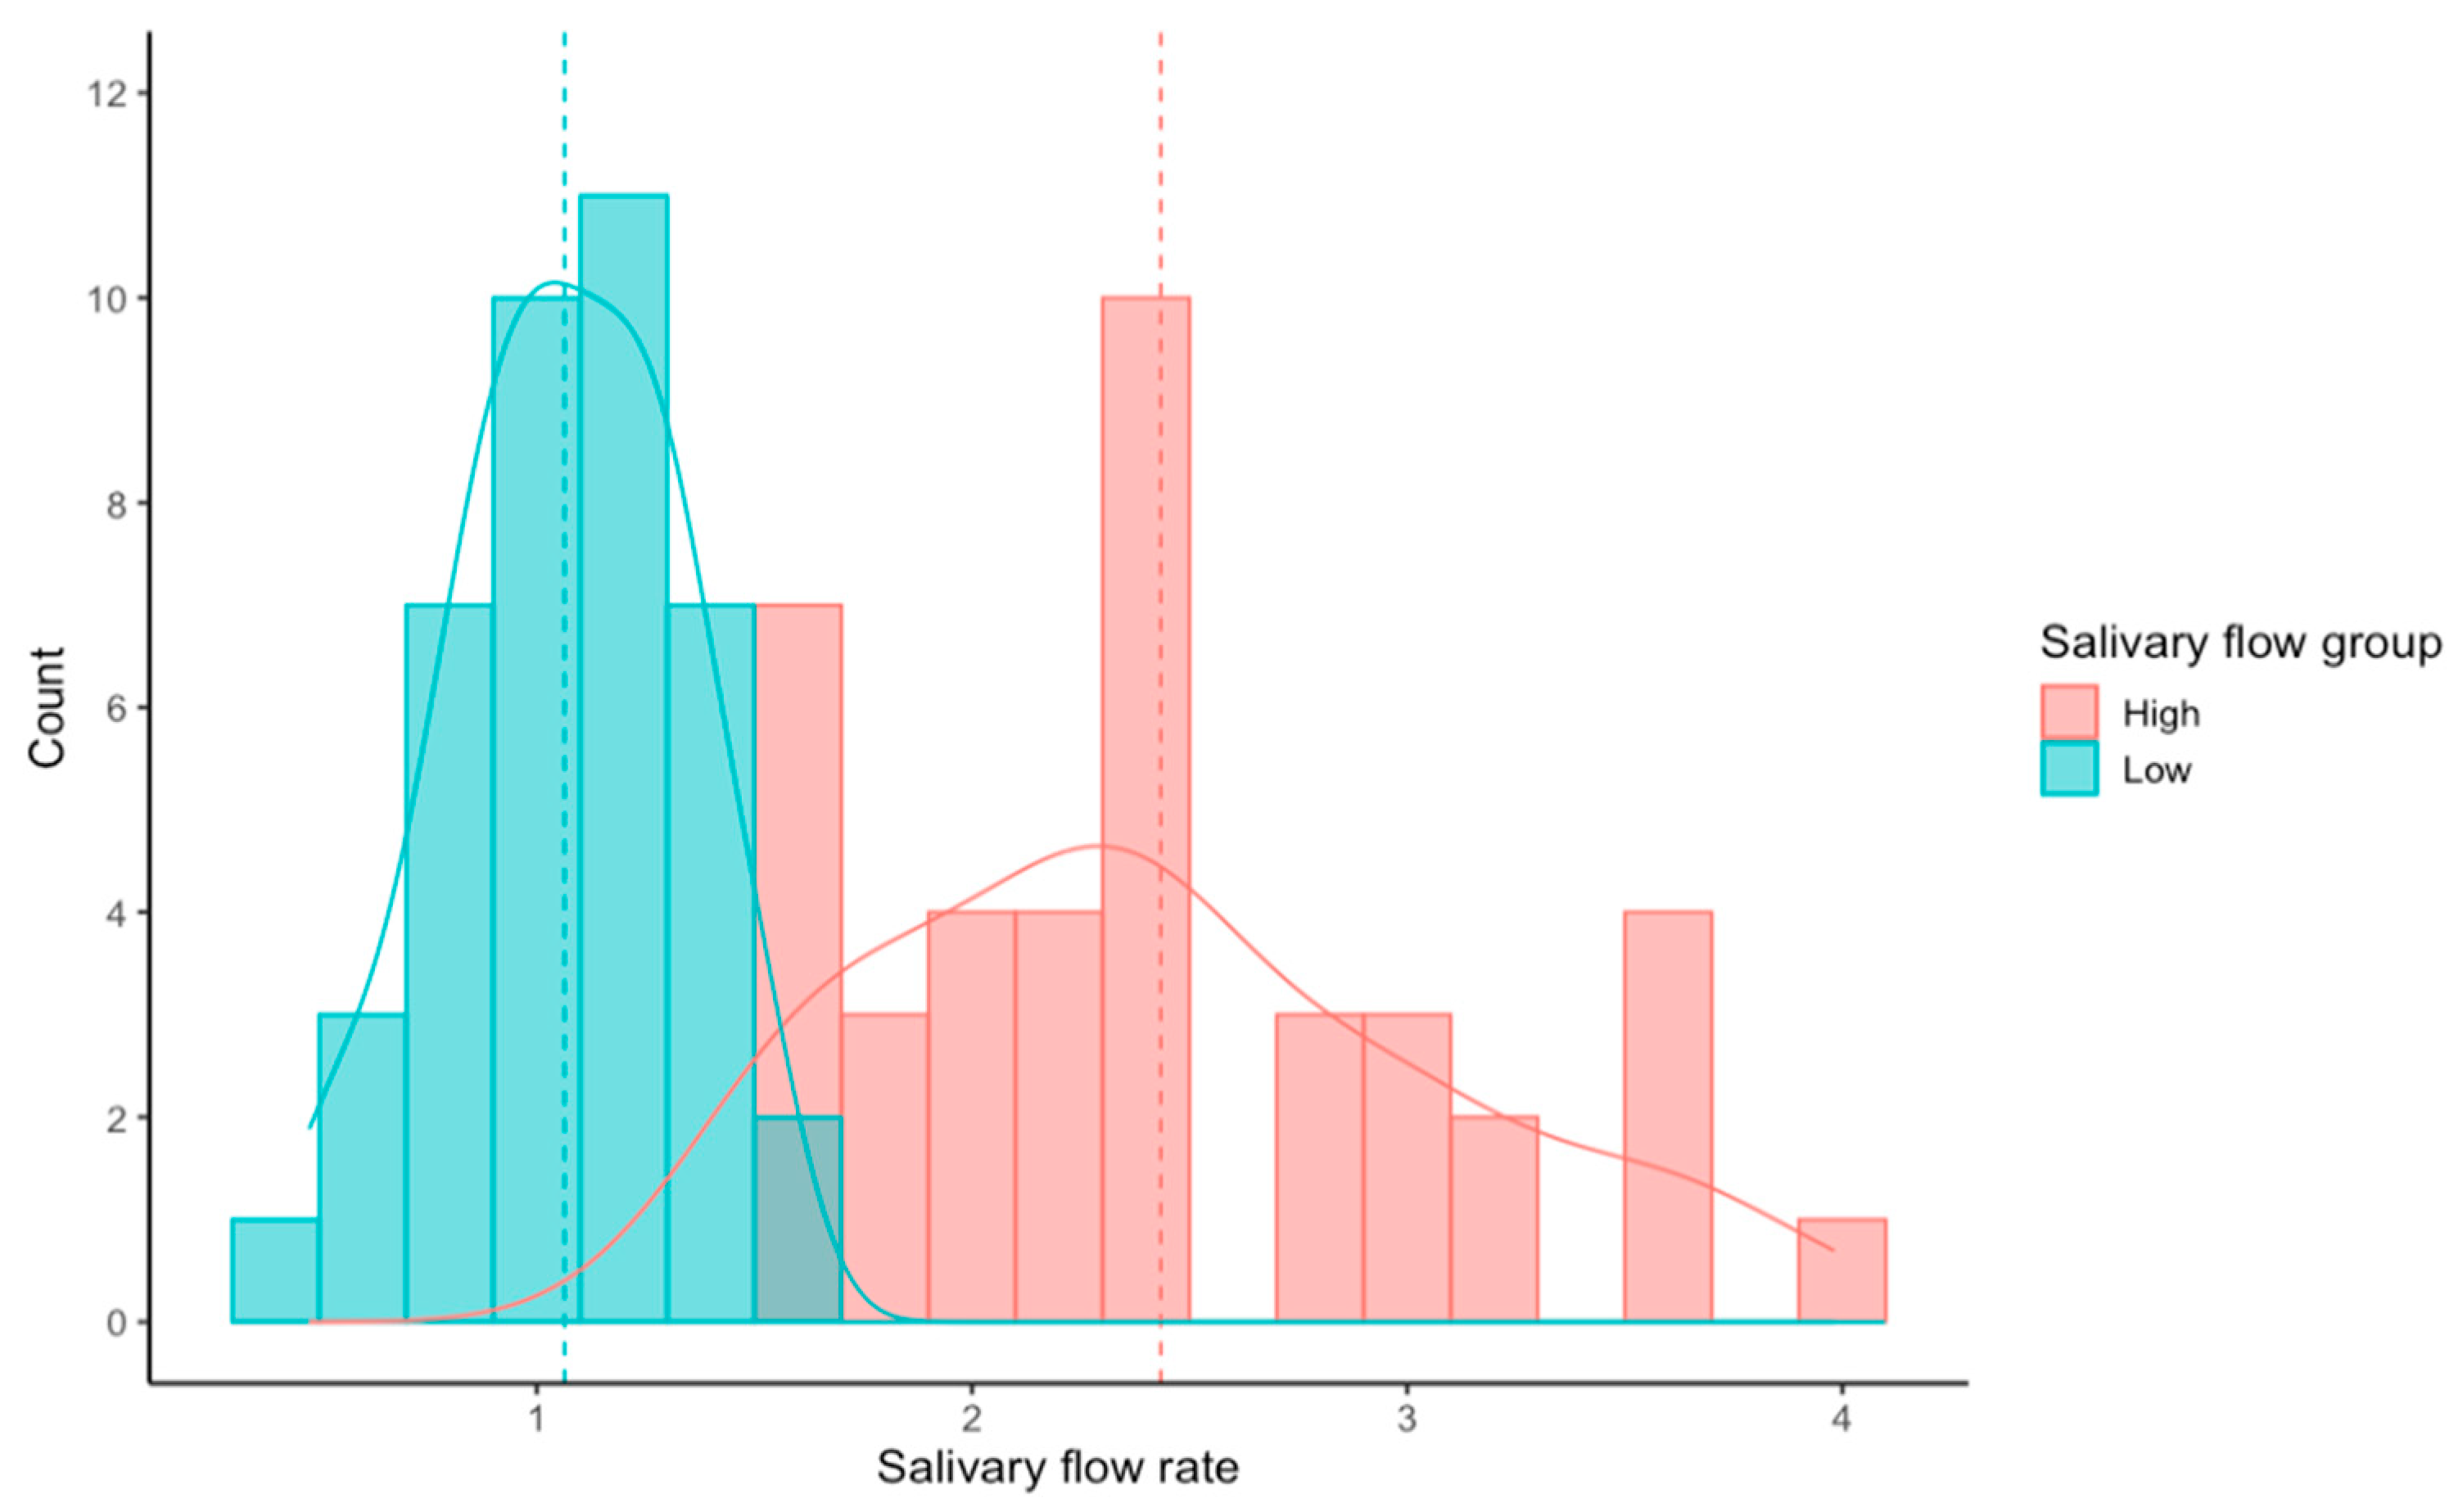
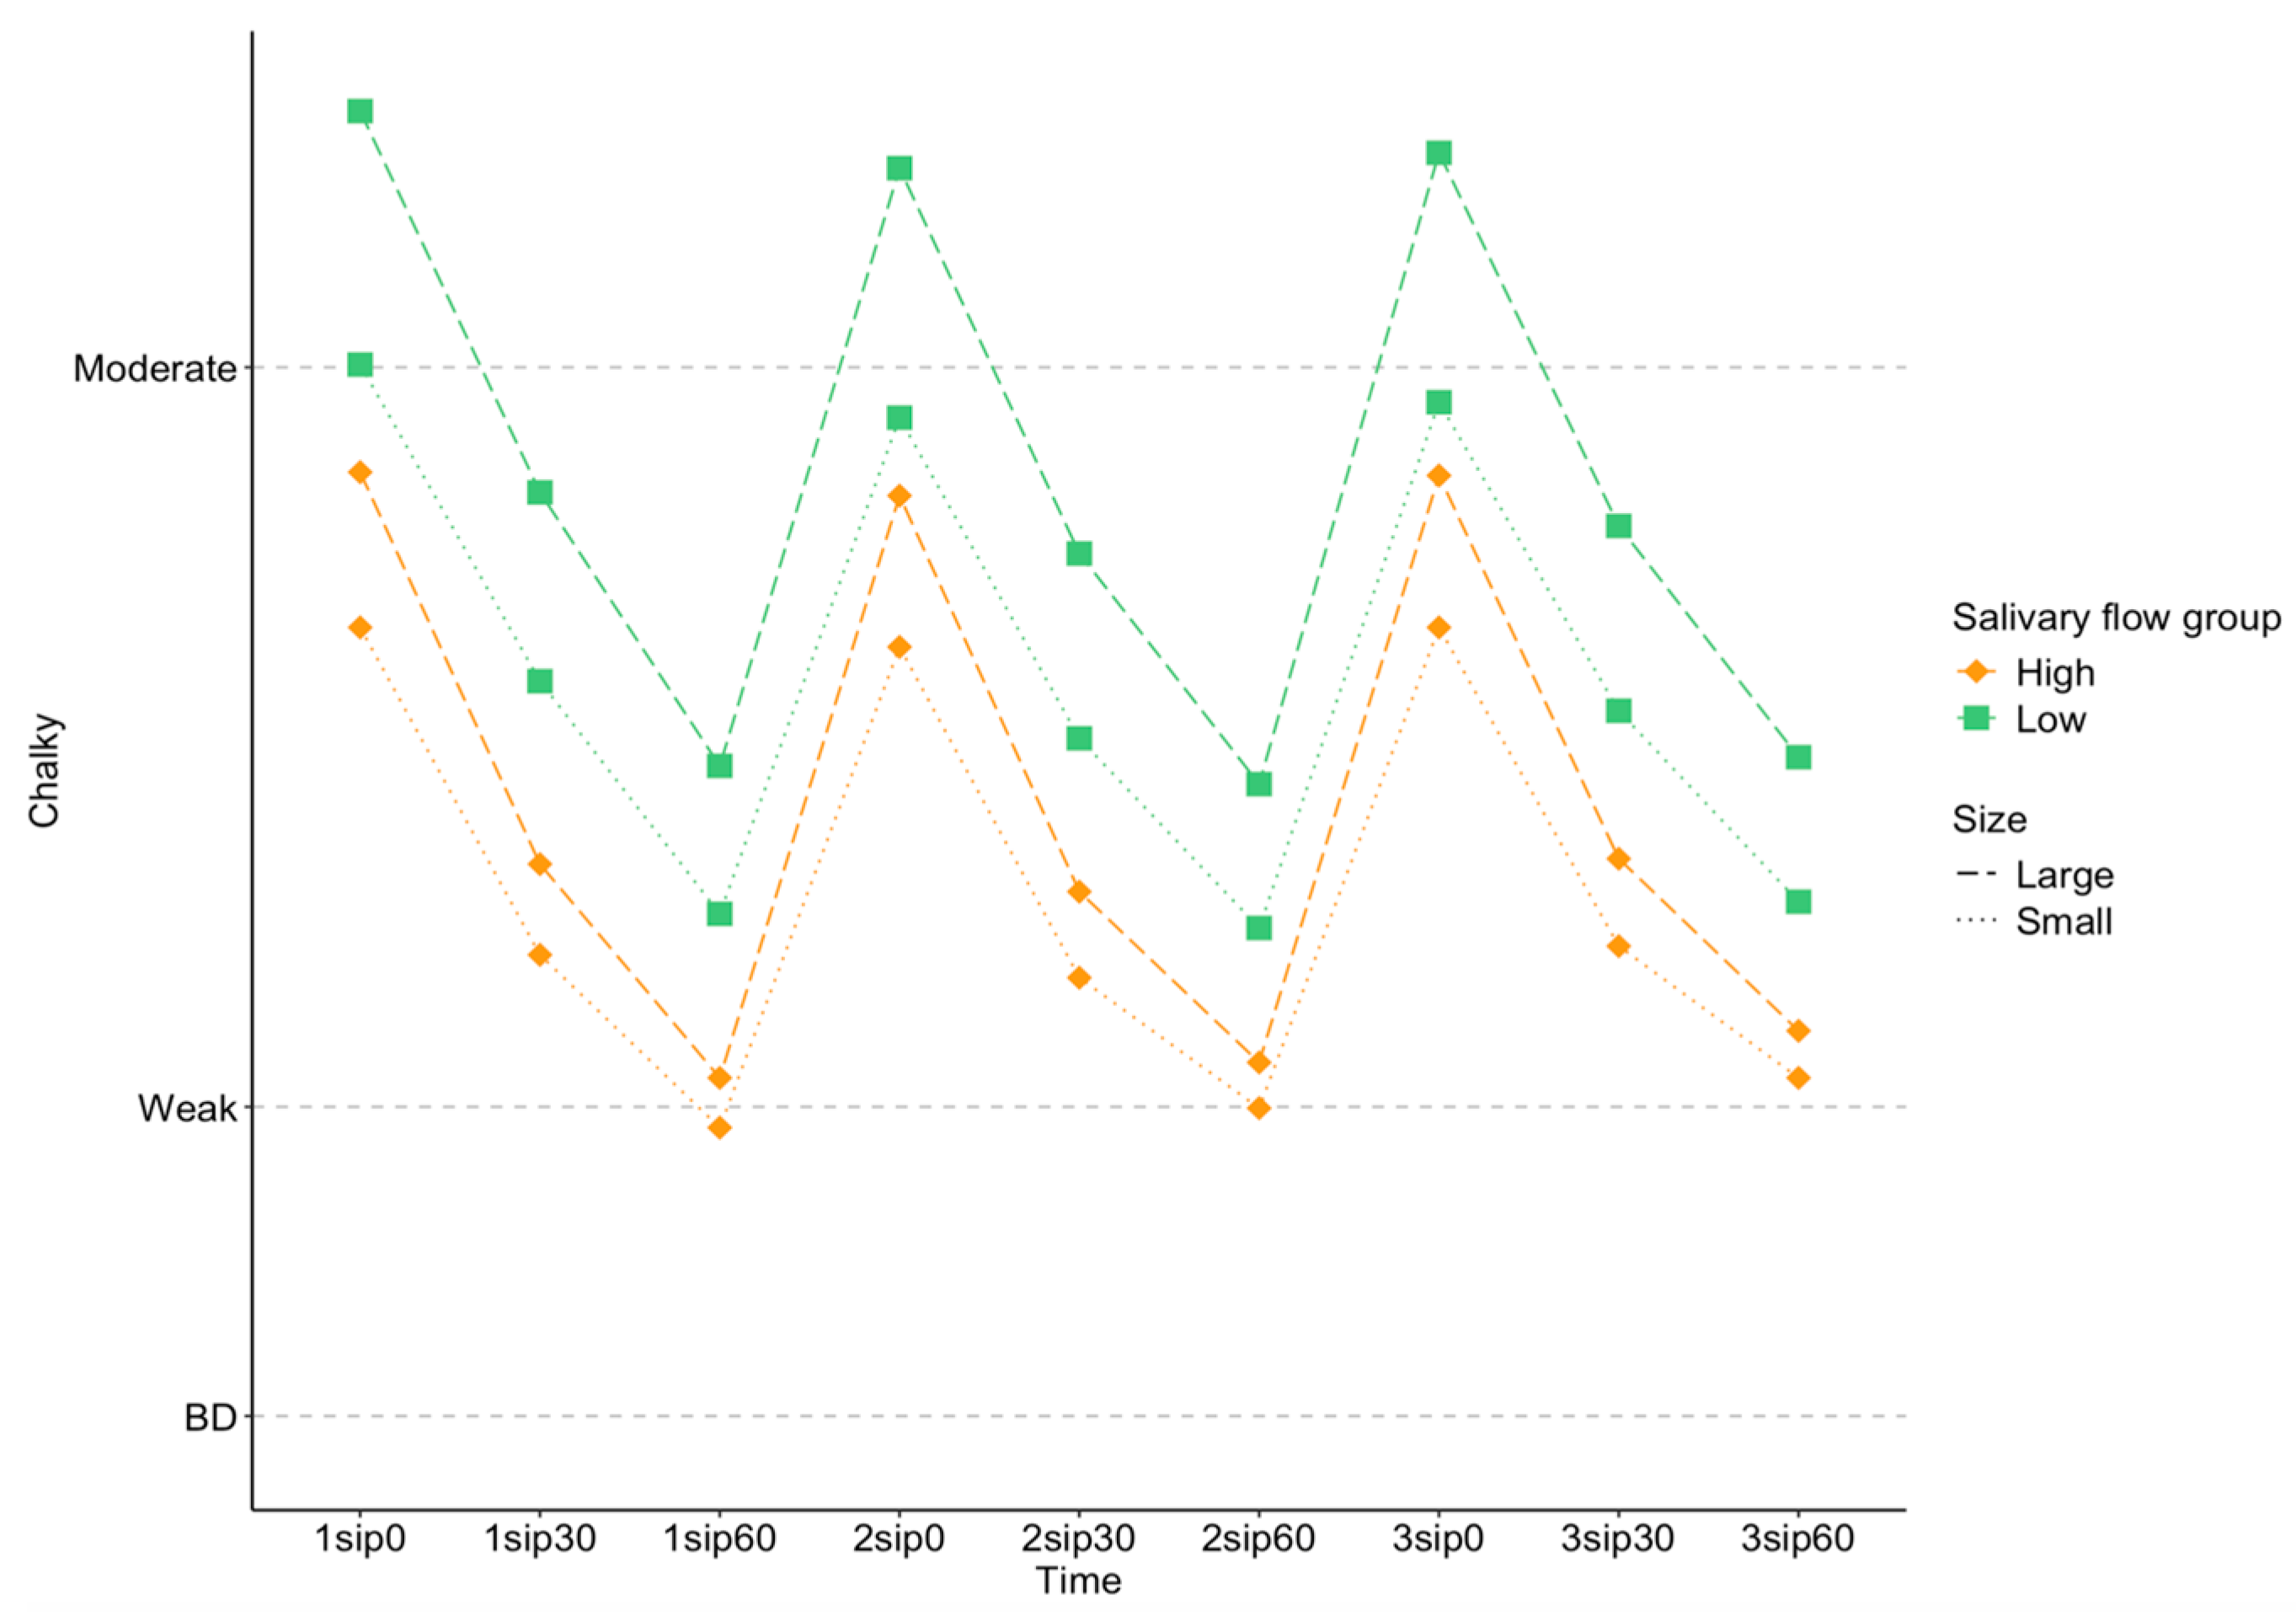
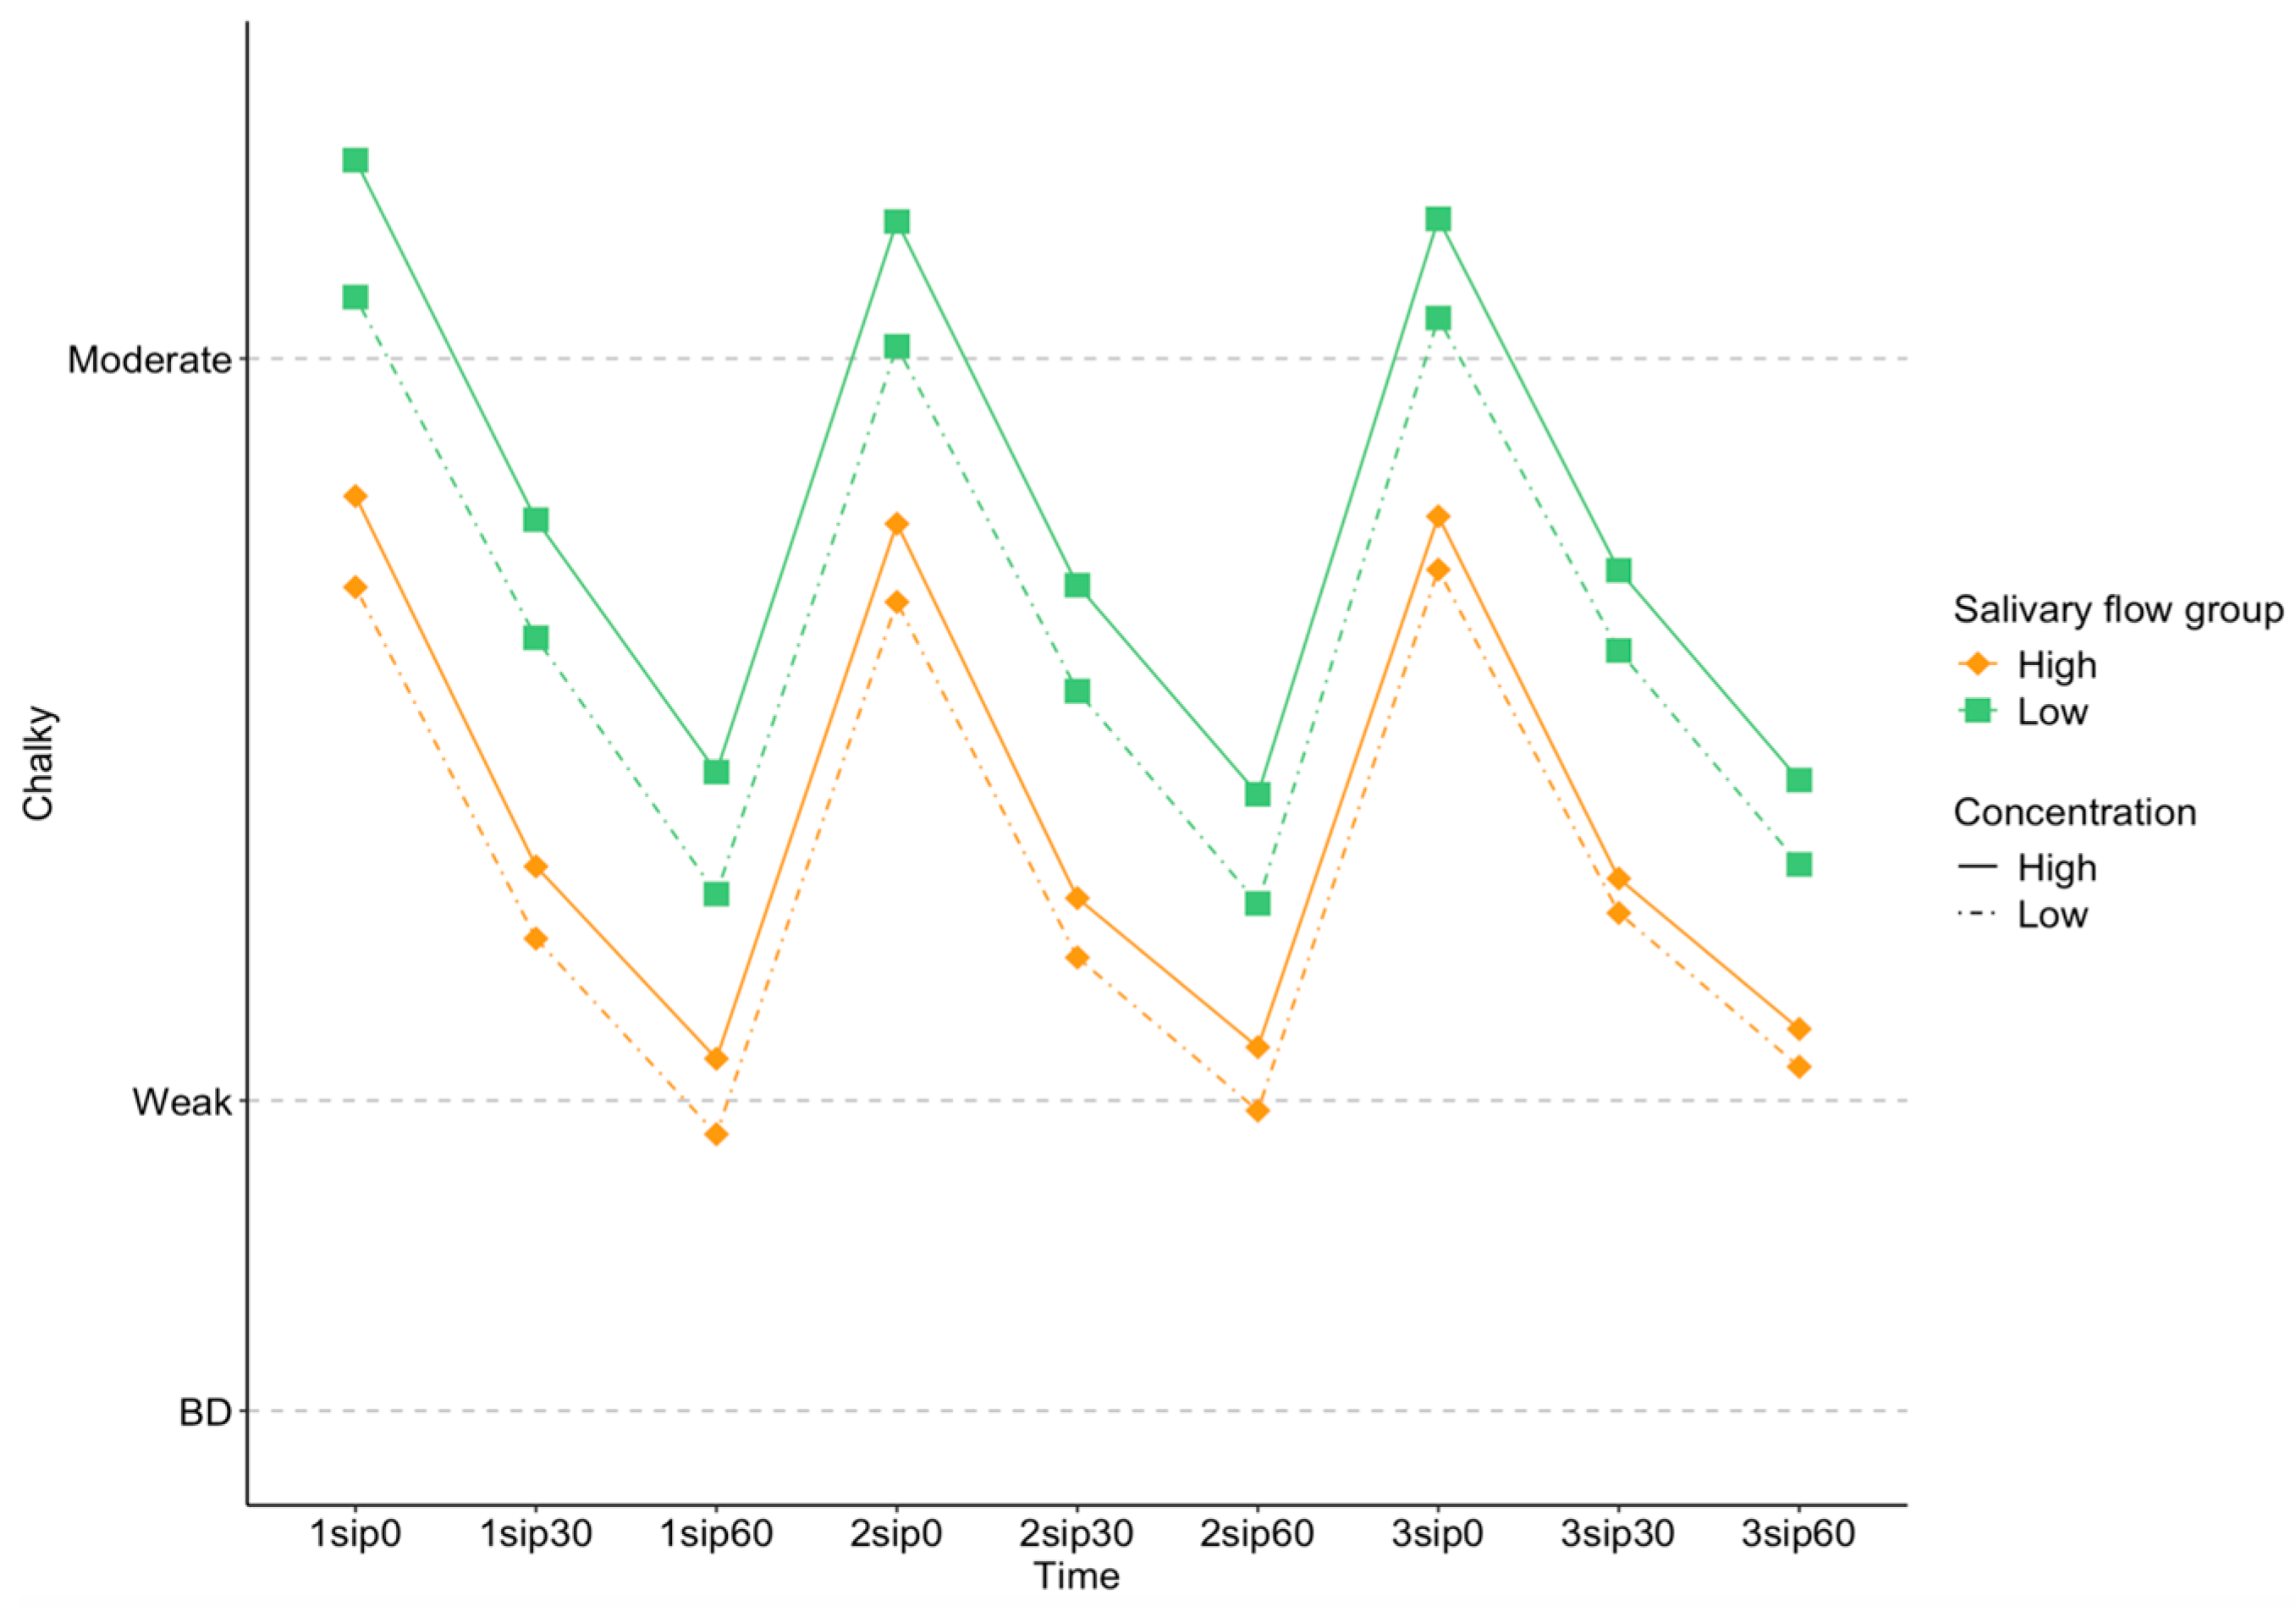
3.3. Salivary Flow Rate Effect on Chalky Ratings

Salivary flow affects texture perception by acting as a lubricant in the mouth. Here, we saw a significant effect of salivary flow on Chalky ratings [F (1,80) = 3.97; p = 0.0497], with the lower salivary flow rate group reporting higher Chalky ratings. There was also significant interaction between salivary flow and particle size [F (1,5626) = 30.6; p < 0.001] and salivary flow and concentration [F (1,5616) = 6.72; p = 0.0096] on Chalky ratings, as shown in Figure 4 and Figure 5.
As shown in Figure 4, larger particles had higher Chalky ratings than smaller particles for all participants, but the size of this difference was greater for the low-flow group than the high-flow group.
As shown in Figure 5, a higher concentration lead to greater Chalky ratings than lower concentrations for all participants but the size of this difference was greater for the low-flow group than the high-flow group. While differences in Chalky between salivary flow rate groups were significant for both Figure 4 and Figure 5, the effect of salivary flow is more pronounced for particle size than for concentration, with the partial Eta2 of the interaction between salivary flow and size (0.005) is larger than that of salivary flow and concentration (0.001), consistent with the differences visualized in Figure 4 and Figure 5.

3.4. Chalky Ratings over Time

The Chalky ratings were made immediately after each sip (total of three) at 0, 30, and 60 s (total of nine time points). Mean Chalky ratings ranged from weak to strong on the gLMS, as shown in Figure 6. In the linear mixed-effect model, the sip order (1, 2, 3) and rating time points (0, 30, 60 s) were added as fixed effects to understand changes in Chalky ratings over time. There was significant effect of sip number on Chalky ratings [F (2,5626) = 3.84; p = 0.0215]; however, this effect was only found with a drop in Chalky ratings at Sip 2, not between Sip 1 and Sip 3 (p = 0.99), with these having similar estimated marginal means. Additionally, there was no significant interaction effect between sip and timepoints [F (4,5626) = 1.26; p = 0.2828]. However, as expected, timepoint had a significant main effect on Chalky ratings [F (2,5626) = 1304; p < 0.001], as ratings dropped over each 30 s. Collectively, this suggests there was no evidence of a buildup of chalkiness with repeated sips.

3.5. Decorrelation Analysis of Chalky and Other Similar Perceptions on Fine Particles

Here, we compare how Chalky and other terms were used to describe the samples evaluated by our participants. By correlating the group means of the rating of each of the samples, we find that Chalky was strongly correlated with all other attributes, r (6) = +0.83 or above (p < 0.01), as shown in Table 3. Specifically, Chalky, Powdery, and Residual Mouthcoating had a high positive correlation of r (6) = +0.99 or above (p < 0.01), whereas Gritty and Sandy had the lowest correlation to Chalky, r (6) = +0.90 (p < 0.01). Notably, Gritty and Sandy had a much higher correlation with each other, r (6) = +0.99. The highest correlation with Mouthdrying was Chalky, r (6) = +0.93 (p < 0.01), and Powdery, r (6) = +0.91 (p < 0.01), with Gritty showing the lowest correlation, r (6) = +0.8 (p < 0.01)). Collectively, these data suggest three related but distinct sensations: a Chalky/Powdery/Residual Mouthcoating complex, a Gritty/Sandy complex, and a Mouthdrying complex. This interpretation is supported by the PCA biplot shown in the Supplementary Materials.

4. Discussion

The mechanism(s) responsible for chalkiness are not well understood, despite its importance as an unfavorable sensation in foods. Other terms, like Gritty and Sandy, are often used to describe the sensation of fine particles in food, but they are not entirely synonymous with Chalky. Here, the usage of Chalky and other related terms was compared in a starch beverage model, and we performed a decorrelation analysis [38] to understand how consumers use these terms. Chalky, Powdery, and Residual Mouthfeel were grouped more closely together than Gritty and Sandy. Notably, Mouthdrying was slightly less correlated to Chalky in comparison to Powdery and Residual Mouthcoating, suggesting that Mouthdrying is associated with Chalky but might not convey the same concept. This is commercially relevant, as Mouthdrying is frequently used with Powdery/Chalky to describe the sensations elicited by food products like whey protein, soy protein, prebiotic beverages, and yogurts [2,3]. Conversely, Powdery was highly correlated with Chalky, confirming the previous usage of Chalky and Powdery as interchangeable (or synonymous) terms [17]. Therefore, the similarities in the usage of these terms may imply comparability in the mechanisms that are responsible. Here, we propose that Chalky is a sensation that occurs both during consumption and after consumption because it is related to the residual particles left in the mouth. Still, Chalky may not strictly imply mouthdrying as any residual particles left in the mouth may also vary in terms of how much drying they induce.
Particle size, concentration, and dispersion viscosity are major factors in the perception of small food particles, so we expected these factors to affect chalky sensation as well. This study revealed that particle size and concentration are major factors influencing the chalkiness of beverages containing granular starch. Additionally, xanthan content, our surrogate for viscosity, influenced the effect size of particle size and concentration on Chalky. Our results are comparable with an early study of chalkiness in soy milk [6] in terms of particle concentration, as they found that a higher soy solids concentration increased chalkiness. However, they also reported they were not able to find an effect of viscosity on chalkiness. We speculate that their direct comparison of samples with the same viscosity instead of systematically varying the samples’ viscosity prevented them from identifying the effect of viscosity on chalkiness. Another study looking at the effect of softness and viscosity on gritty/smooth sensations reported that increased viscosity using hydrocolloids increases the smoothness of soft gel particles dispersed in the matrix [10]. When studying the effect of particle size on the tribology of yogurts, however, Laiho et al. [45] could only find a significant increase in grainy sensation with an increase in particle size, but no effect on chalkiness. This may be due to their definition of chalkiness only as an afterfeel (sensation after swallowing), not including sensory perception in the mouth. This suggests that product developers working with insoluble particles could reduce chalkiness by formulating products using a smaller particle size and lower particle concentration.
Our study found a difference in Chalky perception between salivary flow groups, as hypothesized. Specifically, those with a lower salivary flow reported higher Chalky ratings than the those with a higher salivary flow. We speculate that this occurs due to the more rapid removal of starch particles in individuals with a higher flow. Saliva is known to be a lubricant in the mouth, so the quicker replenishment of saliva presumably helps reduce friction in the mouth in those with a higher salivary flow, although we did not directly measure this here. Elsewhere, the friction coefficient of food such as yogurt and chocolate is reportedly reduced by saliva [28]. Separately, saliva can increase the viscosity of liquid foods, which also can lead to texture perception changes. While many studies have failed to observe associations between salivary flow rate and texture perception [46,47,48], this is likely to be highly food-specific. Our data suggest that salivary flow rate may play a greater role in clearing fine particles in a liquid food relative to the null effects seen for larger particles in semi-solid foods. Practically, this suggests that when developing products for older adults or others experiencing oral dryness, testing needs to be performed in specific foods to avoid overgeneralizing.
Some strengths and limitations should be noted. We were able to capture the changes in Chalky ratings between sips and up to 1 min after each consumption, while other studies seldom capture the simulation of the regular consumption of beverages using multiple sips. However, we only included three consecutive sips of the same sample in small aliquots to prevent fatigue, given the large number of samples needed for the factorial design. This choice reduced the number of consecutive sips relative to prior work on the buildup of sensations over time [18,49], precluding direct comparison. Still, this remains a strength, as many past studies on Chalky perception only use a single rating. We did not see any buildup of Chalky ratings here; we cannot completely rule out whether Chalky sensations may still build with longer consumption times, larger sips, and/or an increased number of sips, but our data suggest this is unlikely. Past studies [10,20] have shown the effect of dispersion viscosity on the texture perception of small particles; thus, higher viscosities could be used in aqueous models or semi-solid models in future work on chalkiness.

5. Conclusions

This study documents differences in chalky ratings in beverages with different starch granule sizes, concentrations, and xanthan contents. While no build-up of Chalky ratings was found over the multi-sip test, the particle size and concentration of the starch each significantly affected Chalky ratings, and these interacted with the xanthan content. However, only aqueous beverages were used here as a model, so we cannot speculate about thicker, semi-solid products, like mousse or yogurt. Future studies should use higher-viscosity beverages or semi-solid foods to explore the potential of viscosity to mask these sensations.
We also found evidence of substantial individual differences across participants—those with a low salivary flow rate experienced more Chalky sensations than those with a high salivary flow rate. Moreover, the salivary-flow-rate groups showed an interaction with particle size and concentration, suggesting that particle size and concentration affected the chalkiness ratings in the low-salivary-flow-rate group more than the high-salivary-flow-rate group. More work is needed to understand how the low-salivary-flow-rate group perceives small food particles differently. As chalkiness has been found to be associated with low liking in foods [30] and a low salivary flow rate is associated with a stronger perception of chalkiness in beverages, this might imply that low-salivary-flow groups might have a lower liking of chalky beverages. As having a lower salivary flow is prevalent in the elderly, their perception and liking of chalky medical nutritional beverages may be affected, which eventually can lead to malnutrition [50]. Therefore, work is needed to examine the direct impact of salivary flow rate on the liking of chalky beverages, as this might provide insights to improve their acceptability.

Supplementary Materials

The following supporting information can be downloaded at: https://www.mdpi.com/article/10.3390/foods13121852/s1, Figure S1: Principal component analysis (PCA) bi-plot by the covariance matrix of the group mean ratings for the 8 beverage samples.

Author Contributions

Conceptualization, J.E.H., K.K.M. and G.R.Z.; methodology, J.E.H., K.K.M. and G.R.Z.; software, H.H. and K.K.M.; validation, J.E.H., K.K.M., H.H. and G.R.Z.; formal analysis, H.H. and K.K.M.; investigation, K.K.M.; resources, K.K.M.; data curation, K.K.M.; writing—original draft preparation, K.K.M.; writing—review and editing, J.E.H., K.K.M., H.H. and G.R.Z.; visualization, H.H. and K.K.M.; supervision, J.E.H. and K.K.M.; project administration, J.E.H. and K.K.M.; funding acquisition, J.E.H. All authors have read and agreed to the published version of the manuscript.

Funding

This research was funded by USDA National Institute of Food and Agriculture (NIFA) Federal Appropriations under Projects PEN04708 [JEH], PEN04980 [JEH] and PEN04792 [HH] (accession numbers 1019852, 7006751, and 7002577, respectively), an unrestricted gift from James and Helen Zallie, and discretionary faculty-controlled funds.

Institutional Review Board Statement

This research was approved by the Institutional Review Board of The Pennsylvania State University (protocol: STUDY00022256, approved 19 April 2023). and conforms with the Declaration of Helsinki and all local regulations.

Informed Consent Statement

Informed consent was obtained from all study participants.

Data Availability Statement

The original contributions presented in the study are included in the article/Supplementary Material, further inquiries can be directed to the corresponding author.

Acknowledgments

The authors wish to thank our participants for their time and involvement, as well as the staff of the Sensory Evaluation Center for their help in executing this project.

Conflicts of Interest

Dr. Hayes has received speaker honoraria, consulting fees, and/or travel expenses from numerous organizations, including federal agencies, universities, nonprofit organizations, trade groups, and for-profit corporations, to present data on taste biology and flavor perception, sensory testing methods, and consumer behavior. Dr. Hopfer has received speaker honoraria, consulting fees, and/or travel expenses from numerous organizations, including universities, nonprofit organizations, and for-profit corporations, for presentations on perception, flavor and food chemistry, and consumer behavior. Dr. Ziegler has received speaker honoraria, consulting fees, and/or travel expenses from numerous organizations, including universities, nonprofit organizations, and for-profit corporations, for presentations on food formulation and manufacturing. Dr. Hayes holds also equity in Redolynt, LLC, which he co-founded in 2021; this financial interest has been reviewed and actively managed by the appropriate Conflict of Interest Committee at Penn State. The Sensory Evaluation Center at Penn State routinely conducts product tests for industrial clients to facilitate experiential learning for undergraduate and graduate students. Dr. Hayes is the Director and Dr. Hopfer is the Associate Director of this facility. None of these entities have had any role in the work presented here, including the study design or interpretation, or the decision to publish these data. The remaining authors have indicated they have no financial relationships or other potential conflicts of interest to disclose. All findings and conclusions in this publication belong solely to the author(s) and should not be construed to represent any official U.S. Government determination, position, or policy.

References

  1. Guinard, J.-X.; Mazzucchelli, R. The sensory perception of texture and mouthfeel. Trends Food Sci. Technol. 1996, 7, 213–219. [Google Scholar] [CrossRef]
  2. Allgeyer, L.C.; Miller, M.J.; Lee, S.-Y. Sensory and microbiological quality of yogurt drinks with prebiotics and probiotics. J. Dairy Sci. 2010, 93, 4471–4479. [Google Scholar] [CrossRef] [PubMed]
  3. Bull, S.P.; Hong, Y.; Khutoryanskiy, V.V.; Parker, J.K.; Faka, M.; Methven, L. Whey protein mouth drying influenced by thermal denaturation. Food Qual. Prefer. 2017, 56, 233–240. [Google Scholar] [CrossRef]
  4. Chakraborty, P.; Witt, T.; Harris, D.; Ashton, J.; Stokes, J.R.; Smyth, H.E. Texture and mouthfeel perceptions of a model beverage system containing soluble and insoluble oat bran fibres. Food Res. Int. 2019, 120, 62–72. [Google Scholar] [CrossRef] [PubMed]
  5. Drake, M.A.; Chen, X.Q.; Tamarapu, S.; Leenanon, B. Soy Protein Fortification Affects Sensory, Chemical, and Microbiological Properties of Dairy Yogurts. J. Food Sci. 2000, 65, 1244–1247. [Google Scholar] [CrossRef]
  6. Kuntz, D.A.; Nelson, A.I.; Steinberg, M.P.; Wei, L.S. Control of Chalkiness in Soymilk. J. Food Sci. 1978, 43, 1279–1283. [Google Scholar] [CrossRef]
  7. Rubico, S.M.; Resurreccion, A.V.A.; Frank, J.F.; Beuchat, L.R. Suspension Stability, Texture, and Color of High Temperature Treated Peanut Beverage. J. Food Sci. 1987, 52, 1676–1679. [Google Scholar] [CrossRef]
  8. Brückner-Gühmann, M.; Banovic, M.; Drusch, S. Towards an increased plant protein intake: Rheological properties, sensory perception and consumer acceptability of lactic acid fermented, oat-based gels. Food Hydrocoll. 2019, 96, 201–208. [Google Scholar] [CrossRef]
  9. Liu, J.; Bech, A.C.; Stolzenbach Waehrens, S.; Bredie, W.L.P. Perception and liking of yogurts with different degrees of granularity in relation to ethnicity, preferred oral processing and lingual tactile acuity. Food Qual. Prefer. 2021, 90, 104158. [Google Scholar] [CrossRef]
  10. Shewan, H.M.; Stokes, J.R.; Smyth, H.E. Influence of particle modulus (softness) and matrix rheology on the sensory experience of ‘grittiness’ and ‘smoothness’. Food Hydrocoll. 2020, 103, 105662. [Google Scholar] [CrossRef]
  11. Singh, G. Sensory and Consumer Evaluation of Lucuma Powder as an Ingredient for Ice Cream in the United States. Master’s Thesis, Kansas State University, Manhattan, KS, USA, 2021. Available online: https://hdl.handle.net/2097/41879 (accessed on 15 January 2024).
  12. Alting, A.C.; van de Velde, F.; Kanning, M.W.; Burgering, M.; Mulleners, L.; Sein, A.; Buwalda, P. Improved creaminess of low-fat yoghurt: The impact of amylomaltase-treated starch domains. Food Hydrocoll. 2009, 23, 980–987. [Google Scholar] [CrossRef]
  13. Chojnicka-Paszun, A.; Doussinault, S.; de Jongh, H.H.J. Sensorial analysis of polysaccharide–gelled protein particle dispersions in relation to lubrication and viscosity properties. Food Res. Int. 2014, 56, 199–210. [Google Scholar] [CrossRef]
  14. Ciron, C.I.E.; Gee, V.L.; Kelly, A.L.; Auty, M.A. Effect of microfluidization of heat-treated milk on rheology and sensory properties of reduced fat yoghurt. Food Hydrocoll. 2011, 25, 1470–1476. [Google Scholar] [CrossRef]
  15. Santagiuliana, M.; Broers, L.; Marigómez, I.S.; Stieger, M.; Piqueras-Fiszman, B.; Scholten, E. Strategies to compensate for undesired gritty sensations in foods. Food Qual. Prefer. 2020, 81, 103842. [Google Scholar] [CrossRef]
  16. Leksrisompong, P.; Whitson, M.; Truong, V.; Drake, M. Sensory Attributes and Consumer Acceptance of Sweet Potato Cultivars with Varying Flesh Colors. J. Sens. Stud. 2012, 27, 59–69. [Google Scholar] [CrossRef]
  17. van der Stelt, A.J.; Mehring, P.; Corbier, C.; van Eijnatten, E.J.M.; Withers, C. A “mouthfeel wheel” terminology for communicating the mouthfeel attributes of medical nutrition products (MNP). Food Qual. Prefer. 2020, 80, 103822. [Google Scholar] [CrossRef]
  18. Withers, C.A.; Lewis, M.J.; Gosney, M.A.; Methven, L. Potential sources of mouth drying in beverages fortified with dairy proteins: A comparison of casein- and whey-rich ingredients. J. Dairy Sci. 2014, 97, 1233–1247. [Google Scholar] [CrossRef] [PubMed]
  19. Tyle, P. Effect of size, shape and hardness of particles in suspension on oral texture and palatability. Acta Psychol. 1993, 84, 111–118. [Google Scholar] [CrossRef]
  20. Imai, E.; Hatae, K.; Shimada, A. Oral Perception of Grittiness: Effect of Particle Size and Concentration of the Dispersed Particles and the Dispersion Medium. J. Texture Stud. 1995, 26, 561–576. [Google Scholar] [CrossRef]
  21. Imai, E.; Saito, K.; Hatakeyama, M.; Hatae, K.; Shimada, A. Effect of Physical Properties of Food Particles on the Degree of Graininess Perceived in the Mouth. J. Texture Stud. 1999, 30, 59–88. [Google Scholar] [CrossRef]
  22. Mosca, A.C.; Chen, J. Food-saliva interactions: Mechanisms and implications. Trends Food Sci. Technol. 2017, 66, 125–134. [Google Scholar] [CrossRef]
  23. Guinard, J.-X.; Zoumas-Morse, C.; Walchak, C. Relation Between Parotid Saliva Flow and Composition and the Perception of Gustatory and Trigeminal Stimuli in Foods. Physiol. Behav. 1997, 63, 109–118. [Google Scholar] [CrossRef] [PubMed]
  24. Engelen, L.; de Wijk, R.A.; Prinz, J.F.; Janssen, A.M.; van der Bilt, A.; Weenen, H.; Bosman, F. A comparison of the effects of added saliva, α-amylase and water on texture perception in semisolids. Physiol. Behav. 2003, 78, 805–811. [Google Scholar] [CrossRef] [PubMed]
  25. Engelen, L.; van den Keybus, P.A.M.; de Wijk, R.A.; Veerman, E.C.I.; Amerongen, A.V.N.; Bosman, F.; Prinz, J.F.; van der Bilt, A. The effect of saliva composition on texture perception of semi-solids. Arch. Oral Biol. 2007, 52, 518–525. [Google Scholar] [CrossRef] [PubMed]
  26. Fleming, E.E.; Ziegler, G.R.; Hayes, J.E. Salivary protein levels as a predictor of perceived astringency in model systems and solid foods. Physiol. Behav. 2016, 163, 56–63. [Google Scholar] [CrossRef] [PubMed]
  27. Horne, J.; Hayes, J.; Lawless, H.T. Turbidity as a Measure of Salivary Protein Reactions with Astringent Substances. Chem. Senses 2002, 27, 653–659. [Google Scholar] [CrossRef] [PubMed]
  28. Khramova, D.S.; Popov, S.V. A secret of salivary secretions: Multimodal effect of saliva in sensory perception of food. Eur. J. Oral Sci. 2022, 130, e12846. [Google Scholar] [CrossRef]
  29. Muñoz-González, C.; Feron, G.; Canon, F. Main effects of human saliva on flavour perception and the potential contribution to food consumption. Proc. Nutr. Soc. 2018, 77, 423–431. [Google Scholar] [CrossRef] [PubMed]
  30. Ma, K.K.; Madhavan, A.; Etter, N.M.; Hopfer, H.; Hayes, J.E. Texture term usage and hedonic ratings in two age-diverse cohorts of Americans. J. Texture Stud. 2023, 54, 860–871. [Google Scholar] [CrossRef]
  31. Methven, L.; Rahelu, K.; Economou, N.; Kinneavy, L.; Ladbrooke-Davis, L.; Kennedy, O.B.; Mottram, D.S.; Gosney, M.A. The effect of consumption volume on profile and liking of oral nutritional supplements of varied sweetness: Sequential profiling and boredom tests. Food Qual. Prefer. 2010, 21, 948–955. [Google Scholar] [CrossRef]
  32. Bots, C.P.; Brand, H.S.; Veerman, E.C.I.; van Amerongen, B.M.; Amerongen, A.V.N. Preferences and saliva stimulation of eight different chewing gums. Int. Dent. J. 2004, 54, 143–148. [Google Scholar] [CrossRef]
  33. Hayes, J.E.; Allen, A.L.; Bennett, S.M. Direct comparison of the generalized visual analog scale (gVAS) and general labeled magnitude scale (gLMS). Food Qual. Prefer. 2013, 28, 36–44. [Google Scholar] [CrossRef]
  34. Bartoshuk, L.M.; Duffy, V.B.; Green, B.G.; Hoffman, H.J.; Ko, C.-W.; Lucchina, L.A.; Marks, L.E.; Snyder, D.J.; Weiffenbach, J.M. Valid across-group comparisons with labeled scales: The gLMS versus magnitude matching. Physiol. Behav. 2004, 82, 109–114. [Google Scholar] [CrossRef]
  35. Bates, D.; Maechler, M.; Bolker, B.; Walker, S. Fitting Linear Mixed-Effects Models Using {lme4}. J. Stat. Softw. 2015, 67, 1–48. [Google Scholar] [CrossRef]
  36. Lenth, R.V. emmeans: Estimated Marginal Means, aka Least-Squares Means, R Package Version 1.8.4-1; CRAN.R-project.org: Vienna, Austria, 2023. Available online: https://CRAN.R-project.org/package=emmeans(accessed on 15 January 2024).
  37. Ben-Shachar, M.S.; Lüdecke, D.; Makowski, D. Effectsize: Estimation of Effect Size Indices and Standardized Parameters. J. Open Source Softw. 2020, 5, 2815. [Google Scholar] [CrossRef]
  38. Lawless, H.T.; Corrigan, C.J. Semantics of Astringency. In Olfaction and Taste XI; Kurihara, K., Suzuki, N., Ogawa, H., Eds.; Springer: Tokyo, Japan, 1994; pp. 288–292. [Google Scholar] [CrossRef]
  39. Husson, F.; Le, S.; Cadoret, M. SensoMineR: Sensory Data Analysis, R Package Version 1.26; CRAN.R-project.org: Vienna, Austria, 2020. Available online: https://CRAN.R-project.org/package=SensoMineR(accessed on 15 January 2024).
  40. Lemon, J. Plotrix: A package in the red light district of R. R-News 2006, 6, 8–12. [Google Scholar]
  41. Slowikowski, K. ggrepel: Automatically Position Non-Overlapping Text Labels with “ggplot2”, R Package Version 0.9.3; CRAN.R-project.org: Vienna, Austria, 2023.
  42. Wickham, H. ggplot2: Elegant Graphics for Data Analysis; Springer: New York, NY, USA, 2016; Available online: https://ggplot2.tidyverse.org (accessed on 15 January 2024).
  43. Nolden, A.A.; Hayes, J.E. Perceptual Qualities of Ethanol Depend on Concentration, and Variation in These Percepts Associates with Drinking Frequency. Chemosens. Percept. 2015, 8, 149–157. [Google Scholar] [CrossRef] [PubMed]
  44. Gacula, M.; Rutenbeck, S. Sample size in consumer test and descriptive analysis. J. Sens. Stud. 2006, 21, 129–145. [Google Scholar] [CrossRef]
  45. Laiho, S.; Williams, R.P.W.; Poelman, A.; Appelqvist, I.; Logan, A. Effect of whey protein phase volume on the tribology, rheology and sensory properties of fat-free stirred yoghurts. Food Hydrocoll. 2017, 67, 166–177. [Google Scholar] [CrossRef]
  46. Chaffee, O.; Laura Montero, M.; Keast, R.; Ross, C.F. Oral acuity, particle size sensitivity, and food texture preferences in an older adult population. Food Qual. Prefer. 2023, 112, 105031. [Google Scholar] [CrossRef]
  47. Engelen, L.; de Wijk, R.A.; Prinz, J.F.; Janssen, A.M.; Weenen, H.; Bosman, F. The effect of oral and product temperature on the perception of flavor and texture attributes of semi-solids. Appetite 2003, 41, 273–281. [Google Scholar] [CrossRef] [PubMed]
  48. Olarte Mantilla, S.M.; Shewan, H.M.; Shingleton, R.; Hort, J.; Stokes, J.R.; Smyth, H.E. Oral physiology, sensory acuity, product experience and personality traits impact consumers’ ability to detect particles in yoghurt. Food Qual. Prefer. 2022, 96, 104391. [Google Scholar] [CrossRef]
  49. Withers, C.; Barnagaud, C.; Mehring, P.; Ferris, S.; Thomson, D.M.H. Adapting and enhancing sequential profiling to understand the effects of successive ingestion, using the sensory characteristics of high intensity sweeteners as a case study. Food Qual. Prefer. 2016, 47, 139–147. [Google Scholar] [CrossRef]
  50. Affoo, R.H.; Foley, N.; Garrick, R.; Siqueira, W.L.; Martin, R.E. Meta-Analysis of Salivary Flow Rates in Young and Older Adults. J. Am. Geriatr. Soc. 2015, 63, 2142–2151. [Google Scholar] [CrossRef] [PubMed]
Figure 1. Salivary flow rate of participants in the high- and low-salivary-flow-rate groups. Dotted lines are means of each group.
Foods 13 01852 g001
Figure 2. Estimated marginal means of Chalky ratings (y axis) across all participants, showing how the effect of particle size differed with xanthan content and concentration. The x axis shows each sip (1 to 3) and the corresponding time for rating the sensory perceptions (0, 30, and 60 s after each sip).
Foods 13 01852 g002
Figure 3. Estimated marginal means of Chalky ratings (y axis) across all participants, showing how the effect of concentration differed with xanthan content and particle size. The x axis shows each sip (1 to 3) and the corresponding time for rating the sensory perceptions (0, 30, and 60 s after each sip).
Foods 13 01852 g003
Figure 4. Estimated marginal means of Chalky ratings, split into high- (orange diamonds) and low- (green squares) salivary-flow groups as a function of large (dashed lines) and small (dotted lines) particle sizes. The x axis shows each sip (1 to 3) and the corresponding time for rating the sensory perceptions (0, 30, and 60 s after each sip).
Foods 13 01852 g004
Figure 5. Estimated marginal means of Chalky ratings, split into high- (orange diamonds) and low- (green squares) salivary-flow groups as a function of high (solid lines) and low (dashed dotted lines) particle sizes. The x axis shows each sip (1 to 3) and the corresponding time for rating the sensory perceptions (0, 30, and 60 s after each sip).
Foods 13 01852 g005
Figure 6. Estimated marginal means of Chalky ratings over time for eight samples with different levels of particle size, concentration, and xanthan content across all participants (i.e., collapsed across the high- and low-salivary-flow-rate groups). Labels on the x axis are numbered for each sip (one sip to three sips) and the corresponding time of the rating for that sip (0, 30, 60 s after consumption). Both particle concentration and size had substantial effects on Chalky ratings.
Foods 13 01852 g006
Table 1. Sample content, including starch type, concentration, xanthan gum, aspartame, vanillin, and dispersion viscosity, for the eight starch beverage samples.
Type of StarchStarch Concentration (w/v%)Xanthan Gum (w/v%)Aspartame (w/v%)Vanillin
(w/v%)
Dispersion Viscosity (Pa.s at 1/s)
Pea100.0750.01240.10.07 ± 0.01
Potato100.0750.01240.10.08 ± 0.00
Pea200.0750.01240.10.08 ± 0.00
Potato200.0750.01240.10.11 ± 0.01
Pea100.150.01240.10.41 ± 0.04
Potato100.150.01240.10.44 ± 0.02
Pea200.150.01240.10.45 ± 0.04
Potato200.150.01240.10.55 ± 0.02
Table 2. Participant characteristics include gender, age, and salivary flow rate groups.
CharacteristicsMean ± SD
Gender (32 men, 49 women)
Age (years, n = 82)41.7 ± 14.1
Saliva group
 High salivary flow (n = 41, g per min)2.4 ± 0.7
 Low salivary flow (n = 41, g per min)1.1 ± 0.3
Table 3. Correlation matrix (r, df = 6) of sensory perceptions on fine particles using the mean perception intensity of each sample.
ChalkyPowderySandyGrittyMouthdrying
Powdery0.99
Residual Mouthcoating0.991.000.930.930.93
Mouthdrying0.930.910.860.83
Gritty0.900.940.99
Sandy0.900.94
Disclaimer/Publisher’s Note: The statements, opinions and data contained in all publications are solely those of the individual author(s) and contributor(s) and not of MDPI and/or the editor(s). MDPI and/or the editor(s) disclaim responsibility for any injury to people or property resulting from any ideas, methods, instructions or products referred to in the content.

