
Dietary Energy and Protein Levels Influence the Mutton Quality and Metabolomic Profile of the Yunshang Black Goat
 , ,
, ,
Abstract
:1. Introduction
2. Materials and Methods
2.1. Experimental Site, Research Design, Animal Management, and Sample Collection
2.2. Meat Quality
2.3. Gas Chromatography–Mass Spectrometry (GC-MS) Analysis
2.4. Liquid Chromatography–Tandem Mass Spectrometry (LC-MS) Analysis
2.5. Bioinformatics Analysis (Metabolite Profiling)
2.6. Statistical Analysis (Meat Quality)
3. Results
3.1. Meat Quality Characteristics
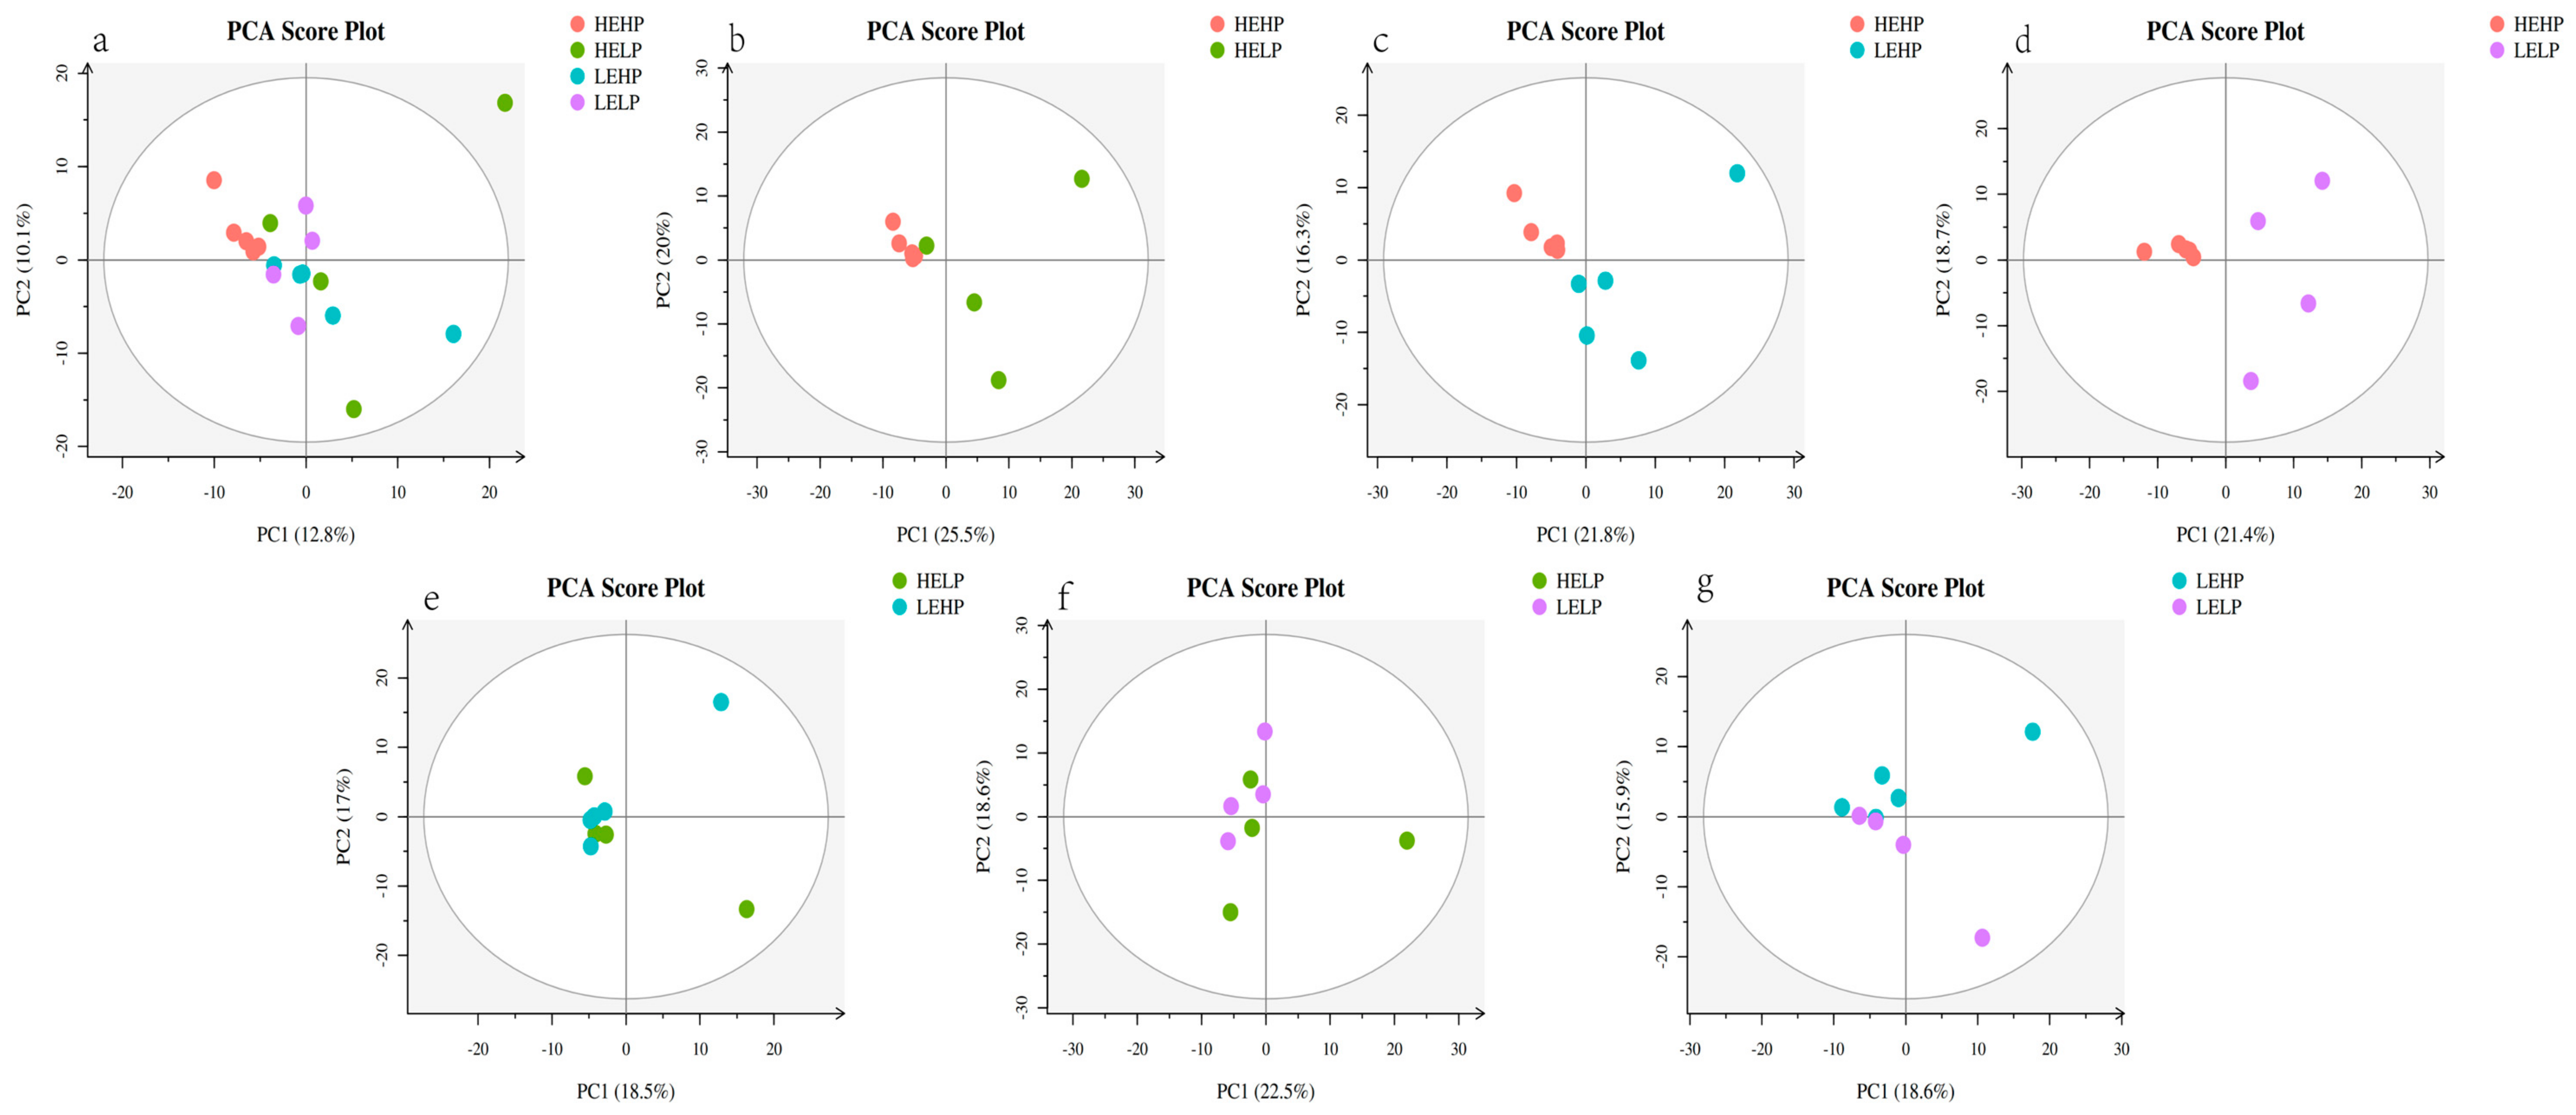
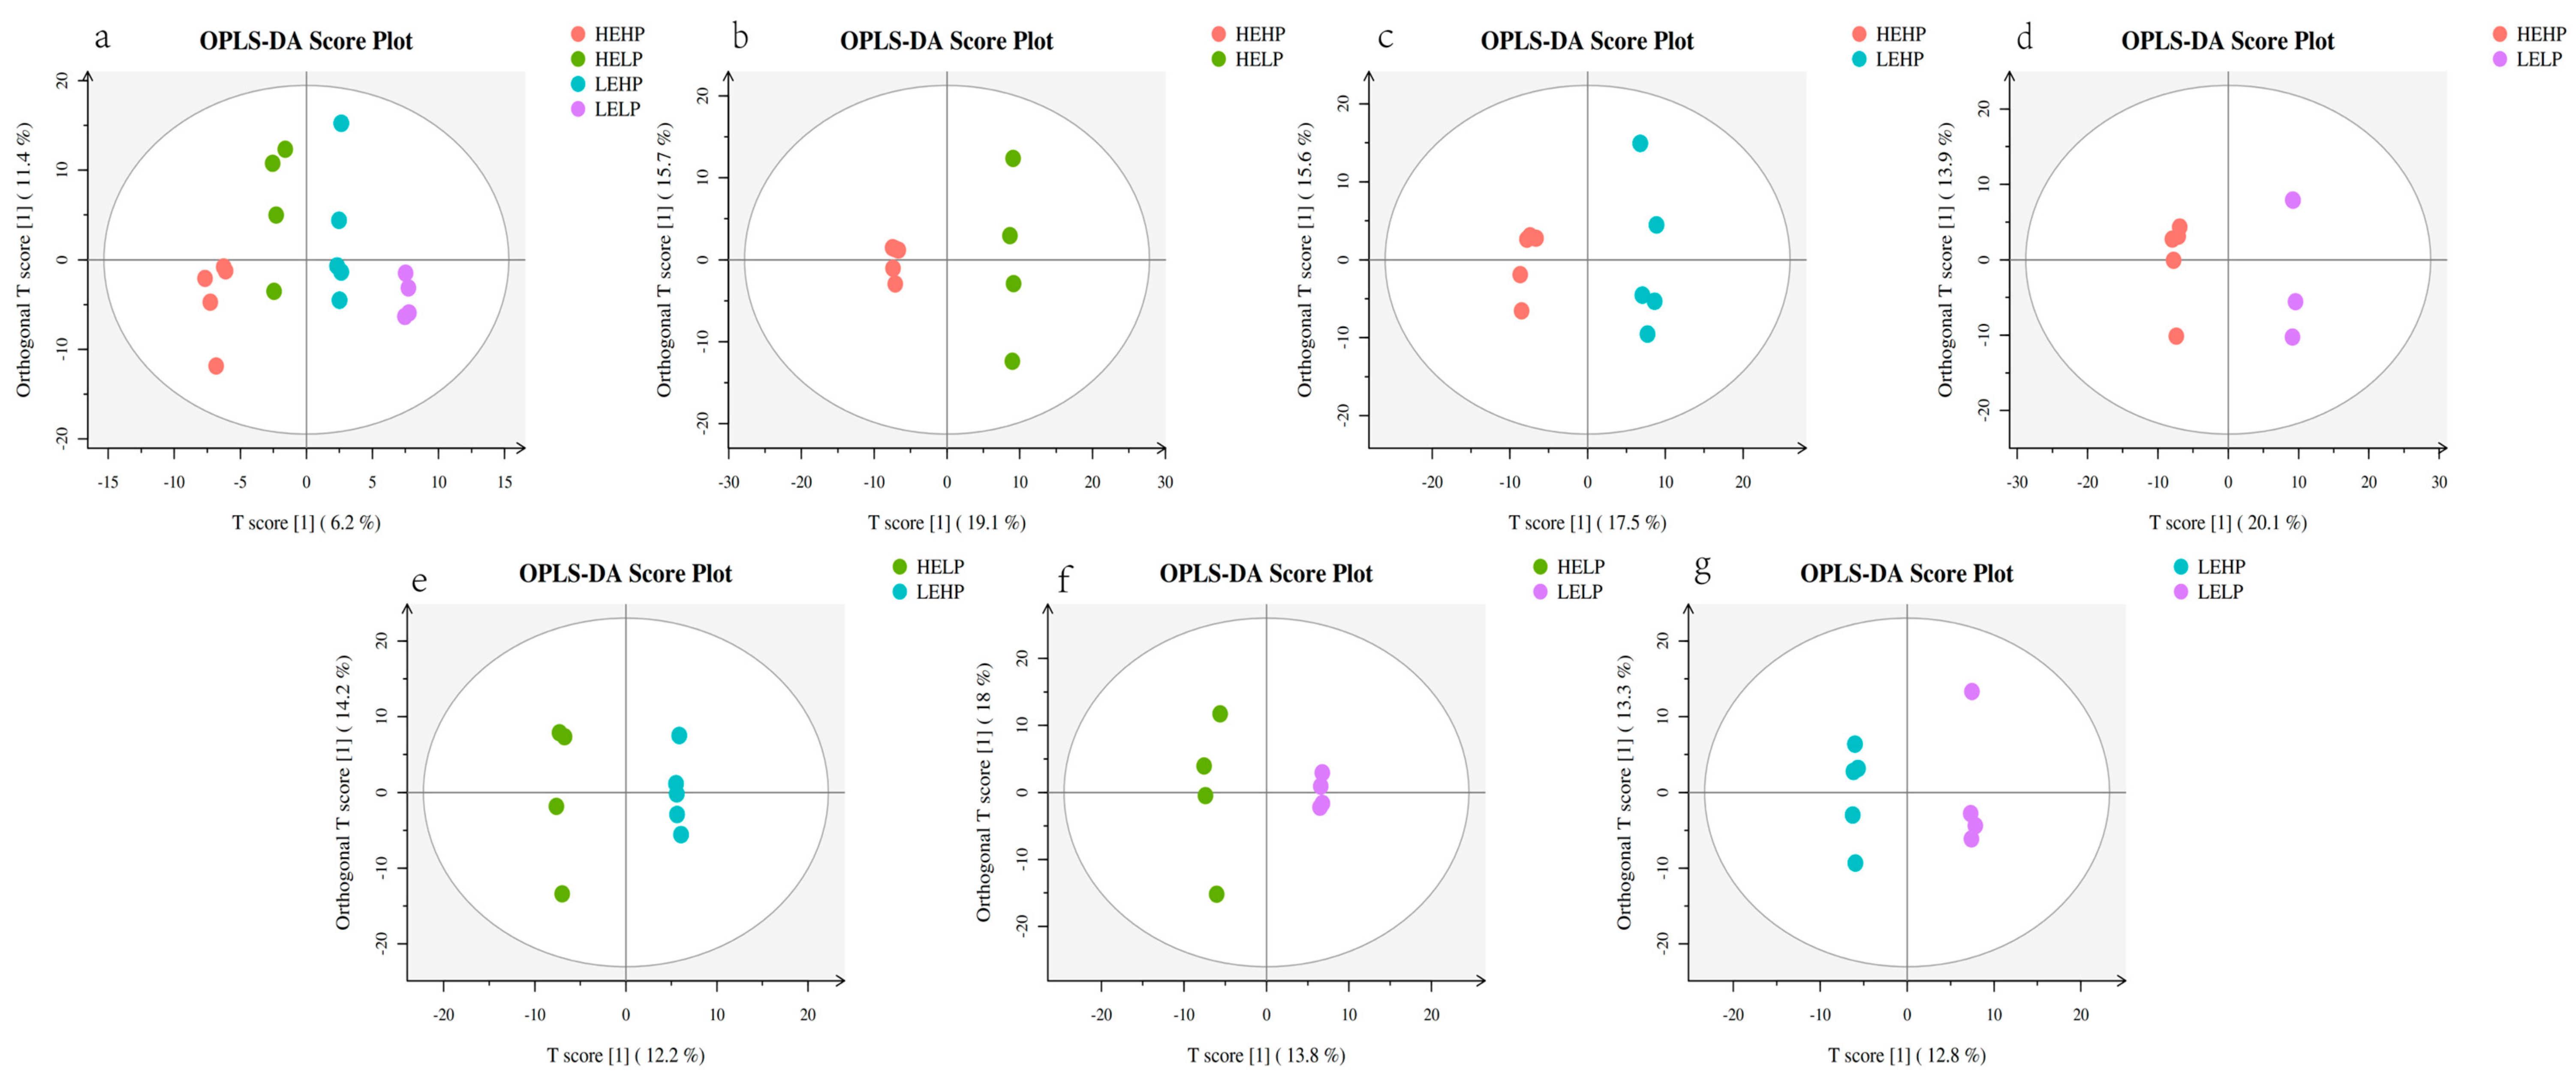
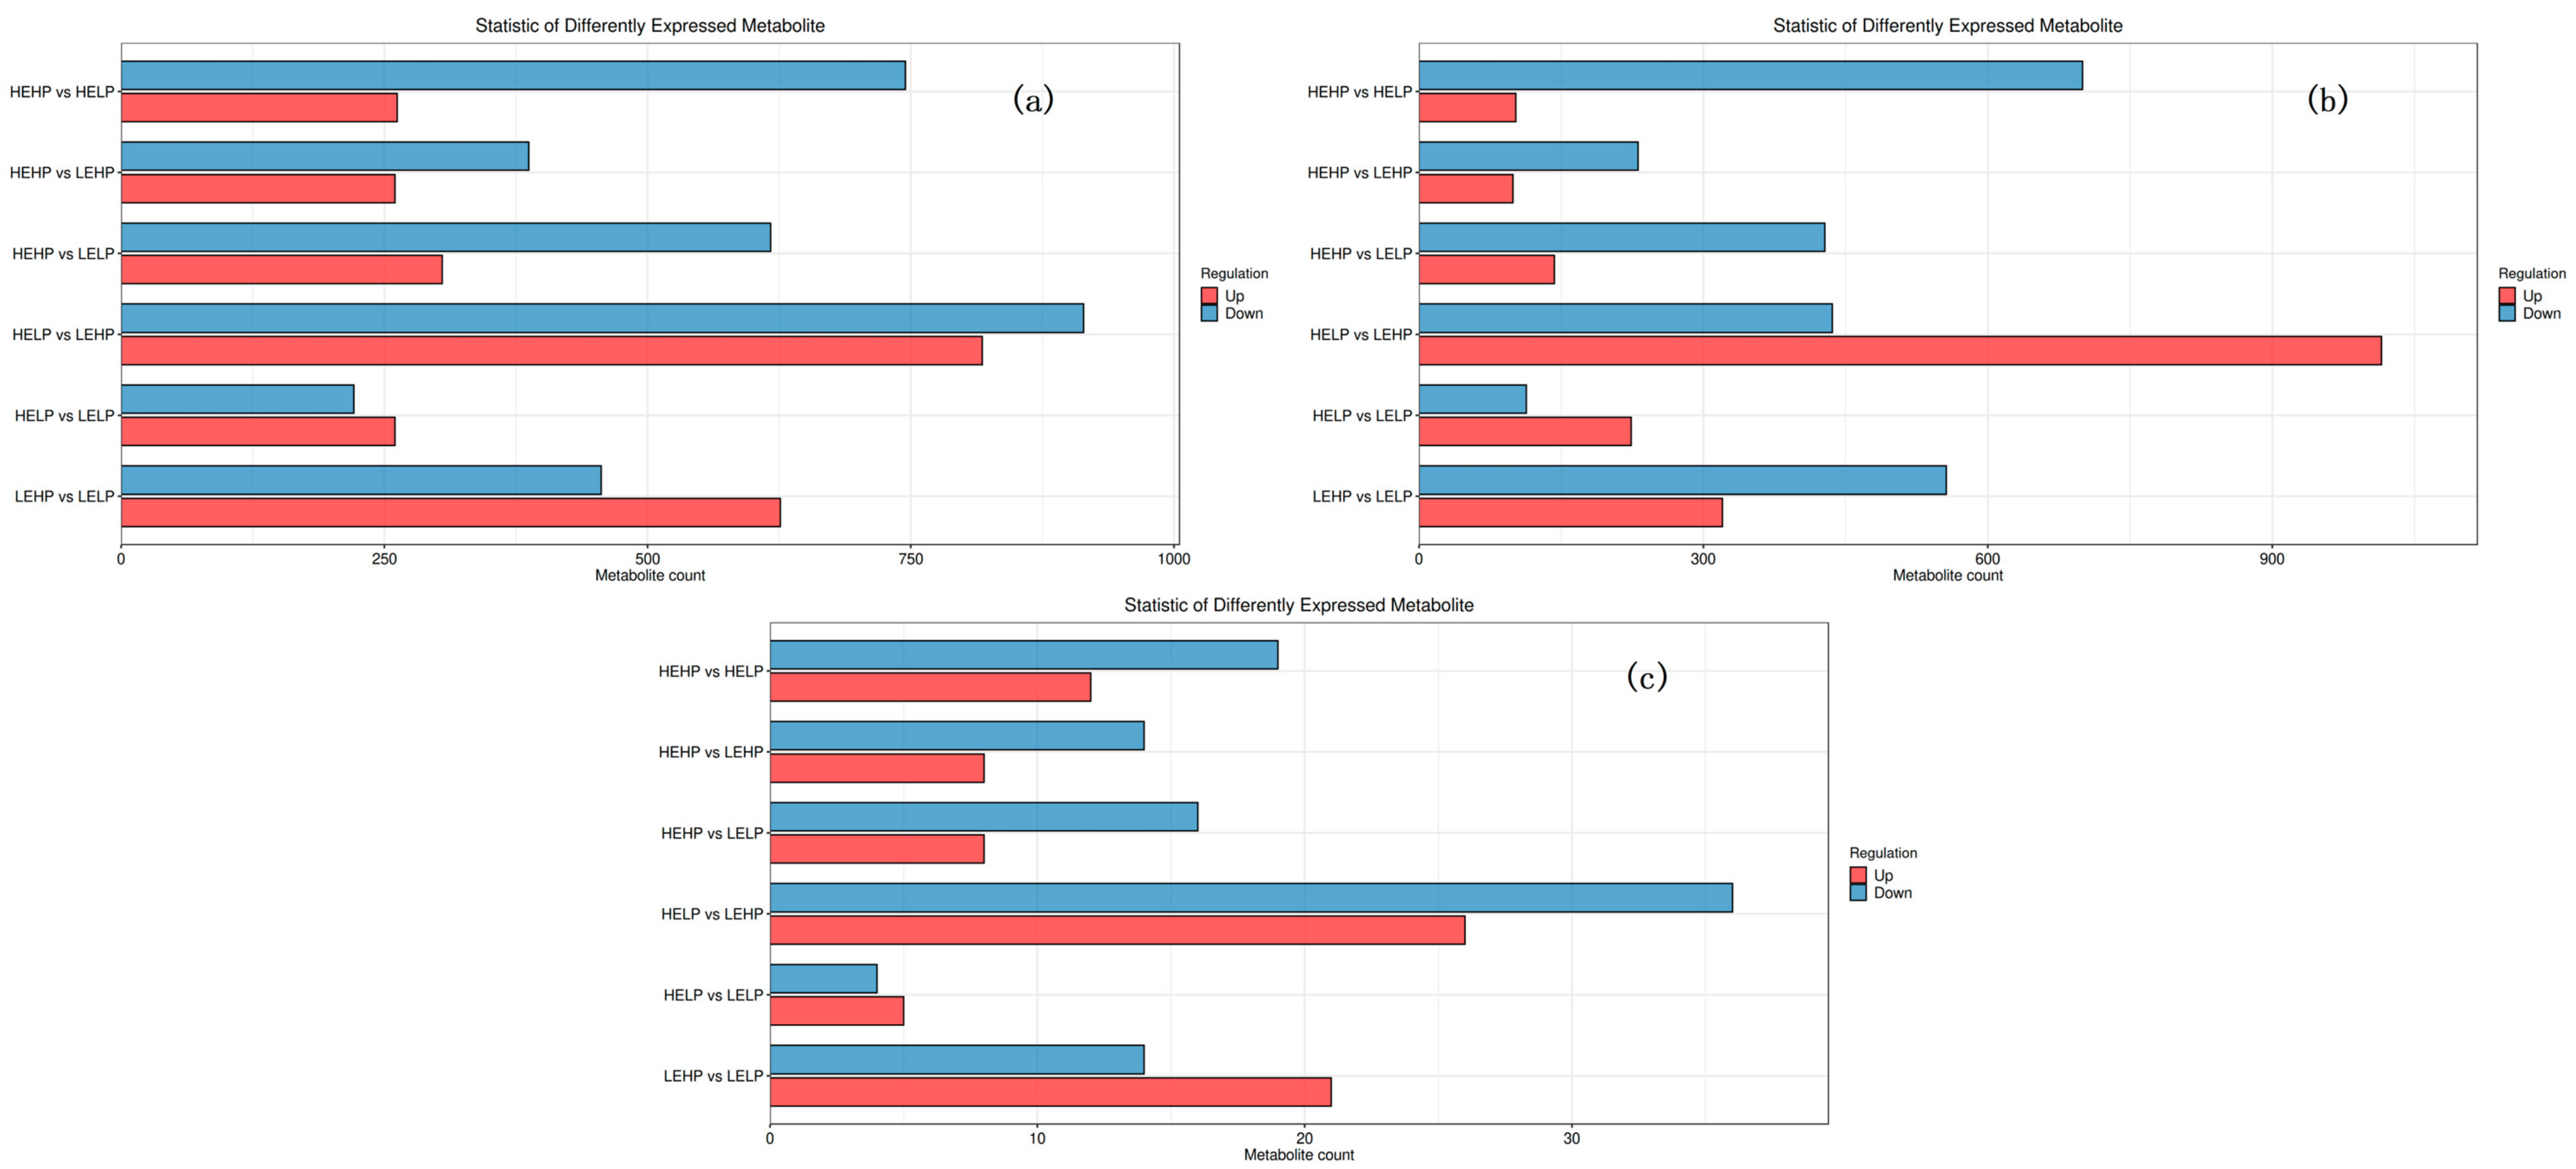
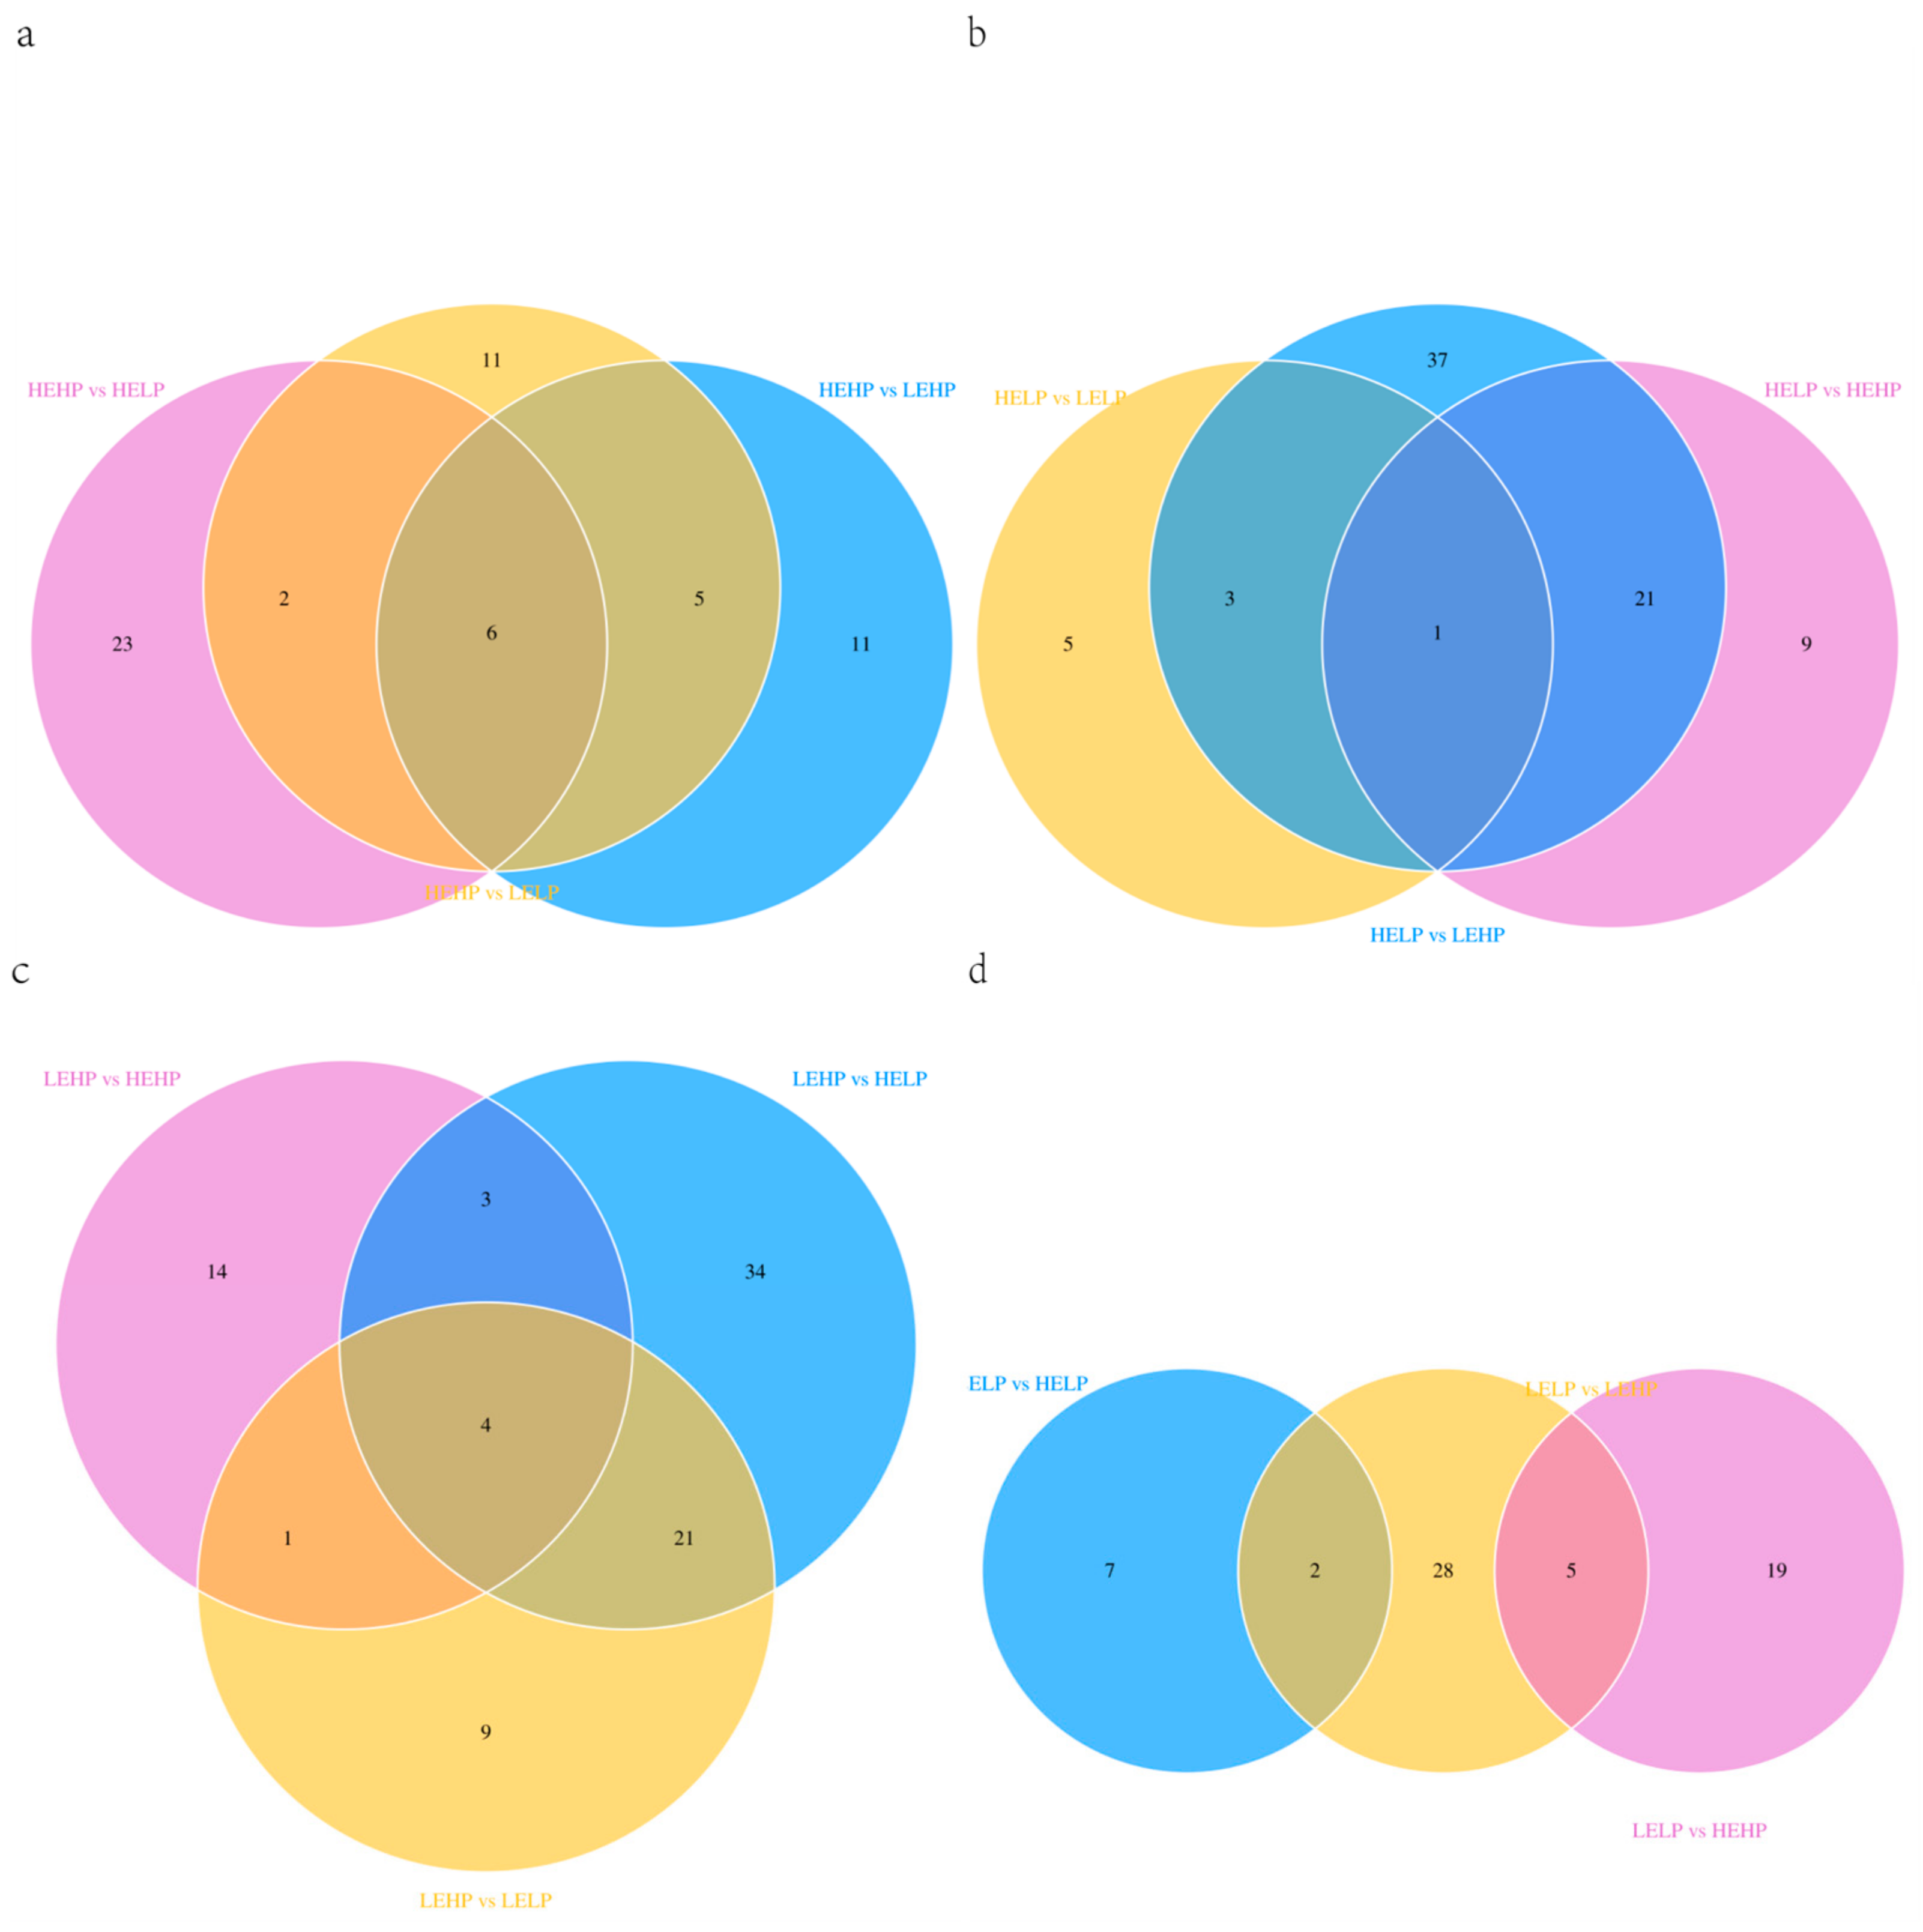
3.2. Analysis of Volatile Flavor Substances of Meat by GC-MS
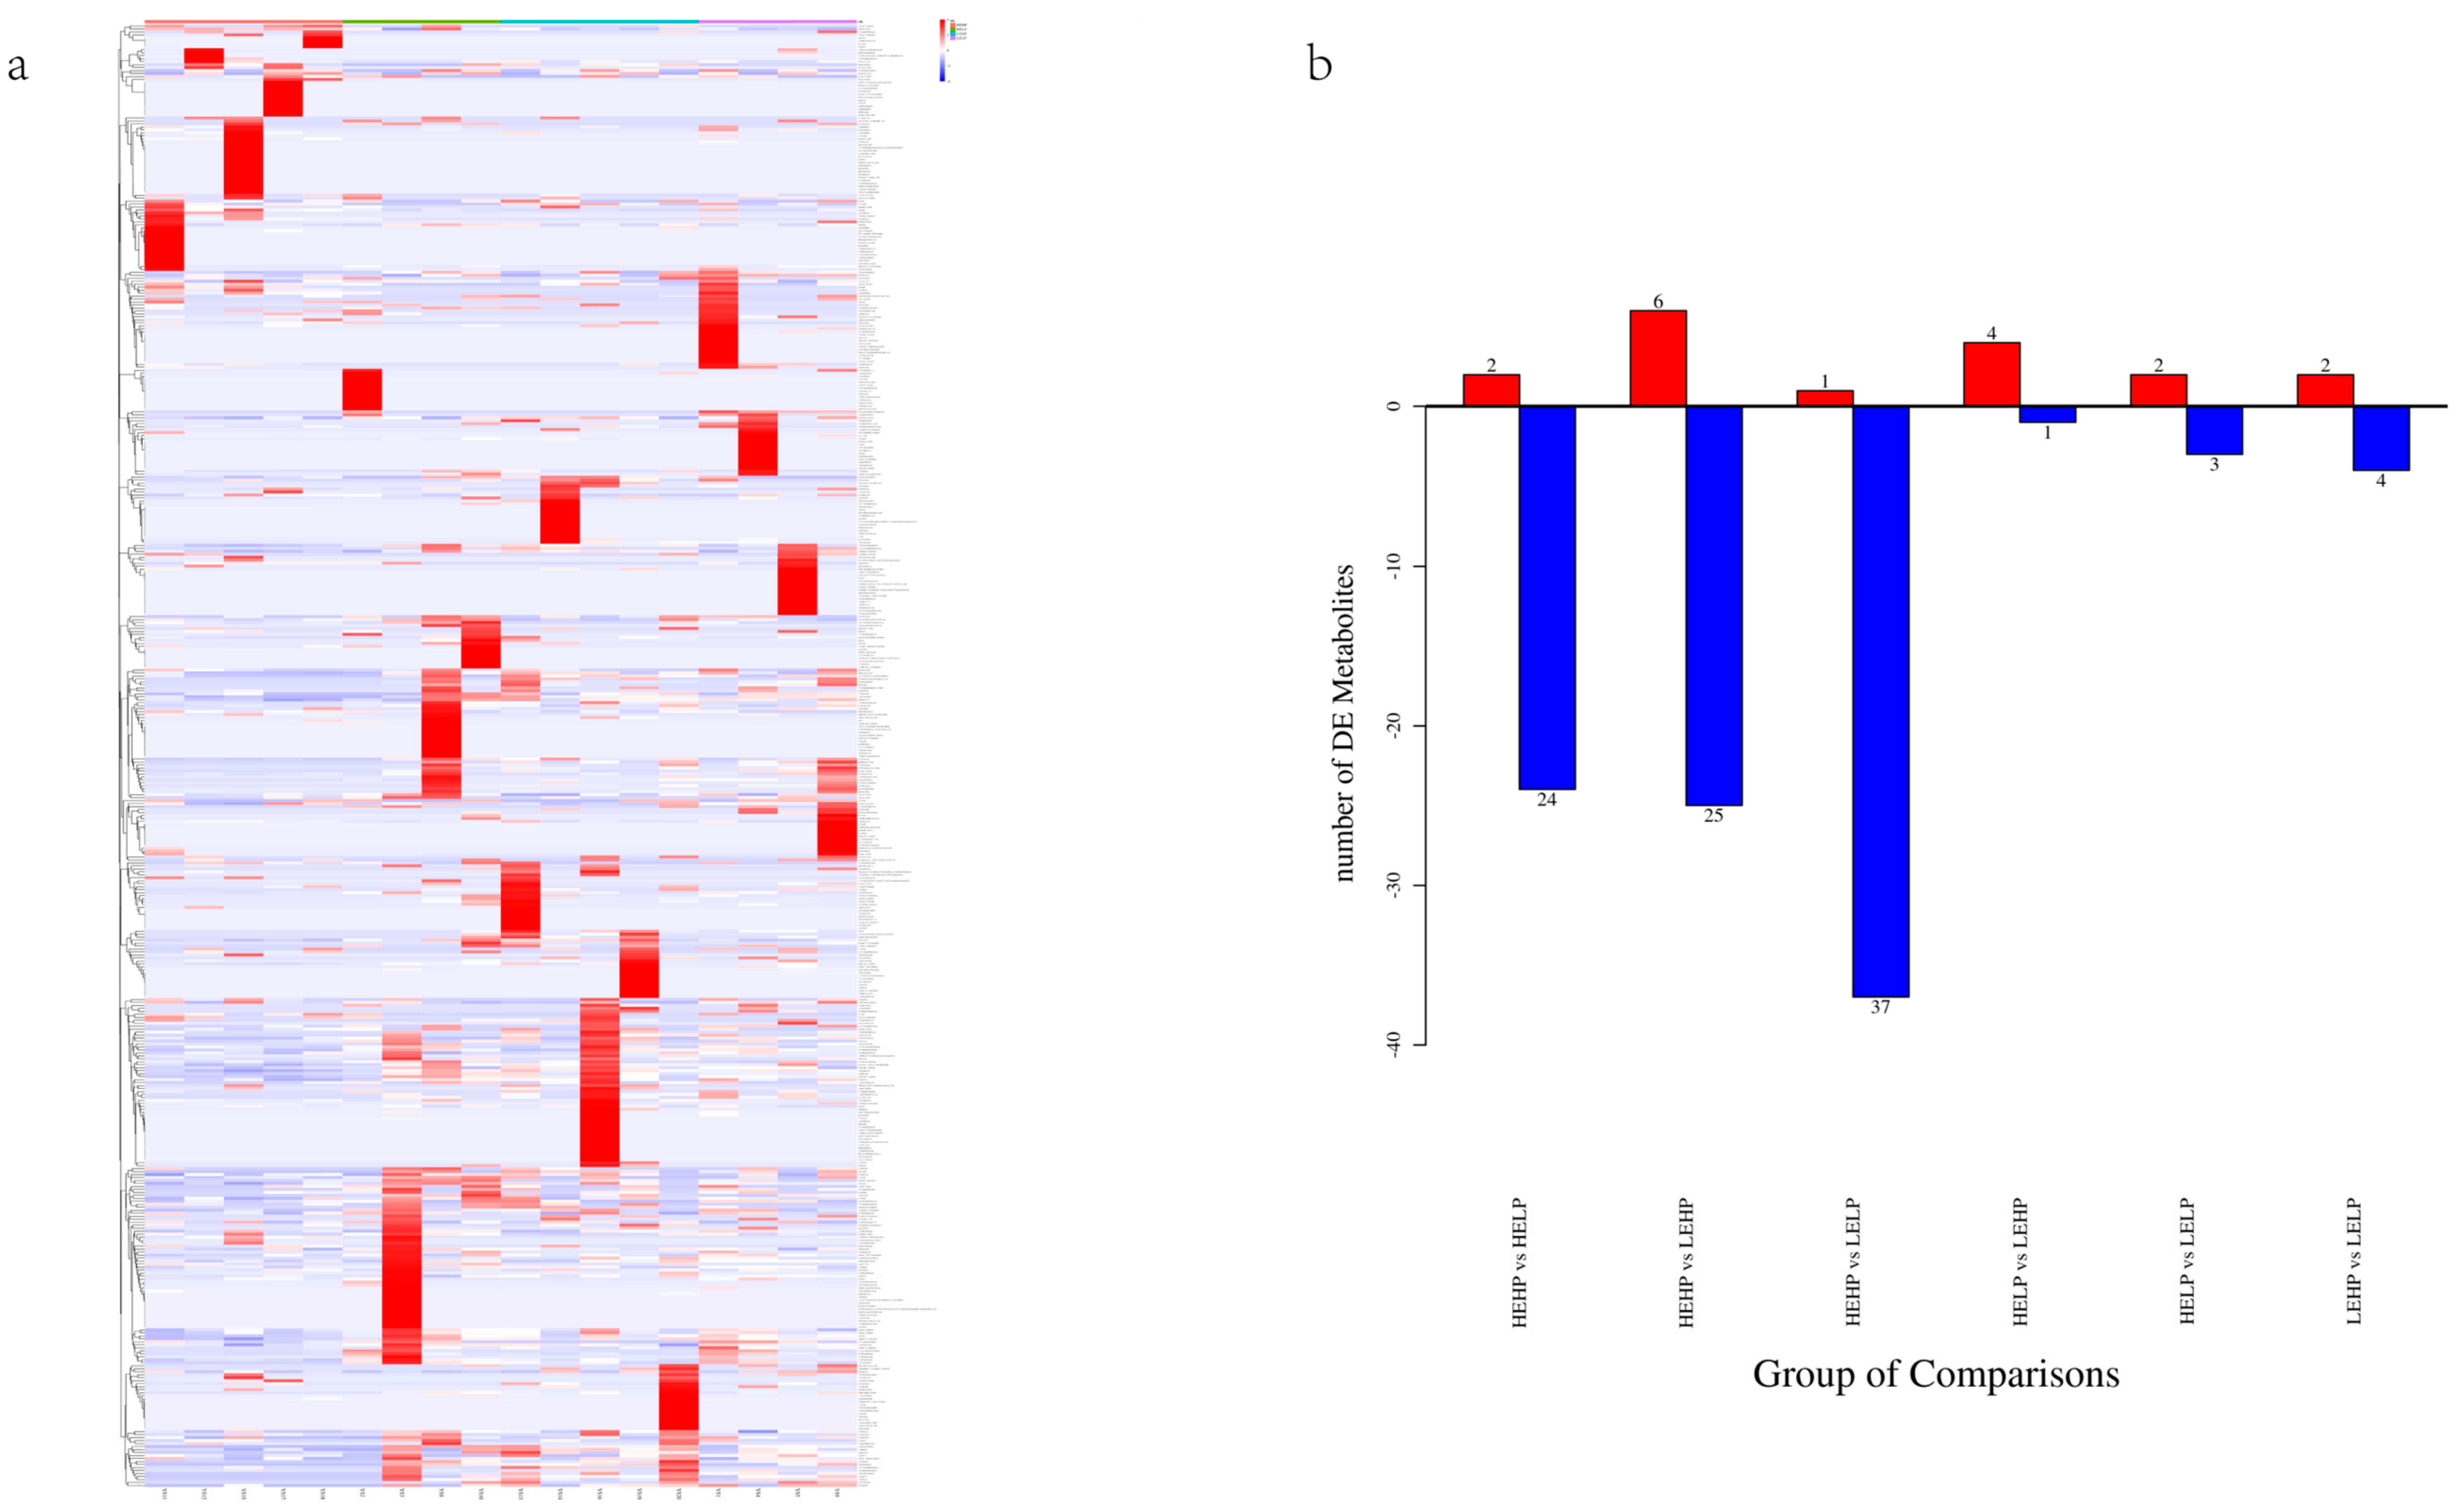
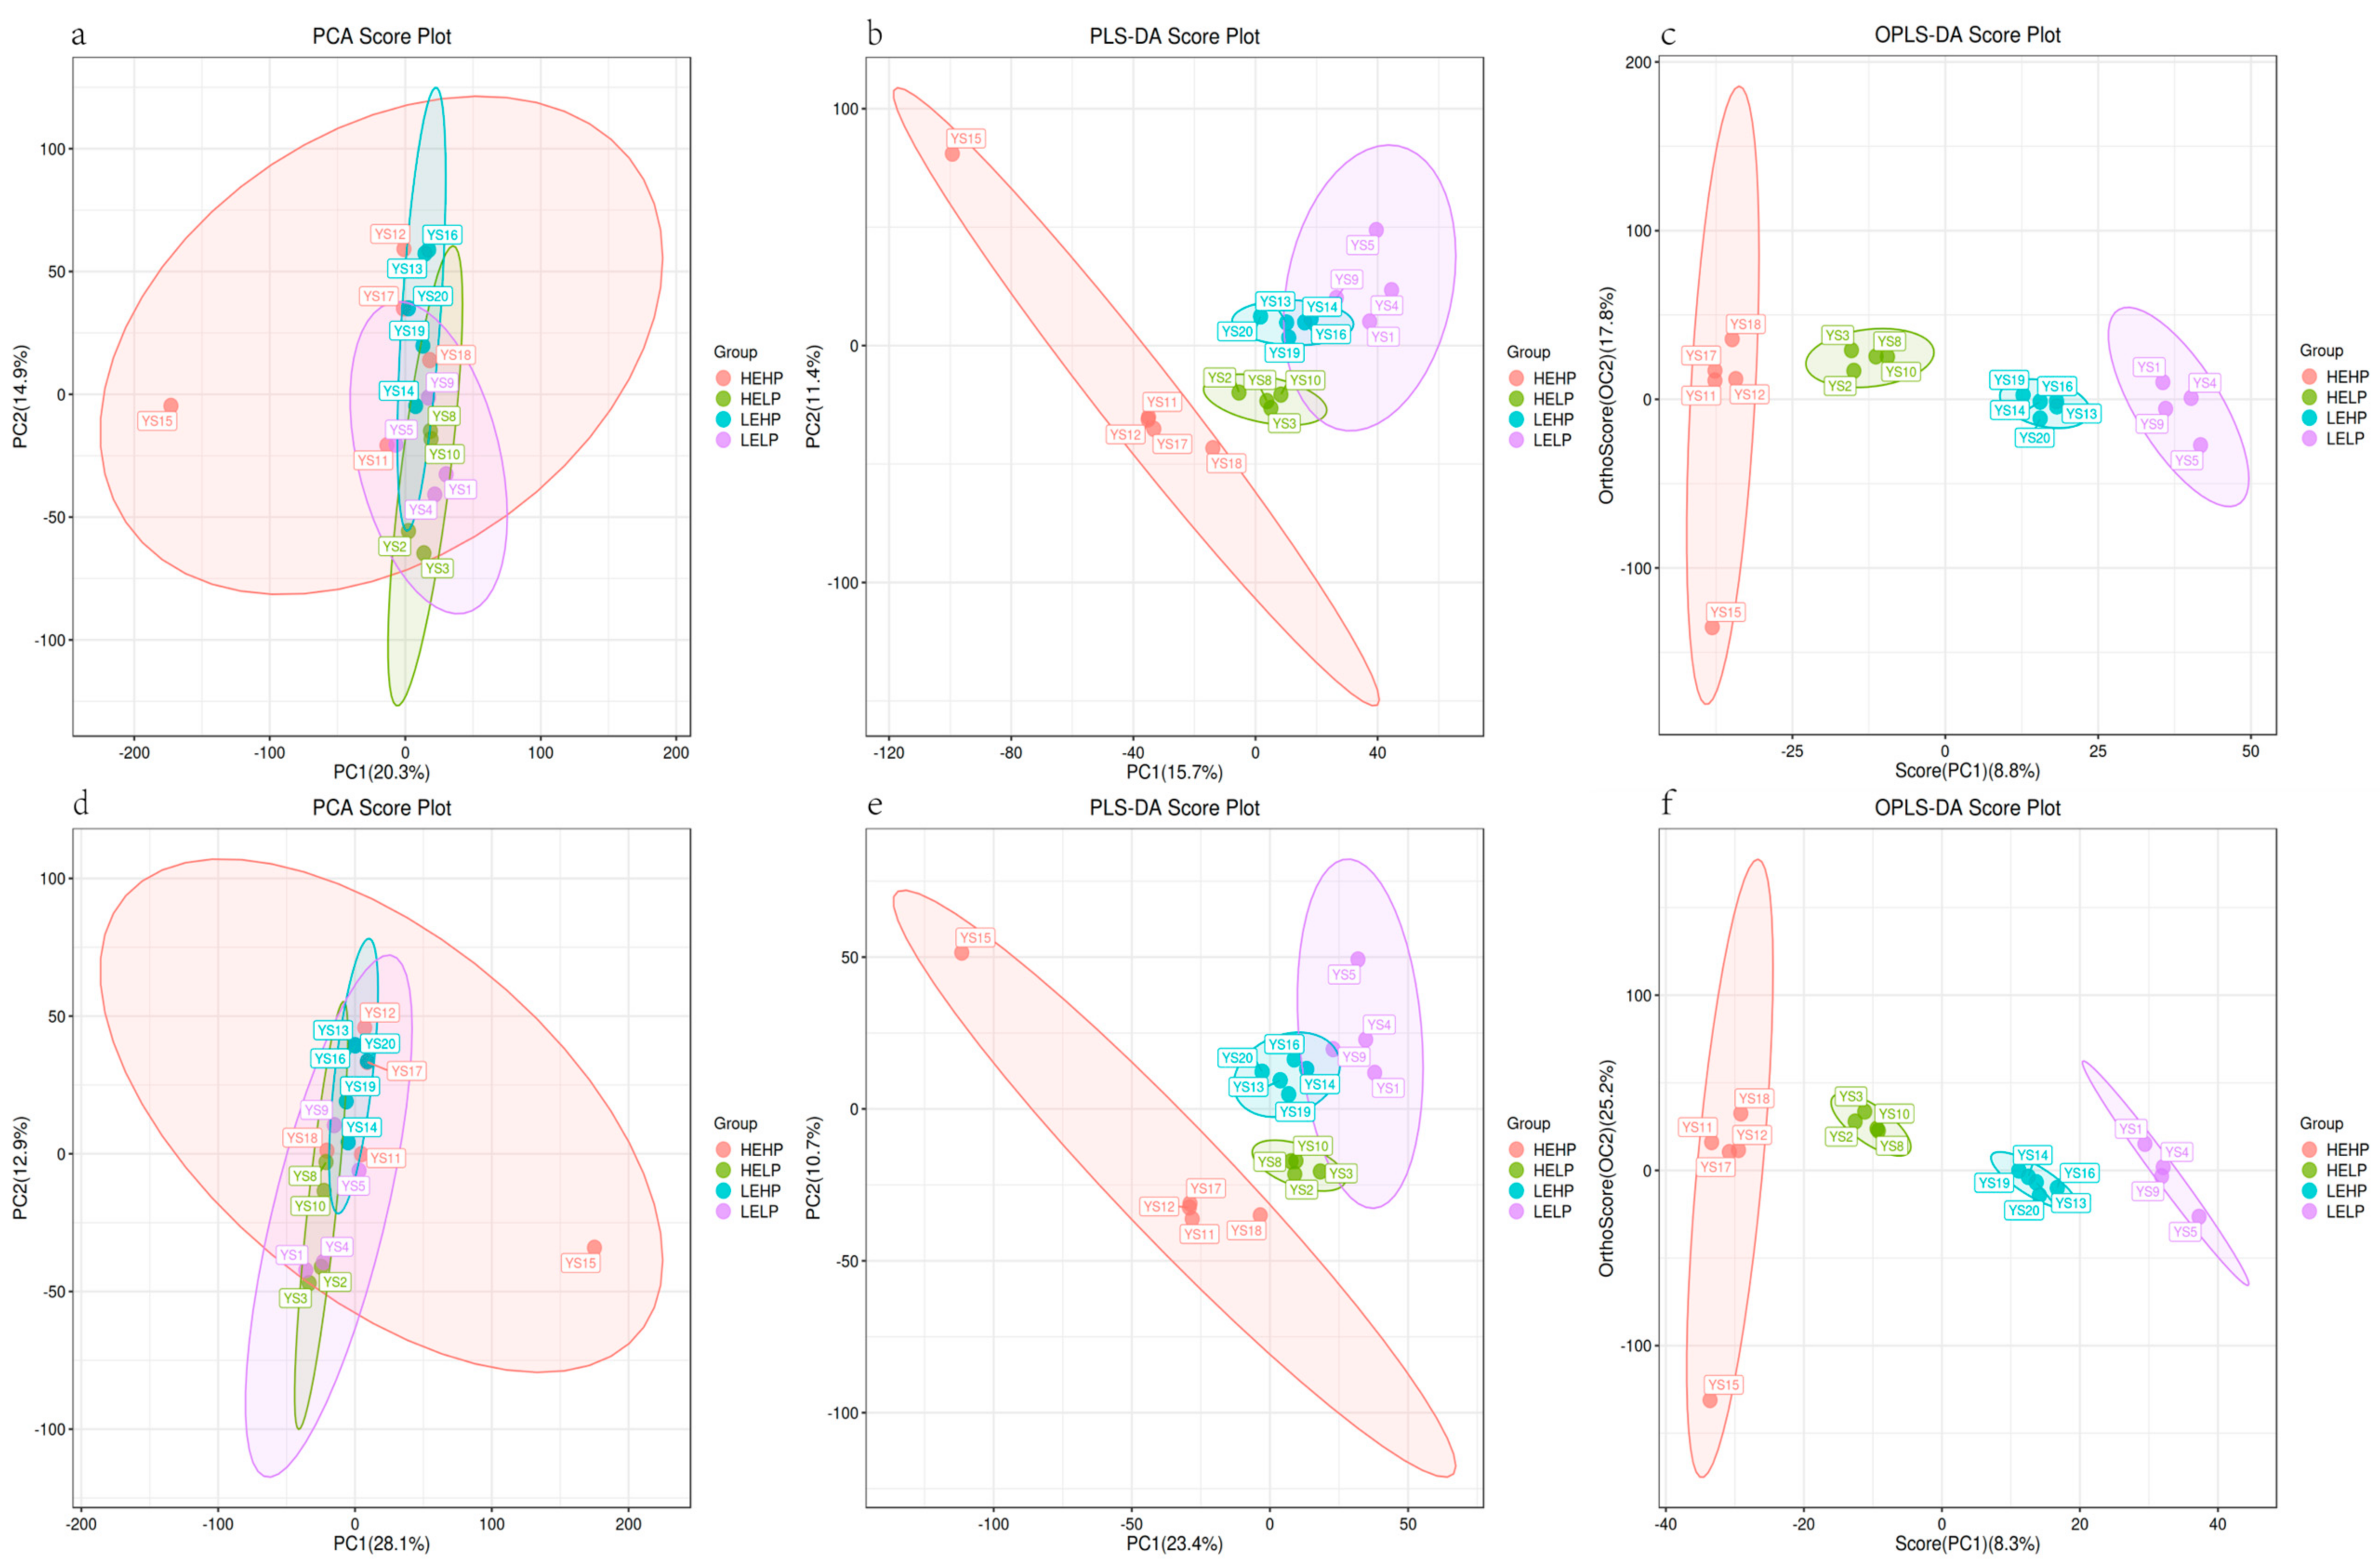
3.3. Analysis of Flavor Substances of Meat by LC-MS
4. Discussion
5. Conclusions
Author Contributions
Funding
Institutional Review Board Statement
Informed Consent Statement
Data Availability Statement
Conflicts of Interest
References
- Liu, Y.; Zhou, Z.; Guo, S.; Li, K.; Wang, P.; Fan, Y.; He, X.; Jiang, Y.; Lan, R.; Chen, S.; et al. Transcriptome Analysis Reveals Key miRNA–mRNA Pathways in Ovarian Tissues of Yunshang Black Goats with Different Kidding Numbers. Front. Endocrinol. 2022, 13, 883663. [Google Scholar] [CrossRef] [PubMed]
- Ebeid, T.A.; Tůmová, E.; Al-Homidan, I.H.; Ketta, M.; Chodová, D. The potential role of feed restriction on productivity, carcass composition, meat quality, and muscle fibre properties of growing rabbits: A review. Meat Sci. 2022, 191, 108845. [Google Scholar] [CrossRef] [PubMed]
- Gurgeira, D.N.; Crisóstomo, C.; Sartori, L.V.C.; de Paz, C.C.P.; Delmilho, G.; Chay-Canul, A.J.; Bedoya, H.J.N.; Vega, W.H.O.; Bueno, M.S.; da Costa, R.L.D. Characteristics of growth, carcass and meat quality of sheep with different feed efficiency phenotypes. Meat Sci. 2022, 194, 108959. [Google Scholar] [CrossRef] [PubMed]
- Guo, L.; Yao, J.; Cao, Y. Regulation of pancreatic exocrine in ruminants and the related mechanism: The signal transduction and more. Anim. Nut. 2021, 7, 1145–1151. [Google Scholar] [CrossRef] [PubMed]
- Guo, H.; Li, B.; Gao, M.; Li, Q.; Gao, Y.; Dong, N.; Liu, G.; Wang, Z.; Gao, W.; Chen, Y.; et al. Dietary Nutritional Level Affects Intestinal Microbiota and Health of Goats. Microorganisms 2022, 10, 2322. [Google Scholar] [CrossRef]
- Akhlaghi, B.; Ghasemi, E.; Alikhani, M.; Ghaedi, A.; Nasrollahi, S.M.; Ghaffari, M.H. Influence of reducing starch in the diets with similar protein and energy contents on lactation performance, ruminal fermentation, digestibility, behaviour and blood metabolites in primiparous and multiparous dairy cows. Vet. Med. Sci. 2022, 8, 808–821. [Google Scholar] [CrossRef] [PubMed]
- Zhang, R.; Ye, H.; Liu, J.; Mao, S. High-grain diets altered rumen fermentation and epithelial bacterial community and resulted in rumen epithelial injuries of goats. App. Microbiol. Biotechnol. 2017, 101, 6981–6992. [Google Scholar] [CrossRef]
- Wang, X.; Xu, R.; Tong, X.; Zeng, J.; Chen, M.; Lin, Z.; Cai, S.; Chen, Y.; Mo, D. Characterization of different meat flavor compounds in Guangdong small-ear spotted and Yorkshire pork using two-dimensional gas chromatography–time-of-flight mass spectrometry and multi-omics. LWT 2022, 169, 114010. [Google Scholar] [CrossRef]
- Khan, M.I.; Jo, C.; Tariq, M.R. Meat flavor precursors and factors influencing flavor precursors—A systematic review. Meat Sci. 2015, 110, 278–284. [Google Scholar] [CrossRef] [PubMed]
- Almela, E.; Jordán, M.J.; Martínez, C.; Sotomayor, J.A.; Bedia, M.; Bañón, S. Ewe’s diet (pasture vs. grain-based feed) affects volatile profile of cooked meat from light lamb. J. Agric. Food Chem. 2010, 58, 9641–9646. [Google Scholar] [CrossRef]
- Geletu, U.S.; Usmael, M.A.; Mummed, Y.Y.; Ibrahim, A.M. Quality of Cattle Meat and Its Compositional Constituents. Vet. Med. Int. 2021, 2021, 7340495. [Google Scholar] [CrossRef]
- Papadimitropoulos, M.P.; Vasilopoulou, C.G.; Maga-Nteve, C.; Klapa, M.I. Untargeted GC-MS Metabolomics. Methods Mol. Biol. 2018, 1738, 133–147. [Google Scholar] [CrossRef] [PubMed]
- Zhou, B.; Xiao, J.F.; Tuli, L.; Ressom, H.W. LC-MS-based metabolomics. Mol. Biosyst. 2012, 8, 470–481. [Google Scholar] [CrossRef] [PubMed]
- Song, H.; Liu, J. GC-O-MS technique and its applications in food flavor analysis. Food Res. Int. 2018, 114, 187–198. [Google Scholar] [CrossRef] [PubMed]
- Chen, X.; Cao, J.; Geng, A.; Zhang, X.; Wang, H.; Chu, Q.; Yan, Z.; Zhang, Y.; Liu, H.; Zhang, J. Integration of GC-MS and LC-MS for metabolite characteristics of thigh meat between fast- and slow-growing broilers at marketable age. Food Chem. 2023, 403, 134362. [Google Scholar] [CrossRef] [PubMed]
- Pavlidis, D.E.; Mallouchos, A.; Ercolini, D.; Panagou, E.Z.; Nychas, G.E. A volatilomics approach for off-line discrimination of minced beef and pork meat and their admixture using HS-SPME GC/MS in tandem with multivariate data analysis. Meat Sci. 2019, 151, 43–53. [Google Scholar] [CrossRef] [PubMed]
- Wang, B.; Zhao, X.; Zhang, B.; Cui, Y.; Nueraihemaiti, M.; Kou, Q.; Luo, H. Assessment of components related to flavor and taste in Tan-lamb meat under different silage-feeding regimens using integrative metabolomics. Food Chem. 2022, 14, 100269. [Google Scholar] [CrossRef] [PubMed]
- Liu, T.; Mo, Q.; Wei, J.; Zhao, M.; Tang, J.; Feng, F. Mass spectrometry-based metabolomics to reveal chicken meat improvements by medium-chain monoglycerides supplementation: Taste, fresh meat quality, and composition. Food Chem. 2021, 365, 130303. [Google Scholar] [CrossRef] [PubMed]
- Wang, J.; Xu, Z.; Zhang, H.; Wang, Y.; Liu, X.; Wang, Q.; Xue, J.; Zhao, Y.; Yang, S. Meat differentiation between pasture-fed and concentrate-fed sheep/goats by liquid chromatography quadrupole time-of-flight mass spectrometry combined with metabolomic and lipidomic profiling. Meat Sci. 2021, 173, 108374. [Google Scholar] [CrossRef] [PubMed]
- Horwitz, W. Official Methods of Analysis; Association of Official Analytical Chemists: Washington, DC, USA, 1975; Volume 222. [Google Scholar]
- Van Soest, P.J.; Robertson, J.B.; Lewis, B.A. Methods for dietary fiber, neutral detergent fiber, and nonstarch polysaccharides in relation to animal nutrition. J. Dairy Sci. 1991, 74, 3583–3597. [Google Scholar] [CrossRef] [PubMed]
- Watkins, P.J.; Frank, D.; Singh, T.K.; Young, O.A.; Warner, R.D. Sheepmeat flavor and the effect of different feeding systems: A review. J. Agric. Food Chem. 2013, 61, 3561–3579. [Google Scholar] [CrossRef] [PubMed]
- Khan, M.; Rashid, M.A.; Yousaf, M.S.; Naveed, S.; Mohsin, I.; Rehman, H.U.; Loor, J.J. Effects of physical forms of a high grain-based diet on fattening performance, ruminal health, feeding behaviour, nutrient digestibility and carcass traits of finishing Lohi lambs. Arch. Anim. Nutr. 2023, 77, 77–92. [Google Scholar] [CrossRef] [PubMed]
- Honikel, K.O. Reference methods for the assessment of physical characteristics of meat. Meat Sci. 1998, 49, 447–457. [Google Scholar] [CrossRef]
- Zhang, C.; Zhang, H.; Liu, M.; Zhao, X.; Luo, H. Effect of Breed on the Volatile Compound Precursors and Odor Profile Attributes of Lamb Meat. Foods 2020, 9, 1178. [Google Scholar] [CrossRef] [PubMed]
- Zhang, J.; Zhuang, H.; Cao, J.; Geng, A.; Wang, H.; Chu, Q.; Yan, Z.; Zhang, X.; Zhang, Y.; Liu, H. Breast Meat Fatty Acid Profiling and Proteomic Analysis of Beijing-You Chicken during the Laying Period. Front. Vet. Sci. 2022, 9, 908862. [Google Scholar] [CrossRef] [PubMed]
- Pang, Z.; Chong, J.; Zhou, G.; de Lima Morais, D.A.; Chang, L.; Barrette, M.; Gauthier, C.; Jacques, P.; Li, S.; Xia, J. MetaboAnalyst 5.0: Narrowing the gap between raw spectra and functional insights. Nucleic Acids Res. 2021, 49, W388–W396. [Google Scholar] [CrossRef] [PubMed]
- Shen, X.; Wang, Y.; Ran, L.; Liu, R.; Sun, X.; Hu, L.; Xiao, Y.; Chen, F. Flavor deterioration of liquid endosperm in postharvest tender coconut revealed by LC-MS-based metabolomics, GC-IMS and E-tongue. Postharvest Biol. Technol. 2022, 187, 111866. [Google Scholar] [CrossRef]
- Neethling, N.E.; Suman, S.P.; Sigge, G.O.; Hoffman, L.C.; Hunt, M.C. Exogenous and Endogenous Factors Influencing Color of Fresh Meat from Ungulates. Microbiol. Metab. Biotechnol. 2017, 1, 253–275. [Google Scholar] [CrossRef]
- Cheng, Q.; Sun, D.W. Factors affecting the water holding capacity of red meat products: A review of recent research advances. Crit. Rev. Food Sci. Nutr. 2008, 48, 137–159. [Google Scholar] [CrossRef] [PubMed]
- Feng, Y.; Cai, Y.; Fu, X.; Zheng, L.; Xiao, Z.; Zhao, M. Comparison of aroma-active compounds in broiler broth and native chicken broth by aroma extract dilution analysis (AEDA), odor activity value (OAV) and omission experiment. Food Chem. 2018, 265, 274–280. [Google Scholar] [CrossRef]
- Marichal, A.; Castro, N.; Capote, J.; Zamorano, M.; Argüello, A. Effects of live weight at slaughter (6, 10 and 25 kg) on kid carcass and meat quality. Livest. Prod. Sci. 2003, 83, 247–256. [Google Scholar] [CrossRef]
- Peng, J.; Huang, W.; Zhang, W.; Zhang, Y.; Yang, M.; Zheng, S.; Lv, Y.; Gao, H.; Wang, W.; Peng, J.; et al. Effect of different dietary energy/protein ratios on growth performance, reproductive performance of breeding pigeons and slaughter performance, meat quality of squabs in summer. Poult. Sci. 2023, 102, 102577. [Google Scholar] [CrossRef] [PubMed]
- Su, Y.; Sun, X.; Zhao, S.; Hu, M.; Li, D.; Qi, S.; Jiao, X.; Sun, Y.; Wang, C.; Zhu, X.; et al. Dietary alfalfa powder supplementation improves growth and development, body health, and meat quality of Tibetan sheep. Food Chem. 2022, 396, 133709. [Google Scholar] [CrossRef]
- Lei, S.; van Beek, G. Influence of activity and dietary energy on broiler performance, carcase yield and sensory quality. Br. Poult. Sci. 1997, 38, 183–189. [Google Scholar] [CrossRef] [PubMed]
- Jennen, D.G.; Brings, A.D.; Liu, G.; Jüngst, H.; Tholen, E.; Jonas, E.; Tesfaye, D.; Schellander, K.; Phatsara, C. Genetic aspects concerning drip loss and water-holding capacity of porcine meat. J. Anim. Breed. Genet. 2007, 124 (Suppl. S1), 2–11. [Google Scholar] [CrossRef] [PubMed]
- Erasmus, S.W.; Hoffman, L.C.; Muller, M.; van der Rijst, M. Variation in the sensory profile of South African Dorper lamb from extensive grazing systems. Small Rumin. Res. 2016, 144, 62–74. [Google Scholar] [CrossRef]
- Li, L.; Zhu, Y.; Wang, X.; He, Y.; Cao, B. Effects of different dietary energy and protein levels and sex on growth performance, carcass characteristics and meat quality of F1 Angus × Chinese Xiangxi yellow cattle. J. Anim. Sci. Biotechnol. 2014, 5, 21. [Google Scholar] [CrossRef] [PubMed]
- Wang, X.Q.; Chen, X.; Tan, H.Z.; Zhang, D.X.; Zhang, H.J.; Wei, S.; Yan, H.C. Nutrient density and slaughter age have differential effects on carcase performance, muscle and meat quality in fast and slow growing broiler genotypes. Br. Poult. Sci. 2013, 54, 50–61. [Google Scholar] [CrossRef]
- Miller, M.F.; Cross, H.R.; Crouse, J.D.; Jenkins, T.G. Effect of feed energy intake on collagen characteristics and muscle quality of mature cows. Meat Sci. 1987, 21, 287–294. [Google Scholar] [CrossRef] [PubMed]
- Daley, C.A.; Abbott, A.; Doyle, P.S.; Nader, G.A.; Larson, S. A review of fatty acid profiles and antioxidant content in grass-fed and grain-fed beef. Nutr. J. 2010, 9, 10. [Google Scholar] [CrossRef] [PubMed]
- Mottram, D.S. Flavour formation in meat and meat products: A review. Food Chem. 1998, 62, 415–424. [Google Scholar] [CrossRef]
- Pekala, J.; Patkowska-Sokoła, B.; Bodkowski, R.; Jamroz, D.; Nowakowski, P.; Lochyński, S.; Librowski, T. L-carnitine--metabolic functions and meaning in humans life. Curr. Drug Metab. 2011, 12, 667–678. [Google Scholar] [CrossRef] [PubMed]
- Martín, A.; Giráldez, F.J.; Mateo, J.; Caro, I.; Andrés, S. Dietary administration of l-carnitine during the fattening period of early feed restricted lambs modifies lipid metabolism and meat quality. Meat Sci. 2023, 198, 109111. [Google Scholar] [CrossRef] [PubMed]
- Dai, S.F.; Wang, L.K.; Wen, A.Y.; Wang, L.X.; Jin, G.M. Dietary glutamine supplementation improves growth performance, meat quality and colour stability of broilers under heat stress. Br. Poult. Sci. 2009, 50, 333–340. [Google Scholar] [CrossRef] [PubMed]
- Keeler, R.F.; Crowe, M.W.; Lambert, E.A. Teratogenicity in swine of the tobacco alkaloid anabasine isolated from Nicotiana glauca. Teratology 1984, 30, 61–69. [Google Scholar] [CrossRef] [PubMed]
- Allison, D.J.; Nederveen, J.P.; Snijders, T.; Bell, K.E.; Kumbhare, D.; Phillips, S.M.; Parise, G.; Heisz, J.J. Exercise training impacts skeletal muscle gene expression related to the kynurenine pathway. Am. J. Physiol. Cell Physiol. 2019, 316, C444–C448. [Google Scholar] [CrossRef] [PubMed]
- Kaiser, H.; Yu, K.; Pandya, C.; Mendhe, B.; Isales, C.M.; McGee-Lawrence, M.E.; Johnson, M.; Fulzele, S.; Hamrick, M.W. Kynurenine, a Tryptophan Metabolite That Increases with Age, Induces Muscle Atrophy and Lipid Peroxidation. Oxid. Med. Cell. Longev. 2019, 2019, 9894238. [Google Scholar] [CrossRef] [PubMed]
- Zhou, J.; Wang, X.; Wang, M.; Chang, Y.; Zhang, F.; Ban, Z.; Tang, R.; Gan, Q.; Wu, S.; Guo, Y.; et al. The lysine catabolite saccharopine impairs development by disrupting mitochondrial homeostasis. J. Cell Biol. 2019, 218, 580–597. [Google Scholar] [CrossRef] [PubMed]
- Kato, H.; Rhue, M.R.; Nishimura, T. Role of free amino acids and peptides in food taste. In Flavor Chemistry; American Chemical Society: Washington, DC, USA, 1989. [Google Scholar]
- Resconi, V.C.; Escudero, A.; Campo, M.M. The development of aromas in ruminant meat. Molecules 2013, 18, 6748–6781. [Google Scholar] [CrossRef] [PubMed]
- Omura, S. The antibiotic cerulenin, a novel tool for biochemistry as an inhibitor of fatty acid synthesis. Bacteriol. Rev. 1976, 40, 681–697. [Google Scholar] [CrossRef] [PubMed]
- Estévez, M.; Morcuende, D.; Ventanas, S.; Cava, R. Analysis of volatiles in meat from Iberian pigs and lean pigs after refrigeration and cooking by using SPME-GC-MS. J. Agric. Food Chem. 2003, 51, 3429–3435. [Google Scholar] [CrossRef] [PubMed]
- Zhang, Y.; Zhang, P.; Peng, H.; Chen, Q.; Jiao, X.; Jia, J.; Pan, Z.; Cheng, J.; Wang, L. Effects of Cooking Processes on Protein Nutritional Values and Volatile Flavor Substances of Silver Carp (Hypophthalmichthys molitrix). Foods 2023, 12, 3169. [Google Scholar] [CrossRef]
- Berge, P.; Culioli, J.; Renerre, M.; Touraille, C.; Micol, D.; Geay, Y. Effect of feed protein on carcass composition and meat quality in steers. Meat Sci. 1993, 35, 79–92. [Google Scholar] [CrossRef] [PubMed]
- Kang, K.; Ma, J.; Wang, H.; Wang, Z.; Peng, Q.; Hu, R.; Zou, H.; Bao, S.; Zhang, W.; Sun, B. High-energy diet improves growth performance, meat quality and gene expression related to intramuscular fat deposition in finishing yaks raised by barn feeding. Vet. Med. Sci. 2020, 6, 755–765. [Google Scholar] [CrossRef] [PubMed]

| Ingredient List | Diets 1 | |||
|---|---|---|---|---|
| HEHP | HELP | LEHP | LELP | |
| Ground corn grains (%) Wheat bran (%) | 33.00 1.40 | 38.45 0.00 | 29.50 5.40 | 31.00 7.40 |
| Soybean meal (%) | 12.65 | 9.20 | 12.10 | 9.40 |
| Corn silage (%) | 43.00 | 41.00 | 0.00 | 0.00 |
| Whole triticale plant (%) | 0.00 | 0.00 | 14.00 | 10.00 |
| Wheat straw (%) | 7.00 | 9.00 | 36.00 | 40.00 |
| Calcium carbonate (%) | 0.60 | 0.60 | 0.70 | 0.70 |
| NaCl (%) | 0.50 | 0.50 | 0.50 | 0.50 |
| Sodium bicarbonate (%) | 0.25 | 0.25 | 0.10 | 0.00 |
| Mineral and vitamin Premix 2 (%) Feed graded urea (%) | 1.00 0.60 | 1.00 0.00 | 1.00 0.70 | 1.00 0.00 |
| Forage to concentrate ratio | 50:50 | 50:50 | 50:50 | 50:50 |
| Chemical Composition | ||||
| Dry matter (%) | 64.74 | 67.01 | 74.68 | 73.75 |
| Metabolizable energy 3 (MJ/kg) | 9.74 | 9.76 | 8.18 | 8.14 |
| Crude protein (%) | 12.99 | 10.01 | 13.04 | 10.05 |
| NDF 4 (%) | 30.43 | 30.82 | 45.82 | 47.08 |
| ADF 5 (%) | 15.52 | 15.72 | 24.80 | 25.36 |
| Calcium (%) | 0.59 | 0.58 | 0.59 | 0.60 |
| Phosphorous (%) | 0.33 | 0.31 | 0.29 | 0.29 |
| Variables | Diets 1 | p-Value 2 | ||||||
|---|---|---|---|---|---|---|---|---|
| HEHP | HELP | LEHP | LELP | SEM | E | P | E*P | |
| pH | 6.232 ab | 6.284 ab | 6.14 b | 6.54 a | 0.0591 | 0.449 | 0.046 | 0.117 |
| Drip loss | 59.93 ab | 60.49 ab | 58.95 b | 61.10 a | 0.3488 | 0.779 | 0.041 | 0.214 |
| Cooking loss | 40.07 ab | 39.51 ab | 41.05 a | 38.90 b | 0.3478 | 0.779 | 0.053 | 0.241 |
| Shear force | 86.16 b | 95.41 a | 91.98 a | 82.16 b | 1.4080 | 0.044 | 0.869 | <0.001 |
| Brightness (L*) | 21.37 b | 22.02 ab | 23.03 a | 22.09 ab | 0.2355 | 0.051 | 0.735 | 0.076 |
| Redness (a*) | 11.76 | 11.18 | 11.99 | 11.34 | 0.2121 | 0.658 | 0.172 | 0.937 |
| Yellowness (b*) | 2.17 | 2.39 | 2.59 | 2.19 | 0.0876 | 0.534 | 0.619 | 0.092 |
| Metabolite | CAS | RT | VIP | Log2FC | p-Value |
|---|---|---|---|---|---|
| HEHP vs. HELP | |||||
| Tridecane, 3-methyl- | 6418-41-3 | 16.251 | 1.945 | −2.201 | 0.0037 |
| Methylcyclopentane | 96-37-7 | 1.883 | 1.862 | −4.157 | 0.0076 |
| 4-Xylene | 106-42-3 | 8.829 | 1.839 | −2.418 | 0.0091 |
| n-Dodecane | 112-40-3 | 11.167 | 1.819 | −2.395 | 0.0105 |
| n-Decane | 124-18-5 | 5.013 | 1.818 | −2.151 | 0.0106 |
| 4,6-Dimethyldodecane | 61,141-72-8 | 12.272 | 1.810 | −3.134 | 0.0112 |
| Methyl mercaptan | 74-93-1 | 1.876 | 1.807 | −29.092 | 0.0114 |
| Undecane, 3-methyl- | 1002-43-3 | 10.016 | 1.784 | −1.986 | 0.0133 |
| n-Tetradecane | 629-59-4 | 17.157 | 1.771 | −2.079 | 0.0144 |
| 2,4-Di-tert-butylphenol | 96-76-4 | 36.466 | 1.755 | −2.422 | 0.0159 |
| Trimethylamine | 75-50-3 | 1.788 | 1.722 | −29.020 | 0.0194 |
| Heptane, 2,4-dimethyl- | 2213-23-2 | 2.356 | 1.693 | −2.039 | 0.0227 |
| 2-Phenoxyethanol | 122-99-6 | 33.359 | 1.687 | −1.858 | 0.0234 |
| 2-Octanone | 111-13-7 | 13.705 | 1.673 | −5.639 | 0.0253 |
| 5-Acetyldihydrofuran-2(3h)-one | 29,393-32-6 | 31.745 | 1.669 | −1.639 | 0.0258 |
| Acetic acid | 64-19-7 | 18.355 | 1.637 | −2.936 | 0.0303 |
| 3-Hexanone | 589-38-8 | 6.344 | 1.607 | −3.518 | 0.0350 |
| 2-Methylundecane | 7045-71-8 | 9.724 | 1.605 | −3.452 | 0.0353 |
| Acetone | 67-64-1 | 2.379 | 1.604 | −2.350 | 0.0355 |
| 3-Ethylpentane | 617-78-7 | 2.128 | 1.601 | −24.976 | 0.0359 |
| Octanoic acid | 124-07-2 | 31.999 | 1.600 | 1.017 | 0.0361 |
| n-Hexadecane | 544-76-3 | 13.358 | 1.591 | −3.685 | 0.0376 |
| Benzene, 1,3-bis(1,1-dimethylethyl)- | 1014-60-4 | 17.701 | 1.581 | −1.180 | 0.0394 |
| Methyl heptyl ketone | 821-55-6 | 16.705 | 1.552 | −10.453 | 0.0447 |
| Pentanal | 110-62-3 | 4.369 | 1.552 | 22.173 | 0.0447 |
| 2,5-Dimethylnonane | 17,302-27-1 | 5.201 | 1.528 | −24.119 | 0.0495 |
| HEHP vs. LEHP | |||||
| Nonanoic acid | 112-05-0 | 34.009 | 2.283 | 1.398 | 0.000 |
| 1-Nonanol | 143-08-8 | 23.644 | 2.115 | −2.273 | 0.001 |
| 1-Phenyl-2-butanone | 1007-32-5 | 26.552 | 2.062 | −1.719 | 0.002 |
| 2,4-Di-tert-butylphenol | 96-76-4 | 36.466 | 2.038 | −1.784 | 0.002 |
| 2-Heptanol | 543-49-7 | 14.999 | 1.991 | −22.148 | 0.003 |
| 4-Sec-butyl-2,6-di-tert-butylphenol | 17,540-75-9 | 29.248 | 1.967 | −3.588 | 0.004 |
| Naphthalene | 91-20-3 | 25.037 | 1.952 | 17.123 | 0.004 |
| Methyl mercaptan | 74-93-1 | 1.876 | 1.952 | −28.844 | 0.004 |
| Heptane, 2,4-dimethyl- | 2213-23-2 | 2.356 | 1.907 | −1.439 | 0.006 |
| Trimethylamine | 75-50-3 | 1.788 | 1.904 | −29.428 | 0.006 |
| Sarcosine | 107-97-1 | 1.663 | 1.903 | −28.046 | 0.006 |
| 1,4-Butanediol | 110-63-4 | 29.265 | 1.860 | −2.807 | 0.009 |
| Isobutyl alcohol | 78-83-1 | 8.064 | 1.826 | −7.004 | 0.011 |
| 2-Tridecanone | 593-08-8 | 26.896 | 1.825 | −18.699 | 0.011 |
| n-Tetradecane | 629-59-4 | 17.157 | 1.791 | −2.499 | 0.014 |
| Acetone | 67-64-1 | 2.379 | 1.784 | −1.384 | 0.014 |
| Dodecanoic acid | 143-07-7 | 39.527 | 1.781 | −1.432 | 0.014 |
| Methylthioethanol | 5271-38-5 | 20.287 | 1.777 | −22.802 | 0.015 |
| Octylaldehyde | 124-13-0 | 13.780 | 1.749 | 22.566 | 0.017 |
| Palmitic acid | 1957-10-3 | 44.605 | 1.739 | −1.705 | 0.018 |
| Pentylcyclopentane | 3741-00-2 | 7.058 | 1.731 | −2.185 | 0.019 |
| 2-Pentanone | 107-87-9 | 4.351 | 1.692 | −4.081 | 0.023 |
| Pentanal | 110-62-3 | 4.369 | 1.684 | 22.173 | 0.024 |
| Acetic acid | 64-19-7 | 18.355 | 1.675 | −3.082 | 0.025 |
| Formamide | 1975-12-7 | 26.237 | 1.668 | −2.730 | 0.026 |
| Nonanal | 124-19-6 | 16.797 | 1.604 | 5.258 | 0.035 |
| Benzene, 1,3-bis(1,1-dimethylethyl)- | 1014-60-4 | 17.701 | 1.591 | −1.369 | 0.037 |
| 3-Octanol | 589-98-0 | 17.040 | 1.575 | −3.802 | 0.040 |
| Isobornyl acrylate | 5888-33-5 | 24.530 | 1.538 | −1.799 | 0.047 |
| 1-Methoxy-2-hydroxypropane | 107-98-2 | 9.001 | 1.531 | 19.428 | 0.048 |
| n-Decane | 124-18-5 | 5.013 | 1.530 | −1.562 | 0.048 |
| HEHP vs. LELP | |||||
| Nonanoic acid | 112-05-0 | 34.009 | 2.124 | 1.648 | 0.000 |
| Undecane, 3-methyl- | 1002-43-3 | 10.016 | 2.118 | −1.303 | 0.000 |
| Ethylbenzene | 100-41-4 | 8.365 | 2.066 | −1.306 | 0.000 |
| (4s)-4,6-Dimethyl-2-heptanone | 790,248-21-4 | 12.455 | 2.053 | −19.619 | 0.000 |
| n-Dodecane | 112-40-3 | 11.167 | 2.047 | −1.502 | 0.001 |
| n-Tetradecane | 629-59-4 | 17.157 | 2.024 | −2.007 | 0.001 |
| 2-Bromododecane | 13,187-99-0 | 12.519 | 1.945 | −2.151 | 0.002 |
| 4,6-Dimethyldodecane | 61,141-72-8 | 12.272 | 1.941 | −2.735 | 0.002 |
| Heptane, 2,4-dimethyl- | 2213-23-2 | 2.356 | 1.940 | −1.484 | 0.002 |
| Acetone | 67-64-1 | 2.379 | 1.934 | −1.687 | 0.003 |
| Methylthioethanol | 5271-38-5 | 20.287 | 1.909 | −21.756 | 0.003 |
| 2-Octanone | 111-13-7 | 13.705 | 1.906 | −4.940 | 0.003 |
| Methanol | 67-56-1 | 3.116 | 1.883 | −0.576 | 0.004 |
| 1,4-Butanediol | 110-63-4 | 29.265 | 1.883 | −2.686 | 0.004 |
| Palmitic acid | 1957-10-3 | 44.605 | 1.796 | −1.747 | 0.009 |
| Methyl ethyl ketone | 78-93-3 | 3.103 | 1.768 | −1.381 | 0.011 |
| Methyl mercaptan | 74-93-1 | 1.876 | 1.764 | −27.945 | 0.011 |
| 2,5-Dimethylnonane | 17,302-27-1 | 5.201 | 1.720 | −23.112 | 0.015 |
| Tridecane, 3-methyl- | 6418-41-3 | 16.251 | 1.692 | −1.835 | 0.018 |
| Phenol | 108-95-2 | 30.689 | 1.670 | −1.580 | 0.020 |
| Octane, 2,3,6,7-tetramethyl- | 52,670-34-5 | 5.883 | 1.646 | −1.866 | 0.023 |
| 2-Heptanol | 543-49-7 | 14.999 | 1.641 | −21.430 | 0.024 |
| 2-Phenoxyethanol | 122-99-6 | 33.359 | 1.631 | −2.263 | 0.025 |
| n-Decane | 124-18-5 | 5.013 | 1.621 | −1.131 | 0.027 |
| Formamide | 1975-12-7 | 26.237 | 1.608 | −3.196 | 0.029 |
| Isovaleric acid | 503-74-2 | 23.761 | 1.607 | −7.175 | 0.029 |
| Dimethyl trisulfide | 3658-80-8 | 16.113 | 1.605 | −19.885 | 0.029 |
| Isobornyl acrylate | 5888-33-5 | 24.530 | 1.597 | −2.278 | 0.030 |
| 1,3,5-Trimethylbenzene | 108-67-8 | 13.325 | 1.566 | −3.454 | 0.035 |
| Indole | 120-72-9 | 38.444 | 1.566 | −23.654 | 0.035 |
| 2-Pentanol | 6032-29-7 | 8.954 | 1.558 | −3.153 | 0.037 |
| Sarcosine | 107-97-1 | 1.663 | 1.558 | −27.671 | 0.037 |
| 2-Methylheptane | 592-27-8 | 2.110 | 1.552 | −2.382 | 0.038 |
| 4-Ethylcyclohexanone | 5441-51-0 | 15.193 | 1.518 | −20.005 | 0.044 |
| 3-Ethylpentane | 617-78-7 | 2.128 | 1.495 | −23.998 | 0.048 |
| 4-Methyloctane | 2216-34-4 | 2.713 | 1.495 | −0.902 | 0.049 |
| Isoamyl alcohol | 123-51-3 | 11.596 | 1.493 | −27.731 | 0.049 |
| 2-Nonanol | 628-99-9 | 20.311 | 1.490 | −21.356 | 0.050 |
| HELP vs. LEHP | |||||
| Octyl formate | 112-32-3 | 21.219 | 2.114 | 19.818 | 0.023 |
| 1-Octanol | 111-87-5 | 21.218 | 2.059 | −20.238 | 0.029 |
| Methylcyclopentane | 96-37-7 | 1.883 | 2.033 | 2.219 | 0.032 |
| Benzyl alcohol | 100-51-6 | 28.143 | 1.983 | 2.021 | 0.039 |
| 1,1,2-Trichloroethane | 79-00-5 | 12.854 | 1.944 | 24.178 | 0.045 |
| HELP vs. LELP | |||||
| Ethylbenzene | 100-41-4 | 8.365 | 2.067 | −1.041 | 0.028 |
| 5-Acetyldihydrofuran-2(3h)-one | 29,393-32-6 | 31.745 | 2.048 | 2.134 | 0.031 |
| (4s)-4,6-Dimethyl-2-heptanone | 790,248-21-4 | 12.455 | 2.040 | −2.226 | 0.032 |
| Isophorone | 78-59-1 | 21.876 | 1.986 | −3.463 | 0.039 |
| Methylcyclopentane | 96-37-7 | 1.883 | 1.940 | 2.247 | 0.046 |
| LEHP vs. LELP | |||||
| (4s)-4,6-Dimethyl-2-heptanone | 790,248-21-4 | 12.455 | 2.572 | −19.619 | 0.000 |
| Butyrolactone | 96-48-0 | 22.495 | 2.274 | 2.172 | 0.008 |
| 1,1,2-Trichloroethane | 79-00-5 | 12.854 | 2.106 | −24.138 | 0.019 |
| 1-Nonanol | 143-08-8 | 23.644 | 2.070 | 1.130 | 0.023 |
| Ethylbenzene | 100-41-4 | 8.365 | 1.989 | −1.110 | 0.032 |
| 4-Ethylcyclohexanone | 5441-51-0 | 15.193 | 1.901 | −20.005 | 0.044 |
| Metabolites | m/z | RT | VIP | Log2FC | p-Value | P/N |
|---|---|---|---|---|---|---|
| HEHP vs. HELP | ||||||
| 1-Palmitoylglycerophosphocholine | 496.33 | 516.70 | 1.78 | −0.92 | 0.00788 | P |
| L-Kynurenine | 209.09 | 102.60 | 1.83 | 0.90 | 0.00903 | P |
| Butyryl-L-carnitine | 232.15 | 148.20 | 2.02 | −3.94 | 0.00965 | P |
| L-Glutamine | 145.06 | 70.30 | 1.65 | −1.23 | 0.01027 | N |
| L-Methionine | 150.06 | 63.10 | 1.66 | −1.27 | 0.01065 | P |
| 3′-AMP | 346.06 | 49.70 | 1.81 | −4.11 | 0.01113 | N |
| N2-gamma-Glutamylglutamine | 274.10 | 46.90 | 1.94 | −4.02 | 0.01344 | N |
| Oleic acid | 283.26 | 558.60 | 1.73 | −1.63 | 0.01414 | P |
| Ethylmethylacetic acid | 102.13 | 684.90 | 1.86 | −0.55 | 0.01500 | P |
| 9(S)-HPODE | 313.24 | 413.60 | 1.92 | −1.83 | 0.01652 | P |
| Aminosalicylic acid | 152.04 | 381.30 | 1.82 | −1.81 | 0.01921 | N |
| 16(R)-HETE | 319.23 | 504.30 | 1.37 | −0.46 | 0.02097 | N |
| Cholesterol sulfate | 466.31 | 573.10 | 1.43 | −1.20 | 0.02345 | N |
| L-Tyrosine | 182.08 | 65.40 | 1.86 | 2.00 | 0.02740 | P |
| Anabasine | 144.98 | 687.30 | 1.74 | −0.79 | 0.02857 | P |
| Saccharopine | 276.11 | 58.70 | 1.68 | 1.22 | 0.03205 | P |
| Phenylacetylglycine | 194.08 | 273.50 | 1.52 | −0.74 | 0.03426 | P |
| Palmitoylethanolamide | 300.29 | 587.30 | 1.70 | 1.22 | 0.03440 | P |
| Uridine | 245.08 | 62.80 | 1.83 | 4.30 | 0.03815 | P |
| N-Alpha-acetyllysine | 188.07 | 190.40 | 1.71 | −1.06 | 0.03882 | P |
| 2-Pyrrolidinone | 100.08 | 102.90 | 1.80 | 0.80 | 0.04024 | P |
| L(-)-Carnitine | 162.11 | 161.30 | 1.63 | 0.40 | 0.04103 | P |
| 3-Methyladenine | 149.02 | 408.80 | 1.45 | −0.77 | 0.04162 | P |
| S-Inosyl-L-homocysteine | 386.11 | 58.80 | 1.71 | 2.24 | 0.04309 | P |
| Prostaglandin I2 | 353.23 | 344.50 | 1.70 | −1.30 | 0.04342 | P |
| Palmitoyl-L-carnitine | 400.34 | 653.10 | 1.68 | −0.76 | 0.04610 | P |
| 10-Hydroxydecanoic acid | 187.13 | 334.10 | 1.64 | 2.27 | 0.04618 | N |
| 2-Aminophenol | 110.02 | 85.50 | 1.77 | 0.83 | 0.04631 | P |
| Nalpha-Methylhistidine | 152.08 | 45.00 | 1.76 | 0.82 | 0.04635 | P |
| (S)-2-Methylmalate | 148.04 | 56.60 | 1.75 | 0.99 | 0.04713 | P |
| D-Ribose | 151.04 | 43.00 | 1.62 | −0.63 | 0.04965 | P |
| HEHP vs. LEHP | ||||||
| Stearic acid | 284.18 | 252.40 | 2.59 | −4.48 | 0.00002 | P |
| Acetylphosphate | 139.98 | 88.30 | 2.44 | −1.98 | 0.00040 | P |
| L-Sorbose | 179.99 | 638.40 | 2.52 | −2.50 | 0.00076 | N |
| L(-)-Carnitine | 162.11 | 161.30 | 2.34 | 0.76 | 0.00160 | P |
| Saccharopine L-Kynurenine | 276.11 209.09 | 58.70 | 2.21 | 2.40 | 0.00410 | P |
| 102.60 | 2.23 | 1.20 | 0.00434 | P | ||
| Hypoxanthine | 137.05 | 64.90 | 2.16 | −1.92 | 0.00623 | P |
| Sodium deoxycholate | 414.32 | 566.00 | 2.07 | −1.89 | 0.01191 | P |
| Hippuric acid | 178.05 | 104.70 | 2.35 | −1.86 | 0.01202 | N |
| L-Glutamine | 145.06 | 70.30 | 2.01 | −0.84 | 0.02246 | N |
| Allocystathionine | 222.08 | 230.50 | 1.90 | 0.57 | 0.02296 | P |
| Equol | 241.08 | 92.40 | 2.03 | −1.05 | 0.02297 | N |
| Cytidine | 244.09 | 53.90 | 1.90 | 0.56 | 0.02334 | P |
| Guanidinosuccinic acid | 174.96 | 89.10 | 1.97 | −1.79 | 0.02848 | N |
| Anabasine | 144.98 | 687.30 | 1.86 | −0.68 | 0.03134 | P |
| Cerulenin | 224.12 | 472.10 | 1.78 | 1.73 | 0.04027 | P |
| Succinic acid semialdehyde | 103.04 | 51.10 | 1.78 | 1.08 | 0.04224 | P |
| L-Leucine | 132.10 | 65.70 | 1.77 | −0.79 | 0.04292 | P |
| Dodecanedioic acid | 229.14 | 269.30 | 1.85 | −1.17 | 0.04597 | N |
| Mannitol | 182.99 | 32.70 | 1.74 | 0.22 | 0.04629 | P |
| Epsilon-caprolactam | 114.09 | 208.30 | 1.74 | −1.98 | 0.04751 | P |
| 9(S)-HPODE | 313.24 | 413.60 | 1.91 | −1.18 | 0.04999 | P |
| HEHP vs. LELP | ||||||
| Daidzin | 397.22 | 473.40 | 2.11 | −2.53 | 0.00214 | N |
| Saccharopine | 276.11 | 58.70 | 2.06 | 1.80 | 0.00327 | P |
| L(-)-Carnitine | 162.11 | 161.30 | 2.06 | 0.74 | 0.00340 | P |
| Erythritol | 121.03 | 271.00 | 2.10 | 1.78 | 0.00674 | N |
| Sodium deoxycholate | 414.32 | 566.00 | 1.99 | −2.41 | 0.00739 | P |
| Hypoxanthine | 137.05 | 64.90 | 1.96 | −1.65 | 0.00888 | P |
| Glycitein | 284.07 | 383.70 | 1.99 | −2.46 | 0.00908 | N |
| Succinic acid | 117.02 | 45.80 | 1.97 | 1.51 | 0.00911 | N |
| L-Kynurenine | 209.09 | 102.60 | 1.92 | 0.68 | 0.01052 | P |
| AMP | 348.07 | 209.70 | 1.85 | 1.58 | 0.01247 | P |
| Oleic acid | 283.26 | 558.60 | 1.88 | −1.56 | 0.01345 | P |
| 3-Methyladenine | 149.02 | 408.80 | 1.87 | −1.01 | 0.01418 | P |
| 9(S)-HPODE | 313.24 | 413.60 | 1.86 | −1.76 | 0.01479 | P |
| L-Glutamine | 145.06 | 70.30 | 1.85 | −1.75 | 0.01554 | N |
| Mannitol | 182.99 | 32.70 | 1.87 | 0.28 | 0.01727 | P |
| Allocholic acid | 408.37 | 633.40 | 1.76 | −1.40 | 0.02448 | P |
| Dodecanedioic acid | 229.14 | 269.30 | 1.74 | −0.98 | 0.03112 | N |
| Dimethirimol | 209.15 | 452.50 | 1.70 | −1.65 | 0.03312 | P |
| Ecgonine methyl ester | 200.13 | 65.40 | 1.74 | −0.67 | 0.03421 | P |
| L-Sorbose | 179.99 | 638.40 | 1.75 | −1.74 | 0.03576 | N |
| (6Z)-Octadecenoic acid | 282.28 | 617.40 | 1.68 | −1.71 | 0.04401 | P |
| Glutathione | 307.08 | 56.40 | 1.62 | −4.08 | 0.04496 | P |
| Anabasine | 144.98 | 687.30 | 1.64 | −0.92 | 0.04895 | P |
| HELP vs. LEHP | ||||||
| 10-Hydroxydecanoic acid | 187.13 | 334.10 | 2.00 | −3.02 | 0.00001 | N |
| L-Leucine | 132.10 | 65.70 | 1.88 | −1.21 | 0.00072 | P |
| 9(S)-HPODE | 313.24 | 413.60 | 1.90 | 0.65 | 0.00118 | P |
| Epiandrosterone | 271.23 | 519.90 | 1.79 | 1.12 | 0.00229 | N |
| 3-Methyladenine | 149.02 | 408.80 | 1.85 | 0.82 | 0.00243 | P |
| L-Tyrosine | 182.08 | 65.40 | 1.89 | −2.82 | 0.00258 | P |
| 3-Ketosphingosine | 280.26 | 501.40 | 1.80 | −3.05 | 0.00295 | P |
| Phloroglucinol | 127.04 | 75.40 | 1.80 | −3.09 | 0.00300 | P |
| Arachidic acid | 311.30 | 672.40 | 1.73 | −1.64 | 0.00318 | N |
| all-trans-Retinoic acid | 299.26 | 545.50 | 1.84 | 1.29 | 0.00345 | N |
| Quinolin-2-ol | 146.06 | 265.40 | 1.75 | −1.54 | 0.00421 | P |
| Acetylphosphate | 139.98 | 88.30 | 1.72 | −1.50 | 0.00593 | P |
| Nalpha-Methylhistidine | 152.08 | 45.00 | 1.74 | −0.97 | 0.00631 | P |
| Cholesterol sulfate | 466.31 | 573.10 | 1.69 | 1.58 | 0.00645 | N |
| Aminosalicylic acid | 152.04 | 381.30 | 1.70 | 2.34 | 0.00741 | N |
| N2-gamma-Glutamylglutamine | 274.10 | 46.90 | 1.69 | 4.43 | 0.00743 | N |
| L-Methionine | 150.06 | 63.10 | 1.75 | 1.31 | 0.00773 | P |
| Uridine | 245.08 | 62.80 | 1.69 | −5.55 | 0.00831 | P |
| Glycylleucine | 189.12 | 133.70 | 1.68 | −0.81 | 0.00902 | P |
| 2-Aminophenol | 110.02 | 85.50 | 1.69 | −0.96 | 0.00959 | P |
| 2-Pyrrolidinone | 100.08 | 102.90 | 1.68 | −0.97 | 0.00982 | P |
| Cerulenin | 224.12 | 472.10 | 1.70 | 2.19 | 0.01069 | P |
| Phthalic acid | 165.04 | 589.70 | 1.65 | 0.74 | 0.01084 | N |
| 5-Amino-2-oxopentanoic acid | 131.05 | 65.10 | 1.68 | −1.31 | 0.01091 | P |
| 1-Palmitoylglycerophosphocholine | 496.33 | 516.70 | 1.64 | 0.97 | 0.01185 | P |
| (S)-2-Methylmalate | 148.04 | 56.60 | 1.66 | −1.08 | 0.01202 | P |
| L-Malic acid | 133.01 | 44.40 | 1.69 | −2.92 | 0.01328 | N |
| gamma-Amino-gamma-cyanobutanoate | 129.07 | 52.20 | 1.63 | −0.94 | 0.01381 | P |
| Myristic acid | 227.20 | 478.70 | 1.58 | −5.09 | 0.01385 | N |
| D-Ribose | 151.04 | 43.00 | 1.64 | 0.49 | 0.01420 | P |
| L-Tryptophan | 205.10 | 190.40 | 1.61 | −1.24 | 0.01580 | P |
| S-Inosyl-L-homocysteine | 386.11 | 58.80 | 1.64 | −2.30 | 0.01670 | P |
| 5′-Methylthioadenosine | 298.10 | 160.10 | 1.55 | −4.64 | 0.01748 | P |
| Octadecanamide | 284.29 | 667.50 | 1.60 | 0.92 | 0.01774 | P |
| Tridemorph | 298.31 | 659.80 | 1.57 | −0.73 | 0.01803 | P |
| Palmitoylethanolamide | 300.29 | 587.30 | 1.58 | −1.33 | 0.01847 | P |
| Taurine | 126.02 | 53.50 | 1.58 | −1.25 | 0.02000 | P |
| UMP | 323.03 | 46.70 | 1.54 | 2.42 | 0.02036 | N |
| Anhydrotetracycline | 427.12 | 47.30 | 1.56 | −5.07 | 0.02124 | P |
| 8-HETE | 303.23 | 530.20 | 1.58 | 1.11 | 0.02173 | P |
| Butyryl-L-carnitine | 232.15 | 148.20 | 1.54 | 3.87 | 0.02306 | P |
| Oleic acid | 283.26 | 558.60 | 1.55 | 1.14 | 0.02467 | P |
| Hydroquinone | 110.02 | 348.20 | 1.51 | −0.68 | 0.02557 | P |
| o-Toluate | 135.05 | 289.70 | 1.48 | 1.25 | 0.02569 | N |
| Kyotorphin | 320.16 | 253.60 | 1.53 | −1.20 | 0.02741 | P |
| Epsilon-caprolactam | 114.09 | 208.30 | 1.56 | −2.48 | 0.02790 | P |
| N-Acetyl-L-aspartic acid | 174.04 | 45.20 | 1.51 | −0.75 | 0.02851 | N |
| Spermine | 203.22 | 41.80 | 1.56 | −1.26 | 0.02872 | P |
| N-Formyl-L-methionine | 176.97 | 158.20 | 1.46 | −1.32 | 0.03044 | P |
| Pyrrolidonecarboxylic acid | 130.05 | 513.40 | 1.56 | 1.17 | 0.03114 | P |
| 26-Hydroxyecdysone | 480.28 | 348.50 | 1.47 | 0.78 | 0.03436 | P |
| ATP | 507.12 | 589.70 | 1.43 | 1.19 | 0.03842 | N |
| 3,4-Dihydroxyphenylpropanoate | 165.05 | 65.30 | 1.42 | −2.16 | 0.03940 | P |
| Hypoxanthine | 137.05 | 64.90 | 1.46 | −1.53 | 0.04089 | P |
| Linoleic acid | 280.26 | 581.80 | 1.45 | −0.50 | 0.04232 | P |
| 3′-AMP | 346.06 | 49.70 | 1.40 | 3.03 | 0.04276 | N |
| L (-)-Carnitine | 162.11 | 161.30 | 1.39 | 0.36 | 0.04297 | P |
| Isocitric acid | 191.02 | 439.80 | 1.38 | 0.76 | 0.04392 | N |
| N-Alpha-acetyllysine | 188.07 | 190.40 | 1.46 | 0.80 | 0.04473 | P |
| Nitrendipine | 361.14 | 308.30 | 1.44 | −0.28 | 0.04568 | P |
| Creatinine | 113.06 | 98.50 | 1.38 | 0.27 | 0.04841 | P |
| HELP vs. LELP | ||||||
| L-Tyrosine | 182.08 | 65.40 | 2.21 | −1.03 | 0.00582 | P |
| L-Arginine | 175.12 | 46.40 | 2.13 | 2.32 | 0.01009 | P |
| 4-Nitrophenol | 138.02 | 335.00 | 2.18 | 1.57 | 0.01447 | N |
| all-trans-Retinoic acid | 299.26 | 545.50 | 1.96 | 0.53 | 0.02960 | N |
| Glycylleucine | 189.12 | 133.70 | 1.92 | −1.11 | 0.03570 | P |
| Oxidized glutathione | 611.15 | 42.70 | 1.87 | 0.81 | 0.04211 | N |
| S-(Hydroxymethyl)glutathione | 338.10 | 56.50 | 1.90 | 0.86 | 0.04435 | P |
| Nitrendipine | 361.14 | 308.30 | 1.85 | −0.31 | 0.04691 | P |
| Procollagen 5-hydroxy-L-lysine | 197.81 | 471.20 | 1.83 | −1.34 | 0.04742 | N |
| LEHP vs. LELP | ||||||
| 10-Hydroxydecanoic acid | 187.13 | 334.10 | 2.12 | 2.63 | 0.00018 | N |
| 5-Guanidino-3-methyl-2-oxopentanoate | 187.11 | 55.70 | 2.19 | 2.50 | 0.00025 | P |
| 3-Methyladenine | 149.02 | 408.80 | 2.17 | −1.06 | 0.00038 | P |
| Phloroglucinol | 127.04 | 75.40 | 2.14 | 4.06 | 0.00068 | P |
| 3-Ketosphingosine | 280.26 | 501.40 | 2.13 | 2.76 | 0.00076 | P |
| 7-Dehydrodesmosterol | 365.32 | 508.90 | 2.02 | 0.49 | 0.00269 | P |
| 5′-Methylthioadenosine | 298.10 | 160.10 | 1.98 | 6.52 | 0.00315 | P |
| Phenyl acetate | 134.89 | 615.90 | 1.89 | −1.23 | 0.00476 | N |
| 5-Amino-2-oxopentanoic acid | 131.05 | 65.10 | 1.94 | 1.03 | 0.00591 | P |
| Nalpha-Methylhistidine | 152.08 | 45.00 | 1.95 | 0.85 | 0.00606 | P |
| 4,4′-Sulfonyldiphenol | 249.02 | 326.70 | 1.82 | −0.95 | 0.00661 | N |
| (S)-2-Methylmalate | 148.04 | 56.60 | 1.93 | 0.95 | 0.00719 | P |
| Acetylphosphate | 139.98 | 88.30 | 1.90 | 1.83 | 0.00725 | P |
| 2-Aminophenol | 110.02 | 85.50 | 1.90 | 0.86 | 0.00836 | P |
| 2-Pyrrolidinone | 100.08 | 102.90 | 1.85 | 0.86 | 0.01168 | P |
| N-Acetyl-L-aspartic acid | 174.04 | 45.20 | 1.76 | 1.04 | 0.01324 | N |
| L-Tyrosine | 182.08 | 65.40 | 1.82 | 1.79 | 0.01362 | P |
| Cerulenin | 224.12 | 472.10 | 1.87 | −1.96 | 0.01571 | P |
| 9(S)-HPODE | 313.24 | 413.60 | 1.78 | −0.58 | 0.01706 | P |
| UMP | 323.03 | 46.70 | 1.73 | −2.83 | 0.01897 | N |
| Oleic acid | 283.26 | 558.60 | 1.73 | −1.07 | 0.02238 | P |
| Pyrrole-2-carboxylic acid | 111.02 | 601.40 | 1.73 | −0.49 | 0.02304 | P |
| 3-Dehydroshikimate | 172.98 | 83.40 | 1.76 | −0.85 | 0.02398 | P |
| N-Acetylornithine | 173.09 | 53.30 | 1.77 | −0.24 | 0.02506 | N |
| Palmitoylethanolamide | 300.29 | 587.30 | 1.63 | 1.11 | 0.03177 | P |
| Dulcin | 181.10 | 254.50 | 1.66 | −0.23 | 0.03410 | P |
| Uridine | 245.08 | 62.80 | 1.64 | 4.15 | 0.03496 | P |
| L-Leucine | 132.10 | 65.70 | 1.62 | 0.88 | 0.03945 | P |
| all-trans-Retinoic acid | 299.26 | 545.50 | 1.53 | −0.76 | 0.04014 | N |
| Hippuric acid | 178.05 | 104.70 | 1.83 | 2.01 | 0.04031 | N |
| Glycitein | 284.07 | 383.70 | 1.61 | −1.13 | 0.04459 | N |
| Pyrrolidonecarboxylic acid | 130.05 | 513.40 | 1.58 | −1.02 | 0.04517 | P |
| L-Malic acid | 133.01 | 44.40 | 1.53 | 2.01 | 0.04666 | N |
Disclaimer/Publisher’s Note: The statements, opinions and data contained in all publications are solely those of the individual author(s) and contributor(s) and not of MDPI and/or the editor(s). MDPI and/or the editor(s) disclaim responsibility for any injury to people or property resulting from any ideas, methods, instructions or products referred to in the content. |
© 2024 by the authors. Licensee MDPI, Basel, Switzerland. This article is an open access article distributed under the terms and conditions of the Creative Commons Attribution (CC BY) license (https://creativecommons.org/licenses/by/4.0/).
Share and Cite
Li, Z.; Jiang, Y.; Khan, M.; Xue, B.; Zhao, X.; Fu, B.; Li, W.; Danzeng, B.; Ni, X.; Shao, Q.; et al. Dietary Energy and Protein Levels Influence the Mutton Quality and Metabolomic Profile of the Yunshang Black Goat. Foods 2024, 13, 2271. https://doi.org/10.3390/foods13142271
Li Z, Jiang Y, Khan M, Xue B, Zhao X, Fu B, Li W, Danzeng B, Ni X, Shao Q, et al. Dietary Energy and Protein Levels Influence the Mutton Quality and Metabolomic Profile of the Yunshang Black Goat. Foods. 2024; 13(14):2271. https://doi.org/10.3390/foods13142271
Chicago/Turabian StyleLi, Zijian, Yanting Jiang, Muhammad Khan, Bai Xue, Xiaoqi Zhao, Binlong Fu, Weijuan Li, Baiji Danzeng, Xiaojun Ni, Qingyong Shao, and et al. 2024. "Dietary Energy and Protein Levels Influence the Mutton Quality and Metabolomic Profile of the Yunshang Black Goat" Foods 13, no. 14: 2271. https://doi.org/10.3390/foods13142271