Article

A Preliminary Study on the Effect of Adding Sugarcane Syrup on the Flavor of Barley Lager Fermentation

1
College of Light Industry and Food Engineering, Guangxi University, Nanning 530004, China
2
Provincial and Ministerial Collaborative Innovation Center for Sugar Industry, Nanning 530004, China
3
Engineering Research Center for Sugar Industry and Comprehensive Utilization, Ministry of Education, Nanning 530004, China
4
Guangxi Institute of Industrial Technology, Nanning 530001, China
*
Author to whom correspondence should be addressed.
Foods 2024, 13(15), 2339; https://doi.org/10.3390/foods13152339
Submission received: 27 June 2024 / Revised: 18 July 2024 / Accepted: 23 July 2024 / Published: 25 July 2024

Abstract

:
This study focuses on the diversified utilization of the sugarcane industry, and sugarcane syrup, as a by-product of the sugarcane industry, is a good raw material for fermentation. Bringing sugarcane syrup into beer is conducive to the enrichment of the sugar industry, and it can improve the flavor of beer and make it more aromatic. This study determined the optimal fermentation process for beer. By analyzing the consumption rate of the carbon and nitrogen sources of raw materials, the nutrient utilization of yeast, and the causes of differences in flavor substances, the flavor composition and flavor stability of beer were determined by SPME-HS-GC-MS technology. The results showed that beer brewed with sugarcane syrup as an auxiliary raw material met the basic specifications of beer. The addition of sugarcane syrup to the wort base increased the utilization of amino acids by the yeast, and LS (lager with added cane syrup) increased the nine flavor compounds of the beer, which constituted the basic flavor of the beer, bringing new flavor compounds compared with the normal all-barley beer. Forced aging experiments showed that LS produced fewer aging compounds than OWBL. Various experiments have shown that it is feasible to ferment beer with sugarcane syrup instead of partial wort.

1. Introduction

Lager beer is one of the world’s oldest and most commonly consumed alcoholic beverages. It is made from barley wort fermented by yeast at 10–15 °C [1]. The final aroma composition of the beer depends on the materials required for brewing and the parameters of the brewing process [2]. Volatile components in beer have a much greater impact on flavor profiles than in other alcohols [3]. Also, the detection of volatile substances is an important part of the process of the comprehensive evaluation of lager quality [4] and is the most intuitive way to analyze lager quality. Gas chromatography–mass spectrometry (GC-MS) coupled with headspace solid-phase microextraction (HS-SPME) has been widely used for the study of beer aroma [5], and electronic noses (e-noses) equipped with a series of electrochemical sensors have been shown to provide a comprehensive odor assessment [6]. Also, gas chromatography (GC) can be used to determine beer aging components. Studies have shown that carbonyl compounds are the main component of the “aging” taste of beer [7]. This means that measuring the amount of change in carbonyl compounds during the aging of beer is an important measure of flavor stability.
Unfavorable growing conditions for barley in some parts of the world (including those attributable to climate change) have led lager producers to use more versatile local raw materials to replace barley in conventional recipes. These materials are called adjuncts [8]. Syrup is one of the most commonly used liquid adjuncts. The use of syrup in lagers results in a lower production cost and a shorter fermentation cycle [9]. This fermentation has also been associated with altered (abnormal) patterns of sugar uptake and altered production of some flavor compounds [10].
China is one of the main sugarcane-producing countries, and Guangxi is the main sugarcane-growing area in China, accounting for more than 60% of China’s planting area. In the sugar production process, sugar cane is pressed into juice and then heated and concentrated to produce sugar cane syrup (sugar content 65–68°BX). Sugar cane syrup is rich in nutrients and is a quality brewing ingredient [11]. Sugarcane syrup is rich in amino acids, and its amino acid composition is different from that of wort. Changes in nutrient content can trigger different yeast reactions to produce beers with different flavors [2]. Sugar cane also contains many types of higher alcohols, which give beer a greater variety of flavor substances [6]. Moreover, studies have shown that sugarcane syrup contains a large number of polyphenolic components, including phenolic acids, flavonoids, and quinones [12], which have antioxidant properties. It is assumed that the polyphenolic components in sugarcane syrup can inhibit the oxidation of unsaturated fatty acids, isorhythmic ketones, higher alcohols, and other substances to form aldehydes and produce an “aging odor” [13]. Carbonyl compounds cause flavor changes in many foods, including milk, butter, vegetables, and oils. In 1966, Japanese researchers first found a significant increase in volatile carbonyl compounds in beer during storage and found that the increase in the aging flavor of stored beer coincided with an increase in the concentration of carbonyl compounds [14].

2. Materials and Methods

2.1. Experimental Material

Saccharomyces cerevisiae var. diastaticus with the trade name “BF 16” from Angie’s Yeast Company (China) was used for wort fermentation. The yeast was purchased as a solid fermenter, and the initial concentration of the medium after activation was 9 × 10⁷ cells/mL. The yeast liquid was added at 1% of the total wort volume according to the manufacturer’s recommendations. The yeast strain used was low flocculating and highly fermentable (76–80%) with an optimal fermentation temperature of 10–14 °C.
The materials for this study were three variants of Chinese lager: ordinary whole barley lager (OWBL), lager with added cane syrup (LS), commercially available lager 1 (CAL1), and commercially available lager 2 (CAL2). Ingredients include barley malt, wheat malt, light caramel malt, Munich malt, and red malt. All malts were sourced from Jinan Shuangmai Company (Jinan, Shandong, China). Citra (Qingdao, Shandong, China) and Cascade hops (Portland, OR, USA) were purchased from Guangzhou Dejussi Trading Company Limited (Guangzhou, China). Sugarcane syrup (Guangxi Baiguitang Co., Ltd., Chongzuo, Guangxi, China) was also added during the production process. The sugarcane syrup added during the production process was different from the traditional syrup made by chemical methods; after being pressed from sugarcane into sugarcane juice, it was pressed through a 50 nm membrane, which was evaporated and the filtrate was concentrated to 60–65°BX.

2.2. Physicochemical Parameters

The pH of finished beer was measured using a precision pH meter pH-3C. The extract content was measured at 20 °C using an Abbe refractometer, residual sugar was measured by DNS colorimetry [15], acidity was measured by sodium hydroxide titration, and the color of the beer was measured by a spectrophotometer at a wavelength of 420 nm. These measurements were repeated three times.

2.3. Determination of Bittering Value of Beer

After the beer was degassed, 10 mL of degassed beer was acidified by adding 0.5 mL of 6 mol/L hydrochloric acid and then 20 mL of iso-octane, extracted by oscillation, centrifuged, and the absorbance was measured at 275 nm using a UV-visible spectrophotometer (Agilent 8453, Agilent, Santa Clara, CA, USA) [16].
The content of bitter substances in beer was calculated by the following formula.
X = A275 × 50
where X is the content of bitter substances in the sample, expressed in units of “BU”; A275 is the absorbance of the sample measured at 275 nm; and 50 is the conversion factor.

2.4. Beer Sensory Appetite Experiment

Twenty students (male:female = 1:1) who were physically fit and had a good sense of smell and taste were randomly selected to participate in the sensory evaluation according to the scoring rules table. The specific evaluation criteria can be found in the Supplementary Information.

2.5. Determination of Fermentable Sugars

A high-performance liquid chromatographic method was used for the quantification of fermentable sugars in wort and beer fermentation broth by an external standard [17]. Detection methods: chromatographic column: NH2 Analytical HPLC Column (4.6 × 250 mm, 5 μm); column temperature: 35 °C; differential refractive index detector; detector temperature: 35 °C; mobile phase: 75% acetonitrile; flow rate: 1.0 mL/min; injection volume: 20 μL. Standard preparation: quantitative glucose, fructose, maltose, sucrose, and maltotriose standards were dissolved in ultrapure water for gradient dilution and passed through a 0.22 μm membrane. Sample pretreatment: The wort and beer fermentation broth were centrifuged at 7000 rpm and then passed through a 0.22 μm membrane.

2.6. Determination of Free Amino Acids

The beer fermentation broth was analyzed using an automated amino acid analyzer and quantified using the external standard method [18]. Sample treatment: the samples were diluted 5 times with 4% sulfosalicylic acid solution, left at 20 °C for 30 min, centrifuged, and the supernatant was filtered with 0.22 μm nylon 66 membrane.

2.7. Determination of Volatile Aroma Substances in Lager Beer

Electric nose: 1 mL of beer was diluted 10-fold and transferred into a sealed 100 mL conical flask and held at 25.0 °C ambient temperature for 60 min to allow the evaporation of volatile components. The volatile gas in the beaker was drawn into the sensor at a rate of 400 mL/min, and the computer recorded a time of 150 s. The sample was washed for 120 s before each measurement to remove the residual volatile gas and return the response value to the baseline state. The response value was selected from 145 to 150 s, and the average value was calculated. The measurement operation was repeated three times [19].
HS-SPME-GC-MS: HS-SPME conditions: a 5 mL glass vial containing 30 mL of beer sample was taken, 10 μL of 2-octanol at a concentration of 82.2 μg/mL was added as an internal standard, and the vial was closed with a cap with a PTFE cushion until analysis. 2-octanol was used as an internal standard, 2 g NaCl was added and rotated, and the vial was closed with a lid with a PTFE gasket until analysis. Equilibrium was achieved by pre-incubation for 10 min at 40 °C with magnetic stirring at 300 rpm. Experiments were conducted using a composite 50/30 m DVB/CAR/PDMS extraction head, and the head was aged for 20 min before each sample’s extraction to remove residues attached to the extraction head. The SPME fiber was extracted in the headspace of the sample for 40 min at 40 °C, then transferred to the injection port (230 °C) and left for 5 min for desorption before detection. The mixed standards were four alcohols: n-propanol, isoamyl alcohol, phenylethanol, and isobutanol. The standards were prepared as mixed standards and added to the internal standard injection, and their retention times and ion fragments were compared with those of the compounds in the samples. GC conditions: column: Agilent DB-Wax capillary column (60 m × 0.25 mm); carrier gas: helium, 99.999%; constant flow mode: 1.0 mL/min; etc. The temperature was initially 35 °C for 4 min, raised to 60 °C at 3 °C/min, held for 5 min, and finally raised to 230 °C for 15 min at 4 °C/min. The inlet temperature was 230 °C, and the sample was injected manually without splitting. The temperature was raised to 230 °C and finally held at 230 °C for 15 min. The inlet temperature was 230 °C, and the sample was injected manually without a split. MS conditions: ionization mode: EI; ionization energy: 70 eV; ion source temperature: 230 °C; quadrupole temperature: 150 °C; transfer line temperature: 270 °C; scan mode: SCAN; mass scan range: 32 to 300 amu; no solvent delay [13,20].

2.8. Determination of Antioxidant Power of Beer

Determination of antioxidant power of beer: Take 0.5 mL of beer sample diluted twice, add 2.5 mL of 6.5 × 10⁻⁵ mol/L DPPH ethanol solution, and react for 1 h at room temperature, then dilute the reaction solution 4-fold and move to a spectrophotometer for colorimetric comparison at a wavelength of 517 nm, and then compare its absorbance [21].

2.9. Determination of Volatile Aging Substances

In this experiment, OWBL and LS were used as research subjects, while LS and OWBL without sugarcane juice were used as control samples for the forced aging experiments. The aging aroma substances were stored at 45 °C and protected from light for a period of 9 d, and were characterized by GC-MS [22]. Standards: 2-furaldehyde, glutaraldehyde, phenylacetaldehyde, benzaldehyde, acetaldehyde, isobutyraldehyde, 2-methylbutyraldehyde, 3-methylbutyraldehyde, and trans-dinonenal. According to the chromatographic peaks, transfer 0.5 mL of each of the anti-dinonenal according to the different preparation methods and neutralize with ethanol to 200 mL to produce a mixed standard first-class reserve solution. Take 10 mL of 5% ethanol solution (pH 4.6–4.7 with 0.1% phosphoric acid) as the base, and add 1 μL, 2 μL, 4 μL, 8 μL, 15 μL, and 25 μL of the primary reserve solution to produce the standard sample solution. A 65 μm (PDMS-DVB) SPME fiber extraction head was used. HS-SPME conditions: a dilute solution of PFBOA was prepared by mixing 100 μL (6 g/L) of PBFOA solution with 10 mL of water in 30 mL glass vials and sealed with PTFE gasketed lids, and each vial containing diluted PFBOA was first equilibrated for 5 min at 50 °C and 250 rpm. The PDMS-DVB fibers were exposed to the headspace of the diluted PFBOA for 10 min. The SPME fibers with PFBOA were exposed to the headspace of the beer samples and extracted at 50 °C and 250 rpm for 45 min. The fibers were resolved in the GC inlet for 5 min [23]. GC conditions: gas chromatography was performed on an Agilent DB-Wax capillary column (60 m × 0.25 mm × 0.25 µm); carrier gas: helium, 99.999%; constant-flow mode: 1.0 mL/min; column warming program: initial oven temperature was maintained at 40 °C for 10 min, 10 °C/min up to 140 °C for 10 min, and 5 °C/min up to 250 °C for 10 min. The temperature of the inlet port was 250 °C, and the sample was injected manually without splitting [14]. MS conditions: ionization mode: EI; ionization energy: 70 eV, ion source temperature: 230 °C, quadrupole temperature: 150 °C; conversion line set at 270 °C; mass range: m/z 50–350; scanning mode: 4.65 scans/s. Carbonyl PFBOA derivatives were identified and the m/z 181 fragment was identified as the major fragment, and all aldehyde analyses were performed in the single-ion monitoring (SIM) mode, monitoring the ion m/z 181. Beer was also analyzed by gas chromatography/mass spectrometry (GC/MS) without PFBOA derivatization [24].

2.10. Methods of Data Analysis

Data were processed and plotted using Excel, SPSS 24.0, Xcalibur 4.0, and Origin 9.0.
Experimental GC-MS data of the samples were processed using Xcalibur 4.0 software and compared by computerized search and spectral library. The mixed C8–C40 standards were analyzed under the same GC-MS conditions and the retention indices (RIs) of the components to be measured were calculated according to the following equation.
Retention index
RI = 100z + 10 [TR(x) − TR(z)] TR(z + 1) − TR] RI = 100z + 10 [TR(x) − TR(z)] TR(z + 1) − TR
TR(x): retention time of the component to be measured;
TR(z): Retention time of n-alkanes with carbon atom number z;
TR(z + 1): Retention time of n-alkanes with z + 1 carbon atoms.

3. Results and Discussion

3.1. Influence of Process Parameters on the Finished Beer

In order to discuss the effects of wort concentration and sucrose syrup addition ratio on the indexes during beer fermentation, a brewing one-factor optimization experiment was carried out to ensure that other conditions were the same.
The above Table 1 compares all LSs brewed at different concentrations. The sugar cane juice and the wort itself were close in color, both being clear amber–yellow, and there was little difference in the appearance of gloss and color when comparing the different percentages of sugar juice added during the pre-fermentation period. The raw wort concentration had a significant effect on the alcohol, total acid, residual sugar, color, and bitterness values of the beers, which derived their bitterness mainly from hop resins and, to a much lesser extent, from non-hop components, such as bittering peptides, amino acids, and polyphenols produced during the brewing process [25]. Saccharomyces cerevisiae takes up the amino acids present in the wort, which they bring with them from the wort with an amino group so that they can be integrated into its own structure. The remaining amino acids (α-keto acids) enter into an irreversible chain reaction that culminates in the formation of the byproducts, higher alcohols [3]. A moderate amount of higher alcohol in beer will give it a rich, full-bodied feel, but if the level is too high, it will give the beer a serious “after-bitter” taste and cause the drinker to go “on the head”. Esters are the most important aroma substances produced by yeast. They have a very low odor threshold in beer and greatly determine the final aroma [26]. Beer produces organic acids under aerobic conditions, a pathway thought to be a byproduct of the tricarboxylic acid cycle [26]. As the amount of organic acids produced by this process increases, the taste of the beer develops an unpleasant “sourness” that degrades the quality of the beer [27].
As can be seen from the Table 2, the beer with 25% addition had the highest alcohol content of 7.2%, and the sugar cane beer with 30% and 50% addition had alcohol contents of 6.6% to 6.7%, with higher residual sugar contents of 9.25 g/L and 12.50 g/L, respectively. The yeast had limited metabolic capacity in the post-fermentation period (uncoordinated carbon-to-nitrogen ratio) and could not fully utilize the supplemented carbon source, resulting in a high residual sugar content in the beer. Experiments have shown that the addition of juice in the range of less than 25% has good fermentability and low residual sugar. The total acidity does not correspond quantitatively with the pH value because the beer contains a lot of H+ in a non-free state. With a sugar cane juice pH of 5.13 and the addition of 5% to 25% juice, the total acidity of the beer ranged from 1.53 to 1.67 mL/100 mL, which was lower than the 1.96 mL/100 mL of OWBL, and exceeding 25% juice addition increase the acidity of the beer. From the table, it seems that the amount of juice addition was not linearly related to the bitterness value and color of the beer, which were related to the fermentation metabolic state of the brewer’s yeast. After the sensory panel tasting, the fruit aroma of the added sugar cane juice increased with the addition ratio; as the fruit aroma increased, the sweetness of the beer became stronger, and the corresponding hop flavor became lighter. Sugarcane syrup addition and advanced alcohol content were nonlinearly correlated. We were unable to determine the relationship between the amount of syrup added and the content of higher alcohols. When 20% sugar cane juice was added, the fruit aroma and hop aroma were more harmonious, and the taste was suitable. Comparing the different concentrations of LSs in the table, the raw wort concentration had a significant effect on the alcoholic strength, total acid, residual sugar, color value, and bitterness value of the beers. The bitterness value decreased with increasing concentration because the wort concentration affected the leaching of bitter substances from hops during boiling. As the wort concentration increased, the ethanol content of the brew increased, and the higher alcohol content also increased. Measuring the sensory data and the advanced alcohol content, the preference was higher for 10°P pale lager.
The fermentation cycle of pale lagers fermented at different temperatures varied, As expressed in Table 3. With the shortest fermentation time at 14 °C requiring only 6 d for primary fermentation (high-foam phase), while 8 °C and 12 °C required 8–12 d for primary fermentation. The higher the temperature, the better the utilization of the carbon source, and the lowest residual sugar was obtained, with a residual sugar content of 8.06 g/L for the beer at 14 °C and 11.28 g/L for the beer at 8 °C. The temperature had an effect on the production of higher alcohols in the beer. The fermentation at 8 °C was slow, and the highest residual sugar content was 11.28 g/L. Temperature had an effect on the production of higher alcohols in beer, and from the table, it can be seen that higher temperatures produced higher levels of higher alcohols than OWBLs. At the same time, the concentration of higher alcohols also increases, and too many higher alcohols reduce the quality of beer. Similarly, high fermentation temperatures can lead to the production of organic acids, which can reduce the quality of beer.

3.2. Determination of the Optimal Fermentation Process

The addition of hops can bring bitterness to the beer and enrich its flavor hierarchy. The bitterness of beer mainly comes from hop resins, and a small portion of it comes from non-hop components, such as bittering peptides, amino acids, polyphenols, and so on, during the brewing process, among which iso-alpha-acids contribute the most to the bitterness of beer [28]. And the addition of hops can clarify the wort by complexing and precipitating the proteins in the wort during the boiling process. Various concentrations of hops were added to each brew, and the sensory evaluation results showed that the bittering value of the beer was most acceptable in the range of 13–15, which corresponded to hops addition of 0.04%.
The eligible samples were selected for response orthogonal experiments, which required the basic indexes of brewing beer: the advanced alcohol value was between 50 and 120 mg/L, the normal value of diacetyl was between 0 mg/L and 0.1 mg/L, the acidity was ≤2.6 mg/100 mL, the mass fraction of carbon dioxide was above 3.5, and the alcohol content was ≥3.7%. In the sensory evaluation experiments, we found higher sensory evaluation scores for beers that better met the beer rating criteria, so we chose the total sensory tasting score as the only criterion for evaluating the quality of beer for the response surface experiments, and we conducted the response surface experiments with the wort concentration, the amount of syrup added, amount of hops added, and the fermentation temperature as the factors for the experimental experiments. (The sensory evaluation criteria can be found in the Supplementary Information). The results of the response orthogonal experiment are as Table 4:
According to the R values in Table 5, the main and secondary influences of individual factors on sensory evaluation are: D > A > B > C, i.e., hop addition > wine addition > wine concentration. That is to say, the amount of hop addition > the amount of juice addition > the concentration of original wort > the fermentation temperature. According to the K of each factor, the optimized condition is A2B2C2D2. According to the experimental verification, it was unanimously evaluated that 10°P LS had better color and taste, which meant that A2B2C2D2 was the optimal condition, which is in line with the results of the one-way experiment. A2B2C2D2 was concluded to be the optimal fermentation condition. The final results were: 10°P wort concentration as the base, addition of 20% sugarcane syrup, fermentation temperature of 12 °C, and an ale hops addition of 0.04%.
The basic physicochemical indexes of sugarcane lager beer and OWBL under the same conditions are listed in the following Table 6.

3.3. Changes in Substances during Fermentation

As the same fermentation conditions were used (different fermentation substrates (carbon and nitrogen sources)), the resulting beers had different basic indicators. The carbon and nitrogen sources directly influence the rate of yeast fermentation and the expression of the entire flavor profile of beer (alcohols, esters, aldehydes, and ketones), which in turn affect the overall flavor profile of beer [1]. The analysis of the fermentation substrate depletion in lagers is an essential step in judging the quality of lager beers. Two main changes occur during the fermentation of lager: the conversion of nitrogenous compounds and the fermentation of sugars. Other by-products are also produced along with these two changes.

3.3.1. Fermentable Sugars

Comparing the sugar consumption during the fermentation of normal beer and LS, the results of the sugar spectrum analysis for 10°P wort were 2.43 g/L for fructose, 8.39 g/L for glucose, 1.42 g/L for sucrose, 80.60 g/L for maltose, and 5.28 g/L for maltotriose. High-performance liquid-phase sugar analysis for 10°P sugarcane syrup juice raw material showed that the fructose content was 0.79 g/L, the glucose content was 0.63 g/L, and the sucrose content was 11.58 g/L. The main sugar in the sugarcane syrup was sucrose.
As shown in Table 7, yeast itself will preferentially utilize sucrose [29], which breaks down the non-reducing sugar (sucrose) in wort into one molecule of fructose and one molecule of glucose under the action of sucrose converting enzyme. The addition of sucrose from sucrose juice increases the amount of glucose, and glucose deterrence prevents the expression of the MAL gene (which affects the uptake of maltose and maltotriose) when the glucose concentration exceeds 1% and allows the yeast to fully utilize the glucose, with a small amount of fructose remaining at the end of fermentation; fructose is twice as sweet as sucrose per mole, and the higher the fructose residue, the sweeter the final beer product; 10°P LS has a lower maltose content than OWBL, and the addition of cane syrup results in a change in the ratio of sugars that causes the residual fructose and sucrose to rise.

3.3.2. Free Amino Nitrogen

Wort contains a large amount of nitrogenous substances, but not all of these substances are utilized by yeast in cellular metabolic pathways. Nitrogen-containing compounds in wort are mainly composed of free amino nitrogen, ammonia ions, and small molecular peptides (dipeptides and tripeptides), and yeast produces different volatile aromas due to the utilization of different ratios of amino acids, i.e., amino nitrogen is the main source of variations in aroma substances in beer.
The Table 8 shows the amino acid contents in LS, OWBL, wort, and sugarcane syrup. It can be inferred that LS has a higher and more comprehensive utilization of amino nitrogen as compared with OWBL. The amino nitrogen content of LS was significantly lower than that of normal whole-barley beer. It is hypothesized that this is due to the addition of sugarcane syrup at the fermentation stage altering the yeast metabolic pathway, allowing the yeast to newly utilize amino acids (e.g., histidine) that are not readily available in OWBL. LS utilizes amino acids at a higher rate than OWBL. Fewer amino acids remain, which makes LS less susceptible to contamination by spoilage bacteria that utilize amino acids for growth, such as lactobacilli and lactococci. Fruit juices contain 19 of the 20 essential amino acids (without cysteine), and just as wort utilizes sugar, the amino acids are taken up by yeast cells in the order in which they are taken up [30]. The amino acids of yeast are classified into two groups (a, b) based on the percentage of amino acids utilized by the yeast; the a group of amino acids is more readily utilized by the yeast and utilized in a higher percentage, and the b group of amino acids is utilized in a smaller percentage. It can be said that the addition of sugarcane syrup can promote the utilization of b-amino acids by yeast and change the fermentation pattern of yeast, thus producing different flavor substances.

3.4. Detection of Aroma Substances in Beer

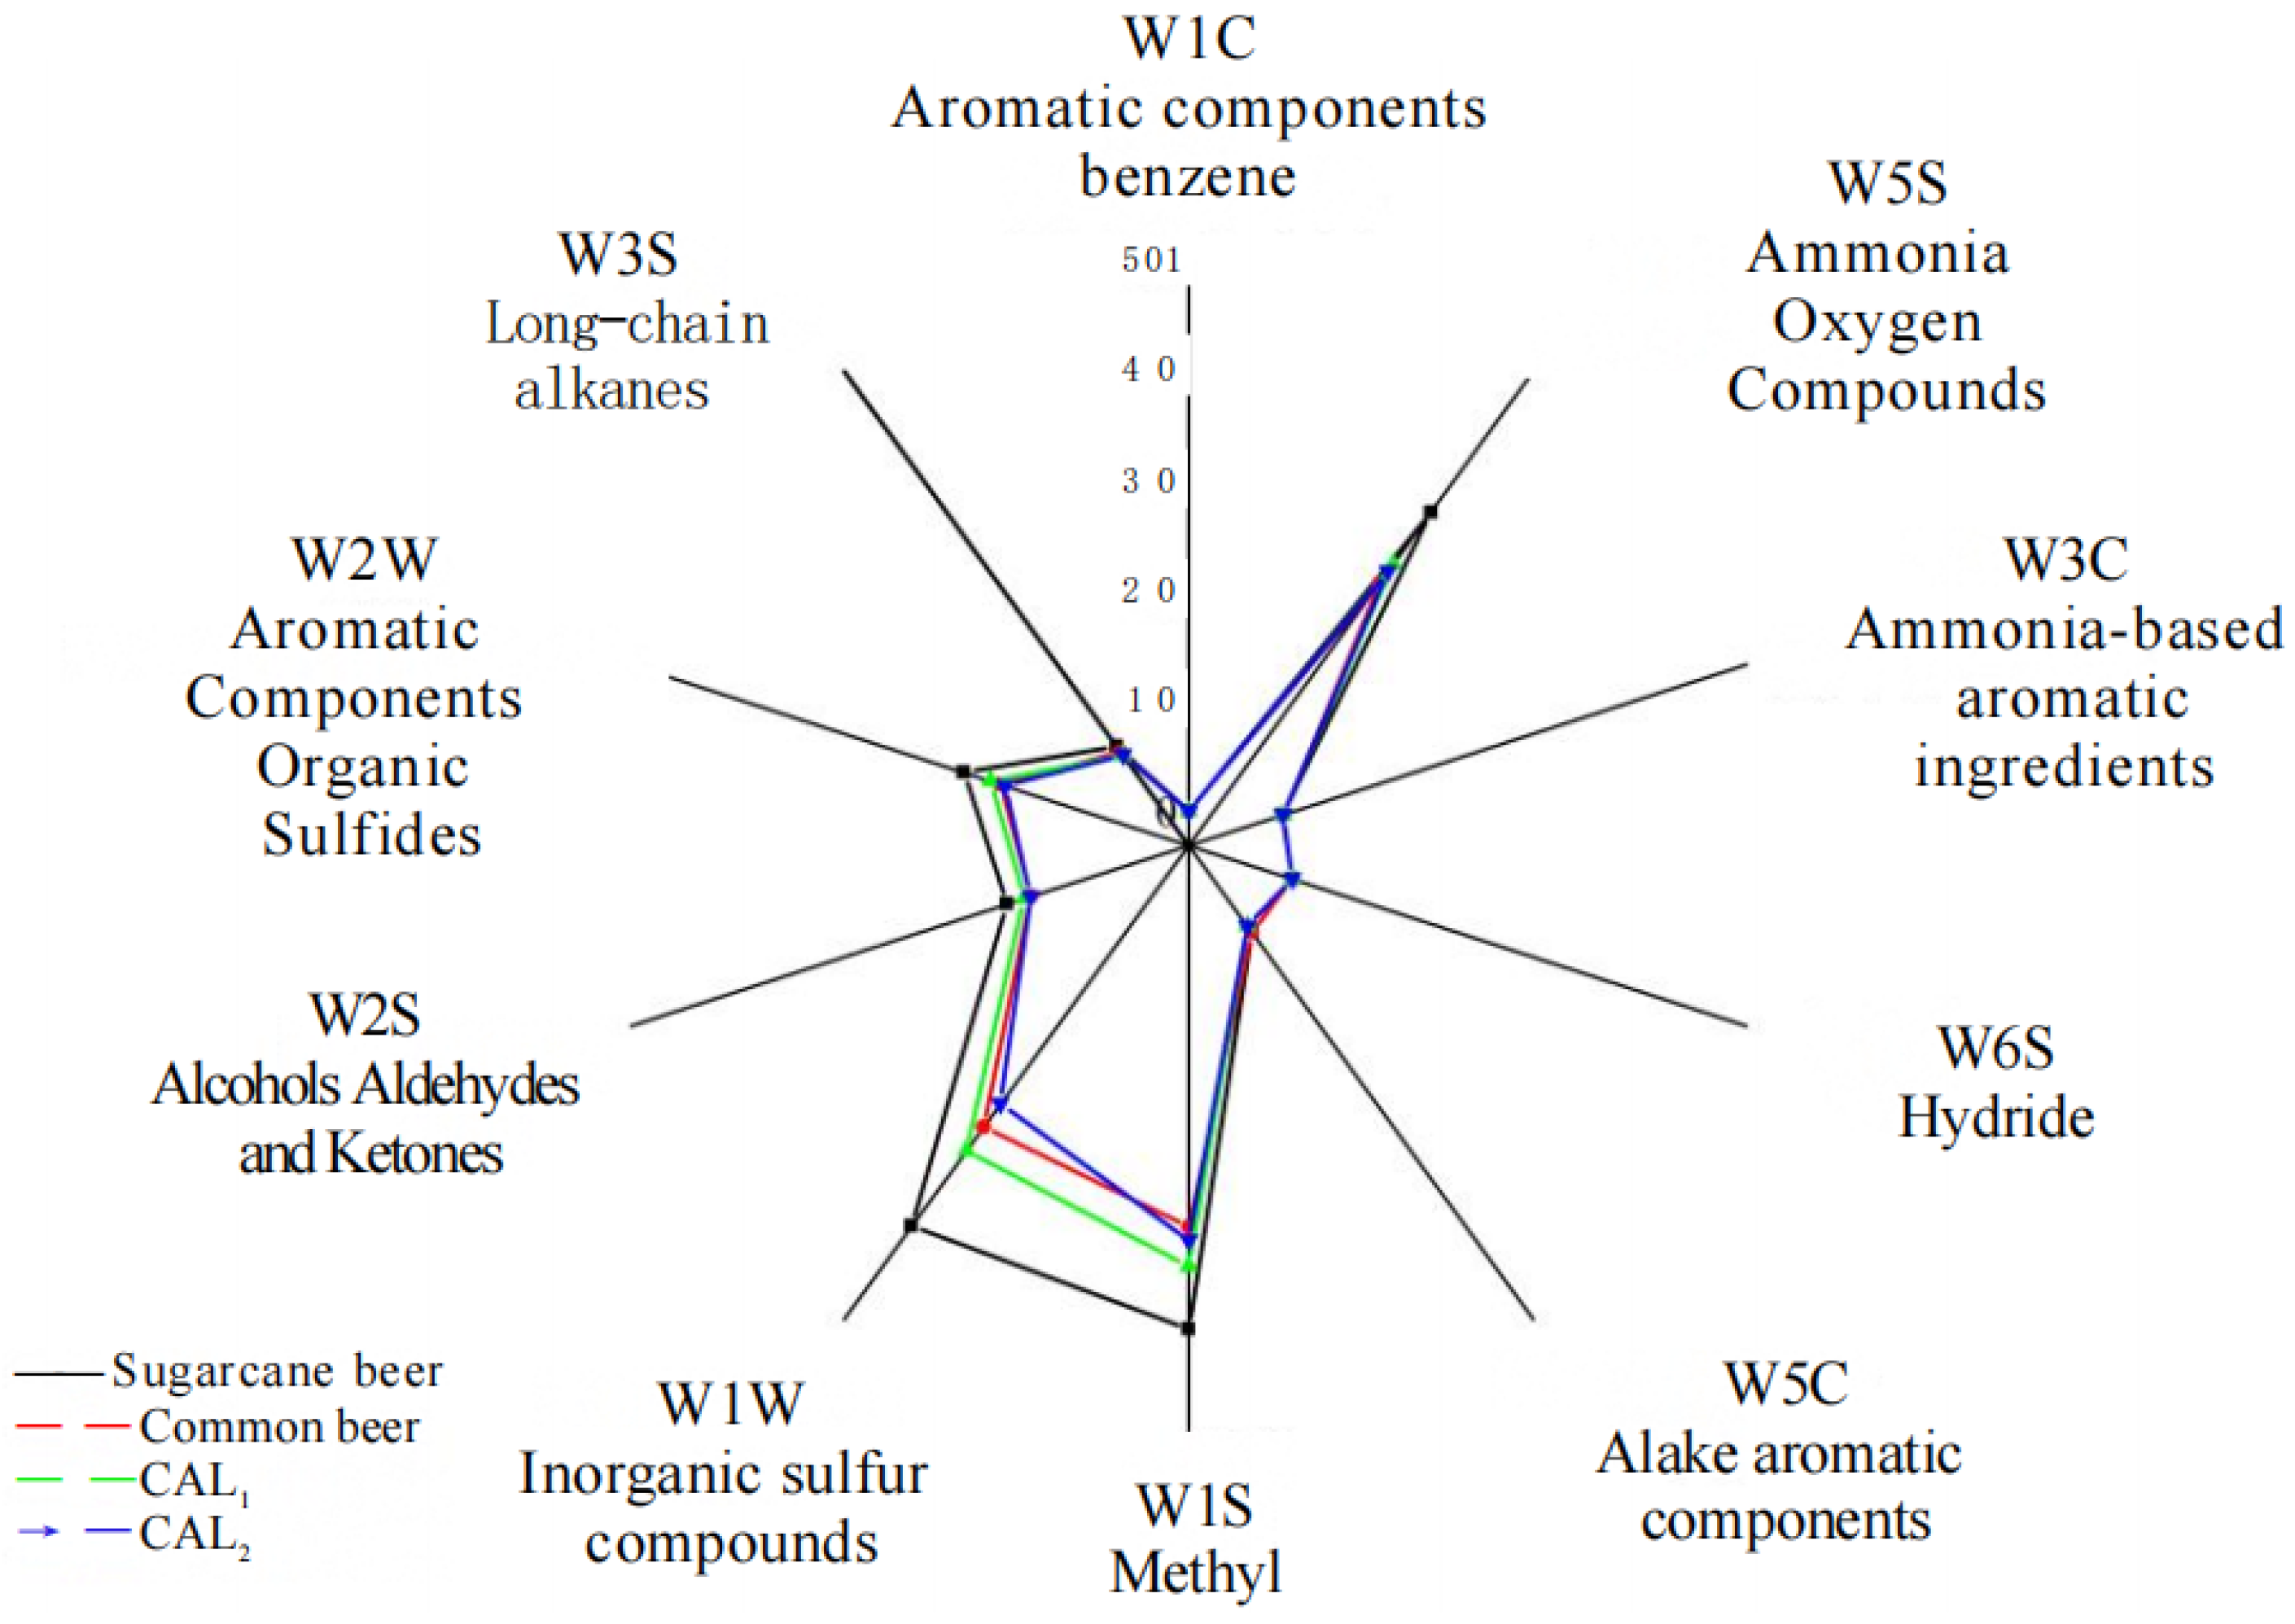
3.4.1. The Electronic Nose

Principal component analysis (PCA) and latent Dirichlet allocation (LDA) were chosen for the analysis of e-nose data, where beer has a wide variety of volatiles, and PCA was used to analyze different broad categories of flavor substances in lagers, while LDA was used to determine the variability of the broad categories of substances among beers.
From the figure, it can be seen that the contribution rates of the first and second principal components were 73.51% and 20.49%, respectively, and the total contribution rate was 94%, which can represent the characteristic information of the broad categories of volatiles of the samples. The flavor differences between the laboratory lager and the commercially available lagers were evident in PC2, while PC1 was close to that of the commercially available lager. The difference between PC1 and PC2 of the sugarcane lager and those of the ordinary and commercially available lagers was significant. This proves that the aroma of sugarcane lager is different from that of commercially available lager.
The aroma of sugarcane lager is different from that of commercially available lager and laboratory lager, which is mainly due to the different raw materials and fermentation processes, as represented in Figure 1. The direction chosen by PCA maintains maximum structure between data in lower dimensions, while the direction chosen by LDA achieves maximum separation between the given classes [30]. The LDA classification results are more representative of the variability than the PCA results. The data collection points of the same type of lager under the same conditions in the ellipse in Figure 1b represent the fingerprint profile of that product type, and the more dense data points represent the higher repetition rate of that sample. As can be seen from the figure, the contribution of LDA discriminant LD1 and LD2 for lager samples were 98.64% and 0.93%, respectively, and the total sum was 99.57%, which can represent all the characteristic information of the samples. The data collected from each type of lager samples were distributed in different areas without overlapping and far away from each other; this indicates that there were significant differences in odor. This indicates that there were differences in the flavor quality of lagers brewed from different raw materials.
As can be seen from the Figure 2, all the lighter samples had the highest response values for the three sensor types W5S, W1S, W1W, and W2W. The high response value for ammonia–oxygen compounds is due to the high sensitivity of the detector itself. The substances corresponding to inorganic sulfides in lager are sulfides, such as SO2, which is a metabolic product of yeast in the fermentation process. The amount of SO2 produced is related to the yeast strain, wort concentration, and fermentation process [31]. The high response value of the corresponding methyl group sensor in the figure is mainly due to the high content of 2-methyl sulfide substances in lager. In nature, 2-methyl sulfide is often produced by the decomposition of proteins and has a “green” and “fruity” aroma, i.e., sugarcane syrup can provide lager a high “green” and “fruity” aroma, and “fruity” aroma.

3.4.2. GC-MS

There were a total of 77 compounds in the GC-MS assay, and the beer compounds detected by GC-MS were divided into three categories: compounds with no significant difference, compounds with more LS than OWBL, and compounds with less LS than OWBL, which were added to the commercially available beer assay to test for volatiles of roughly the same composition as the commercially available beer. The reason for adding the commercially available beer was to test the volatiles to ensure that the brewing process was approximately the same as the commercially available pale lager. In this experiment, substances specific to a single commercially available lager were ignored, thus minimizing the effects of the use of different hop types and different fermentation processes, as well as different flavor substances produced by different brewing yeasts. The results are shown in Table 9.
It is the aroma profile of the LS that is illustrated in Table 9. The combination of GC-MS and an electronic nose can only characterize the composition of the flavor substances in beer and determine its flavor components. The characteristic aroma varies from lager to lager, and this aroma comes partly from the aroma of the raw materials and adjuncts themselves and partly from the yeast or metabolites produced during their fermentation. There are a total of 77 compounds in Table 9, and 51 substances were detected in sugarcane lager. Fifty-two compounds were found to be the same in the two commercially available lagers compared, of which esters and alcohols accounted for 80%, indicating that in sugarcane lager, alcohols and esters constitute the basic flavor; thirty-two compounds were common to the four lagers, and eleven substances were unique to sugarcane lager compared with the other three lagers, namely camphor, carbonochl, ethyl(E) cinnamate, acetophenone, 4-ethylbenzaldehyde, cyclododecane, ethyl myristate, m-phthalaldehyde, phenethyl camphor, carbonochl, and ethyl(E) cinnamate, which were found to be contained in the sugarcane syrup itself after comparison with the sugarcane syrup and wort components. These are the flavor substances of the sugarcane syrup itself and the flavor substances obtained by yeast fermentation of the sugarcane syrup. At the same time, compared with commercially available whole-barley lagers, laboratory whole-barley lagers produce unique substances, such as 2-acetylpyrrole, gamma-nonanolactone, etc. These substances can be considered to be produced by the overfermentation of wort by yeast under laboratory conditions, but they are not present in laboratory sugarcane lagers, and the possible reason for this analysis is because brewer’s yeast can produce substances such as acetophenone by the joint action of wort and sugarcane syrup, but it is not possible to conclude that acetophenone, 4-ethylbenzaldehyde, cyclododecane, ethyl myristate, m-phthalaldehyde, phenethyl hexanoate, methanone, (4-ethylphenyl)phenyl-, and ethyl palmitate are produced by the yeast metabolism of sugarcane syrup or by yeast synergism of sugarcane syrup and wort. It is presumed that it is mainly produced by the yeast using amino acids (such as histidine) that are not readily available in the post-fermentation stage, combined with the sugar in the sugar cane syrup.

3.5. Determination of Lager Aging Characteristic Aroma

The comparison of aldehydes in lagers before and after aging is shown in Table 10: 2-furaldehyde, acetaldehyde, isobutyraldehyde, glutaraldehyde, phenylacetaldehyde, and 3-methylbutyraldehyde. 2-Furaldehyde was the main heat load indicator and was not detected in commercially available lager, sugar cane lager, or OWBL before aging, while 2-furaldehyde increased to varying degrees in all lagers after aging, which can be attributed to residual carbohydrate reactions, with sugar cane lager having significantly lower residual sugar than OWBL, which had the lowest production of furfuraldehyde. From the data in the table, it can be seen that the degree of accumulation of 2-furaldehyde in sugarcane lager was lower than those of OWBL and commercially available lager, i.e., sugarcane lager had a higher level of resistance to aging than ordinary lager, which contributed to its flavor stability. However, in an experiment to measure the antioxidant power of beer, we found that the antioxidant power of LS was about 10% lower than that of OWBL. It is hypothesized that this was due to the fact that the free amino acid residue at the completion of fermentation of LS was smaller than that of OWBL, resulting in a weaker oxidation of amino acids. The increase in phenylacetaldehyde in sugarcane lager from 1.861 µg/L to 10.744 µg/L was higher due to Strecker degradation of amino acids to form aldehydes, such as 2-methylpropionaldehyde (isobutyraldehyde) and phenylacetaldehyde [32]. But, whether it is the effect of sugarcane syrup remains to be studied. The increase in glutaraldehyde during lager aging is then due to the autoxidation of linoleic acid. During forced aging, the fruity aroma of the lager gradually fades at first and the hops flavor gradually disappears, followed by a strong “currant flavor” and “soy sauce flavor”, and the longer the aging time, the heavier the “currant flavor”. Saison [33] described the aging flavors after sensory panel evaluation as “cardboard taste”, “metallic taste”, solvent taste”, “old hops taste”, “cool chestnut taste”, “merlot taste”, “thioether taste ”, “acetaldehyde” (“green apple”), and “white wine”. The main substance of “cardboard flavor” is trans-2-nonenal (T2N) [23], but it was not detected in the present study. Some researchers have suggested that aging flavors differ by lager type [34], and the “cardboard taste” in lagers is not the only characteristic aging taste of lager.

4. Conclusions

The present study was a preliminary investigation of the effect of brewing lager beer with sugarcane syrup instead of some malt on the quality of the resulting beer. The optimal fermentation process for sugarcane beer was confirmed by one-way and orthogonal experiments, and it was found that the effect of syrup addition on the organoleptic flavor of the beer was smaller than that of hops addition, and larger than that of fermentation temperature and wort concentration. Analysis of the fermentation process showed that the beer with partial replacement of wort with sugarcane syrup had a higher utilization of free amino nitrogen and more complete fermentation. The experiments showed that sugarcane lager flavor substances constituted the basic flavor of lager beer, while because of the different ratio of amino acids, some flavor substances in sugarcane lager beer had differentiation from OWBL.
Volatile aldehydes are the most intuitive indicator for evaluating the quality and degree of aging of lagers, but judging the quality and aging rate of lagers by volatile matter is incomplete. Although lagers with sucrose syrup as an adjunct in volatile content detection have unique flavor substances and higher flavor stability compared with whole-barley lagers, the specific mechanism of sucrose syrup’s effect on the fermentation of lagers is not yet clear, and the research direction brought by sucrose syrup as an adjunct to lager beer is still extensive. In addition to the detection of volatile substances, it is necessary to determine the mechanism by which sugarcane syrup promotes yeast utilization of amino acids that are not readily available and to comprehensively evaluate the quality of lagers with sugarcane syrup as an adjunct so that sugarcane, a saccharide, can be used in a more diverse range of products.

Supplementary Materials

The following supporting information can be downloaded at: https://www.mdpi.com/article/10.3390/foods13152339/s1. 1. Purpose of this study. 2. Beer fermentation process. 3. Sugarcane syrup production method. Table S1: Sources of production of commercially available beer. Table S2: Sources of raw materials for beer brewing. Table S3: Sensory evaluation table of sugarcane beer.

Author Contributions

H.L.: Data curation, Writing—original draft, Writing—review and editing, Investigation, Formal analysis. Y.J.: Methodology, Investigation, Formal analysis. C.L.: Data curation, Validation, Formal analysis, Investigation. C.X.: Conceptualization, Resources. Project administration, K.L.: Supervision, Project administration, Funding acquisition. F.H.: Conceptualization, Methodology, Resources. J.X.: Conceptualization, Data curation, Validation. K.H.: revised, Validation. All authors have read and agreed to the published version of the manuscript.

Funding

Guangxi Science and Technology Program (Item Number: AA22117015), Guangxi Science and Technology Agency.

Institutional Review Board Statement

Ethical review and approval were waived for this study due to the experiment does not require ethical approval, all the beer samples are not dangerous to the subjects, its in compliance with all Food Regulatory Agency regulations, and food safety testing has shown those samples to be safe.

Informed Consent Statement

Informed con-sent was obtained from all subjects involved in the study.

Data Availability Statement

The original contributions presented in the study are included in the article/Supplementary Materials, further inquiries can be directed to the corresponding author.

Conflicts of Interest

The authors declare that they have no conflicts of interest.

References

  1. Lin, C.L.; García-Caro, R.D.L.C.; Zhang, P.; Carlin, S.; Gottlieb, A.; Petersen, M.A.; Vrhovsek, U.; Bond, U. Packing a Punch: Understanding How Flavours Are Produced in Lager Fermentations. FEMS Yeast Res. 2021, 21, foab040. [Google Scholar] [CrossRef]
  2. Pires, E.J.; Teixeira, J.A.; Brányik, T.; Vicente, A.A. Yeast: The Soul of Beer’s Aroma—A Review of Flavour-Active Esters and higher alcohols Produced by the Brewing Yeast. Appl. Microbiol. Biotechnol. 2014, 98, 1937–1949. [Google Scholar] [CrossRef] [PubMed]
  3. Gasiński, A.; Kawa-Rygielska, J.; Szumny, A.; Czubaszek, A.; Gąsior, J.; Pietrzak, W. Volatile Compounds Content, Physicochemical Parameters, and Antioxidant Activity of Beers with Addition of Mango Fruit (Mangifera indica). Molecules 2020, 25, 3033. [Google Scholar] [CrossRef] [PubMed]
  4. Inui, T.; Tsuchiya, F.; Ishimaru, M.; Oka, K.; Komura, H. Different Beers with Different Hops. Relevant Compounds for Their Aroma Characteristics. J. Agric. Food Chem. 2013, 61, 4758–4764. [Google Scholar] [CrossRef]
  5. Lehnhardt, F.; Becker, T.; Gastl, M. Flavor Stability Assessment of Lager Beer: What We Can Learn by Comparing Established Methods. Eur. Food Res. Technol. 2020, 246, 1105–1118. [Google Scholar] [CrossRef]
  6. Wang, L.; Wang, P.; Deng, W.; Cai, J.; Chen, J. Evaluation of Aroma Characteristics of Sugarcane (Saccharum officinarum L.) Juice Using Gas Chromatography-Mass Spectrometry and Electronic Nose. LWT 2019, 108, 400–406. [Google Scholar] [CrossRef]
  7. Wang, H.M.; Ding, C.H. Application of Syrup in Beer Brewing. Liquor. Mak. Sci. Technol. 2004, 03, 58–60. [Google Scholar] [CrossRef]
  8. Dabija, A.; Ciocan, M.E.; Chetrariu, A.; Codină, G.G. Maize and Sorghum as Raw Materials for Brewing: A Review. Appl. Sci. 2021, 11, 3139. [Google Scholar] [CrossRef]
  9. Bogdan, P.; Kordialik-Bogacka, E. Alternatives to Malt in Brewing. Trends Food Sci. Technol. 2017, 65, 1–9. [Google Scholar] [CrossRef]
  10. Piddocke, M.P.; Kreisz, S.; Heldt-Hansen, H.P.; Nielsen, K.F.; Olsson, L. Physiological Characterization of Brewer’s Yeast in High-Gravity Beer Fermentations with Glucose or Maltose Syrups as Adjuncts. Appl. Microbiol. Biotechnol. 2009, 84, 453–464. [Google Scholar] [CrossRef]
  11. Asikin, Y.; Wada, K.; Imai, Y.; Kawamoto, Y.; Mizu, M.; Mutsuura, M.; Takahashi, M. Compositions, Taste Characteristics, Volatile Profiles, and Antioxidant Activities of Sweet Sorghum (Sorghum bicolor L.) and Sugarcane (Saccharum officinarum L.) Syrups. Food Meas. 2018, 12, 884–891. [Google Scholar] [CrossRef]
  12. Feng, S.; Luo, Z.; Zhang, Y.; Zhong, Z.; Lu, B. Phytochemical Contents and Antioxidant Capacities of Different Parts of Two Sugarcane (Saccharum officinarum L.) Cultivars. Food Chem. 2014, 151, 452–458. [Google Scholar] [CrossRef] [PubMed]
  13. Xu, K.; Guo, M.; Du, J.; Zhang, Z. Cloudy barley Beer Enriched with Okra [Abelmoschus esculentus (L.) Moench]: Effects on Volatile Compound and Sensorial Attributes. Int. J. Food Prop. 2018, 21, 289–300. [Google Scholar] [CrossRef]
  14. Vesely, P.; Lusk, L.; Basarova, G.; Seabrooks, J.; Ryder, D. Analysis of Aldehydes in Beer Using Solid-Phase Microextraction with On-Fiber Derivatization and Gas Chromatography/Mass Spectrometry. J. Agric. Food Chem. 2003, 51, 6941–6944. [Google Scholar] [CrossRef] [PubMed]
  15. Du, R.; Guo, W.; Shen, Y.; Dai, J.; Zhang, H.; Fu, M.; Wang, X. In Situ Assay of the Reducing Sugars in Hydrophilic Natural Deep Eutectic Solvents by a Modified DNS Method. J. Mol. Liq. 2023, 385, 122286. [Google Scholar] [CrossRef]
  16. Hahn, C.D.; Lafontaine, S.R.; Pereira, C.B.; Shellhammer, T.H. Evaluation of Nonvolatile Chemistry Affecting Sensory Bitterness Intensity of Highly Hopped Beers. J. Agric. Food Chem. 2018, 66, 3505–3513. [Google Scholar] [CrossRef] [PubMed]
  17. Castro, L.F.; Affonso, A.D.; Lehman, R.M. Impact of Specialty Malts on Wort and Beer Characteristics. Fermentation 2021, 7, 137. [Google Scholar] [CrossRef]
  18. Yang, Y.; Chang, L.; Lu, Y.; Yang, L. Analysis of Amino Acids in Foodstuff by Nuclear Magnetic Resonance. In Proceedings of the 2010 3rd International Conference on Biomedical Engineering and Informatics, Yantai, China, 16–18 October 2010; IEEE: Yantai, China, 2010; pp. 750–754. [Google Scholar]
  19. Men, H.; Shi, Y.; Fu, S.; Jiao, Y.; Qiao, Y.; Liu, J. Mining Feature of Data Fusion in the Classification of Beer Flavor Information Using E-Tongue and E-Nose. Sensors 2017, 17, 1656. [Google Scholar] [CrossRef] [PubMed]
  20. Molina-Calle, M.; Priego-Capote, F.; Luque De Castro, M.D. Headspace−GC–MS Volatile Profile of Black Garlic vs Fresh Garlic: Evolution along Fermentation and Behavior under Heating. LWT 2017, 80, 98–105. [Google Scholar] [CrossRef]
  21. Gaulejac, N.S.-C.; Provost, C.; Vivas, N. Comparative study of polyphenol scavenging activities assessed by different methods. J. Agric. Food Chem. 1998, 47, 425–431. [Google Scholar] [CrossRef]
  22. Aguiar, D.; Pereira, A.C.; Marques, J.C. Assessment of the Prediction Power of Forced Ageing Methodology on Lager Beer Aldehyde Evolution during Maritime Transportation. Molecules 2023, 28, 4201. [Google Scholar] [CrossRef]
  23. Ortiz, R.M. Analysis of Selected Aldehydes in Packaged Beer by Solid-Phase Microextraction (SPME)–Gas Chromatography (GC)–Negative Chemical Ionization Mass Spectrometry (NCIMS). J. Am. Soc. Brew. Chem. 2015, 73, 266–274. [Google Scholar] [CrossRef]
  24. Ojala, M.; Kotiaho, T.; Siirilä, J.; Sihvonen, M.L. Analysis of aldehydes and ketones from beer as O-(2,3,4,5,6-pentafluorobenzyl)hydroxylamine derivatives. Talanta 1994, 41, 1297–1309. [Google Scholar] [CrossRef] [PubMed]
  25. Vilela-Moura, A.; Schuller, D.; Mendes-Faia, A.; Silva, R.D.; Chaves, S.R.; Sousa, M.J.; Côrte-Real, M. The Impact of Acetate Metabolism on Yeast Fermentative Performance and Wine Quality: Reduction of Volatile Acidity of Grape Musts and Wines. Appl. Microbiol. Biotechnol. 2011, 89, 271–280. [Google Scholar] [CrossRef] [PubMed]
  26. Meilgaard, M. Hop Analysis, Cohumulone Factor, and the Bitterness of Beer: Review and Critical Evaluation. J. Inst. Brew. 1960, 66, 35–50. [Google Scholar] [CrossRef]
  27. Černá, S.; Benešová, K. Stanovení Organických Kyselin ve Speciálních Pivech A Nápojích Na Bázi Piva Pomocí Kapilární Izotachoforézy. Chem. Listy 2023, 117, 516–521. [Google Scholar] [CrossRef]
  28. Dušek, M.; Olšovsk, J.; Krofta, K.; Jurková, M.; Mikyska, A. Qualitative Determination of β-Acids and Their Transformation Products in Beer and Hop Using HR/AM-LC-MS/MS. J. Agric. Food Chem. 2014, 62, 7690–7697. [Google Scholar] [CrossRef] [PubMed]
  29. Meneses, F.J.; Henschke, P.A.; Jiranek, V. A Survey of Industrial Strains of Saccharomyces cerevisiae Reveals Numerous Altered Patterns of Maltose and Sucrose Utilisation. J. Inst. Brew. 2002, 108, 310–321. [Google Scholar] [CrossRef]
  30. Hambraeus, G.; Nyberg, N. Enzymatic Hydrogenation of Trans-2-Nonenal in Barley. J. Agric. Food Chem. 2005, 53, 8714–8721. [Google Scholar] [CrossRef]
  31. Bushnell, S.E.; Guinard, J.-X.; Bamforth, C.W. Effects of Sulfur Dioxide and Polyvinylpolypyrrolidone on the Flavor Stability of Beer as Measured by Sensory and Chemical Analysis. J. Am. Soc. Brew. Chem. 2003, 61, 133–141. [Google Scholar] [CrossRef]
  32. Andersen, M.L.; Skibsted, L.H. Electron Spin Resonance Spin Trapping Identification of Radicals Formed during Aerobic Forced Aging of Beer. J. Agric. Food Chem. 1998, 46, 1272–1275. [Google Scholar] [CrossRef]
  33. Saison, D.; De Schutter, D.P.; Uyttenhove, B.; Delvaux, F.; Delvaux, F.R. Contribution of Staling Compounds to the Aged Flavour of Lager Beer by Studying Their Flavour Thresholds. Food Chem. 2009, 114, 1206–1215. [Google Scholar] [CrossRef]
  34. Vanderhaegen, B.; Neven, H.; Verachtert, H.; Derdelinckx, G. The Chemistry of Beer Aging—A Critical Review. Food Chem. 2006, 95, 357–381. [Google Scholar] [CrossRef]
Figure 1. Electronic nose fingerprints of laboratory lager and market lager. (a) Principal component analysis results; (b) LDA analysis results.
Foods 13 02339 g001
Figure 2. Electronic nose radar map of home-brewed lager in the laboratory and lager on the market.
Foods 13 02339 g002
Table 1. Effect of different sugarcane juice additions on fermentation of sugarcane beer (original wort of the beer is 12°P, fermentation at 12 °C).
Addition of Sugar Cane SyrupPhysical and Chemical Indicators Related to Sugar Cane Beer
Alcoholic Strength (%)Total Acidity (mL/100 mL)pHResidual Sugar (g/L)Color (EBC)Bitterness Value (BU)Senior Alcohol (mg/L)
OWBL (10°P)5.6 d ± 0.31.96 c ± 0.104.77 c ± 0.029.41 b ± 0.0213.35 bc ± 0.3219.8 a ± 1.0116.67 a ± 22.53
5%6.0 c ± 0.11.53 f ± 0.114.78 bc ± 0.019.55 b ± 0.0412.88 c ± 0.3618.0 b ± 0.594.39 b ± 18.64
10%6.5 b ± 0.11.53 f ± 0.114.77 bc ± 0.009.19 b ± 0.1313.61 b ± 0.1617.4 b ± 1.497.00 b ± 20.01
15%6.1 c ± 0.21.57 ef ± 0.034.78 bc ± 0.019.40 b ± 0.2112.78 c ± 0.2016.6 bc ± 0.9100.94 bc ± 19.05
20%6.2 c ± 0.11.63 de ± 0.014.80 b ± 0.017.65 c ± 1.2313.05 bc ± 0.6716.3 bc ± 0.5100.83 bc ± 24.56
25%7.2 a ± 0.11.67 d ± 0.034.61 d ± 0.008.72 b ± 0.0413.24 bc ± 0.2416.6 bc ± 1.2119.72 a ± 16.88
30%6.6 b ± 0.12.30 a ± 0.014.63 d ± 0.019.25 b ± 0.5113.04 bc ± 0.2115.4 c ± 0.6108.45 c ± 24.23
50%6.7 b ± 0.12.20 b ± 0.004.83 a ± 0.0112.50 a ± 0.5117.6 a ± 0.2013.6 d ± 0.9105.88 c ± 19.65
(Note: The data in this table are expressed as the mean (n = 3) ± standard deviation, using Duncan’s test, and the difference is significant if the superscript letters are different (p < 0.05)).
Table 2. Effect of different wort concentrations on fermentation of sugarcane beer (beer with 20% syrup addition, fermentation at 12 °C).
Wort ConsistencyPhysical and Chemical Indicators Related to Sugar Cane Beer
Alcoholic Strength (%)Total Acidity (mL/100 mL)pHResidual Sugar (g/L)Color (EBC)Bitterness Value (BU)Senior Alcohol
(mg/L)
6°P3.6 e ± 0.11.21 c ± 0.104.48 b ± 0.135.60 e ± 0.417.54 c ± 0.5917.1 a ± 0.192.32 a ± 17.75
8°P4.4 d ± 0.01.23 c ± 0.034.54 b ± 0.047.52 d ± 0.2310.40 bc ± 1.1315.6 b ± 0.097.67 a ± 20.54
10°P5.2 c ± 0.01.49 bc ± 0.414.62 ab ± 0.1010.13 c ± 0.4312.42 b ± 0.6614.2 c ± 0.1103.48 ab ± 25.12
12°P6.2 b ± 0.01.88 ab ± 0.124.73 a ± 0.0112.54 b ± 0.3013.65 b ± 0.4211.9 d ± 1.1106.35 ab ± 18.04
14°P7.2 a ± 0.02.19 a ± 0.244.63 ab ± 0.1015.41 a ± 0.6918.58 a ± 4.489.2 e ± 0.5119.2 b ± 18.91
OWBL (10°P)5.6 d ± 0.31.96 c ± 0.104.77 c ± 0.029.41 b ± 0.0213.35 bc ± 0.3219.8 a ± 1.0114.25 b ± 22.06
(Note: The data in this table are expressed as the mean (n = 3) ± standard deviation, using Duncan’s test, and the difference is significant if the superscript letters are different (p < 0.05)).
Table 3. Effect of different fermentation temperatures on fermentation of sugarcane beer (beer had a wort strength of 10°P and syrup addition of 20%).
TempPhysical and Chemical Indicators Related to Sugar Cane Beer
Alcoholic Strength (%)Total Acidity (mL/100 mL)pHResidual Sugar (g/L)Color (EBC)Bitterness Value (BU)Higher Alcohol
(mg/L)
10 °C5.3 b ± 0.01.60 b ± 0.014.82 a ± 0.0111.28 a ± 0.5114.3 b ± 0.3020.5 a ± 1.090.24 a ± 19.23
12 °C5.3 b ± 0.11.60 b ± 0.014.68 a ± 0.0110.13 b ± 0.2514.7 ab ± 0.3017.3 b ± 1.5109.15 b ± 18.69
14 °C5.7 a ± 0.01.80 a ± 0.104.86 a ± 0.018.06 c ± 0.3115.20 a ± 0.1019.05 ab ± 1.1124.49 c ± 22.72
(Note: The data in this table are expressed as the mean (n = 3) ± standard deviation, using Duncan’s test, and the difference is significant if the superscript letters are different (p < 0.05)).
Table 4. Orthogonal experimental factors and levels.
LevelFactors
Amount of Syrup Added (%)Wort Consistency (°P)Fermentation Temperature (°C)Hops Added (%)
110880.02
22010100.04
33012120.06
Table 5. Orthogonal experiment results.
Experiment NumberABCDSensory Evaluation
1111176
2122291
3133369
4212372
5223187
6231286
7313278
8321362
9332173
K1236226224236
K2245240236255
K3213228234203
k178.667 75.333 74.667 78.667
k281.667 80.000 78.667 85.000
k371.000 76.000 78.000 67.667
R10.667 4.667 4.000 17.333
Table 6. Final physical and chemical indicators for Ls and OWBL.
ProjectStandardsLSOWBL (10°P)
Alcoholic strength (%)10.1°P–11.0°P ≥ 3.74.9–5.34.7–4.9
Total acidity (mg/100 mL)10.1°P–14.0°P ≤ 2.61.0–2.01.6–2.4
Diacetyl (mg/L)≤0.100.070.09
CO2 (mass fraction)0.35–0.650.400.45
Higher alcohol (mg/L)50–120109.15105.42
Amount of hops added (%)Bitterness value
13 ≤ x ≤ 15
14.0114.9
Table 7. Measurement of the amount of fermentable sugars before and after fermentation.
Glucose (g/L)Fructose (g/L)Maltose (g/L)Sucrose (g/L)Maltotriose (g/L)
10°P Wort8.39 ± 0.262.43 ± 0.1180.6 ± 6.81.42 ± 0.025.28 ± 0.42
10°P Cane Juice0.63 ± 0.030.79 ± 0.05011.58 ± 1.350
10°P OWBL (mg/100 mL)0.68 ± 0.020.12 ± 0.013.07 ± 0.220.87 ± 0.030.29 ± 0.01
LS (10°P substrate) (mg/100 mL)1.22 ± 0.030.36 ± 0.012.62 ± 0.120.92 ± 0.120.38 ± 0.01
Table 8. Amount of change in free amino acids and available nitrogen sources before and after fermentation.
Amino Acid TypeLS (10°P Substrate) (mg/100 mL)10°P OWBL (mg/100 mL)Control Wort (mg/100 mL)Sugar Cane Juice (mg/100 mL)
Asp5.85 ± 0.477.22 ± 0.649.17 ± 0.7813.45 ± 1.04
Thr0.93 ± 0.042.13 ± 0.186.79 ± 0.472.92 ± 0.34
Ser1.91 ± 0.162.35 ± 0.286.88 ± 5.358.41 ± 0.96
Glu14.29 ± 1.548.03 ± 0.7813.24 ± 1.6481.56 ± 8.13
Gly2.96 ± 0.134.16 ± 0.313.88 ± 0.280.79 ± 0.04
Ala8.99 ± 0.6812.2 ± 1.5111.2 ± 1.677.35 ± 0.76
Cys0.24 ± 0.030.37 ± 0.020.54 ± 0.060.11 ± 0.01
Val2.54 ± 0.038.72 ± 0.7912.32 ± 1.365.25 ± 0.04
Met0.47 ± 0.042.12 ± 0.314.33 ± 0.420.64 ± 0.05
Ile0.76 ± 0.064.02 ± 0.367.54 ± 0.692.83 ± 0.29
Leu0.78 ± 0.087.12 ± 0.8216.60 ± 1.722.16 ± 0.23
Tyr6.06 ± 0.5310.78 ± 1.3212.96 ± 1.322.26 ± 0.19
Phe2.77 ± 0.3111.26 ± 1.4116.33 ± 1.752.12 ± 0.18
Lys0 ± 05.56 ± 0.5310.07 ± 0.990.79 ± 0.09
NH31.46 ± 0.142.56 ± 0.283.12 ± 0.350.68 ± 0.07
His1.49 ± 0.114.15 ± 0.405.61 ± 0.612.67 ± 0.19
Arg1.19 ± 0.098.49 ± 0.7211.7 ± 1.251.34 ± 0.13
Hyp1.53 ± 0.082.81 ± 0.197.94 ± 0.813.19 ± 0.27
Pro35.81 ± 2.6741.71 ± 5.9641.98 ± 3.783.16 ± 0.21
Table 9. Volatile components of homemade LS, OWBL, and market beer.
NOVolatile CompoundsRICASRelative Content (%)Aroma Characteristic
OWBLLSCAL1CAL2
1Acetaldehyde71075-07-00.082 a ± 0.014NQ0.031 b ± 0.006NQPungent, ethereal, aldehydic, fruity
2Isobutyl acetate997110-19-00.038 a ± 0.007NQ0.068 b ± 0.0140.141 c ± 0.020Sweet, fruity, ethereal, banana, tropical
3Ethyl valerate1118539-82-20.028 a ± 0.004NQNQNQSweet, fruity, apple, pineapple, green, tropical
42-Heptanone1126110-43-00.011 a ± 0.001NQNQNQFruity, spicy, sweet, herbal, coconut, woody
5Dipentene11407705-14-80.046 a ± 0.007NQ0.033 b ± 0.009NQCitrus, herbal, terpene, camphor
6Methylheptenone1295110-93-00.024 a ± 0.004NQNQ0.024 a ± 0.005Citrus, green, musty Lemongrass, apple
72-Nonanone1385821-55-60.045 a ± 0.0070.021 b ± 0.0040.026 b ± 0.0030.026 b ± 0.003Fresh, sweet, green, weedy, earthy, herbal
8Decanal1545112-31-21.152 a ± 0.3260.141 b ± 0.0030.187 b ± 0.0020.511 c ± 0.011Sweet, aldehydic, waxy, orange peel, citrus, floral
9Octanol1597111-87-50.895 a ± 0.178NQ0.791 a ± 0.1360.867 a ± 0.147Waxy, green, orange, aldehydic, rose, mushroom
10Undecanal1639112-44-70.062 a ± 0.014NQNQNQWaxy, soapy, floral, aldehydic, citrus, green, fatty, fresh laundry
11Ethyl 4-trans-decenoate172976649-16-60.372 a ± 0.046NQNQNQGreen, fruity Waxy, cognac
12Acetic acid, decyl ester1744112-17-40.036 a ± 0.005NQNQ0.057 b ± 0.009Waxy, clean, fresh laundered cloths, citrus, soapy
13(E)-methyl geranate17591189-09-90.617 a ± 0.0920.386 b ± 0.0630.127 c ± 0.0210.325 b ± 0.057Waxy, green Fruity, flower
14Alpha-terpineol176210482-56-10.043 a ± 0.0060.02 b ± 0.0030.038 a ± 0.0040.095 c ± 0.013Lilac, floral, terpenic
15Cyclooctane1799292-64-80.987 a ± 0.167NQ0.377 b ± 0.073NQCamphor odor
16Phenethyl isobutyrate1956103-48-00.057 a ± 0.011NQNQNQFloral, fruity, rose, tea, peach, pastry
172-Acetylpyrrole19781072-83-90.046 a ± 0.008NQNQNQMusty, nut, skin, maraschino cherry, coumarinic, licorice, walnut, bready
18Gamma-nonanolactone2025104-61-00.053 a ± 0.012NQNQNQCoconut, creamy, waxy, sweet, buttery, oily
19Ethyl acetate891141-78-61.638 a ± 0.3471.761 a ± 0.3312.472 b ± 0.4212.375 b ± 0.397Ethereal, fruity, sweet, weedy, green
20Ethanol89564-17-514.774 b ± 2.35812.073 a ± 1.87218.836 d ± 2.46813.821 ab ± 2.181Strong alcoholic, ethereal, medical
21Ethyl butyrate1045105-54-40.248 a ± 0.0260.214 b ± 0.0310.268 c ± 0.0380.217 b ± 0.0025Fruity, juicy, fruit, pineapple, cognac
22Propan-1-ol105971-23-80.080 a ± 0.0120.065 b
± 0.011
0.083 a ± 0.0120.090 c ± 0.021Alcoholic, fermented fusel, musty
23Ethyl isovalerate1062108-64-5NQNQNQ0.011 a ± 0.001Fruity, sweet, apple, pineapple, tutti frutti
24Isobutyl isobutyrate106897-85-8NQNQNQ0.02 a ± 0.002Ethereal, fruity, tropical fruit, pineapple, grape skin, banana
25Isobutyl alcohol107878-83-10.506 a ± 0.0830.620 b ± 0.0960.504 a ± 0.0920.632 b ± 0.101Ethereal, winey, cortex
26Isoamyl acetate1110123-92-24.213 a ± 0.72356.493 b ± 0.92510.603 c ± 1.53212.447 cd ± 1.826Sweet, fruity, banana, solvent
27Myrcene1122123-35-30.025 a ± 0.0030.019 b ± 0.0020.029 c ± 0.0030.048 d ± 0.005Peppery, terpene, spicy, balsam, plastic
28Isopentyl isobutyrate11762050-01-30.018 a ± 0.002NQ0.123 b ± 0.0250.166 c ± 0.037Fruity, ethereal, tropical, green grape, cherry, unripe banana, apple, cocoa
293-Methyl-1-butanol1200123-51-313.623 a ± 1.79311.607 b ± 1.46713.146 a ± 1.98311.17 b ± 1.249Fusel, oil, alcoholic, whiskey, fruity, banana
302-Pentylfuran12133777-69-3NQNQNQ0.01 a ± 0.001Fruity, green, earthy, beany, vegetable, metallic
31Ethyl caproate1219123-66-04.851 a ± 0.8653.433 b ± 0.5476.19 c ± 1.2234.319 ab ± 0.792Sweet, fruity, pineapple, waxy, green, banana
323,7-Dimethyl-1122113877-91-3NQNQNQ0.018 a ± 0.003Citrus, tropical, green, terpene, woody, green
33Hexyl acetate1228142-92-70.079 a ± 0.0130.135 b ± 0.0280.149 bc ± 0.0330.02 d ± 0.003Fruity, green, apple, banana, sweet
342-Methylbutyl 2-methylbutyrate12302445-78-5NQNQNQ0.024 a ± 0.003Sweet, fruity, ester, berry, green, waxy, apple
35Hexyl methyl ketone1241111-13-70.075 a ± 0.0130.018 b ± 0.0030.066 c ± 0.0120.066 c ± 0.013Earthy, weedy, natural, woody, herbal
36Isopentyl isopentanoate1273659-70-1NQNQNQ0.035 a ± 0.005 Sweet, fruity, green, ripe, apple, jammy, tropical
Ethyl heptanoate1281106-30-90.151 a ± 0.0240.100 b ± 0.0130.116 ba ± 0.0150.274 c ± 0.044Fruity, pineapple, cognac, rum wine
38Hexanol1299111-27-30.059 a ± 0.0090.039 b ± 0.0060.037 b ± 0.005NQEthereal, fusel, oil, fruity, alcoholic, sweet, green
39(Z)-4-Heptenal13316728-31-0NQNQ0.027 a ± 0.0040.035 b ± 0.006Oily, fatty, green, dairy, milky, creamy
402-Hthylhexyl acetate1369103-09-30.021 a ± 0.0030.020 a ± 0.003NQNQEarthy, herbal, humus, undergrowth
41Nonyl aldehyde1391124-19-6NQNQ0.073 a ± 0.0120.197 b ± 0.037Waxy, aldehydic, rose, fresh, orris, orange peel, fatty, peely
42Ethyl caprylate1430106-32-119.674 a ± 3.8519.791 a ± 4.0317.016 ab ± 3.4215.357 b ± 2.86Fruity, wine, waxy, sweet, apricot, banana, brandy, pear
43Furfural148298-01-1NQNQ0.321 a ± 0.0640.144 b ± 0.022Sweet, woody, almond, fragrant, baked bread
44Octyl acetate1503112-14-10.197 a ± 0.0330.217 a ± 0.0290.414 b ± 0.0610.687 c ± 0.106Green, earthy, mushroom, herbal, waxy
45Camphor155876-22-2NQ0.019 a ± 0.003NQNQCamphoreous
462-Nonanol1567628-99-90.140 a ± 0.0280.056 b ± 0.0090.034 c ± 0.005NQWaxy, green, creamy, citrus, orange, cheese, fruity
47Ethyl nonanoate1578123-29-50.269 a ± 0.0510.321 a ± 0.0630.098 b ± 0.01560.054 c ± 0.008Fruity, rose, waxy, rum, wine, natural, tropical
48Linalool158878-70-60.539 a ± 0.0880.453 b ± 0.0720.474 b ± 0.0780.680 c ± 0.117Citrus, floral, sweet, bois de rose, woody, green, blueberry
49Octanoicacid15925461-6-30.017 a ± 0.0030.035 b ± 0.006NQNQFruity, green, oily, floral
50Carbonochl16337452-59-7NQ0.586 a ± 0.089NQNQSugar cane aroma, fruity
512-Decanol16561120-06-50.030 a ± 0.0050.017 b ± 0.002NQ0.051 c ± 0.009NF
52Ethyl caprate1690110-38-36.257 a ± 1.3314.795 b ± 0.8741.401 c ± 0.2582.275 c ± 0.367Sweet, waxy, fruity, apple, grape, oily, brandy
53Acetophenone170598-86-2NQ0.032 a ± 0.005NQNQ Sweet, pungent, hawthorn, mimosa, almond, acacia, chemical
54Myrcene1721123-35-3NQNQ0.357 a ± 0.0530.191 b ± 0.031 Peppery, terpene, spicy, balsam, plastic,
55Ethyl benzoate173993-89-00.082 a ± 0.0120.091 b ± 0.0140.056 c ± 0.0080.064 d ± 0.009Fruity, dry, musty, sweet, wintergreen
56ethyl 9-decenoate174867233-91-44.062 a ± 0.8793.96 a ± 0.6970.369 b ± 0.6520.725 b ± 0.117Fruity, fatty
572-Dodecanol177110203-28-80.205 a ± 0.0310.139 b ± 0.024NQNQNF
584-Ethylbenzaldehyde17824748-78-1NQ0.038 a ± 0.005NQNQBitter, almond, sweet, anise
59Geranyl acetate1790105-87-30.031 a ± 0.0050.029 a ± 0.0040.034 a ± 0.0050.030 a ± 0.006Floral, rose, lavender, green, waxy
60Decyl alcohol1800112-30-1NQ0.678 a ± 0.098NQ0.488 b ± 0.078Fatty, waxy, floral, orange, sweet, clean, watery
61Citronellol1804106-22-90.508 a ± 0.0890.346 b ± 0.0640.352 b ± 0.0590.174 c ± 0.031 Floral, leather, waxy, rose bud, citrus
62Ethyl phenylacetate1807101-97-30.027 a ± 0.0040.049 b ± 0.0010.029 a ± 0.0050.036 c ± 0.004Sweet, floral, honey, rose, balsam, cocoa
63Nerol1810106-25-20.028 a ± 0.0040.032 ab ± 0.006NQ0.009 c ± 0.001Sweet, natural, neroli, citrus, magnolia
64Beta-damascenone181623726-93-40.087 a ± 0.012NQ0.275 b ± 0.0400.333 c ± 0.058Apple, rose, honey, tobacco, sweet
65Ethyl laurate1819106-33-20.159 a ± 0.0270.219 b ± 0.0310.019 c ± 0.003NQSweet, waxy, floral, soapy, clean
66Geraniol1821106-24-10.103 a ± 0.0270.054 b ± 0.0090.066 c ± 0.0100.095 d ± 0.012Sweet, floral, fruity, rose, waxy, citrus
67Geranylacetone1825689-67-80.170 a ± 0.0300.068 b ± 0.0110.075 b ± 0.013NQFresh, rose, leaf, floral, green, magnolia, aldehydic, fruity
68Trimethyl pentanyl diisobutyrate18286846-50-0NQ0.077 a ± 0.0130.039 b ± 0.006NQNF
69Ethyl hydrocinnamate19302021-28-50.070 a ± 0.0100.108 b ± 0.0170.072 a ± 0.0130.068 a ± 0.013Hyacinth, rose, honey, fruity, rum
70Butylated hydroxytoluene1936 128-37-0NQ0.013 a ± 0.0020.486 b ± 0.071NQMild, phenolic, camphor
71DMS76775-18-30.019 ba ± 0.0030.085 c ± 0.0110.010 a ± 0.0010.025 b ± 0.004Sulfury, onion, sweet, corn, vegetable, cabbage, tomato, green, radish
72Heptyl acetate1356112-06-10.066 a ± 0.0120.113 b ± 0.0170.183 c ± 0.0300.134 bc ± 0.023Fresh, green, rum, ripe, fruit, pear, apricot, woody
73Benzyl alcohol1571100-51-60.033 a ± 0.0050.077 b ± 0.0120.117 c ± 0.020NQFloral, rose, phenolic, balsamic
74Isoamyl octanoate17252035-99-60.101 a ± 0.0170.302 b ± 0.048NQ0.015 c ± 0.002Sweet, oily, fruity, green, soapy, pineapple, coconut
75Phenethyl acetate1813103-45-72.611 a ± 0.4158.201 cb ± 1.3116.086 b ± 0.9859.984 c ± 1.837Floral, rose, sweet, honey, fruity, tropical,
76Phenethyl alcohol194160-12-89.061 a ± 1.36412.49 b ± 2.0749.913 a ± 1.69310.503 ab ± 1.795Floral rose, dried rose, flower, rose water
772,4-Di-t-butylphenol234196-76-40.127 a ± 0.0160.357 b ± 0.0630.125 a ± 0.0200.105 c ± 0.018Phenolic
Note: Relative content data in this table are expressed as mean (n = 5) ± standard deviation, using Duncan’s test, and differences in superscript letters are significant (p < 0.05), NQ means that the substance is not detectable.
Table 10. Comparison of major aged aldehydes in five kinds of lager after 9 days of aging storage at 45 °C.
Aging-Related Substance Content (µg/L)
2-FuraldehydeAcetaldehydeIsobutyraldehydeValeraldehydePhenylacetaldehydeTotal Aldehyde
Unaged commercially available lager (CAL1)NQ3.04 ± 0.41338.385 ± 3.1255.386 ± 0.2816.133 ± 0.81852.944 b ± 4.696
Aged commercially available lagers (CAL1)66.887 ± 8.42375.414 ± 9.05249.914 ± 5.74717.257 ± 1.4258.996 ± 0.755218.468 a ± 25.402
Unaged commercially available lager (CAL2)NQ7.08 ± 0.62915.394 ± 1.72416.841 ± 2.2184.823 ± 0.29344.138 b ± 4.864
Unaged commercially available lager (CAL2)48.792 ± 5.46692.348 ± 10.13338.266 ± 2.63525.978 ± 3.93512.759 ± 0.828218.143 a ± 22.997
Unaged LSNQ28.592 ± 3.9812.7126 ± 0.41614.197 ± 1.3251.861 ± 0.25247.366 b ± 5.78
Aged LS11.412 ± 2.79377.862 ± 9.0518.758 ± 1.52013.886 ± 2.04710.744 ± 0.973122.662 c ± 16.384
Unaged OWBLNQ69.306 ± 7.2487.872 ± 0.9239.162 ± 1.3253.743 ± 0.28790.083 d ± 11.125
Aged OWBL22.503 ± 2.83139.78 ± 18.72314.657 ± 1.93716.035 ± 1.6929.622 ± 0.983202.597 a ± 26.165
Note: Total Aldehyde data in this table are expressed as mean (n = 5) ± standard deviation, using Duncan’s test, and differences in superscript letters are significant (p < 0.05), NQ means that the substance is not detectable.
Disclaimer/Publisher’s Note: The statements, opinions and data contained in all publications are solely those of the individual author(s) and contributor(s) and not of MDPI and/or the editor(s). MDPI and/or the editor(s) disclaim responsibility for any injury to people or property resulting from any ideas, methods, instructions or products referred to in the content.

