Abstract
Fish by-products can be converted into high-value-added products like fish protein hydrolysates (FPHs), which have high nutritional value and are rich in bioactive peptides with health benefits. This study aims to characterise FPHs derived from salmon heads (HPSs) and Cape hake trimmings (HPHs) using Alcalase for enzymatic hydrolysis and Subcritical Water Hydrolysis (SWH) as an alternative method. All hydrolysates demonstrated high protein content (70.4–88.7%), with the degree of hydrolysis (DH) ranging from 10.7 to 36.4%. The peptide profile of FPHs indicated the breakdown of proteins into small peptides. HPSs showed higher levels of glycine and proline, while HPHs had higher concentrations of glutamic acid, leucine, threonine, and phenylalanine. Similar elemental profiles were observed in both HPHs and HPSs, and the levels of Cd, Pb, and Hg were well below the legislated limits. Hydrolysates do not have a negative effect on cell metabolism and contribute to cell growth. HPSs and HPHs exhibited high 2,2′–azino-bis(3 ethylbenzthiazoline-6)-sulfonic acid (ABTS) radical scavenging activity, Cu2+ and Fe2+ chelating activities, and angiotensin-converting enzyme (ACE) inhibitory activity, with HPHs generally displaying higher activities. The α-amylase inhibition of both FPHs was relatively low. These results indicate that HPHs are a promising natural source of nutritional compounds and bioactive peptides, making them potential candidates for use as an ingredient in new food products or nutraceuticals. SWH at 250 °C is a viable alternative to enzymatic methods for producing FPHs from salmon heads with high antioxidant and chelating properties.
1. Introduction
In 2021, total fish production reached approximately 182 million tonnes. Of this amount, 162 Mt (89%) were for human consumption, while the remaining 20 Mt (11%) were allocated for non-food uses [1]. Traditionally, 9% of this material is converted into fish meal and fish oil. However, the significant quantities of by-products from fish industries (including heads, frames, trimmings, skins, and bones), which can constitute 50–70% of the processed fish, can be converted into high-value-added products such as fish protein concentrates (FPCs) and fish protein hydrolysates (FPHs) [2]. FPHs offer nutritional, biological, and functional benefits. This sustainable approach not only reduces waste but also offers the opportunity to obtain bioactive peptides, which can be used as functional ingredients in food and nutraceutical products [2]. The bioactive peptides are made up of short amino acid sequences, which are inactive in the parent protein and can be released through enzymatic hydrolysis with commercially available enzymes such as Flavourzyme, Neutrase, and Alcalase [3]. Although the use of enzymes allows the prediction of which peptides can be generated, high-quality enzymes have a significant cost, which makes the enzymatic process expensive. This process is not rapid, and it can take hours to achieve the desired degree of hydrolysis. It also uses acids and bases to control the pH process, generating waste streams, and the process requires high energy consumption. Therefore, Subcritical Water Hydrolysis (SWH) can serve as an eco-friendly alternative to conventional hydrolysis methods. This technique can be employed to release bioactive peptides from various proteinaceous materials, including fish by-products. Subcritical water, also known as hot-compressed or pressurised hot water, is defined as water under conditions above its boiling point at 1 atm (>100 °C at 0.1 MPa) but below its critical point (374 °C at 22 MPa), with enough pressure to maintain its liquid state [4]. Under these conditions, the dielectric constant of water decreases with increasing temperature, allowing it to effectively dissolve moderately polar to non-polar substances. Additionally, the ionic product of water increases significantly, enhancing its ability to act as an acid or base catalyst, thus facilitating protein hydrolysis [4]. The use of subcritical water for protein hydrolysis has been explored with various fish by-products: SWH has been applied to bigeye tuna (Thunnus obesus) skin, abalone (Haliotis discus hannai Ino) viscera, cod (Gadus morhua) frames, and sardine (Sardina pilchardus) wastes [5,6,7,8].
FPHs from by-products are a promising source of bioactive peptides with antioxidant, antihypertensive, and anti-diabetic properties, among others [9,10]. Oxidative stress, caused by an imbalance between reactive oxygen species (ROS) production and the body’s antioxidant defences, contributes to chronic diseases like cardiovascular disorders, cancer, and neurodegenerative conditions. Antioxidant peptides from FPHs can combat oxidative damage by scavenging free radicals and inhibiting lipid peroxidation. Studies have shown the antioxidant potential of FPHs from various fish by-products, including heads, bones, frames, skins, muscles, and viscera [3,10,11,12,13,14].
FPHs also exhibit significant antihypertensive effects, with peptides acting as angiotensin-converting enzyme (ACE) inhibitors, which help regulate blood pressure by modulating the renin–angiotensin–aldosterone system. Research has demonstrated the ACE-inhibitory potential of FPHs from muscles, heads, bones, and other parts like blood and roe [3,15,16]. Furthermore, FPHs have shown the ability to inhibit α-amylase and α-glucosidase, enzymes involved in carbohydrate digestion, thereby helping manage blood sugar levels in diabetes [3,17,18].
Portugal imports large amounts of salmon and Cape hake for further production of fish portions and fillets. The by-products generated in these processes are readily available and represent a high-quality raw material (good protein and low microbiological contamination). Therefore, this study aims to explore the bioactive potential of enzymatic fish protein hydrolysates (FPHs) derived from salmon heads and hake by-products using Alcalase, as well as hydrolysates obtained through subcritical water hydrolysis (SWH) from salmon heads (see Figure S1 in the Supplementary Material). The nutritional composition, amino acid and mineral profiles, chemical contaminants (Pb, Cd, and Hg), bioactivities (antioxidant, ACE inhibitory, and α-amylase inhibitory activities), and cytotoxicity and impact on Caco-2 cell proliferation were analysed in the enzymatic hydrolysates. Additionally, the antioxidant activities of the salmon heads hydrolysates prepared by SWH were evaluated.
2. Materials and Methods
2.1. Fish Material
Fresh heads of farmed Atlantic salmon (Salmo salar) were purchased at a local supermarket and transported to the laboratory on ice. Additionally, trimmings (muscular fraction and bones from the head and tail) of Cape hake (Merluccius capensis), resulting from the frozen hake filleting processing, were also used. These by-products were kindly provided by Gelpeixe, Alimentos Congelados S.A. (Loures, Portugal). Both raw materials were ground and minced in an industrial meat grinder (HOBART, Troy, OH, USA) and stored at −80 °C until further use.
2.2. Alcalase Hydrolysis of Salmon Heads and Hake By-Products
Freeze-grinded raw materials were thawed and used in the preparation of the FPHs according to the method described by Henriques et al. (2021), with slight modifications. One kilogram of freeze-grinded raw material was homogenised with 2 L of distilled water (1:2 w/v), and the mixture was incubated at 60 °C in a 5 L glass reactor under agitation. The pH of the mixture was adjusted to 8.5, and the hydrolysis process was initiated by adding 1% (w/w) of Alcalase. The pH was maintained at 8.5 during the hydrolysis time (3 h) with the addition of 2 M NaOH. Then, the reaction was stopped by increasing the temperature to 90 °C. After 20 min at 90 °C, the mixture was cooled at room temperature and centrifuged at 4 °C, 10,000× g, for 20 min. The supernatant was filtered, freeze-dried and stored at −80 °C until further analysis. The hydrolysate prepared from the salmon heads was designated as HPS, and the one prepared from the Cape hake trimmings was designated as HPH [3].
2.3. Subcritical Water Hydrolysis of Salmon Heads
The preparation of FHPs from salmon heads by SWH was carried out according to the method described by Nilsuwan et al. (2022) [19]. The lipid fraction was previously removed by adding isopropanol (C3H8O) at 30% (v/v) in a ratio of 1:10 (m/v) to the minced salmon heads. The mixture was homogenised with a magnetic stirrer at 150 rpm for 60 min at refrigeration temperature (4 °C). The deposited mass was collected and washed with distilled water (1:10 w/v). The washing process was repeated three times, and finally, the sample was drained. The attained moisture content of the sample was 63.3 ± 1.3%. The hydrolysis process with subcritical water was carried out in a Parr Series 450 reactor (Moline, IL, USA) with a Parr 4848 controller. Extractions were carried out using approximately 2 g of sample and 200 mL of distilled water at 300 rpm, testing different combinations of temperature (200 or 250 °C), pressure (50 or 100 bar) and extraction time (10 or 30 min), as described in Table S1 (in Supplementary Material). After centrifugation, the supernatant was freeze-dried and stored at −80 °C until use. The hydrolysates were designated as SWH1, SWH2, SWH3, SWH4, SWH5, and SWH6.
Although −80 °C is not an industrial temperature, it was used in this study to store ground raw materials and the FPHs until further analysis. This temperature was selected to prevent biochemical changes, such as oxidation, and because the preparation and characterisation of different FPH batches were carried out at different times, this procedure ensured that no additional variables were introduced.
2.4. Hydrolysis and Protein Yields
The hydrolysis and protein yields of the different processes were determined according to the following [20,21]:
where Wf is the weight (in grams, dw) of the FPH, Wi is the weight (in grams, dw) of raw material, Pf is the total protein content (in grams) of the FPH, and Pi is the total protein content (in grams) of raw material.
2.5. Degree of Hydrolysis
The degree of hydrolysis (DH) is defined as the percentage of the number of peptide bonds cleaved compared to the total number of peptide bonds in the substrate during the enzymatic reaction. The DH was determined using the o-phthalaldehyde (OPA) method described by Nielsen et al. (2001) based on the measurement of the amino groups generated during the hydrolysis process [22]. A solution of FPH was added to 3 mL of the OPA solution and mixed for 5 s. The mixture stood for exactly 2 min before reading the absorbance at 340 nm in an Evolution 201 UV-Visible Spectrophotometer (Thermo Scientific, Waltham, MA, USA). The blank was prepared using the same volume of distilled water instead of a hydrolysate sample. A serine solution with a concentration of 0.9516 meq/L was used as a reference. The degree of hydrolysis was calculated according to the following equation:
where Abssample is the absorbance of FPH solution, Absblank is the absorbance of blank, Absserine is the absorbance of serine solution, W is the weight in grams of the FPH, and N is the total nitrogen (%) in the FPH.
2.6. Proximate Composition of Fish Raw Material and FPHs
The ash, fat and moisture contents of raw material and FPHs were determined as described in AOAC (2005) [23]. The protein content was determined using an FP-528 LECO nitrogen analyser (LECO, St Joseph, MI, USA) calibrated with ethylenediaminetetraacetic acid (nitrogen = 9.57 ± 0.03%), following the Dumas method as described by Saint-Denis & Goupy (2004) [24]. All measurements were performed in triplicate. The results of fish raw material were expressed as % of wet weight (ww), while for FPHs, the results were expressed as % of dry weight (dw).
2.7. Amino Acid Compositions
The quantification of amino acids in raw materials and FPHs was performed using the hydrolysis method described in AOAC (2005) [23]. For total amino acid extraction, ca. 15–35 mg of freeze-dried sample (1.5–2.0 mg of nitrogen) were acid hydrolysed with 3 mL of 6 M HCl (Merck, Kenilworth, NJ, USA) containing 0.1% phenol (Merck, Kenilworth, NJ, USA). Norvaline (99%, Sigma-Aldrich Corp., St. Louis, MO, USA) and sarcosine (98%, Sigma-Aldrich Corp., St. Louis, MO, USA) were further added to samples (final concentration of 500 pmol/μL) before hydrolysis and used as internal standards. Hydrolysis tubes were vacuumed, fluxed, and capped under a nitrogen atmosphere, and the samples were hydrolysed at 110–115 °C for 24 h. After hydrolysis, samples were neutralised with 6 M NaOH, quantitatively transferred into 20 mL volumetric flasks with ultrapure water, filtered using cellulose membrane syringe filters (0.2 µm pore size) and stored at −80 °C until analysis. The chromatographic conditions used were in accordance with the Agilent method described by Henderson et al. (2000), and amino acid separation was performed using high-performance liquid chromatography (Agilent 1100 HPLC, Agilent Technologies, Palo Alto, CA, USA) in a Phenomenex Gemini ODS C18 guard column (4 × 3 mm), and a Phenomenex Gemini ODS C18 110 Å column (4.6 × 150 mm, 5 μm) (Phenomenex Inc., Torrence, CA, USA) using pre-column derivatisation with OPA and 3-mercaptopropionic acid in borate buffer (Agilent Technologies, Palo alto, CA, USA) and 9-fluorenylmethyl chloroformate in acetonitrile (FMOC, Agilent Technologies, Palo Alto, CA, USA) [25]. Detection was performed by fluorescence analysis (340/450 nm and 266/305 nm). Identification and quantification of amino acids were evaluated by comparing their retention times and peak areas with those of standard amino acids (Sigma, MO, USA) ranging from 9 to 900 pmol/μL using Agilent ChemStation software Rev.A.10.02 (1757) for LC (Agilent Technologies, Palo Alto, CA, USA). All measurements were conducted in duplicate. It should be noted that cysteine and tryptophan might undergo degradation during acid hydrolysis.
Amino acids scores for hake and salmon hydrolysates were calculated based on the reference requirements for adults (FAO/WHO/UNU, 2007) as follows:
* FAO/WHO/UNU, 2007
2.8. Mineral Profile and Contaminants Metals
The elements chromium (Cr), copper (Cu), iron (Fe), magnesium (Mg), manganese (Mn), nickel (Ni), potassium (K), sodium (Na), and zinc (Zn) were measured by flame atomic absorption spectrophotometry (Spectr AA 55B, Varian, Palo Alto, CA, USA) with a background deuterium correction, according to official analytical methods [26]. Concentrations were determined through linear calibration obtained from absorbance measurements of at least five different concentrations of standard solutions: Cr(NO3)2, Cu(NO3)2, Fe(NO3)3, Mg(NO3)2, Mn(NO3)2, KNO3, NaNO3, Ni(NO3)2, and Zn(NO3)2 (1 g/L dissolved in 0.5 M HNO3). Detection limits for the elements were 0.09 (Cr), 0.02 (Cu), 0.3 (Fe), 0.02 (Mg), 0.01 (Mn), 0.01 (K), 0.09 (Na), 0.02 (Ni), and 0.06 (Zn) mg/kg.
Cadmium (Cd) and lead (Pb) were determined using graphite furnace atomic absorption spectrometry, using a Varian apparatus Spectr 220Z with a Zeeman correction. The methodology followed was based on the European Standard EN 14084 [27]. The concentrations were determined through linear calibration obtained from absorbance measurements of at least five different concentrations of standard solutions: Pb(NO3)2 and Cd(NO3)2 (1 g/L in 0.5 M HNO3). The quantification of total mercury (HgT) was performed using atomic absorption spectrophotometry using a direct mercury analyser in a mercury analyser spectrophotometer (AMA 254, Leco, St. Joseph, MI, USA) [28]. Detection limits for the three metals were 0.002 (Cd), 0.004 (Hg), and 0.02 (Pb) mg/kg.
All analyses were performed in duplicate and analytical data was reported as mg/kg of products on a dry weight basis. Two certified reference materials were tested in the same conditions as the samples in order to assess analytical method accuracy: LUTS-1 (Non-defatted lobster hepatopancreas reference material for trace metals) and DORM-5 (Fish Protein Certified Reference Material) from the National Research Council of Canada. The obtained values for all elements were in good agreement with the certified values.
2.9. Molecular Weight (MW) of FPHs
The peptide profile of HPSs and HPHs was determined by size exclusion chromatography (SEC) in an FPLC ÄKTA system (Amersham Biosciences, Uppsala, Sweden) using a Superdex Peptide 10/300 GL column with a UV detector at 254 nm and 280 nm [20]. The eluent was acetonitrile/water (30/70) and 0.1% trifluoroacetic acid, and the flow rate was 0.5 mL/min. The approximate molecular weights were estimated using a molecular weight calibration curve prepared with ribonuclease A (13,700 Da), aprotinin (6500 Da), angiotensin I (1296 Da), triglycine (189 Da), and glycine (78 Da). The percentage of the molecular weight of the peptides was calculated by dividing the area of the identified peak by the total area of all peaks.
2.10. Cytotoxicity and Proliferation of FPHs
2.10.1. Cell Line Growth Conditions
Human Caucasian colon carcinoma epithelial cells, Caco-2 (ECACC 86010202 European Collection of Authenticated Cell Cultures), cells were grown in Dulbecco’s modified Eagle’s medium (Lonza, Basel, Switzerland) supplemented with 10% (v/v) heat-inactivated foetal bovine serum (Biowest, France), 1% (v/v) Penicillin–Streptomycin–Fungizone (Lonza, Basel, Switzerland), and 1% (v/v) non-essential amino acids (Lonza, Basel, Switzerland). Cells were incubated at 37 °C in a humidified atmosphere with 5% CO2.
2.10.2. Cytotoxicity
Cytotoxicity evaluation was performed according to the ISO 10993-5:2009 standard [29]. Cells were grown to 80–90% confluence, detached using TrypLE Express (ThermoScientific, Waltham, MA, USA), seeded at 1 × 10⁴ cells/well in 96-well tissue cultured plates (Nunclon ThermoScientific, Waltham, MA, USA), and allowed to adhere for 24 h. Afterwards, the media was carefully removed and replaced with media supplemented with sterile filtered (0.22 µm) fish hydrolysates at concentrations between 0.3 and 20 mg/mL. Dimethyl sulfoxide (DMSO) at 40% in culture media was used as a death control, and plain culture media was used as a growth control. After the incubation time, Presto Blue (ThermoFisher, Waltham, MA, USA) was added to each well and incubated at 37 °C in the darkness for 1 h. After this period, fluorescence (Excitation: 560 nm; Emission: 590 nm) was measured using a microplate reader (Synergy H1, Biotek Instruments, Winooski, VT, USA). All assays were performed in quadruplicate.
2.10.3. Cell Proliferation
To evaluate the sample’s impact upon cellular proliferation, the cells were grown to 80–90% confluence, detached using TrypLE Express (ThermoScientific, MA, USA), and seeded at 1 × 10⁴ cells/well in a 96-well microplate (Nunclon Delta, ThermoScientific, MA, USA). After 24 h, the culture media was carefully removed and replaced with a culture media supplemented with samples at the selected concentration. DMSO (Sigma, St. Louis, USA) at 10% (v/v) in culture media was used as a non-proliferation control, and plain culture media was used as a proliferation control. After 24 h of incubation, to evaluate cellular proliferation, Cyquant Direct Cell Proliferation (ThermoScientific, MA, USA) was used according to the manufacturer’s instructions, with fluorescence (Ex: 480 nm; Em: 535 nm) being measured using a microplate reader (Synergy H1, Biotek Instruments, Winooski, VT, USA). All assays were performed in quadruplicate.
2.11. Antioxidant Activity
2.11.1. 2,2-Diphenyl-1-picrylhydrazyl (DPPH) Radical Scavenging Activity
The determination of DPPH radical scavenging activity was performed according to the method of Shimada et al. (1992) with adjustments [3,30]. All analyses were made at least in triplicate and the results are presented as mean values. The EC50 value was calculated for each hydrolysate prepared by the conventional methodology. In the case of salmon protein hydrolysates prepared by SWH, the concentration tested was 0.1 mg/mL.
2.11.2. 2,2′-Azino-bis(3 ethylbenzthiazoline-6)-sulfonic Acid (ABTS) Radical Scavenging Activity
The ABTS radical scavenging activity of FPHs was performed according to Re et al. (1999) and as described by Henriques et al. (2021) [3,31]. All determinations were made at least in triplicate and the EC50 value was calculated for each hydrolysate prepared by the conventional methodology. In the case of salmon protein hydrolysates prepared by SWH, the concentration tested was 0.1 mg/mL.
2.11.3. Reducing Power (RP)
The reducing power was determined following Oyaizu’s method (1988) described by Henriques et al. (2021) [3,32]. All analyses were carried out at least in triplicate. The concentration for the absorbance value of 0.5 value (A0.5) was determined for each hydrolysate prepared by the conventional methodology. In the case of salmon protein hydrolysates prepared by SWH, the concentration tested was 0.1 mg/mL.
2.12. Metal Chelating Activities
2.12.1. Cu2+ Chelating Activity
The copper chelating activity was evaluated by copper chelate titration using pyrocatechol violet (PV) as the metal chelating indicator as described by Torres-Fuentes et al. (2011) with slight modifications [3,33]. All determinations were carried out at least in quadruplicate, and the EC50 was estimated for each hydrolysate prepared using the conventional methodology. In the case of salmon protein hydrolysates prepared by SWH, the concentration tested was 0.1 mg/mL.
2.12.2. Fe2+ Chelation Activity
The iron chelating activity of the FPH was estimated using the method described by Decker and Welch (1990), with modifications according to Henriques et al. (2021) [3,34]. All determinations were carried out at least in quadruplicate, and the EC50 value was determined for each hydrolysate prepared using the conventional methodology. In the case of salmon protein hydrolysates prepared by SWH, the concentration tested was 0.1 mg/mL.
2.13. ACE Inhibitory Activity
The ACE inhibitory activity using hippuryl-L-histidyl-L-leucine (HHL) as the substrate was evaluated using high-performance liquid chromatography (HPLC) according to the methodology described by Pires et al. (2015) [35]. Captopril was used as a commercial inhibitor and showed an ACE inhibitory activity of ca. 95%.
2.14. α-Amylase Inhibitory Activity
The α-amylase inhibitory activity was measured using the method described by Hansawasdi et al. (2000) [36]. All the assays were performed at least in triplicate, and the results are presented as mean values.
2.15. Statistical Analysis
The results of the analyses are reported as mean values ± standard deviation (SD). All statistical analyses were performed using the STATISTICA© software version 12 from StatSoft, Inc. (Tulsa, OK, USA). All data were checked for normality of distribution and homogeneity of variances using Shapiro–Wilk and Levene’s tests, respectively. Differences between the mean values of two groups were tested using a Student’s t-test. Differences among mean values of the groups were tested using a one-way analysis of variance (ANOVA), followed by Tukey’s HSD multiple comparison test. Pearson correlation was also performed between several variables (e.g., amino acids, DH, MW, DPPH and ABTS radical scavenging activities, RP, Fe2+ and Cu2+ chelating activities, and ACE and α-amylase inhibitory activities). Statistical significance was considered at p < 0.05.
3. Results and Discussion
3.1. Proximate Composition, Degree of Hydrolysis, and Protein Yield
Table 1 summarises the proximate composition of raw salmon heads and hake by-products, as well as their corresponding Alcalase protein hydrolysates. Significant differences (p < 0.05) in fat and moisture contents were observed between hake by-products and salmon heads, primarily attributable to the notably high-fat content of the latter (19.8% on a wet weight basis). The respective hydrolysates (HPSs and HPHs) presented high levels of protein (ca 76% dw) and moisture and fat contents lower than 7.6% dw and 2.7% dw, respectively. Several authors have reported similar protein and moisture contents for FPHs prepared from different by-products [2,3,37]. It is noteworthy that the relatively low-fat content obtained in the HPS is due to the removal of lipids released in the hydrolytic process (ca 95%). Most of the studies reported FPHs with a fat content lower than 5% dw, while only a small number mentioned FPHs with fat content exceeding 5% dw [2,3,37]. The relatively high ash content of HPSs and HPHs is due to the addition of NaOH for pH adjustment during the hydrolysis process. The reported ash content for FPHs prepared from different fish by-products ranged between 0.45 and 25.94% dw [2,3,37]. Indeed, ash content depends on the hydrolysis process and the type of by-products used.

Table 1.
Proximate composition of salmon heads and hake by-products (ww) and protein hydrolysates prepared from salmon heads (HPS, dw) and hake by-products (HPH, dw) with Alcalase, and degree of hydrolysis (DH) and protein yield of the hydrolysis process.
The hydrolysis protein yield can vary depending on the type of by-product, enzymatic conditions, and the specific enzyme employed. As shown in Table 1, the protein yield obtained in the preparation of HPSs was significantly lower (p < 0.05) than that obtained in the preparation of HPHs (75.5%). Likely, the higher fat percentage in salmon heads leads to protein loss through emulsion formation with the fat, resulting in a lower protein yield. However, the hydrolysis yield, based on the ratio of dried FPHs to the dried weight of raw material, obtained for HPSs (32.4%) was considerably lower compared to 76.4% for HPHs. These results highlight the high proportion of skin, bones, and fat in the salmon heads.
Gbogouri et al. (2004) reported a slightly higher protein yield (71.0%) for protein hydrolysates prepared from salmon heads with Alcalase [38]. However, the protein yield of hydrolysates prepared from salmon heads and backbones (64.7%) was relatively lower than that of HPSs [39]. According to Ramakrishnan et al. (2024), the protein yield for salmon protein hydrolysates prepared by different hydrolysis conditions (pH, time, temperature, and enzyme) and from different parts of salmon varied between 8.5 and 89.3% [37].
The yield obtained in the preparation of HPHs was relatively higher compared to the previously achieved in our laboratory for the preparation of FPHs from the same raw material using the same enzyme (70.5%) but lower than yields reported for FPHs prepared with Protamex (50.9%) [20,35]. Iñarra et al. (2023) reported protein yields ranging between 40 and 65% for protein hydrolysates prepared from hake by-products with different enzymes [40].
The DH results (Table 1) show that HPSs exhibited a higher DH (26.2%) compared to HPHs (20.3%). The DH of HPHs was relatively lower than that achieved in FPHs prepared from the same species using Alcalase (22.6%) [20]. This difference could be related to the type of material used in the preparation of FPHs. However, the DH achieved for HPHs and HPSs falls within the range reported by other authors for FPHs prepared from fish muscle, fish discards, and by-products with Alcalase [3,10,41].
3.2. Amino Acid Compositions
As can be seen in Table 2, the total amino acids determined in salmon heads (33.77 g/100 g) was lower than in the hake by-products (74.38 g/100 g), due to the lower proportion of protein (in a dry weight basis) in the salmon raw material. Considering such differences, the comparison among raw materials and hydrolysates was based on the amino acid contents expressed per 100 g of protein.
Table 2.
Essential (EAA) and non-essential (NEAA) amino acids expressed in g/100 g dw sample (g/100 g protein) of hake by-products, salmon heads, and protein hydrolysates prepared from hake by-products (HPH) and salmon heads (HPS) by Alcalase hydrolysis.
Regarding hake, the hydrolysis process with Alcalase resulted in the loss of several amino acids by at least 5%, including glutamic acid, aspartic acid, leucine, valine, isoleucine, phenylalanine, tyrosine, methionine, and histidine. In contrast, in salmon, amino acid loss was observed only for lysine, threonine, tyrosine, and histidine. This suggests that hydrolysis was more incomplete in the case of hake. In comparison, earlier research also noted a decline in the levels of several amino acids (such as lysine, methionine, proline, phenylalanine, isoleucine, tyrosine, and valine) in hake hydrolysates when using Protamex, whereas Gbogouri et al. (2004) observed a decrease solely in glycine and lysine following the hydrolysis of salmon heads with Alcalase [35,38]. Regarding salmon skin hydrolysates, both Alcalase and Protamex yielded similar amino acid profiles, except for proline, which exhibited a higher content in the use of the former enzyme, and methionine, which showed a higher content when prepared with the latter enzyme [42].
Salmon head-derived hydrolysates exhibited elevated levels of glycine (9.66 g/100 g of protein), proline (5.17 g/100 g of protein), and hydroxyproline (1.32 g/100 g of protein) compared to hake hydrolysates. These heightened concentrations of these amino acids may suggest a greater presence of collagen, sourced from the skin and bones, in salmon as opposed to hake raw materials. In a prior study, glycine (approximately 20–22 g/100 g, depending on the enzyme) was identified as the most abundant amino acid in hydrolysates prepared from salmon (Salmo salar) skin [42]. Additionally, significantly higher levels of glycine were detected in hydrolysates derived from salmon (Salmo salar) skin gelatin (approximately 23 g/100 g) compared to salmon trimmings (approximately 7 g/100 g) [43]. On the other hand, hake hydrolysates contained higher concentrations of glutamic acid, leucine, threonine, and phenylalanine than salmon head-derived hydrolysates.
From a nutritional standpoint, the amino acids scores (See Table S2 in Supplementary Material) for threonine, cysteine, lysine, and phenylalanine + tyrosine exceeded 150% among essential amino acids in both hydrolysates. On the other hand, only histidine exhibited a nutritional score below 100%, with values of 64.9% for HPHs and 93.4% for HPSs. However, when incorporating hydrolysates into new food product formulations, it is essential to consider evidence of tolerable upper intake levels for amino acids, as summarised by Elango (2023) [44]. This is especially critical for lysine, given its significant contribution to hydrolysates, alongside the recommended dietary allowance of 2.7 g/day and the lowest-observed-adverse-effect level of 7.5 g/day [45].
3.3. Mineral and Chemical Contaminants
The mineral profile of hake by-products, salmon heads, and protein hydrolysates is presented in Table 3. Similar elemental patterns were observed in both hake by-products and salmon heads and their hydrolysates. The mineral profile of raw materials showed a predominance of K > Na > Mg > Fe > Zn > Mn > Cu > Cr > Ni. For FPHs, the mineral elements were ordered as follows: Na, K, Mg, Fe, Zn, Cu, Ni, Mn, and Cr. These profiles were typical for seafood products [46]. As for macroelements, the highest K content was obtained in hake by-products, being statistically different from that obtained in salmon heads. In the case of Na and Mg, the values were not statistically different. However, in comparison with the respective hydrolysates (HPHs; HPSs), there was a significant decrease in Mg and a significant increase in Na content. This increase in Na can be explained by the introduction of NaOH during the hydrolysis process. Previous studies have reported higher levels of Mg in salmon heads and cod backbone hydrolysates compared to the findings of this study [47,48]. Regarding trace elements, salmon heads have higher values of Fe, Zn, and Mn compared to hake by-products. This may be mainly due to the presence of gill tissue in salmon heads [49]. In general, hydrolysates from hake by-products and salmon heads exhibited significantly lower levels of these three metals compared to the raw material, except for Fe. Iron and Zn values found in the present study were lower than those found in the study carried out by de la Fuente et al. (2023) [47]. The Cu content in salmon heads was higher than that in hake by-products, likely due to the presence of gill tissue. However, the Cu levels in the HPS were lower than in the raw material and statistically identical to those found in hake by-products. In relation to Cr and Ni, quantified contents were the usual for fish products; however, for Ni, no statistical differences were observed between the raw material and the respective hydrolysate. In the case of Cr, this element was not detected in the hydrolysates [49].
Table 3.
Minerals (mg/kg) and contaminant metals (mg/kg) of Cape hake by-products (dw), salmon heads (dw), and protein hydrolysates (dw) prepared from hake by-products (HPHs) and salmon heads (HPSs) and Dietary Reference Intake (DRI, mg/day, %) of hake by-products (HPHs) and salmon heads (HPS).
The contribution of each element, in percentage, was also calculated in relation to the Dietary Reference Intake (DRI) (Table 3) using the estimated daily intake for each element (average content, mg/kg) obtained for each hydrolysate considering one hundred grams [50,51]. The results indicate that the Na content in 100 g of FPH significantly exceeded the maximum recommended daily intake. However, by optimising the hydrolysate production process or incorporating an additional desalination step, the Na levels in the hydrolysates can be significantly reduced to meet the DRI value. Regarding the K levels, both hydrolysate samples were good sources of K (DRI: 26–33%), contributing a substantial portion of the essential mineral required. For Cu, Fe, and Zn, the hydrolysates contributed less than 10% of the daily recommended intake (DRI). Therefore, these FPHs can be considered beneficial dietary supplements or ingredients that enhance the nutritional value of food products.
Since the levels of contaminant metals can affect the use of HP, for example, as a food ingredient, the concentrations of Cd, Hg, and Pb were also evaluated (Table 3). The levels obtained for Cd and Pb in both raw materials and hydrolysates were almost always lower than the detection and quantification limits of the methods and lower than the limits legislated [52]. These results indicate low contamination in these products by these two metals. Identical levels were found by de la Fuente et al. (2023) [47]. As for Hg, the highest concentrations were obtained for hake by-products but still below the limit of 0.50 mg/kg (ww) indicated in the European Union Regulation (2023) [52]. In hake by-products, a decrease in the corresponding hydrolysates was observed due to Hg removal during the hydrolysis process. It should be noted that the values obtained in this study for salmon heads are similar to those obtained by de la Fuente et al. (2023) [47].
3.4. Molecular Weight Distribution of FPHs
The molecular weight (MW) distribution of HPHs and HPSs, obtained by size-exclusion chromatography, clearly demonstrates the hydrolysis of salmon and hake proteins into smaller MW peptides (Figure 1). The profile of HPHs and HPSs was very similar, and both hydrolysates had approximately 93% peptides with an MW below 1500 Da. The primary difference between HPH and HPS profiles was the percentage of peptides with an average MW of 250 Da and 100 Da. HPHs contained about 36% of peptides with an average MW of 250 Da, compared to 14% in HPSs. Conversely, HPHs had about 37% of peptides with an average MW of 100 Da, while HPSs had 62%. These findings align with the achieved DH, as HPSs exhibited a significantly higher (p < 0.05) DH value (26.2%) than HPHs (20.3%). This indicates that hydrolysates obtained from salmon heads underwent a higher degree of hydrolysis.
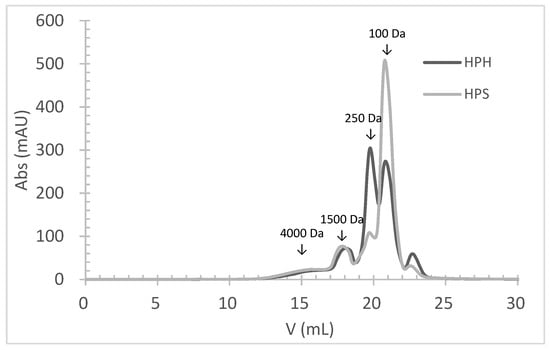
Figure 1.
The molecular weight distribution of peptides obtained by size-exclusion chromatography analysis of protein hydrolysates prepared by Alcalase hydrolysis of hake by-products (HPHs) and salmon heads (HPSs).
It is well known that a higher DH results in a higher percentage of lower MW peptides. In this study, a strong negative correlation was observed between the percentage of peptides with an MW above 1000 Da (MW > 1000 Da) and the DH (r = 0.962). Conversely, a positive correlation was found between the percentage of peptides with an MW below 1000 Da (MW < 1000 Da) and the DH (r = 0.770).
3.5. Cytotoxicity and Proliferation of FPHs
In the two independent assays, only the highest concentration (20 mg/mL) exerted an inhibitory effect upon Caco-2 cell metabolism, as can be seen in Figure 2. Conversely, concentrations between 0.3 and 10 mg/mL showed an apparent metabolic stimulation (negative values for metabolism inhibition), indicating a metabolic activity higher than that of the growth control. These data align with previous studies on fish hydrolysates, demonstrating that increasing the concentration of hydrolysates is safe and does not compromise cell metabolism. In the available literature, fish hydrolysates are usually tested at lower concentrations (below 1 mg/mL) [53,54,55].
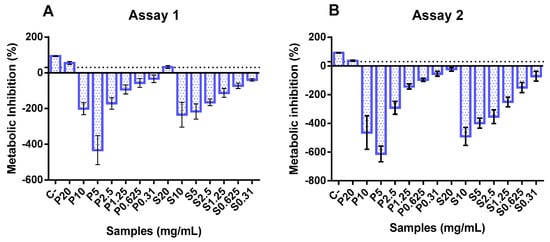
Figure 2.
Cytotoxicity of protein hydrolysates prepared from hake by-products (P) and salmon heads (S) at different concentrations (0.31, 0.6, 1.25, 2.5, 5, and 10 mg/mL). The dotted line represents the 30% cytotoxicity limit. C−: control.
Regarding cell proliferation, the results of two independent assays showed that both fish hydrolysates promoted cell growth, as can be seen in Figure 3. This effect appears to be dose-dependent: as the concentration of hydrolysate decreased, cell proliferation also decreased. This finding corroborates the apparent increase in cell metabolism observed in the metabolic inhibition assay mentioned above. The increase in cell proliferation aligns with those reported in the literature for gut cells [54,56,57].
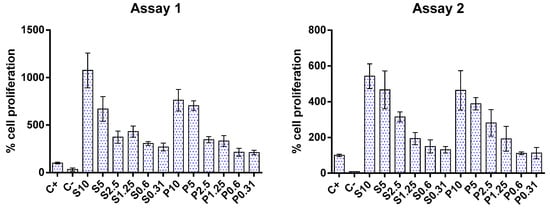
Figure 3.
Impact of protein hydrolysates prepared from hake by-products (P) and salmon heads (S) at different concentrations (0.31, 0.6, 1.25, 2.5, 5, and 10 mg/mL) upon Caco-2 cell proliferation. C+: positive control; C−: negative control.
3.6. Antioxidant Activity
Measuring antioxidant capacity with a single method cannot accurately determine a compound’s overall ability to function as an antioxidant [58]. Hence, this study involved different methods, such as DPPH radical scavenging activity, ABTS radical scavenging activity, reducing power, and metal chelating activity (Cu2+ and Fe2+).
The DPPH radical scavenging capacity of HPHs and HPSs is present in Table 4. Both hydrolysates exhibited a DPPH scavenging activity with a concentration dependence, and this activity was significantly higher in the HPHs (EC50 = 9.5 mg/mL). The inhibition percentage values obtained in the current work (ca. 20%) were in the range (0.76–31.9%) of those reported for hydrolysates prepared from fish by-products (heads skins, bones, and whole fish) with Alcalase for a 3 mg/mL hydrolysate concentration [3]. However, the DPPH radical scavenging activity of HPHs and HPSs was double of that found in FPHs prepared from hake by-products [20]. Fish protein hydrolysates prepared from salmonid waste (heads, trimmings, and frames) and heads and viscera of monkfish using Alcalase demonstrated DPPH inhibition percentages ranging from 48.2% to 56.9% [39,59]. In contrast, protein hydrolysates from rainbow trout skins and from four Australian fish species exhibited significantly lower DPPH inhibition compared to the results of this study [60,61,62].
Table 4.
ABTS and DPPH radical scavenging activities, reducing power (RP), Fe2+ and Cu2+ chelating activities, and ACE inhibitory activity of protein hydrolysates prepared from salmon heads (HPSs) and hake by-products (HPHs).
The DPPH radical scavenging activity did not align with the peptide profile of FPHs (Figure 1), as lower MW peptides are generally reported to exhibit higher DPPH activity [3,63]. However, other authors have found that hydrolysates with low DH (5%) exhibited higher DPPH radical scavenging activity than those with high DH (25%) [64]. The higher levels of methionine, phenylalanine, lysine, leucine, and tyrosine in the HPH might have contributed to the increased DPPH activity, as noted by Ryu et al. (2021) [10]. This author reported that hydrophobic amino acids can act on membrane lipid bilayers to reach targets and help scavenge radicals, and histidine significantly enhances antioxidant capacity because the protonation of the imidazole ring acts as a hydrogen donor. Blanco et al. (2017) also suggested that the antioxidant activity of protein hydrolysates is influenced not only by the DH but also by other factors, such as the presence of amino acids that can interact with free radicals, like the SH group in cysteine [65].
The ABTS radical scavenging assay measures the potential of an antioxidant to inhibit the ABTS radical cation. ABTS activity also increased with higher FPH concentrations, with HPHs showing the lowest ABTS activity. However, the EC50 values of HPSs and HPHs were not significantly different (Table 4). The ABTS radical scavenging activity of HPSs and HPHs was comparable to those derived from hake by-products using Alcalase [20,66] and to those produced from various fish discards, which had EC50 values ranging from 1.12 to 4.93 mg/mL [3]. Protein hydrolysates from common carp roe and blue-spotted stingrays exhibited higher ABTS inhibitory activity, with EC50 values of 0.301 mg/mL and 0.79 mg/mL, respectively, compared to those prepared in this study [63,67]. Reported EC50 values of hydrolysates prepared from fish discards by-products varied between 3.45 and 22.99 µg/mL [68]. ABTS radical scavenging activity of Liza abu muscle protein hydrolysate fractions (<3, 3–10 and 10–30 kDa) varied between 31.79 and 80.11%. Hasani et al. (2022) and Shahosseini et al. (2022) reported that protein hydrolysates prepared from Indian mackerel by-products had an ABTS radical scavenging activity ranging from 31.56 to 91.00% [62,69]. Many studies have reported that a high DH and low MW have a positive correlation with DPPH and ABTS. However, similar to DPPH, it has also been observed that hydrolysates with lower DH exhibit the highest ABTS radical scavenging activity. The antioxidant properties of FPHs are influenced by several factors, including the amino acid composition, chain length (500–1000 Da), sequence of residues/functional side chains, and the methodology used in FPH production [70,71,72]. The elevated levels of methionine, phenylalanine, lysine, leucine, and tyrosine in HPHs may be responsible for enhancing its ABTS radical scavenging activity, similar to its effect on DPPH radical scavenging activity.
The reducing power (RP) assay has also been used to evaluate the potential of any substance to reduce another substance. That can be either by addition or removal of hydrogen or by loss or gain of electrons. To compare the results of the reducing power of FPHs, the A0.5 value (the concentration of a sample to produce an absorbance of 0.5) was used (Table 4). A linear increase in the RP with the concentration of hydrolysates was observed for both hydrolysates. This trend has been reported by several authors for protein hydrolysates from fish by-products [20,61,73,74]. The results of this study were comparable in magnitude to those reported by Pires et al. (2013) for Cape hake protein hydrolysates [20]. However, Karoud et al. (2019) reported a higher RP for protein hydrolysates prepared from hake heads, where a 5 mg/mL hydrolysate concentration showed an absorbance of 0.37–0.71 [73]. The A0.5 value of FPHs prepared from different discarded species varied between 10 and 31.25 mg/mL, but Henriques et al. (2021) reported A0.5 values of 3.19–6.35 mg/mL for FPHs prepared from fish discards and by-products [3,74]. Additionally, Chen et al. (2014) observed a higher RP for protein hydrolysates derived from tilapia sarcoplasmic proteins using papain, where a 3 mg/mL hydrolysate solution exhibited an absorbance of 0.629 ± 0.022. On the contrary, the RP of protein hydrolysates from roe carp (A0.5 = 2 mg/mL) reported by Chalamaiah et al. (2012) was lower than that determined in the present work [2,75].
In the present study, strong, significant positive correlations were observed between DH and DPPH (r = 0.989), DH and ABTS (r = 0.971), and DH and RP (r = 0.995). A strong, significant positive correlation was found between Gly and DPPH (r = 0.988), Gly and ABTS (r = 0.963), and Gly and RP (r = 0.981). In contrast, a strong, significant negative correlation was observed between the percentage of peptides with an MW above 1000 Da (MW > 1000 Da) and DPPH (r = −0.927), peptides with an MW > 1000 Da and ABTS (r = −0.986), as well as peptides with an MW > 1000 Da and RP (r = −0.961). In other words, high DH and Gly content result in the highest antioxidant activity. Conversely, a higher percentage of peptides above 1000 Da results in the lowest antioxidant activity.
3.7. Fe2+ and Cu2+ Chelating Activities
Metal-chelating peptides can bind to transition metal ions like Fe2+ and Cu2+, reducing their activity and functioning as indirect antioxidants. This process helps to reduce or inhibit food oxidation (and consequently, to decrease oxidation products linked to age-related diseases) as well as extend food shelf life. The Fe2+ chelating ability of HPSs and HPHs is shown in Table 4. Both hydrolysates presented high Fe2+ chelating activity, as evidenced by the lower EC50 values achieved. These values were comparable to those referred by Henriques et al. (2021) for hydrolysates prepared from fish discards and by-products [3]. Similarly, studies of fish protein hydrolysates from various Mediterranean fish discards, Cape hake by-products and blue-spotted stingrays reported EC50 values of similar magnitudes. The kawakawa fish peptides, particularly those with an MW below 3 kDa, showed EC50 values similar to those obtained in this study [66,67,74,76]. On the other hand, lower EC50 values were obtained in hydrolysates prepared from starry triggerfish, Boops boops, cuttlefish, and smooth-hound and skins and scales of sole fish [77,78,79]. On the contrary, higher EC50 values were obtained in hydrolysates prepared from yellow stripe trevally and in tuna liver hydrolysates [64,80].
Several authors reported that the Fe2+ chelating capacity increased with the DH [64,81]. However, in the current study, HPSs exhibited the smallest average peptide size and the lowest Fe2+ chelating capacity. Notably, there was a strong, significant negative correlation (r = −0.949) between the DH and Fe2+ chelating activity. Additionally, a strong, significant positive correlation (r = 0.931) was found between Fe2+ chelating activity and the proportion of peptides with an MW greater than 1000 Da.
It has also been described that the chelating capacity of peptides depends not only on their size but also on the composition and sequence of their amino acids. According to Kong and Xiong (2006), the amino acids Asp, Glu, and His are involved in Fe2+ chelation, and the aromatic amino acids Phe, Trp, and Tyr also have considerable chelating effects [10]. In fact, in the current study, a strong positive correlation between Fe2+ chelating activity and the amino acids Asp (r = 0.953), Glu (r = 0.970), Tyr (r = 0.932), and Phe (r = 0.900) was achieved.
The EC50 values of Cu2+ chelating activity of HPSs and HPHs are shown in Table 4. Both hydrolysates showed Cu2+ chelating activity, but HPHs presented significantly higher activity than HPSs. In the latter, it was not possible to calculate the EC50 since 50% inhibition was not reached in the range of concentrations tested. The EC50 values of HPSs and HPHs were lower than those found for FPHs of different fish discards and by-products, which varied between 2.49 and 5.66 mg/mL, as reported by Henriques et al. (2021) [3]. The Cu2+ chelating capacity of the HPH was also lower than that observed in hydrolysates prepared from Cape hake by-products by Teixeira et al. (2016) (EC50 = 1.4 mg/mL) [66]. Low Cu2+-chelating ability was also observed by Zhang et al. (2016) for the large yellow croaker peptide fractions corresponding to an MW lower than 3 kDa [82]. However, HPSs showed similar results to those reported by Chai et al. (2015) for hydrolysates obtained from blue-spotted stingray muscle with Alcalase (EC50 = 2.14 mg/mL) [66,67,82].
The Cu2+ chelating activity of the various protein hydrolysates can be attributed to their high content of carboxylic acids, specifically Asp and Glu [83]. In the present study, a strong positive correlation between Cu2+ chelating activity and Asp (r = 0.938) and between Cu2+ chelating activity and Glu (r = 0.981) was observed.
Additionally, aromatic amino acids such as Phe and Tyr exhibit significant chelating effects [10], as it is also shown in this work by the strong positive correlations of Tyr vs. Cu2+ chelating activity (r = 0.956) and of Phe vs. Cu2+ chelating activity (r = 0.981).
The FPHs prepared in this study demonstrated higher chelating activity for Fe2+ compared to Cu2+, particularly in the case of HPSs.
3.8. ACE Inhibitory Activity
The EC50 values for ACE inhibitory activity of HPHs and HPSs are shown in Table 4. Both samples inhibited ACE inhibitory activity at the tested concentrations in a concentration-dependent manner, and HPHs presented a significantly higher ACE inhibitory activity, evidenced by the lower EC50 value (0.86 ± 0.05 mg/mL). The results obtained in this study were similar to those reported for hydrolysates prepared from Cape hake and salmon by-products with Alcalase [35,37,84]. Henriques et al. (2021) reported relatively lower ACE inhibitory activity for protein hydrolysates from fish discards and by-products (61.20–85.95% for a 5 mg/mL hydrolysate solution) [3]. Fractioned protein hydrolysate from kawakawa was also evaluated for ACE inhibition, and the EC50 values ranged from 0.45 to 1.86 mg/mL [76]. Fish protein hydrolysates produced from sardine (EC50 = 1.16 mg/mL), tuna industrial by-products (EC50 = 0.24–0.27 mg/mL), and Nile tilapia (IC50 = 1.2 mg/mL) have shown similar ACE inhibitory activity to HPHs and HPSs [85,86]. However, Abdelhedi et al. (2016) observed relatively low IC50 values (75–703 µg/mL) for smooth-hound viscera hydrolysates [87]. It has been reported that chain length, MW, and molecular interaction of the peptides play a crucial role in their antihypertensive activity [88]. Gly and Pro are prevalent amino acids in peptides known for their antihypertensive effects [89,90,91,92]. In this work, strong positive correlations were noted between ACE inhibitory activity and DH (0.946), ACE inhibitory activity and PM < 1000 Da (r = 0.844), and ACE inhibitory activity and Gly (0.921). Additionally, a positive correlation between ACE inhibitory activity and Pro (0.640) was observed. On the contrary, a strong negative correlation was obtained between ACE inhibitory activity and peptides with an MW > 100 Da (r = −0.967).
3.9. α-Amylase Inhibitory Activity
The α-Amylase inhibitory activity of fish protein hydrolysates is shown in Figure 4. The salmon heads and hake by-products displayed this activity by inhibiting α-amylase in a concentration-dependent manner. However, this activity was relatively low, and none of the hydrolysates caused 50% amylase inhibition at the concentrations tested. HPHs presented significantly lower α-amylase inhibitory activity than HPSs, but at a 200 mg/mL hydrolysate concentration, the inhibition percentage was similar for both hydrolysates (ca. 31%).
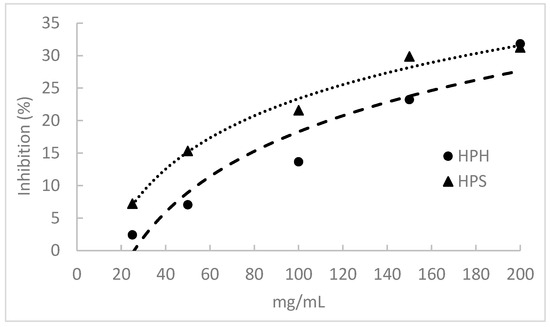
Figure 4.
α-Amylase inhibitory activity of protein hydrolysates prepared from salmon heads (HPS) and hake by-products (HPH) by Alcalase.
The observed results indicate lower inhibition compared to Wan et al. (2023), who reported a 15% inhibition with a 10 mg/mL solution of pompano protein hydrolysates [17]. Henriques et al. (2021) observed major differences in the inhibitory capacity of hydrolysates derived from different fish discards and by-products using Alcalase, with IC50 values ranging from 5.70 to 84.37 mg/mL [3]. However, these authors also reported that hydrolysates from whole pouting and red scorpionfish heads did not achieve 50% inhibition within the tested range of concentrations. Similarly, Amini et al. (2017) found α-amylase inhibition for sardinella hydrolysates for a 20 mg/mL solution between 16.61 and 45.71% [18]. The anti-diabetic activity of hydrolysate and peptide fractions obtained from unicorn leatherjacket skins, evaluated by α-amylase inhibition, ranged from 71.17 to 80.45% at a concentration of 1 mg/mL [93]. The IC50 values of these collagen peptides were calculated and ranged between 1.17 and 2.65 mg/mL. Slama-Ben et al. (2018) investigated the inhibition of α-amylase using octopus hydrolysates produced with Esperase and Bacillus subtilis A26, revealing significantly low IC50 values of 61.34 µg/mL and 66.22 µg/mL, respectively [94]. Additionally, Siala et al. (2016) measured the inhibition of α-amylase by grey triggerfish muscle hydrolysates, finding IC50 values ranging between 90 and 93 µg/mL [95].
The differences in the inhibitory activity of FPHs may be attributed to the amino acid composition of hydrolysate peptides. Leucine is the most abundant amino acid in peptide sequences associated with antidiabetic properties, as outlined in the review of Farias et al. (2022) [96]. Additionally, Pro and Gly rank as the second and third most frequent amino acids in peptide sequences linked to antidiabetic properties [96]. HPSs had higher levels of Pro and Gly than HPHs, but the latter hydrolysate had higher Leu content. In this study, a negative correlation was found between α-amylase inhibitory activity and DH (r = −0.880). However, a positive correlation was observed between this activity and Leu (r = 0.879) and peptides with an MW > 1000 Da (0.867). The overall analysis of these results suggests that high MW peptides exhibit more efficient inhibition of the α-amylase enzyme.
3.10. Salmon Heads Protein Hydrolysates Prepared by SWH
3.10.1. Protein Content, Degree of Hydrolysis, and Hydrolysis Yield
Subcritical Water Hydrolysis (SWH) was employed to prepare salmon head protein hydrolysates, aiming to assess its effectiveness as a sustainable alternative to Alcalase hydrolysis. The protein content of the FPHs prepared by SWH is presented in Table 5. As observed, the protein contents of SWH prepared at 200 °C (SWH1, SWH2, and SWH3) were significantly higher than those prepared at 250 °C (SWH4, SWH5, and SWH6). However, the protein contents of SWH4, SWH5, and SWH6 were very similar to those of HPSs (Table 1). The highest protein content (88.7%) was found at 200 °C, 50 bar, and 30 min (SWH3) and the lowest (70.4%) at 250 °C, 100 bar, and 10 min (SWH5). Different authors have reported that subcritical water temperatures enhance protein solubility due to the increased hydrolysis rate caused by the higher dissociation constant or ion product of subcritical water extraction [6,7]. Noteworthy, the increase in temperature can lead to a greater release of amino acids, promote the degradation of larger amino acids into smaller ones and increase the products of the Maillard reaction or the generation of products such as organic acids [4]. The present results suggest that SWH at 250 °C for shorter times (10 min) promoted the degradation of salmon head proteinaceous material into small products. This result is in line with Hao et al. (2019), who tested a temperature range from 110 °C to 230 °C for 60 min and sufficient pressure to maintain the liquid state to produce abalone (Haliotis discus hannai Ino) viscera protein via SWH [6]. These authors found the best response at 170 °C, with extraction yields of 46% and protein concentrations of 60.85%, which are lower than the values found in the present study.
Table 5.
Protein content (P), degree of hydrolysis (DH), and hydrolysis yield of salmon heads hydrolysates prepared by Subcritical Water Hydrolysis (SWH).
According to Table 5, the DH was significantly (p < 0.05) lower for hydrolysates prepared at 200 °C (10.7–11.7%), being higher when SWH was performed at 250 °C (32.4–36.4%). The HPSs exhibited an intermediate DH value (26.2%), higher than those of the SWH at 200 °C but lower than those prepared at 250 °C. The highest DH was achieved with SWH prepared at 250 °C, 100 bar, and 10 min (36.4%). Ahmed et al. (2018) and Lee et al. (2018) also obtained a higher DH at a higher tested temperature (250 °C) to produce tuna skin and Pacific oyster hydrolysates, respectively [21].
It was found that hydrolysis yield decreased with the increase in temperature (Table 5). The highest hydrolysis yield in salmon hydrolysates was 94.3% at 200 °C, 50 bar, and 30 min. On the contrary, the lowest value (47.0%) was obtained with hydrolysates prepared by SWH at 250 °C, 100 bar, and 10 min. The hydrolysates prepared by SWH presented higher hydrolysis yield value than the hydrolysates prepared using Alcalase, apart from the one prepared at 250 °C, 100 bar, and 10 min.
Several authors reported that increased temperature enhances hydrolysis efficiency, resulting in greater release of amino acids/peptides [4,21,97]. This phenomenon can be attributed to the higher ionization constant of water. However, this contrasts with the findings observed in this study [98,99,100].
3.10.2. Molecular Weight
The results of the MW profile of SWH are shown in Figure 5. In the SWH at 200 °C, the percentages in the average MW of peptides of 1500, 300, 100, and <100 Da were 30%, 35%, 27%, and 8%, respectively. With the increase in the subcritical water temperature, the percentage of peptides with a high MW decreased while that of a low molecular weight increased. In this case, the percentages of the average MW of peptides of 1500, 300, 100, and <100 Da were 20%, 45%, 20%, and 5%, respectively.


Figure 5.
The molecular weight distribution of peptides obtained by size-exclusion chromatography analysis of salmon head hydrolysates prepared by Subcritical Water Hydrolysis under the different conditions: SWH1—200 °C, 100 bar, 30 min); SWH2—200 °C, 100 bar, 10 min; SWH3—200 °C, 50 bar, 30 min; SWH4—250 °C, 100 bar, 30 min; SWH5—250 °C, 100 bar, 10 min; SWH6—250 °C, 50 bar, 30 min.
When comparing the MW distribution of hydrolysates prepared by SWH to those prepared by HPSs, the percentage of peptides with an average MW of 100 Da was relatively higher in the HPSs.
3.10.3. Antioxidant Activity
During SWH, several low-molecular-weight peptides and free amino acids were generated, depending on temperature and time. These compounds are believed to be responsible for the free-radical scavenging activities and reducing the power of the hydrolysates [98,101].
In this work, the DPPH radical scavenging activity of SWH prepared at 250 °C was generally higher than that of SWH prepared at 200 °C (Table 6). Moreover, for the same temperature and pressure, the DPPH radical scavenging activity of hydrolysates prepared for 30 min was not significantly different from that of the hydrolysates prepared for 10 min. The highest DPPH activity was observed for SWH4 prepared at 250 °C, 100 bar, and 30 min (22.9%). On the contrary, the lowest value (9.6%) was achieved when SWH was performed at 200 °C, 50 bar, and 30 min. Overall, SWH presented significantly (p < 0.05) higher DPPH radical scavenging than HPSs.
Table 6.
DPPH and ABTS radical scavenging activities, reducing power (RP), Cu2+ and Fe2+ chelating activities of salmon heads hydrolysates (0.1 mg/mL) prepared by Subcritical Water Hydrolysis and by Alcalase hydrolysis.
Although several authors have noted that DPPH radical scavenging activity increases with increasing hydrolysis temperature, the literature remains inconclusive [7,98,99,102,103]. For example, Asaduzzaman et al. (2015) noted increased DPPH radical scavenging activity at 220 °C during SWH, whereas higher temperatures of 250 °C to 280 °C led to decreased activity [100]. Abalone viscera subcritical water hydrolysates prepared at 230 °C had also lower radical scavenging activity than those prepared at 200 °C [6]. Accordingly, Lee et al. (2018) reported that Pacific oyster hydrolysates prepared by SWH at 250 °C and 120 bar had lower DPPH radical scavenging activity than hydrolysates prepared at 200 °C and 80 bar [21].
In contrast to HPSs (5.45%), SWH exhibited relatively lower ABTS radical scavenging activity at the tested concentrations, ranging from 1.89% (SWH3 prepared at 200 °C, 50 bar, 30 min) to 3.10% (SWH4 prepared at 250 °C, 100 bar, 30 min), as depicted in Table 6. In general, a similar trend was observed for DPPH and ABTS radical scavenging activities among the SWH, i.e., hydrolysates prepared at 250 °C tended to exhibit higher values of these activities. Moreover, at the same temperature and pressure, there was no significant difference in the ABTS radical scavenging activity between hydrolysates prepared for 30 min and those prepared for 10 min.
Several authors had reported increased ABTS radical scavenging activity of subcritical water hydrolysates with increasing temperature [5,21,98,102,103]. By contrast, no differences were observed in the ABTS radical scavenging activity of squid muscle hydrolysates prepared at different temperatures (160–280 °C). Likewise, Lee et al. (2018) reported that Pacific oyster hydrolysates prepared at 250 °C had lower ABTS radical scavenging activity than hydrolysates prepared at 200 °C [21].
Regarding the RP results of SWH, no significant differences were observed in the RP of different hydrolysates (Table 6). Furthermore, the results obtained with SWH were not significantly different from those of HPSs. Different results were observed by Asaduzzaman et al. (2020), who found that skin and bone hydrolysates prepared by SWH at 250 °C exhibited a higher RP (absorbance at 5 mg/mL was approximately 0.5 and 0.65, respectively) than those prepared at 200 °C (absorbance at 5 mg/mL was approximately 0.42 and 0.5, respectively) [103]. Asaduzzaman et al. (2015) studied the RP of squid muscle hydrolysates prepared by SWH at different temperatures (160–280 °C) and observed that those prepared at 220 °C showed the highest value (Abs = 1.45) [100].
Pressure is a crucial parameter that can influence the yields and bioactivities of salmon head protein hydrolysates produced by SWH. In this study, two pressure conditions (50 and 100 bar) were assessed while keeping the reaction time (30 min) and temperature (200 or 250 °C) constant. Data from Table 5 indicate that pressure did not affect the protein content and degree of hydrolysis (DH%) of salmon head protein isolates, as there were no statistical differences between SWH1 (200 °C, 100 bar, 30 min) and SWH3 (200 °C, 50 bar, 30 min), nor between SWH4 (250 °C, 100 bar, 30 min) and SWH6 (250 °C, 50 bar, 30 min). However, Table 6 shows that for the same temperature and time conditions (SWH1 versus SWH3 and SWH4 versus SWH6), hydrolysates prepared at 100 bar had significantly higher (p < 0.05) antioxidant activities, including DPPH and ABTS radical scavenging activities and Fe2+ chelating activity. The SWH pressure (50 or 100 bar) did not affect the reducing power of the hydrolysates. Ahmed and Chun (2018) compared hydrolysates from tuna skin and isolated tuna skin collagen using the SWH process at 150–300 °C and 50–100 bar, reporting that hydrolysates prepared at 250 °C and 50 bar for 5 min showed significantly (p < 0.05) higher antioxidant activity (measured by ABTS, DPPH, FRAP, and metal chelating activity) than those prepared at lower temperatures of 150 ºC and 180 °C. As noted by Rivas-Vela et al. (2021) [3], the combined effects of SWH pressure and temperature, rather than considering these factors separately, significantly influence protein hydrolysis to produce small peptides and amino acids.
4. Conclusions
In the present study, fish protein hydrolysates were prepared from salmon heads and Cape hake trimmings using Alcalase. Furthermore, subcritical water hydrolysis was also used to produce hydrolysates from salmon heads. The gel filtration profile of different hydrolysates indicates that proteins were hydrolysed into peptides with smaller molecular weight, which was according to the DH achieved. All hydrolysates were a valuable resource for protein, amino acids (except for histidine), and minerals. Moreover, they contained significantly lower Pb and Hg levels than those regulated. The cytotoxicity results allow the conclusion that increasing the concentration of hydrolysates is safe and does not compromise cell metabolism. Both fish hydrolysates also promoted cell growth. Regarding antioxidant and chelating activities, HPHs presented higher biological activities. HPSs had higher α-amylase inhibitory activity, but HPHs showed significantly higher ACE inhibitory activity.
Comparing enzymatic hydrolysates and those prepared by SWH, the results indicated that SWH at 250 °C could enhance the DPPH radical scavenging activity and chelating properties of the peptides obtained. These findings suggest that protein hydrolysates prepared in this study, especially those prepared with Cape hake trimmings, are a promising natural source of nutritional compounds and bioactive peptides that make them potential candidates for use as ingredients in new food products or nutraceuticals, while at the same time reducing fish waste. It can also be concluded that SWH is a viable alternative to enzymatic methods to produce FPHs from salmon heads with high antioxidant and chelating properties.
Supplementary Materials
The following supporting information can be downloaded at: https://www.mdpi.com/article/10.3390/foods13152418/s1, Figure S1: Study Design on Protein Hydrolysates from Salmon Heads and Cape Hake By-Products; Table S1: Different combinations of temperature, pressure and time tested in the subcritical water hydrolysis (SWH). Table S2: Amino acids score (%) of protein hydrolysates prepared from hake by-products (HPH) and salmon heads (HPS) by Alcalase hydrolysis.
Author Contributions
Conceptualization, C.P., M.L.N., A.M., A.G. and H.O.; Methodology, C.P., M.L., M.S., M.M., E.F.V., R.M. and H.M.L.; Validation, C.P., M.P., C.D.-M., A.G. and R.M.; Formal Analysis, M.L., C.C., M.S., B.T., M.M., E.F.V. and H.M.L.; Investigation, C.P., B.T., M.P. and C.D.-M.; Resources, C.P., M.L.N., A.M., M.P., C.D.-M. and A.R.R.; Data Curation, M.L., C.C., C.P., M.S., B.T., E.F.V., M.M. and H.M.L.; Writing—Original Draft Preparation, C.P., C.C., E.F.V., M.M., B.T. and H.M.L.; Writing—Review & Editing, C.P., M.S., M.L.N., A.M., A.G., H.O., M.P., M.M., E.F.V., C.D.-M., H.M.L., R.M. and B.T.; Visualization, C.P., M.L.N., A.M., A.G., C.D.-M., A.R.R. and M.P.; Supervision, C.P., M.P., C.D.-M. and R.M.; Project Administration, M.L.N., A.M., H.O., C.D.-M., M.P. and A.R.R.; Funding Acquisition, M.L.N., A.M., C.D.-M., A.R.R. and M.P. All authors have read and agreed to the published version of the manuscript.
Funding
This work was developed within the scope of the “BLUE BIOECONOMY INNOVATION PACT” (Project No. C644915664-00000026) funded by NextGenerationEU, under the incentive of “Agenda for Business Innovation” of the recovery and resilience plan (PRR).
Institutional Review Board Statement
Not applicable.
Informed Consent Statement
Not applicable.
Data Availability Statement
The original contributions presented in the study are included in the article/supplementary material, further inquiries can be directed to the corresponding author.
Acknowledgments
M.S. is thankful for the doctoral scholarship (2023.02017.BDANA) provided by the Foundation for Science and Technology, I.P. The authors express their gratitude to Gelpeixe, Alimentos Congelados S.A. (Loures, Portugal) for supplying the Cape hake trimmings.
Conflicts of Interest
The authors declare no conflicts of interest.
References
- FAO. Fishery and Aquaculture Statistics—Yearbook 2021; FAO: Rome, Italy, 2024; ISBN 978-92-5-138574-6. [Google Scholar]
- Chalamaiah, M.; Dinesh kumar, B.; Hemalatha, R.; Jyothirmayi, T. Fish Protein Hydrolysates: Proximate Composition, Amino Acid Composition, Antioxidant Activities and Applications: A Review. Food Chem. 2012, 135, 3020–3038. [Google Scholar] [CrossRef]
- Henriques, A.; Vázquez, J.A.; Valcarcel, J.; Mendes, R.; Bandarra, N.M.; Pires, C. Characterization of Protein Hydrolysates from Fish Discards and By-Products from the North-West Spain Fishing Fleet as Potential Sources of Bioactive Peptides. Mar. Drugs 2021, 19, 338. [Google Scholar] [CrossRef]
- Rivas-Vela, C.I.; Amaya-Llano, S.L.; Castaño-Tostado, E.; Castillo-Herrera, G.A. Protein Hydrolysis by Subcritical Water: A New Perspective on Obtaining Bioactive Peptides. Molecules 2021, 26, 6655. [Google Scholar] [CrossRef] [PubMed]
- Ahmed, R.; Chun, B.-S. Subcritical Water Hydrolysis for the Production of Bioactive Peptides from Tuna Skin Collagen. J. Supercrit. Fluids 2018, 141, 88–96. [Google Scholar] [CrossRef]
- Hao, G.; Cao, W.; Li, T.; Chen, J.; Zhang, J.; Weng, W.; Osako, K.; Ren, H. Effect of Temperature on Chemical Properties and Antioxidant Activities of Abalone Viscera Subcritical Water Extract. J. Supercrit. Fluids 2019, 147, 17–23. [Google Scholar] [CrossRef]
- Melgosa, R.; Trigueros, E.; Sanz, M.T.; Cardeira, M.; Rodrigues, L.; Fernández, N.; Matias, A.A.; Bronze, M.R.; Marques, M.; Paiva, A.; et al. Supercritical CO2 and Subcritical Water Technologies for the Production of Bioactive Extracts from Sardine (Sardina pilchardus) Waste. J. Supercrit. Fluids 2020, 164, 104943. [Google Scholar] [CrossRef]
- Melgosa, R.; Marques, M.; Paiva, A.; Bernardo, A.; Fernández, N.; Sá-Nogueira, I.; Simões, P. Subcritical Water Extraction and Hydrolysis of Cod (Gadus morhua) Frames to Produce Bioactive Protein Extracts. Foods 2021, 10, 1222. [Google Scholar] [CrossRef] [PubMed]
- Ortizo, R.G.G.; Sharma, V.; Tsai, M.-L.; Wang, J.-X.; Sun, P.-P.; Nargotra, P.; Kuo, C.-H.; Chen, C.-W.; Dong, C.-D. Extraction of Novel Bioactive Peptides from Fish Protein Hydrolysates by Enzymatic Reactions. Appl. Sci. 2023, 13, 5768. [Google Scholar] [CrossRef]
- Ryu, B.; Shin, K.-H.; Kim, S.-K. Muscle Protein Hydrolysates and Amino Acid Composition in Fish. Mar. Drugs 2021, 19, 377. [Google Scholar] [CrossRef] [PubMed]
- Vieira, E.F.; Pinho, O.; Ferreira, I.M. Bio-functional Properties of Sardine Protein Hydrolysates Obtained by Brewer’s Spent Yeast and Commercial Proteases. J. Sci. Food Agric. 2017, 97, 5414–5422. [Google Scholar] [CrossRef]
- Vieira, E.F.; das Neves, J.; Ferreira, I.M.P.L.V.O. Bioactive Protein Hydrolysate Obtained from Canned Sardine and Brewing By-Products: Impact of Gastrointestinal Digestion and Transepithelial Absorption. Waste Biomass Valorization 2021, 12, 1281–1292. [Google Scholar] [CrossRef]
- Abuine, R.; Rathnayake, A.U.; Byun, H.-G. Biological Activity of Peptides Purified from Fish Skin Hydrolysates. Fish. Aquat. Sci. 2019, 22, 10. [Google Scholar] [CrossRef]
- Idowu, A.T.; Benjakul, S.; Sinthusamran, S.; Sookchoo, P.; Kishimura, H. Protein Hydrolysate from Salmon Frames: Production, Characteristics and Antioxidative Activity. J. Food Biochem. 2019, 43, e12734. [Google Scholar] [CrossRef]
- Cheng, X.L.; Oslan, S.N.H.; Ikhlas, B.; Huda, N. Bioactive Angiotensin Converting Enzyme Inhibitory Activity and Antihypertensive Activity Derived from Fish Protein Hydrolysate: A Systematic Review. Food Res. 2023, 7, 308–330. [Google Scholar] [CrossRef]
- Korczek, K.; Tkaczewska, J.; MigdaŁ, W. Antioxidant and Antihypertensive Protein Hydrolysates in Fish Products—A Review. Czech J. Food Sci. 2018, 36, 195–207. [Google Scholar] [CrossRef]
- Wan, P.; Cai, B.; Chen, H.; Chen, D.; Zhao, X.; Yuan, H.; Huang, J.; Chen, X.; Luo, L.; Pan, J. Antidiabetic Effects of Protein Hydrolysates from Trachinotus Ovatus and Identification and Screening of Peptides with α-Amylase and DPP-IV Inhibitory Activities. Curr. Res. Food Sci. 2023, 6, 100446. [Google Scholar] [CrossRef]
- Amini Sarteshnizi, R.; Sahari, M.A.; Ahmadi Gavlighi, H.; Regenstein, J.M.; Nikoo, M.; Udenigwe, C.C. Influence of Fish Protein Hydrolysate-Pistachio Green Hull Extract Interactions on Antioxidant Activity and Inhibition of α-Glucosidase, α-Amylase, and DPP-IV Enzymes. LWT 2021, 142, 111019. [Google Scholar] [CrossRef]
- Nilsuwan, K.; Fusang, K.; Pripatnanont, P.; Benjakul, S. Properties and Characteristics of Acid-Soluble Collagen from Salmon Skin Defatted with the Aid of Ultrasonication. Fishes 2022, 7, 51. [Google Scholar] [CrossRef]
- Pires, C.; Clemente, T.; Batista, I. Functional and Antioxidative Properties of Protein Hydrolysates from Cape Hake By-products Prepared by Three Different Methodologies. J. Sci. Food Agric. 2013, 93, 771–780. [Google Scholar] [CrossRef]
- Lee, H.-J.; Saravana, P.S.; Cho, Y.-N.; Haq, M.; Chun, B.-S. Extraction of Bioactive Compounds from Oyster (Crassostrea gigas) by Pressurized Hot Water Extraction. J. Supercrit. Fluids 2018, 141, 120–127. [Google Scholar] [CrossRef]
- Nielsen, P.M.; Petersen, D.; Dambmann, C. Improved Method for Determining Food Protein Degree of Hydrolysis. J. Food Sci. 2001, 66, 642–646. [Google Scholar] [CrossRef]
- AOAC. Official Methods of Analysis of the Association of Official Analytical Chemists; AOAC: Rockville, MD, USA, 2005. [Google Scholar]
- Saint-Denis, T.; Goupy, J. Optimization of a Nitrogen Analyser Based on the Dumas Method. Anal. Chim. Acta 2004, 515, 191–198. [Google Scholar] [CrossRef]
- Henderson, J.W.; Ricker, R.D.; Bidlingmeyer, B.A.; Woodward, C. Rapid. Accurate, Sensitive, and Reproducible HPLC Analysis of Amino Acids; Agilent Technologies: Santa Clara, CA, USA, 2000. [Google Scholar]
- Jorhem, L.; Afthan, G.; Cumont, G.; Dypdahl, H.P.; Gadd, K.; Havre, G.N.; Julshamn, K.; Kåverud, K.; Lind, B.; Loimaranta, J.; et al. Determination of Metals in Foods by Atomic Absorption Spectrometry after Dry Ashing: NMKL1 Collaborative Study. J. AOAC Int. 2000, 83, 1204–1211. [Google Scholar] [CrossRef] [PubMed]
- BS EN 14084:2003; Foodstuffs—Determination of Trace Elements Determination of Lead, Cadmium, Zinc, Copper and Iron by Atomic Absorption Spectrometry (AAS) after Microwave Digestion. CEN-European Committee for Standardization: Brussels, Belgium, 2003; pp. 1–20.
- EPA Test Method 7473: Mercury in Solids and Solutions by Thermal Decomposition, Amalgamation and Atomic Absorption Spectrometry; SW-846; Environment Protection Agency: Washington, DC, USA, 1998; pp. 1–17.
- ISO 10993-5; Biological Evaluation of Medical Devices—Part 5: Tests for In Vitro Cytotoxicity. ISO: Geneva, Switzerland, 2007; pp. 1–11.
- Shimada, K.; Fujikawa, K.; Yahara, K.; Nakamura, T. Antioxidative Properties of Xanthan on the Autoxidation of Soybean Oil in Cyclodextrin Emulsion. J. Agric. Food Chem. 1992, 40, 945–948. [Google Scholar] [CrossRef]
- Re, R.; Pellegrini, N.; Proteggente, A.; Pannala, A.; Yang, M.; Rice-Evans, C. Antioxidant Activity Applying an Improved ABTS Radical Cation Decolorization Assay. Free Radic. Biol. Med. 1999, 26, 1231–1237. [Google Scholar] [CrossRef] [PubMed]
- Oyaizu, M. Antioxidative Activities of Browning Products of Glucosamine Fractionated by Organic Solvent and Thin-Layer Chromatography. Nippon Shokuhin Kogyo Gakkaishi 1988, 35, 771–775. [Google Scholar] [CrossRef]
- Torres-Fuentes, C.; Alaiz, M.; Vioque, J. Affinity Purification and Characterisation of Chelating Peptides from Chickpea Protein Hydrolysates. Food Chem. 2011, 129, 485–490. [Google Scholar] [CrossRef] [PubMed]
- Decker, E.A.; Welch, B. Role of Ferritin as a Lipid Oxidation Catalyst in Muscle Food. J. Agric. Food Chem. 1990, 38, 674–677. [Google Scholar] [CrossRef]
- Pires, C.; Teixeira, B.; Cardoso, C.; Mendes, R.; Nunes, M.L.; Batista, I. Cape Hake Protein Hydrolysates Prepared from Alkaline Solubilised Proteins Pre-Treated with Citric Acid and Calcium Ions: Functional Properties and ACE Inhibitory Activity. Process Biochem. 2015, 50, 1006–1015. [Google Scholar] [CrossRef]
- Hansawasdi, C.; Kawabata, J.; Kasai, T. Alpha-Amylase Inhibitors from Roselle (Hibiscus sabdariffa Linn.) Tea. Biosci. Biotechnol. Biochem. 2000, 64, 1041–1043. [Google Scholar] [CrossRef]
- Ramakrishnan, V.V.; Hossain, A.; Dave, D.; Shahidi, F. Salmon Processing Discards: A Potential Source of Bioactive Peptides—A Review. Food Prod. Process. Nutr. 2024, 6, 22. [Google Scholar] [CrossRef]
- Gbogouri, G.A.; Linder, M.; Fanni, J.; Parmentier, M. Influence of Hydrolysis Degree on the Functional Properties of Salmon Byproducts Hydrolysates. J. Food Sci. 2004, 69, C615–C622. [Google Scholar] [CrossRef]
- Vázquez, J.A.; Fernández-Compás, A.; Blanco, M.; Rodríguez-Amado, I.; Moreno, H.; Borderías, J.; Pérez-Martín, R.I. Development of Bioprocesses for the Integral Valorisation of Fish Discards. Biochem. Eng. J. 2019, 144, 198–208. [Google Scholar] [CrossRef]
- Iñarra, B.; Bald, C.; Gutierrez, M.; San Martin, D.; Zufía, J.; Ibarruri, J. Production of Bioactive Peptides from Hake By-Catches: Optimization and Scale-Up of Enzymatic Hydrolysis Process. Mar. Drugs 2023, 21, 552. [Google Scholar] [CrossRef] [PubMed]
- Nikoo, M.; Regenstein, J.M.; Yasemi, M. Protein Hydrolysates from Fishery Processing By-Products: Production, Characteristics, Food Applications, and Challenges. Foods 2023, 12, 4470. [Google Scholar] [CrossRef] [PubMed]
- Zhang, X.; Dai, Z.; Zhang, Y.; Dong, Y.; Hu, X. Structural Characteristics and Stability of Salmon Skin Protein Hydrolysates Obtained with Different Proteases. LWT 2022, 153, 112460. [Google Scholar] [CrossRef]
- Harnedy, P.A.; Parthsarathy, V.; McLaughlin, C.M.; O’Keeffe, M.B.; Allsopp, P.J.; McSorley, E.M.; O’Harte, F.P.M.; FitzGerald, R.J. Atlantic Salmon (Salmo salar) Co-Product-Derived Protein Hydrolysates: A Source of Antidiabetic Peptides. Food Res. Int. 2018, 106, 598–606. [Google Scholar] [CrossRef] [PubMed]
- Elango, R. Tolerable Upper Intake Level for Individual Amino Acids in Humans: A Narrative Review of Recent Clinical Studies. Adv. Nutr. 2023, 14, 885–894. [Google Scholar] [CrossRef] [PubMed]
- Hayamizu, K.; Oshima, I.; Fukuda, Z.; Kuramochi, Y.; Nagai, Y.; Izumo, N.; Nakano, M. Safety Assessment of L-Lysine Oral Intake: A Systematic Review. Amino Acids 2019, 51, 647–659. [Google Scholar] [CrossRef]
- Lourenço, H.M.; Afonso, C.; Anacleto, P.; Martins, M.F.; Nunes, M.L.; Lino, A.R. Elemental Composition of Four Farmed Fish Produced in Portugal. Int. J. Food Sci. Nutr. 2012, 63, 853–859. [Google Scholar] [CrossRef]
- de la Fuente, B.; Aspevik, T.; Barba, F.J.; Kousoulaki, K.; Berrada, H. Mineral Bioaccessibility and Antioxidant Capacity of Protein Hydrolysates from Salmon (Salmo salar) and Mackerel (Scomber scombrus) Backbones and Heads. Mar. Drugs 2023, 21, 294. [Google Scholar] [CrossRef]
- Jensen, M.B.; Jakobsen, J.; Jacobsen, C.; Sloth, J.J.; Ibarruri, J.; Bald, C.; Iñarra, B.; Bøknæs, N.; Sørensen, A.-D.M. Content and Bioaccessibility of Minerals and Proteins in Fish-Bone Containing Side-Streams from Seafood Industries. Mar. Drugs 2024, 22, 162. [Google Scholar] [CrossRef]
- Arisekar, U.; Shalini, R.; Shakila, R.J.; Sundhar, S.; Afrin Banu, A.M.; Iburahim, S.A.; Umamaheshwari, T. Trace Metals in Commercial Seafood Products (Canned, Pickled and Smoked): Comparison, Exposure and Health Risk Assessment. Food Res. Int. 2024, 178, 113969. [Google Scholar] [CrossRef] [PubMed]
- Belitz, H.-D.; Grosch, W.; Schieberle, P. Food Chemistry, 4th ed.; Springer: Berlin/Heidelberg, Germany, 2009; ISBN 978-3-540-69933-0. [Google Scholar]
- IOM. Dietary Reference Intakes for Energy, Carbohydrate, Fiber, Fat, Fatty Acids, Cholesterol, Protein, and Amino Acids; National Academic Press: Washington, DC, USA, 2005; ISBN 0-309-08537-3. [Google Scholar]
- European Union Regulation. Commission Regulation (EC) No 2023/915 of 25 April 2023 on Maximum Levels for Certain Contaminants in Food and Repealing Regulation (EC) No 1881/2006. Off. J. Eur. Union 2023, L 119, 103–157. [Google Scholar]
- Gómez, L.J.; Gómez, N.A.; Zapata, J.E.; López-García, G.; Cilla, A.; Alegría, A. In-Vitro Antioxidant Capacity and Cytoprotective/Cytotoxic Effects upon Caco-2 Cells of Red Tilapia (Oreochromis spp.) Viscera Hydrolysates. Food Res. Int. 2019, 120, 52–61. [Google Scholar] [CrossRef] [PubMed]
- Taroncher, M.; Rodríguez-Carrasco, Y.; Barba, F.J.; Ruiz, M.-J. Enhancement of the Antioxidant Effect of Natural Products on the Proliferation of Caco-2 Cells Produced by Fish Protein Hydrolysates and Collagen. Int. J. Mol. Sci. 2023, 24, 6871. [Google Scholar] [CrossRef] [PubMed]
- Taroncher, M.; Rodríguez-Carrasco, Y.; Aspevik, T.; Kousoulaki, K.; Barba, F.J.; Ruiz, M.-J. Cytoprotective Effects of Fish Protein Hydrolysates against H2O2-Induced Oxidative Stress and Mycotoxins in Caco-2/TC7 Cells. Antioxidants 2021, 10, 975. [Google Scholar] [CrossRef] [PubMed]
- Fitzgerald, A.J. Reparative Properties of a Commercial Fish Protein Hydrolysate Preparation. Gut 2005, 54, 775–781. [Google Scholar] [CrossRef]
- Cudennec, B.; Ravallec-Plé, R.; Courois, E.; Fouchereau-Peron, M. Peptides from Fish and Crustacean By-Products Hydrolysates Stimulate Cholecystokinin Release in STC-1 Cells. Food Chem. 2008, 111, 970–975. [Google Scholar] [CrossRef]
- Marín, R.; Abad, C.; Rojas, D.; Chiarello, D.I.; Alejandro, T.-G. Biomarkers of Oxidative Stress and Reproductive Complications. Adv. Clin. Chem. 2023, 113, 157–233. [Google Scholar]
- Vázquez, J.A.; Menduíña, A.; Nogueira, M.; Durán, A.I.; Sanz, N.; Valcarcel, J. Optimal Production of Protein Hydrolysates from Monkfish By-Products: Chemical Features and Associated Biological Activities. Molecules 2020, 25, 4068. [Google Scholar] [CrossRef]
- Nurdiani, R.; Dissanayake, M.; Street, W.E.; Donkor, O.N.; Singh, T.K.; Vasiljevic, T. In Vitro Study of Selected Physiological and Physicochemical Properties of Fish Protein Hydrolysates from 4 Australian Fish Species. Int. Food Res. J. 2016, 23, 2029–2040. [Google Scholar]
- Yaghoubzadeh, Z.; Peyravii Ghadikolaii, F.; Kaboosi, H.; Safari, R.; Fattahi, E. Antioxidant Activity and Anticancer Effect of Bioactive Peptides from Rainbow Trout (Oncorhynchus mykiss) Skin Hydrolysate. Int. J. Pept. Res. Ther. 2020, 26, 625–632. [Google Scholar] [CrossRef]
- Hasani, K.; Ariaii, P.; Ahmadi, M. Antimicrobial, Antioxidant and Anti-Cancer Properties of Protein Hydrolysates from Indian Mackerel (Rastrelliger kanagurta) Waste Prepared Using Commercial Enzyme. Int. J. Pept. Res. Ther. 2022, 28, 86. [Google Scholar] [CrossRef]
- Chalamaiah, M.; Jyothirmayi, T.; Diwan, P.V.; Dinesh Kumar, B. Antioxidant Activity and Functional Properties of Enzymatic Protein Hydrolysates from Common Carp (Cyprinus carpio) Roe (Egg). J. Food Sci. Technol. 2015, 52, 5817–5825. [Google Scholar] [CrossRef] [PubMed]
- Klompong, V.; Benjakul, S.; Kantachote, D.; Shahidi, F. Antioxidative Activity and Functional Properties of Protein Hydrolysate of Yellow Stripe Trevally (Selaroides leptolepis) as Influenced by the Degree of Hydrolysis and Enzyme Type. Food Chem. 2007, 102, 1317–1327. [Google Scholar] [CrossRef]
- Blanco, M.; Vázquez, J.; Pérez-Martín, R.; Sotelo, C. Hydrolysates of Fish Skin Collagen: An Opportunity for Valorizing Fish Industry Byproducts. Mar. Drugs 2017, 15, 131. [Google Scholar] [CrossRef] [PubMed]
- Teixeira, B.; Pires, C.; Nunes, M.L.; Batista, I. Effect of in Vitro Gastrointestinal Digestion on the Antioxidant Activity of Protein Hydrolysates Prepared from Cape Hake By-products. Int. J. Food Sci. Technol. 2016, 51, 2528–2536. [Google Scholar] [CrossRef]
- Chai, T.-T.; Tong, S.-R.; Law, Y.-C.; Ismail, N.; Manan, F.; Wong, F.-C. Anti-Oxidative, Metal Chelating and Radical Scavenging Effects of Protein Hydrolysates from Blue-Spotted Stingray. Trop. J. Pharm. Res. 2015, 14, 1349. [Google Scholar] [CrossRef]
- Vázquez, J.A.; Sotelo, C.G.; Sanz, N.; Pérez-Martín, R.I.; Rodríguez-Amado, I.; Valcarcel, J. Valorization of Aquaculture By-Products of Salmonids to Produce Enzymatic Hydrolysates: Process Optimization, Chemical Characterization and Evaluation of Bioactives. Mar. Drugs 2019, 17, 676. [Google Scholar] [CrossRef]
- Shahosseini, S.R.; Javadian, S.R.; Safari, R. Effects of Molecular Weights -Assisted Enzymatic Hydrolysis on Antioxidant and Anticancer Activities of Liza Abu Muscle Protein Hydrolysates. Int. J. Pept. Res. Ther. 2022, 28, 72. [Google Scholar] [CrossRef]
- Nirmal, N.P.; Santivarangkna, C.; Rajput, M.S.; Benjakul, S.; Maqsood, S. Valorization of Fish Byproducts: Sources to End-product Applications of Bioactive Protein Hydrolysate. Compr. Rev. Food Sci. Food Saf. 2022, 21, 1803–1842. [Google Scholar] [CrossRef] [PubMed]
- Phadke, G.G.; Rathod, N.B.; Ozogul, F.; Elavarasan, K.; Karthikeyan, M.; Shin, K.-H.; Kim, S.-K. Exploiting of Secondary Raw Materials from Fish Processing Industry as a Source of Bioactive Peptide-Rich Protein Hydrolysates. Mar. Drugs 2021, 19, 480. [Google Scholar] [CrossRef] [PubMed]
- Nikoo, M.; Regenstein, J.M.; Noori, F.; Piri Gheshlaghi, S. Autolysis of Rainbow Trout (Oncorhynchus mykiss) by-Products: Enzymatic Activities, Lipid and Protein Oxidation, and Antioxidant Activity of Protein Hydrolysates. LWT 2021, 140, 110702. [Google Scholar] [CrossRef]
- Karoud, W.; Sila, A.; Krichen, F.; Martinez-Alvarez, O.; Bougatef, A. Characterization, Surface Properties and Biological Activities of Protein Hydrolysates Obtained from Hake (Merluccius merluccius) Heads. Waste Biomass Valorization 2019, 10, 287–297. [Google Scholar] [CrossRef]
- García-Moreno, P.J.; Batista, I.; Pires, C.; Bandarra, N.M.; Espejo-Carpio, F.J.; Guadix, A.; Guadix, E.M. Antioxidant Activity of Protein Hydrolysates Obtained from Discarded Mediterranean Fish Species. Food Res. Int. 2014, 65, 469–476. [Google Scholar] [CrossRef]
- Chen, X.X.; Hu, X.; Li, L.H.; Yang, X.Q.; Wu, Y.Y.; Lin, W.L.; Zhao, Y.Q.; Ma, H.X.; Wei, Y. Antioxidant Properties of Tilapia Component Protein Hydrolysates and the Membrane Ultrafiltration Fractions. Adv. Mater. Res. 2014, 1073–1076, 1812–1817. [Google Scholar] [CrossRef]
- Taheri, A.; Bakhshizadeh, G.A. Antioxidant and ACE Inhibitory Activities of Kawakawa (Euthynnus affinis) Protein Hydrolysate Produced by Skipjack Tuna Pepsin. J. Aquat. Food Prod. Technol. 2020, 29, 148–166. [Google Scholar] [CrossRef]
- Viji, P.; Phannendra, T.S.; Jesmi, D.; Madhusudana Rao, B.; Dhiju Das, P.H.; George, N. Functional and Antioxidant Properties of Gelatin Hydrolysates Prepared from Skin and Scale of Sole Fish. J. Aquat. Food Prod. Technol. 2019, 28, 976–986. [Google Scholar] [CrossRef]
- Lassoued, I.; Elgaoud, I.; Hamed, F.; Nasri, R.; Nasri, M.; Barkia, A. Evaluation of Four Fish Protein Hydrolysates as a Source of Antioxidants and Amino Acids. Curr. Top. Pept. Protein Res. 2022, 22, 132–144. [Google Scholar]
- Sripokar, P.; Benjakul, S.; Klomklao, S. Antioxidant and Functional Properties of Protein Hydrolysates Obtained from Starry Triggerfish Muscle Using Trypsin from Albacore Tuna Liver. Biocatal. Agric. Biotechnol. 2019, 17, 447–454. [Google Scholar] [CrossRef]
- Je, J.-Y.; Lee, K.-H.; Lee, M.H.; Ahn, C.-B. Antioxidant and Antihypertensive Protein Hydrolysates Produced from Tuna Liver by Enzymatic Hydrolysis. Food Res. Int. 2009, 42, 1266–1272. [Google Scholar] [CrossRef]
- Intarasirisawat, R.; Benjakul, S.; Wu, J.; Visessanguan, W. Isolation of Antioxidative and ACE Inhibitory Peptides from Protein Hydrolysate of Skipjack (Katsuwana pelamis) Roe. J. Funct. Foods 2013, 5, 1854–1862. [Google Scholar] [CrossRef]
- Zhang, C.; Zhang, N.; Li, Z.; Tian, Y.; Zhang, L.; Zheng, B. Stability of Antioxidant Peptides Prepared from Large Yellow Croaker (Pseudosciaena crocea). Curr. Top. Nutraceutical Res. 2016, 14, 37–48. [Google Scholar]
- Zhu, L.; Chen, J.; Tang, X.; Xiong, Y.L. Reducing, Radical Scavenging, and Chelation Properties of in Vitro Digests of Alcalase-Treated Zein Hydrolysate. J. Agric. Food Chem. 2008, 56, 2714–2721. [Google Scholar] [CrossRef] [PubMed]
- Neves, A.C.; Harnedy, P.A.; O’Keeffe, M.B.; FitzGerald, R.J. Bioactive Peptides from Atlantic Salmon (Salmo salar) with Angiotensin Converting Enzyme and Dipeptidyl Peptidase IV Inhibitory, and Antioxidant Activities. Food Chem. 2017, 218, 396–405. [Google Scholar] [CrossRef] [PubMed]
- Thuanthong, M.; De Gobba, C.; Sirinupong, N.; Youravong, W.; Otte, J. Purification and Characterization of Angiotensin-Converting Enzyme-Inhibitory Peptides from Nile Tilapia (Oreochromis niloticus) Skin Gelatine Produced by an Enzymatic Membrane Reactor. J. Funct. Foods 2017, 36, 243–254. [Google Scholar] [CrossRef]
- Martínez-Alvarez, O.; Batista, I.; Ramos, C.; Montero, P. Enhancement of ACE and Prolyl Oligopeptidase Inhibitory Potency of Protein Hydrolysates from Sardine and Tuna By-Products by Simulated Gastrointestinal Digestion. Food Funct. 2016, 7, 2066–2073. [Google Scholar] [CrossRef]
- Abdelhedi, O.; Jridi, M.; Jemil, I.; Mora, L.; Toldrá, F.; Aristoy, M.-C.; Boualga, A.; Nasri, M.; Nasri, R. Combined Biocatalytic Conversion of Smooth Hound Viscera: Protein Hydrolysates Elaboration and Assessment of Their Antioxidant, Anti-ACE and Antibacterial Activities. Food Res. Int. 2016, 86, 9–23. [Google Scholar] [CrossRef]
- Yathisha, U.G.; Ishani, B.; Iddya, K.; Mamatha, B.S. Antihypertensive Activity of Fish Protein Hydrolysates and Its Peptides. Crit. Rev. Food Sci. Nutr. 2019, 59, 2363–2374. [Google Scholar] [CrossRef]
- Wijesekara, I.; Pangestuti, R.; Kim, S.K. Biological Activities and Potential Health Benefits of Sulfated Polysaccharides Derived from Marine Algae. Carbohydr. Polym. 2011, 84, 14–21. [Google Scholar] [CrossRef]
- Byun, H.-G.; Kim, S.-K. Purification and Characterization of Angiotensin I Converting Enzyme (ACE) Inhibitory Peptides from Alaska Pollack (Theragra chalcogramma) Skin. Process Biochem. 2001, 36, 1155–1162. [Google Scholar] [CrossRef]
- Ngo, D.-H.; Vo, T.-S.; Ryu, B.; Kim, S.-K. Angiotensin- I- Converting Enzyme (ACE) Inhibitory Peptides from Pacific Cod Skin Gelatin Using Ultrafiltration Membranes. Process Biochem. 2016, 51, 1622–1628. [Google Scholar] [CrossRef]
- Fahmi, A.; Morimura, S.; Guo, H.C.; Shigematsu, T.; Kida, K.; Uemura, Y. Production of Angiotensin I Converting Enzyme Inhibitory Peptides from Sea Bream Scales. Process Biochem. 2004, 39, 1195–1200. [Google Scholar] [CrossRef]
- Kumar, L.V.; Shakila, R.J.; Jeyasekaran, G. In Vitro Anti-Cancer, Anti-Diabetic, Anti-Inflammation and Wound Healing Properties of Collagen Peptides Derived from Unicorn Leatherjacket (Aluterus monoceros) at Different Hydrolysis. Turk. J. Fish. Aquat. Sci. 2018, 19, 551–560. [Google Scholar] [CrossRef]
- Ben Slama-Ben Salem, R.; Ktari, N.; Bkhairia, I.; Nasri, R.; Mora, L.; Kallel, R.; Hamdi, S.; Jamoussi, K.; Boudaouara, T.; El-Feki, A.; et al. In Vitro and in Vivo Anti-Diabetic and Anti-Hyperlipidemic Effects of Protein Hydrolysates from Octopus Vulgaris in Alloxanic Rats. Food Res. Int. 2018, 106, 952–963. [Google Scholar] [CrossRef] [PubMed]
- Siala, R.; Chu, A.K.; Bourguiba, H.; Tunisie, M.; Lassoued, I.; Trigui, M.; Ghlissi, Z.; Nasri, R.; Jamoussi, K.; Kessis, M.; et al. Functional and Antioxidant Properties of Protein Hydrolysates from Grey Triggerfish Muscle and in Vivo Evaluation of Hypoglycemic and Hypolipidemic Activities Evaluation of Hypocholesterolemic Effect and Antioxidant Activity of Boops Boops Proteins in Cholesterol-Fed Rats. J. Appl. Environ. Microbiol. 2016, 4, 105–119. [Google Scholar]
- Farias, T.C.; de Souza, T.S.P.; Fai, A.E.C.; Koblitz, M.G.B. Critical Review for the Production of Antidiabetic Peptides by a Bibliometric Approach. Nutrients 2022, 14, 4275. [Google Scholar] [CrossRef] [PubMed]
- Choi, J.S.; Moon, H.E.; Roh, M.K.; Ha, Y.M.; Lee, B.B.; Cho, K.K.; Choi, I.S. Physiological Properties of Scomber Japonicus Meat Hydrolysate Prepared by Subcritical Water Hydrolysis. J. Environ. Biol. 2016, 37, 57–63. [Google Scholar]
- Jeong, Y.-R.; Park, J.-S.; Nkurunziza, D.; Cho, Y.-J.; Chun, B.-S. Valorization of Blue Mussel for the Recovery of Free Amino Acids Rich Products by Subcritical Water Hydrolysis. J. Supercrit. Fluids 2021, 169, 105135. [Google Scholar] [CrossRef]
- Cho, Y.-J.; Haq, M.; Park, J.-S.; Lee, H.-J.; Chun, B.-S. Physicochemical and Biofunctional Properties of Shrimp (Penaeus Japonicus) Hydrolysates Obtained from Hot-Compressed Water Treatment. J. Supercrit. Fluids 2019, 147, 322–328. [Google Scholar] [CrossRef]
- Asaduzzaman, A.K.M.; Chun, B.-S. Recovery of Functional Materials with Thermally Stable Antioxidative Properties in Squid Muscle Hydrolyzates by Subcritical Water. J. Food Sci. Technol. 2015, 52, 793–802. [Google Scholar] [CrossRef] [PubMed]
- Plaza, M.; Amigo-Benavent, M.; del Castillo, M.D.; Ibáñez, E.; Herrero, M. Neoformation of Antioxidants in Glycation Model Systems Treated under Subcritical Water Extraction Conditions. Food Res. Int. 2010, 43, 1123–1129. [Google Scholar] [CrossRef]
- Tadesse, S.A.; Emire, S.A.; Barea, P.; Illera, A.E.; Melgosa, R.; Beltrán, S.; Sanz, M.T. Potential of Subcritical Water Hydrolysis to Valorize Low-Valued Ray-Finned Fish (Labeobarbus nedgia): Effects of Hydrolysis Temperature and Pressurization Agent. Foods 2024, 13, 1462. [Google Scholar] [CrossRef]
- Asaduzzaman, A.K.M.; Getachew, A.T.; Cho, Y.-J.; Park, J.-S.; Haq, M.; Chun, B.-S. Characterization of Pepsin-Solubilised Collagen Recovered from Mackerel (Scomber japonicus) Bone and Skin Using Subcritical Water Hydrolysis. Int. J. Biol. Macromol. 2020, 148, 1290–1297. [Google Scholar] [CrossRef]

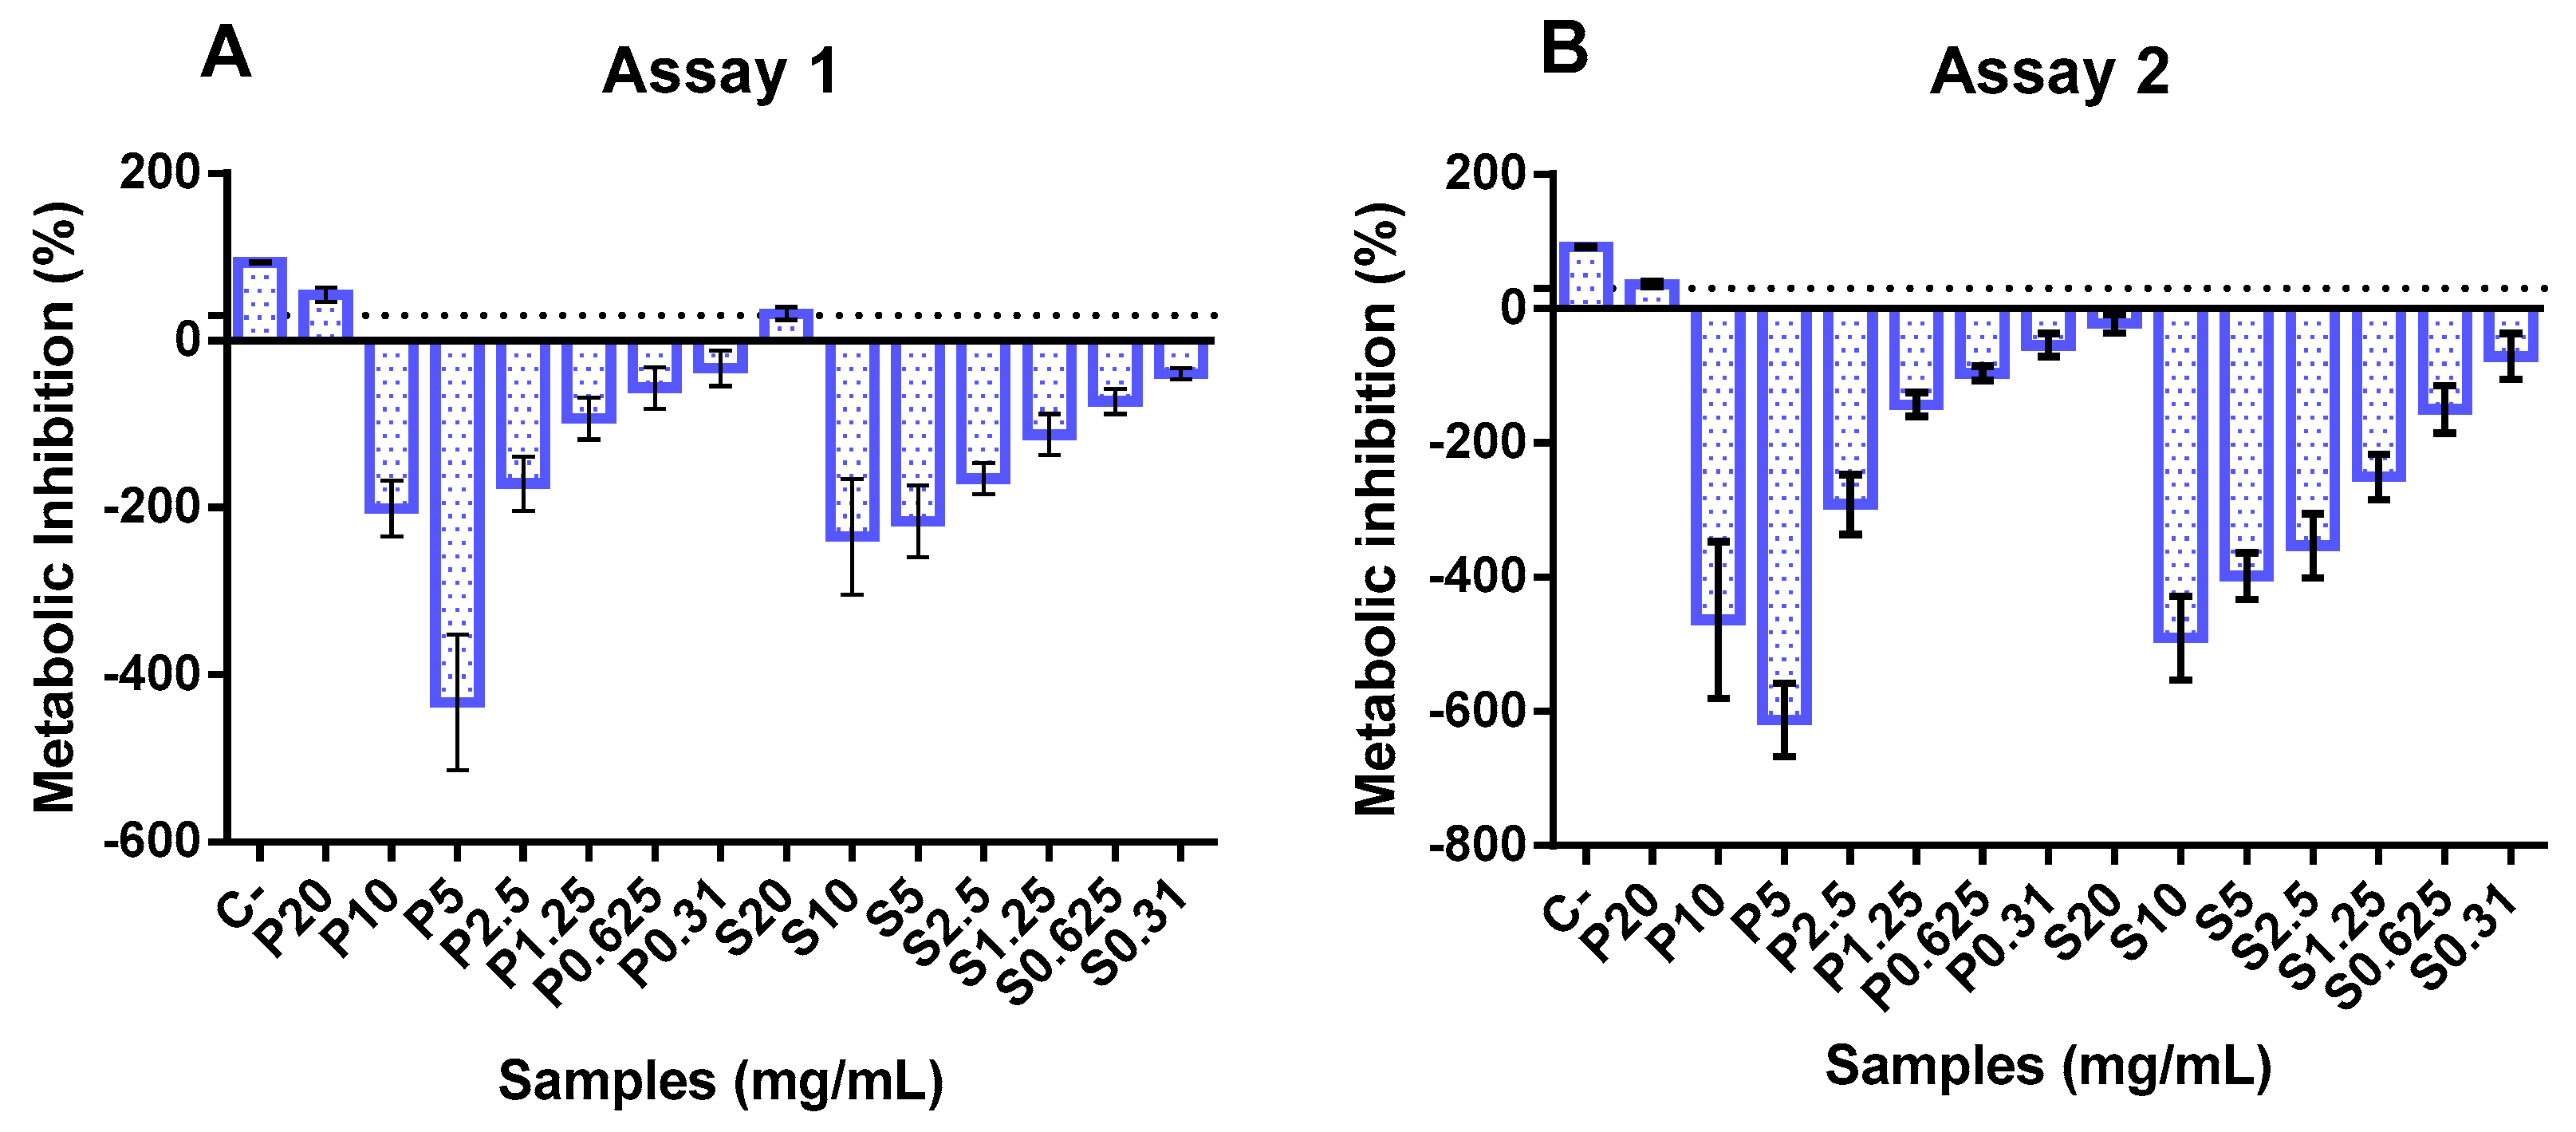
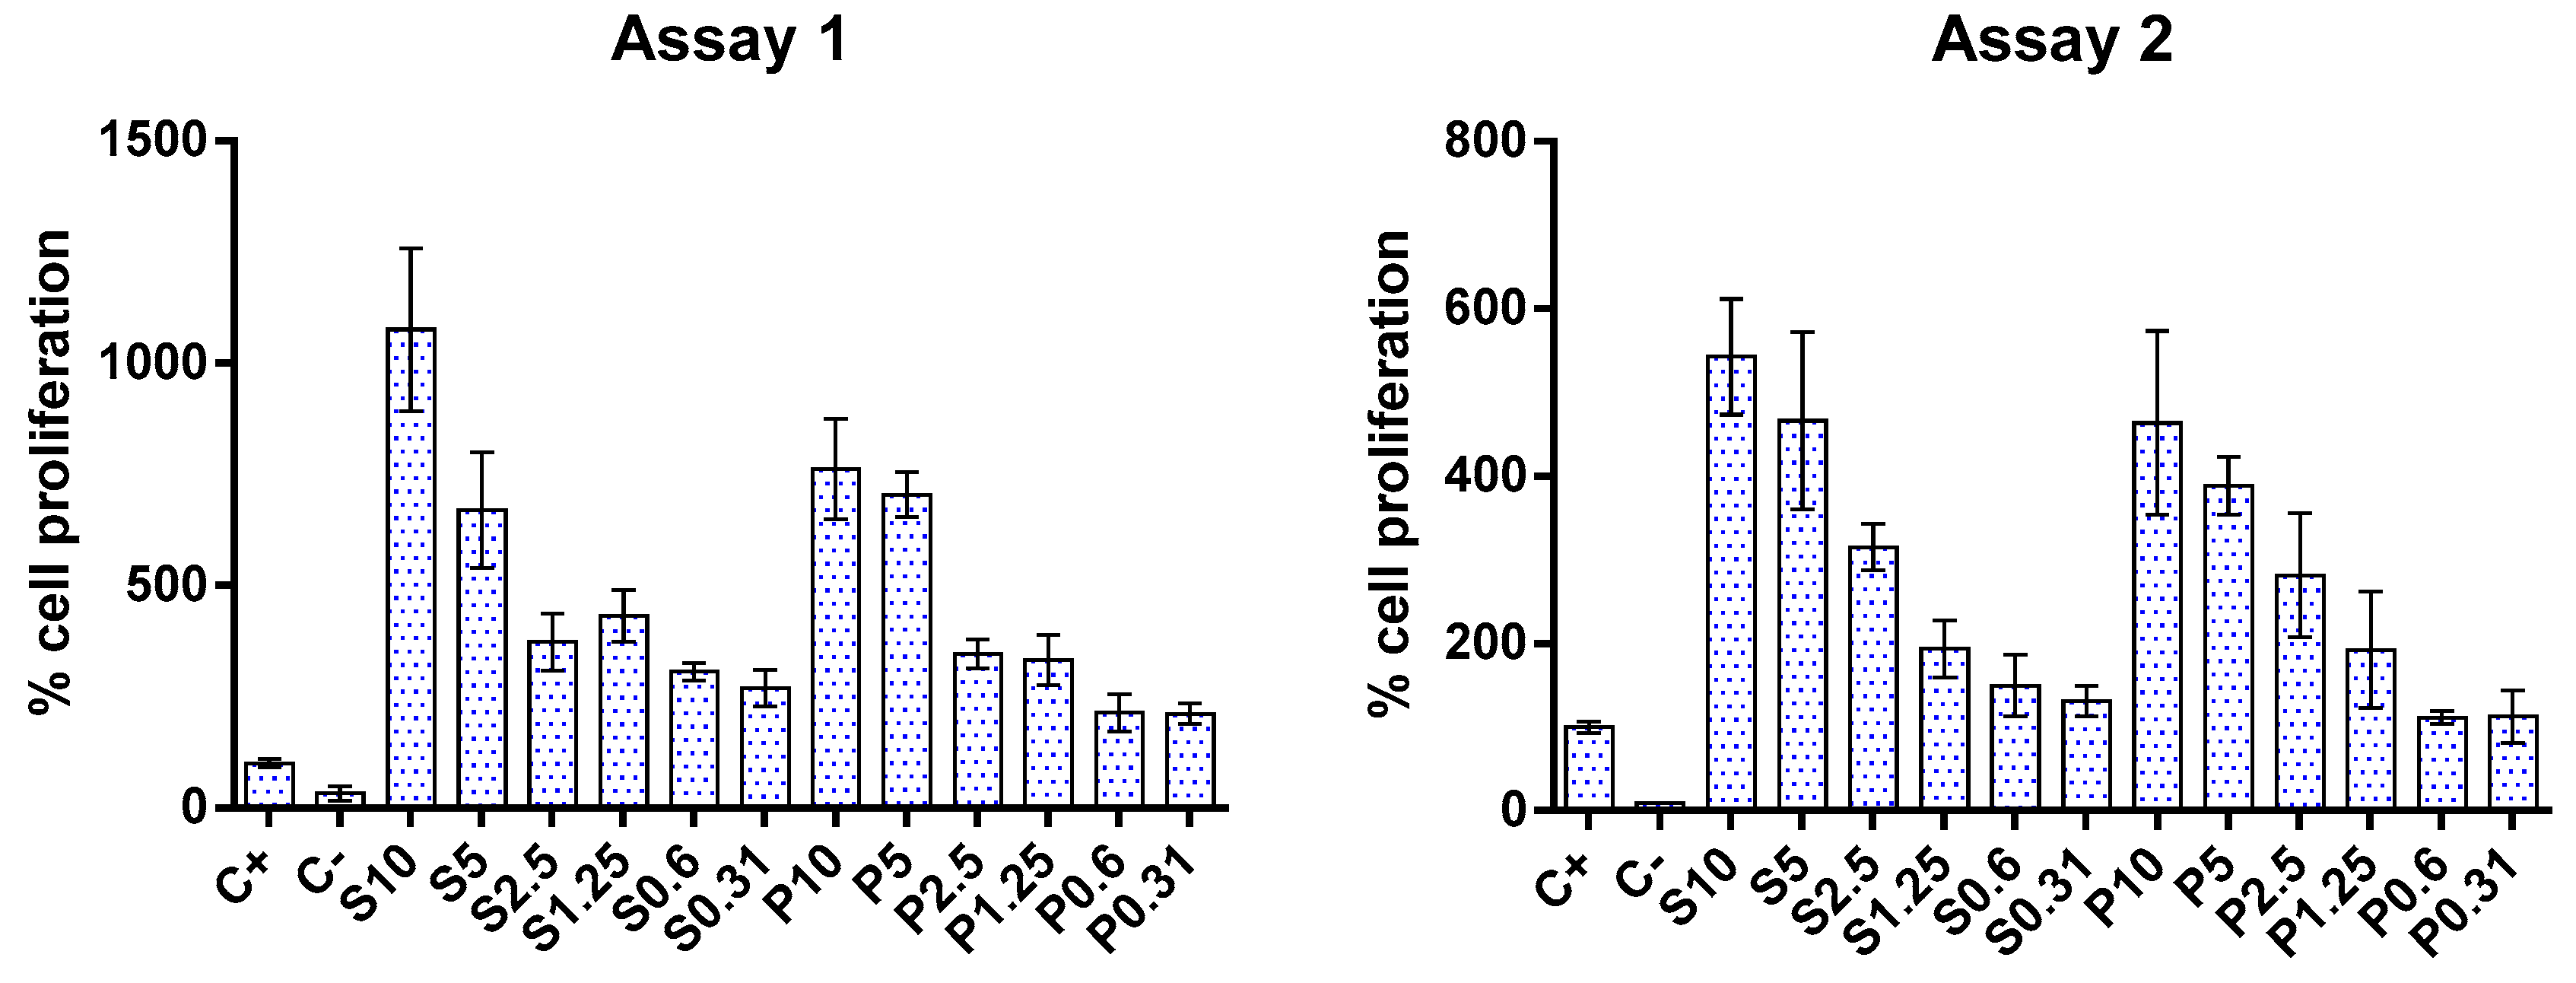
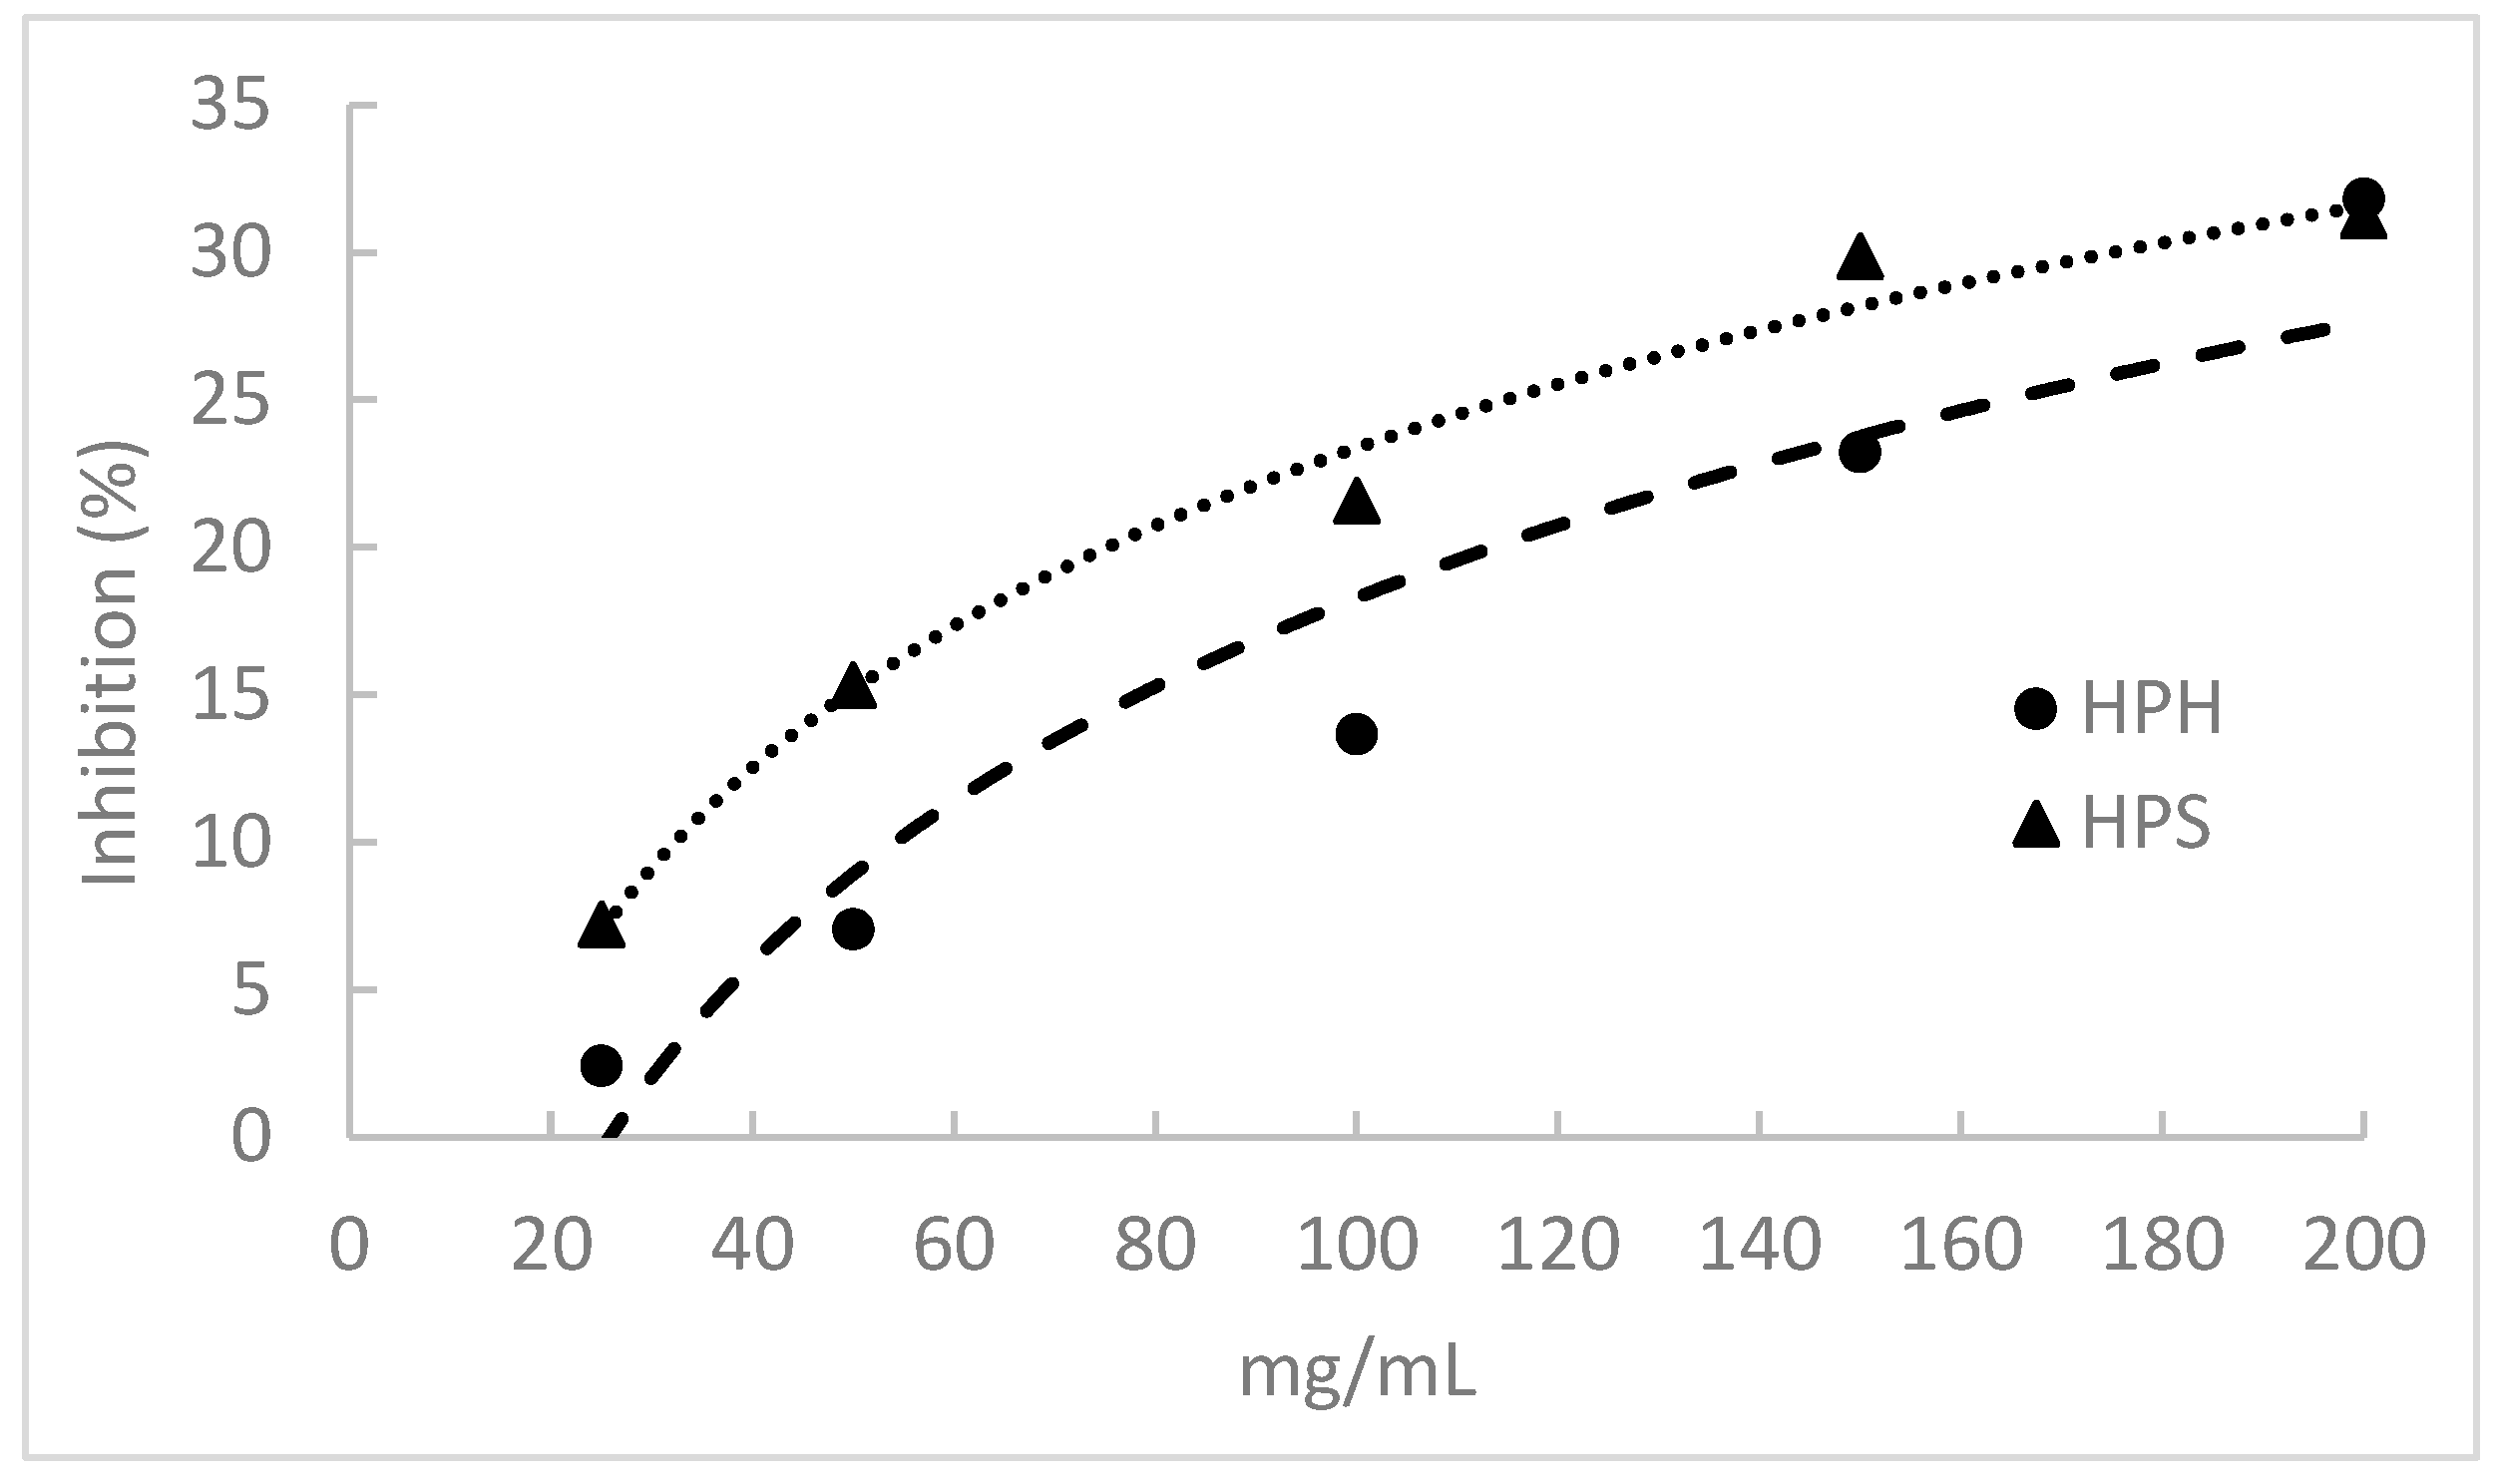
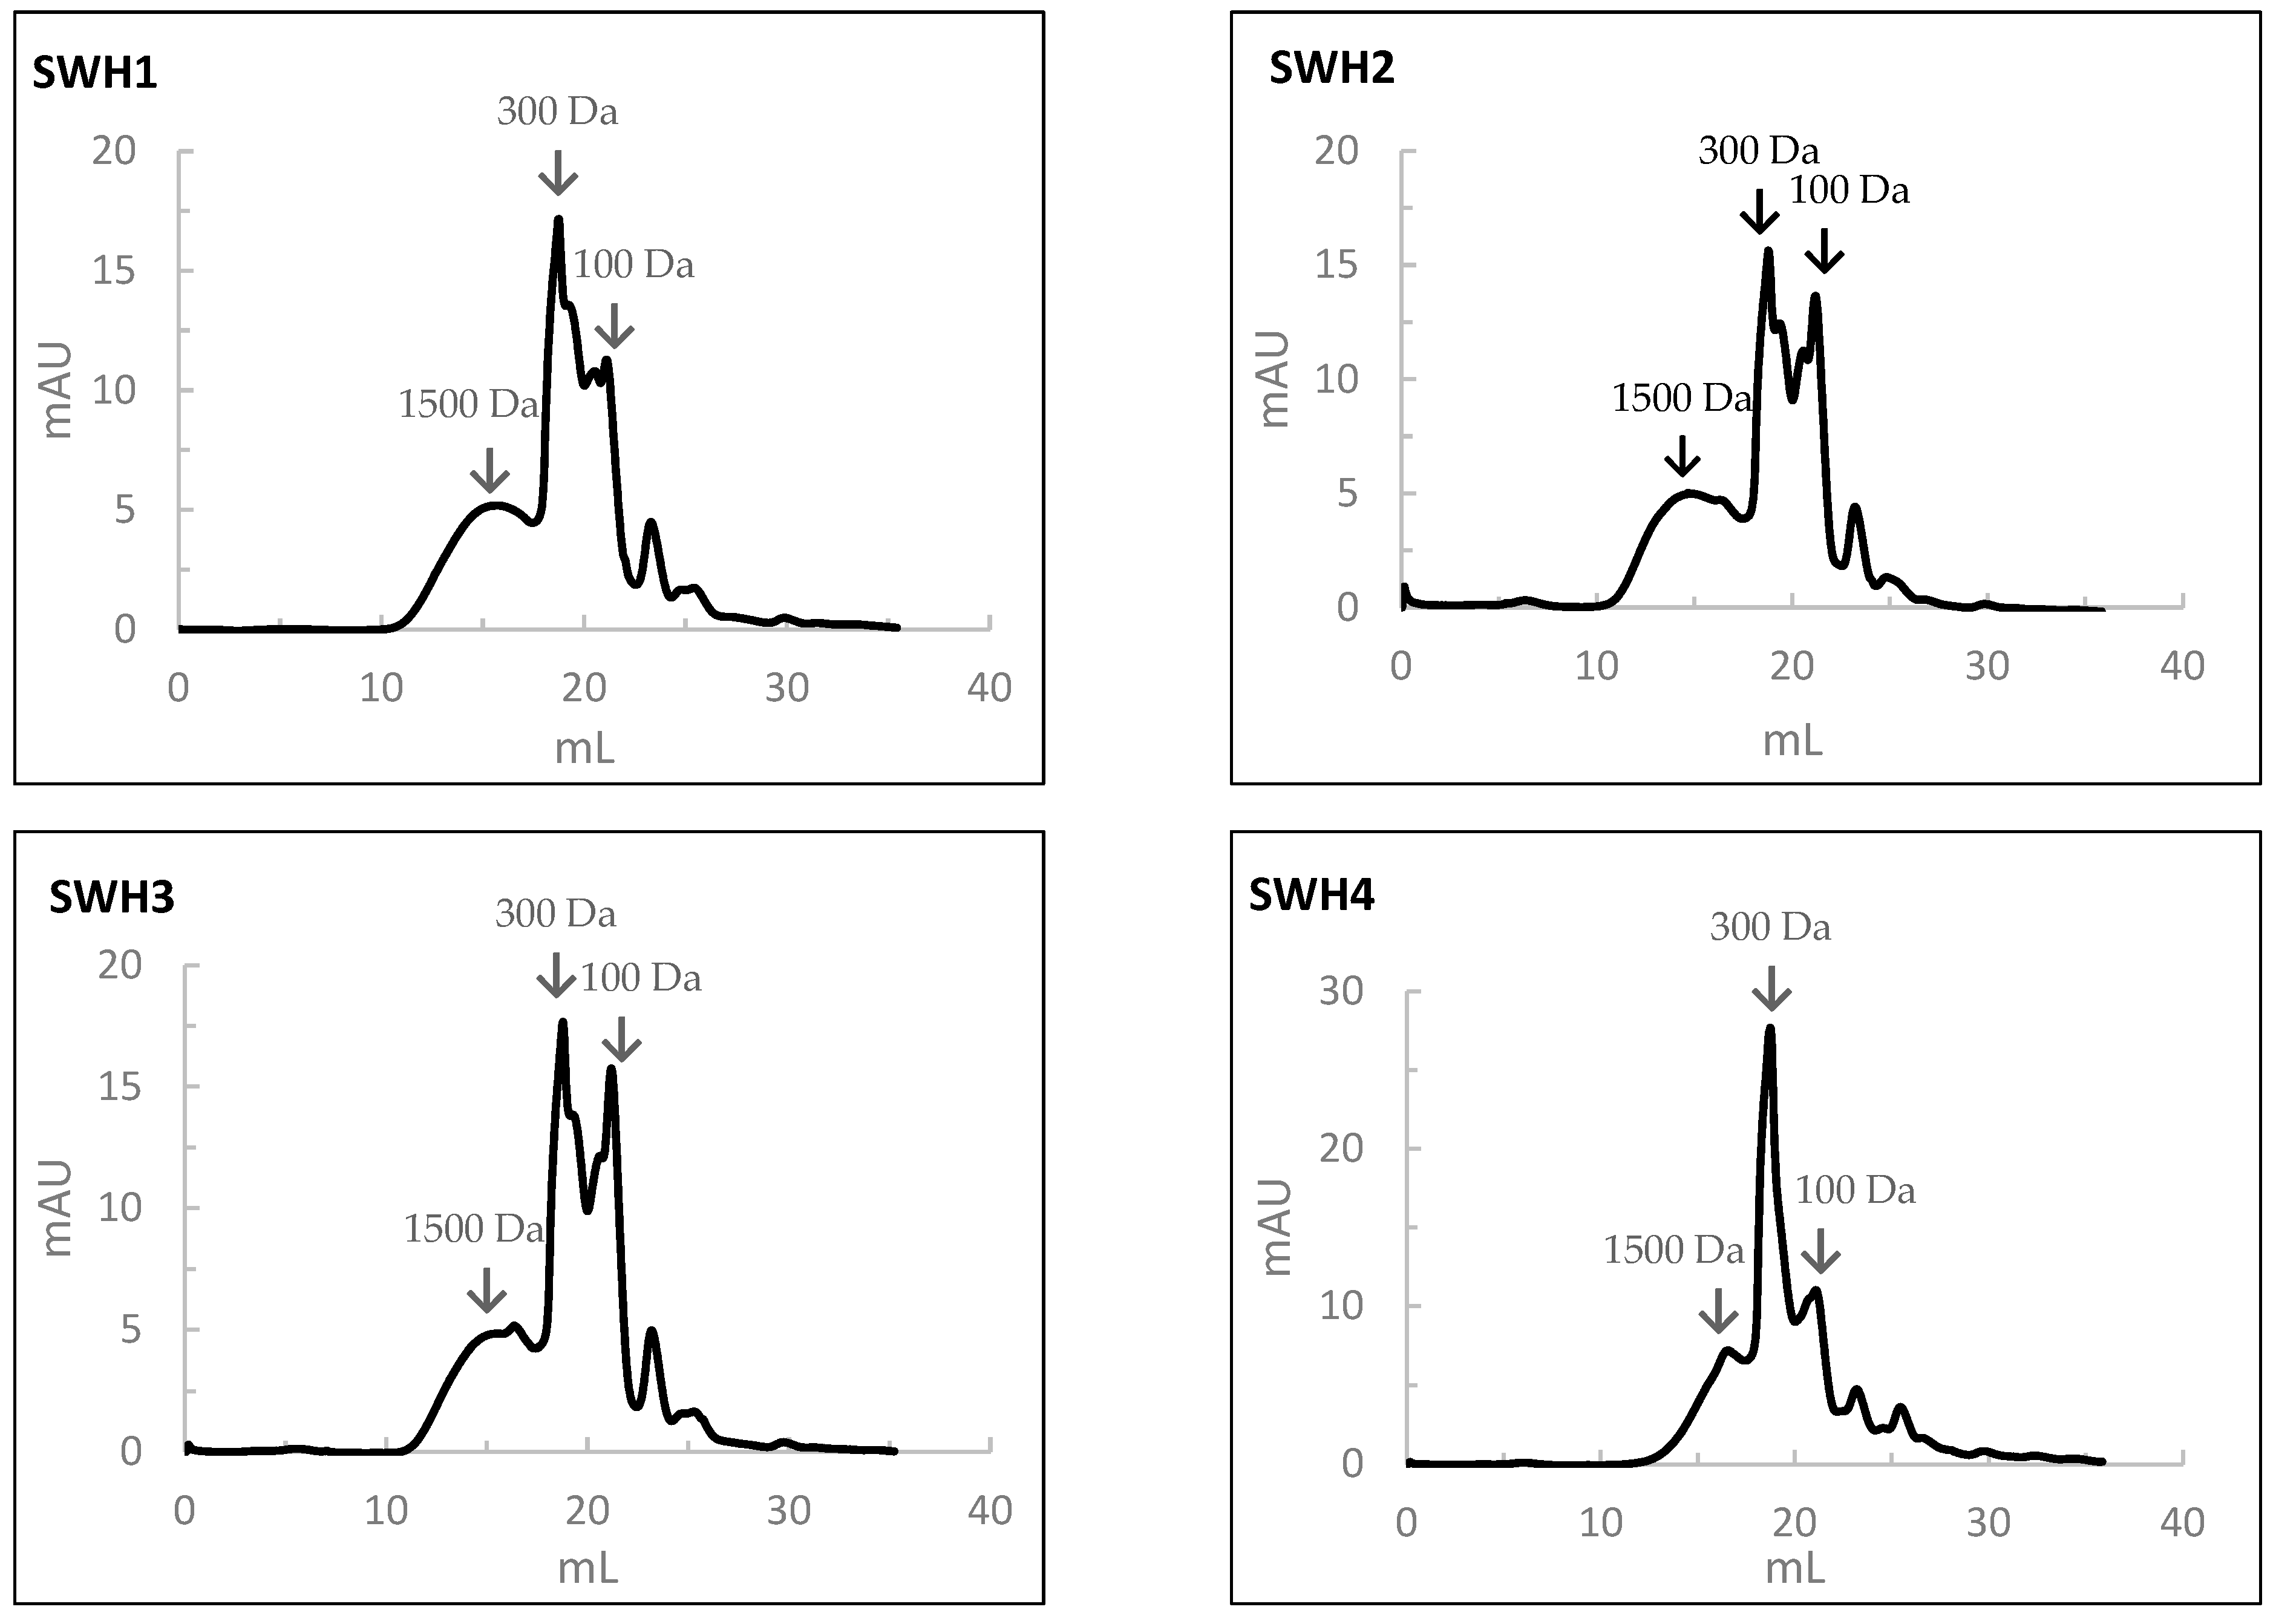
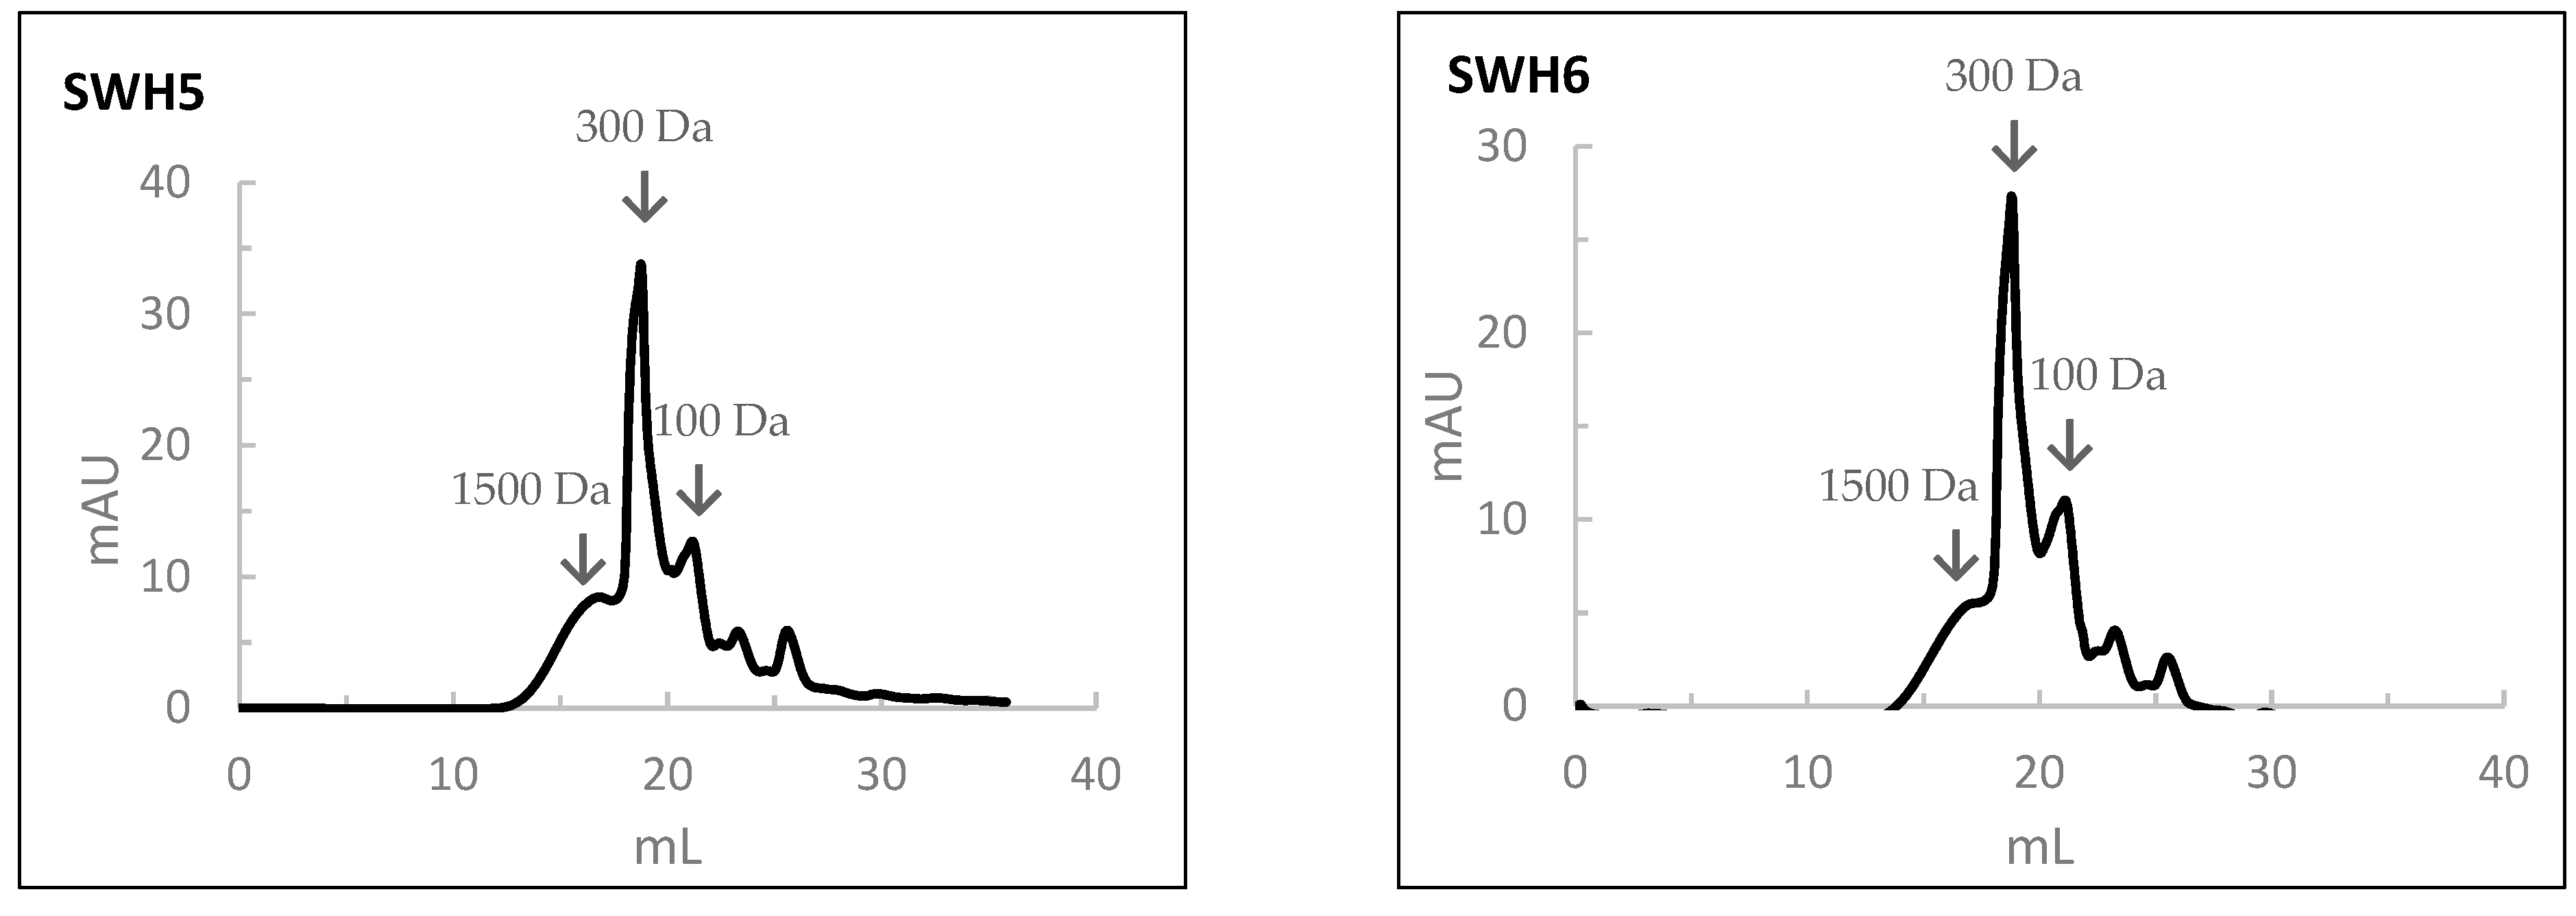
Disclaimer/Publisher’s Note: The statements, opinions and data contained in all publications are solely those of the individual author(s) and contributor(s) and not of MDPI and/or the editor(s). MDPI and/or the editor(s) disclaim responsibility for any injury to people or property resulting from any ideas, methods, instructions or products referred to in the content. |
© 2024 by the authors. Licensee MDPI, Basel, Switzerland. This article is an open access article distributed under the terms and conditions of the Creative Commons Attribution (CC BY) license (https://creativecommons.org/licenses/by/4.0/).