
Hydrogen Gas-Grilling in Meat: Impact on Odor Profile and Contents of Polycyclic Aromatic Hydrocarbons and Volatile Organic Compounds

 ,
,  , , and
Abstract

1. Introduction
2. Materials and Methods
2.1. Materials
2.1.1. Meat Sample
2.1.2. Reagents and Standards
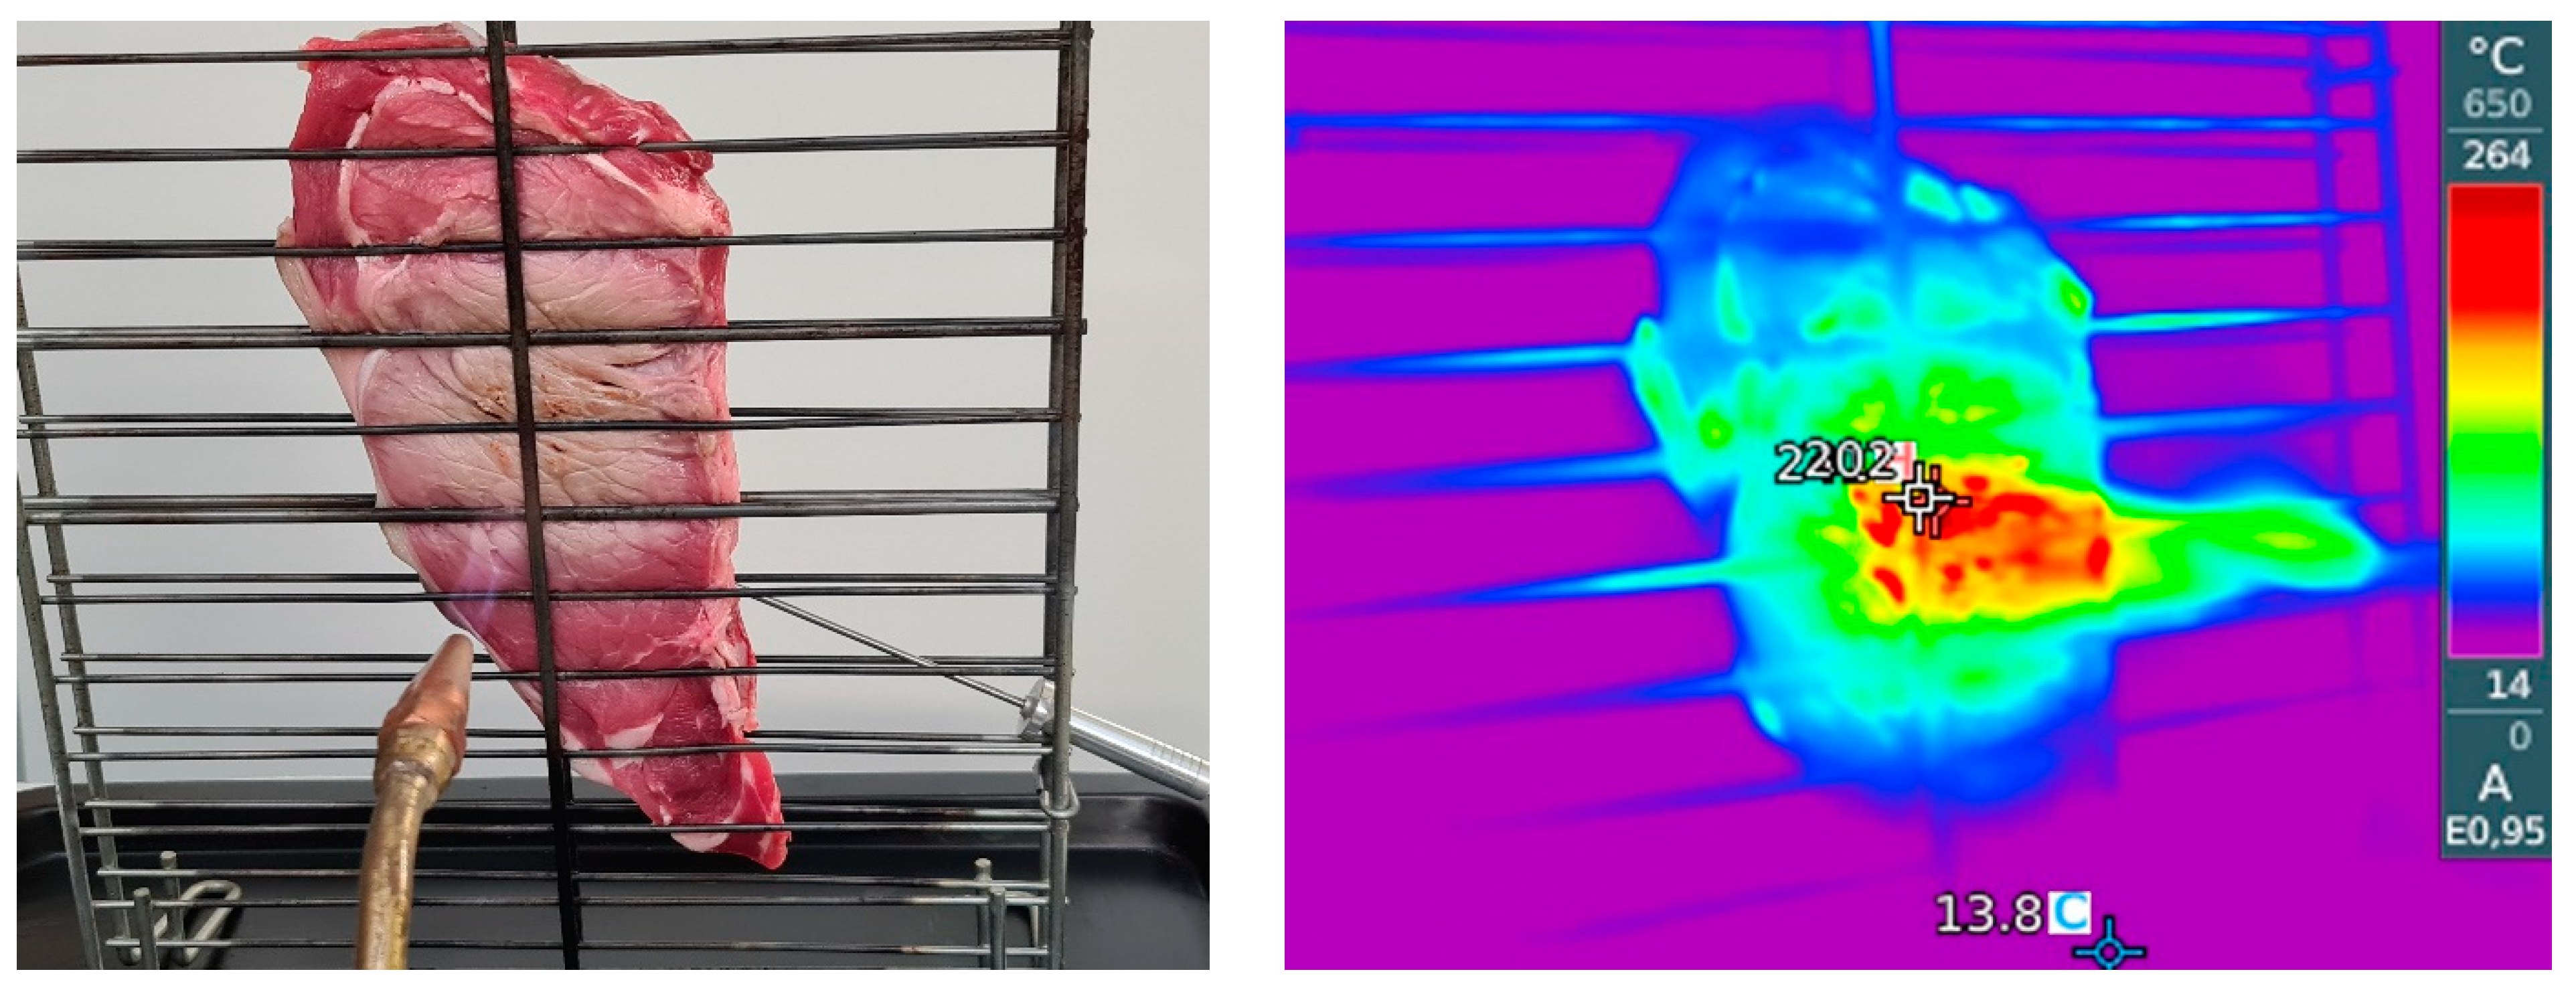
2.2. Sample Preparation and Gas-Grilling Method
2.3. Polycyclic Aromatic Hydrocarbon Analysis
2.3.1. Extraction by QuEChERS Method
2.3.2. GC-MS Analysis
2.3.3. Calibration, Quantification, and Method of Validation
2.4. Volatile Organic Compounds by GC-MS Analysis
2.5. Odor Profile by e-Nose
2.6. Statistical Analysis
3. Results and Discussion
3.1. Effects of Gas-Grilling on PAHs
3.2. Effects of Gas-Grilling on VOCs
3.3. Effects of Gas-Grilling on Odor Profile by e-Nose
4. Conclusions
Supplementary Materials
Author Contributions
Funding
Institutional Review Board Statement
Informed Consent Statement
Data Availability Statement
Conflicts of Interest
References
- Bleicher, J.; Ebner, E.E.; Bak, K.H. Formation and analysis of volatile and odor compounds in meat—A review. Molecules 2022, 27, 6703. [Google Scholar] [CrossRef] [PubMed]
- Sumer, G.; Oz, F. The effect of direct and indirect barbecue cooking on polycyclic aromatic hydrocarbon formation and beef quality. Foods 2023, 12, 1374. [Google Scholar] [CrossRef] [PubMed]
- Bassam, S.M.; Noleto-Dias, C.; Farag, M.A. Dissecting grilled red and white meat flavor: Its characteristics, production mechanisms, influencing factors and chemical hazards. Food Chem. 2022, 371, 131139. [Google Scholar] [CrossRef] [PubMed]
- WHO. Evaluation of Certain Food Contaminants: Sixty-Fourth Report of the Joint FAO/WHO Expert Committee on Food Additives; World Health Organization: Geneva, Switzerland, 2006; p. 109. [Google Scholar]
- Jägerstad, M.; Skog, K. Genotoxicity of heat-processed foods. Mutat. Res. 2005, 574, 156–172. [Google Scholar] [CrossRef] [PubMed]
- EU. Commission Regulation (EU) 2023/915 of 25 April 2023 on Maximum Levels for Certain Contaminants in Food and Repealing Regulation (EC) No 1881/2006 (Text with EEA Relevance); EU: Maastricht, The Netherlands, 2023; Volume 119. [Google Scholar]
- Edna Hee, P.-T.; Liang, Z.; Zhang, P.; Fang, Z. Formation mechanisms, detection methods and mitigation strategies of acrylamide, polycyclic aromatic hydrocarbons and heterocyclic amines in food products. Food Control 2024, 158, 110236. [Google Scholar] [CrossRef]
- Onopiuk, A.; Kołodziejczak, K.; Szpicer, A.; Wojtasik-Kalinowska, I.; Wierzbicka, A.; Półtorak, A. Analysis of factors that influence the PAH profile and amount in meat products subjected to thermal processing. Trends Food Sci. Technol. 2021, 115, 366–379. [Google Scholar] [CrossRef]
- Lee, J.-G.; Kim, S.-Y.; Moon, J.-S.; Kim, S.-H.; Kang, D.-H.; Yoon, H.-J. Effects of grilling procedures on levels of polycyclic aromatic hydrocarbons in grilled meats. Food Chem. 2016, 199, 632–638. [Google Scholar] [CrossRef] [PubMed]
- Saint-Aubert, B.; Cooper, J.F.; Astre, C.; Spiliotis, J.; Joyeux, H. Evaluation of the induction of polycyclic aromatic hydrocarbons (PAH) by cooking on two geometrically different types of barbecue. J. Food Compos. Anal. 1992, 5, 257–263. [Google Scholar] [CrossRef]
- Kerth, C.R.; Miller, R.K. Beef flavor: A review from chemistry to consumer. J. Sci. Food Agric. 2015, 95, 2783–2798. [Google Scholar] [CrossRef]
- Anwar, H.; Anwar, T.; Murtaza, S. Review on food quality assessment using machine learning and electronic nose system. Biosens. Bioelectron. X 2023, 14, 100365. [Google Scholar] [CrossRef]
- Munekata, P.E.S.; Finardi, S.; de Souza, C.K.; Meinert, C.; Pateiro, M.; Hoffmann, T.G.; Domínguez, R.; Bertoli, S.L.; Kumar, M.; Lorenzo, J.M. Applications of electronic nose, electronic eye and electronic tongue in quality, safety and shelf life of meat and meat products: A review. Sensors 2023, 23, 672. [Google Scholar] [CrossRef] [PubMed]
- Weber, K.; Kearley, M.E.; Marini, A.M.; Pressman, P.; Hayes, A.W. A review of horses sent to slaughter for human consumption: Impact of horsemeat consumption, residual banned drugs, and public health risks. Am. J. Vet. Res. 2023, 84. [Google Scholar] [CrossRef] [PubMed]
- Aaslyng, M.D.; Duedahl-Olesen, L.; Jensen, K.; Meinert, L. Content of heterocyclic amines and polycyclic aromatic hydrocarbons in pork, beef and chicken barbecued at home by Danish consumers. Meat Sci. 2013, 93, 85–91. [Google Scholar] [CrossRef] [PubMed]
- Domínguez, R.; Gómez, M.; Fonseca, S.; Lorenzo, J.M. Effect of different cooking methods on lipid oxidation and formation of volatile compounds in foal meat. Meat Sci. 2014, 97, 223–230. [Google Scholar] [CrossRef] [PubMed]
- Domínguez, R.; Gómez, M.; Fonseca, S.; Lorenzo, J.M. Influence of thermal treatment on formation of volatile compounds, cooking loss and lipid oxidation in foal meat. LWT Food Sci. Technol. 2014, 58, 439–445. [Google Scholar] [CrossRef]
- Lorenzo, J.M.; Domínguez, R. Cooking losses, lipid oxidation and formation of volatile compounds in foal meat as affected by cooking procedure. Flavour Fragr. J. 2014, 29, 240–248. [Google Scholar] [CrossRef]
- Maggiolino, A.; Lorenzo, J.M.; Marino, R.; della Malva, A.; Centoducati, P.; De Palo, P. Foal meat volatile compounds: Effect of vacuum ageing on semimembranosus muscle. J. Sci. Food Agric. 2019, 99, 1660–1667. [Google Scholar] [CrossRef] [PubMed]
- Fedorov, F.S.; Yaqin, A.; Krasnikov, D.V.; Kondrashov, V.A.; Ovchinnikov, G.; Kostyukevich, Y.; Osipenko, S.; Nasibulin, A.G. Detecting cooking state of grilled chicken by electronic nose and computer vision techniques. Food Chem. 2021, 345, 128747. [Google Scholar] [CrossRef]
- Shen, C.; Cai, Y.; Ding, M.; Wu, X.; Cai, G.; Wang, B.; Gai, S.; Liu, D. Predicting VOCs content and roasting methods of lamb shashliks using deep learning combined with chemometrics and sensory evaluation. Food Chem. X 2023, 19, 100755. [Google Scholar] [CrossRef]
- Grigioni, G.; Paschettas, F.; Soteras, T.; Messina, V. Odour profile of beef using an electronic nose based on MOS-sensor. Sens. Transducers J. 2013, 149, 199–204. [Google Scholar]
- Cittadini, A.; Domínguez, R.; Pateiro, M.; Sarriés, M.V.; Lorenzo, J.M. Fatty acid composition and volatile profile of longissimus thoracis et lumborum muscle from Burguete and Jaca Navarra foals fattened with different finishing diets. Foods 2021, 10, 2914. [Google Scholar] [CrossRef] [PubMed]
- Surma, M.; Sadowska-Rociek, A.; Cieślik, E. The application of d-SPE in the QuEChERS method for the determination of PAHs in food of animal origin with GC–MS detection. Eur. Food Res. Technol. 2014, 238, 1029–1036. [Google Scholar] [CrossRef]
- Duedahl-Olesen, L.; Aaslyng, M.; Meinert, L.; Christensen, T.; Jensen, A.H.; Binderup, M.-L. Polycyclic aromatic hydrocarbons (PAH) in Danish barbecued meat. Food Control 2015, 57, 169–176. [Google Scholar] [CrossRef]
- Gorraiz, C.; Beriain, M.j.; Chasco, J.; Insausti, K. Effect of aging time on volatile compounds, odor, and flavor of cooked beef from Pirenaica and Friesian bulls and heifers. J. Food Sci. 2002, 67, 916–922. [Google Scholar] [CrossRef]
- Castello, G.; Moretti, P.; Vezzani, S. Retention models for programmed gas chromatography. J. Chromatogr. A 2009, 1216, 1607–1623. [Google Scholar] [CrossRef] [PubMed]
- Doleman, B.J.; Severin, E.J.; Lewis, N.S. Trends in odor intensity for human and electronic noses: Relative roles of odorant vapor pressure vs. molecularly specific odorant binding. Proc. Natl. Acad. Sci. USA 1998, 95, 5442–5447. [Google Scholar] [CrossRef] [PubMed]
- Devore, J.L. Probability and Statistics for Engineering and the Sciences (International Metric Edition), 9th ed.; Cengage Learning (EMEA) Ltd.: Hampshire, UK, 2016; ISBN 978-1-337-41938-3. [Google Scholar]
- Cittadini, A.; Sarriés, M.V.; Domínguez, R.; Pateiro, M.; Lorenzo, J.M. Effect of breed and finishing diet on chemical composition and quality parameters of meat from Burguete and Jaca Navarra foals. Animals 2022, 12, 568. [Google Scholar] [CrossRef] [PubMed]
- López-Pedrouso, M.; Lorenzo, J.M.; Cittadini, A.; Sarries, M.V.; Gagaoua, M.; Franco, D. A proteomic approach to identify biomarkers of foal meat quality: A focus on tenderness, color and intramuscular fat traits. Food Chem. 2023, 405, 134805. [Google Scholar] [CrossRef] [PubMed]
- Sarriés, M.V.; Beriain, M.J. Carcass characteristics and meat quality of male and female foals. Meat Sci. 2005, 70, 141–152. [Google Scholar] [CrossRef]
- Ahmad Kamal, N.H.; Selamat, J.; Sanny, M. Simultaneous formation of polycyclic aromatic hydrocarbons (PAHs) and heterocyclic aromatic amines (HCAs) in gas-grilled beef satay at different temperatures. Food Addit. Contam. Part A 2018, 35, 848–869. [Google Scholar] [CrossRef]
- Das, A.K.; Bhattacharya, D.; Das, A.; Nath, S.; Bandyopadhyay, S.; Nanda, P.K.; Gagaoua, M. Current innovative approaches in reducing polycyclic aromatic hydrocarbons (PAHs) in processed meat and meat products. Chem. Biol. Technol. Agric. 2023, 10, 109. [Google Scholar] [CrossRef]
- Lu, J.; Zhang, Y.; Zhou, H.; Cai, K.; Xu, B. A review of hazards in meat products: Multiple pathways, hazards and mitigation of polycyclic aromatic hydrocarbons. Food Chem. 2024, 445, 138718. [Google Scholar] [CrossRef] [PubMed]
- Sampaio, G.R.; Guizellini, G.M.; da Silva, S.A.; de Almeida, A.P.; Pinaffi-Langley, A.C.C.; Rogero, M.M.; de Camargo, A.C.; Torres, E.A.F.S. Polycyclic aromatic hydrocarbons in foods: Biological effects, legislation, occurrence, analytical methods, and strategies to reduce their formation. Int. J. Mol. Sci. 2021, 22, 6010. [Google Scholar] [CrossRef] [PubMed]
- Beldarrain, L.R.; Morán, L.; Sentandreu, M.Á.; Barron, L.J.R.; Aldai, N. Effect of ageing time on the volatile compounds from cooked horse meat. Meat Sci. 2022, 184, 108692. [Google Scholar] [CrossRef] [PubMed]
- Le Quéré, J.-L.; Schoumacker, R. Dynamic instrumental and sensory methods used to link aroma release and aroma perception: A review. Molecules 2023, 28, 6308. [Google Scholar] [CrossRef]
- Górska-Horczyczak, E.; Guzek, D.; Molęda, Z.; Wojtasik-Kalinowska, I.; Brodowska, M.; Wierzbicka, A. Applications of electronic noses in meat analysis. Food Sci. Technol. 2016, 36, 389–395. [Google Scholar] [CrossRef]
 : group centroid.
: group centroid.
: group centroid.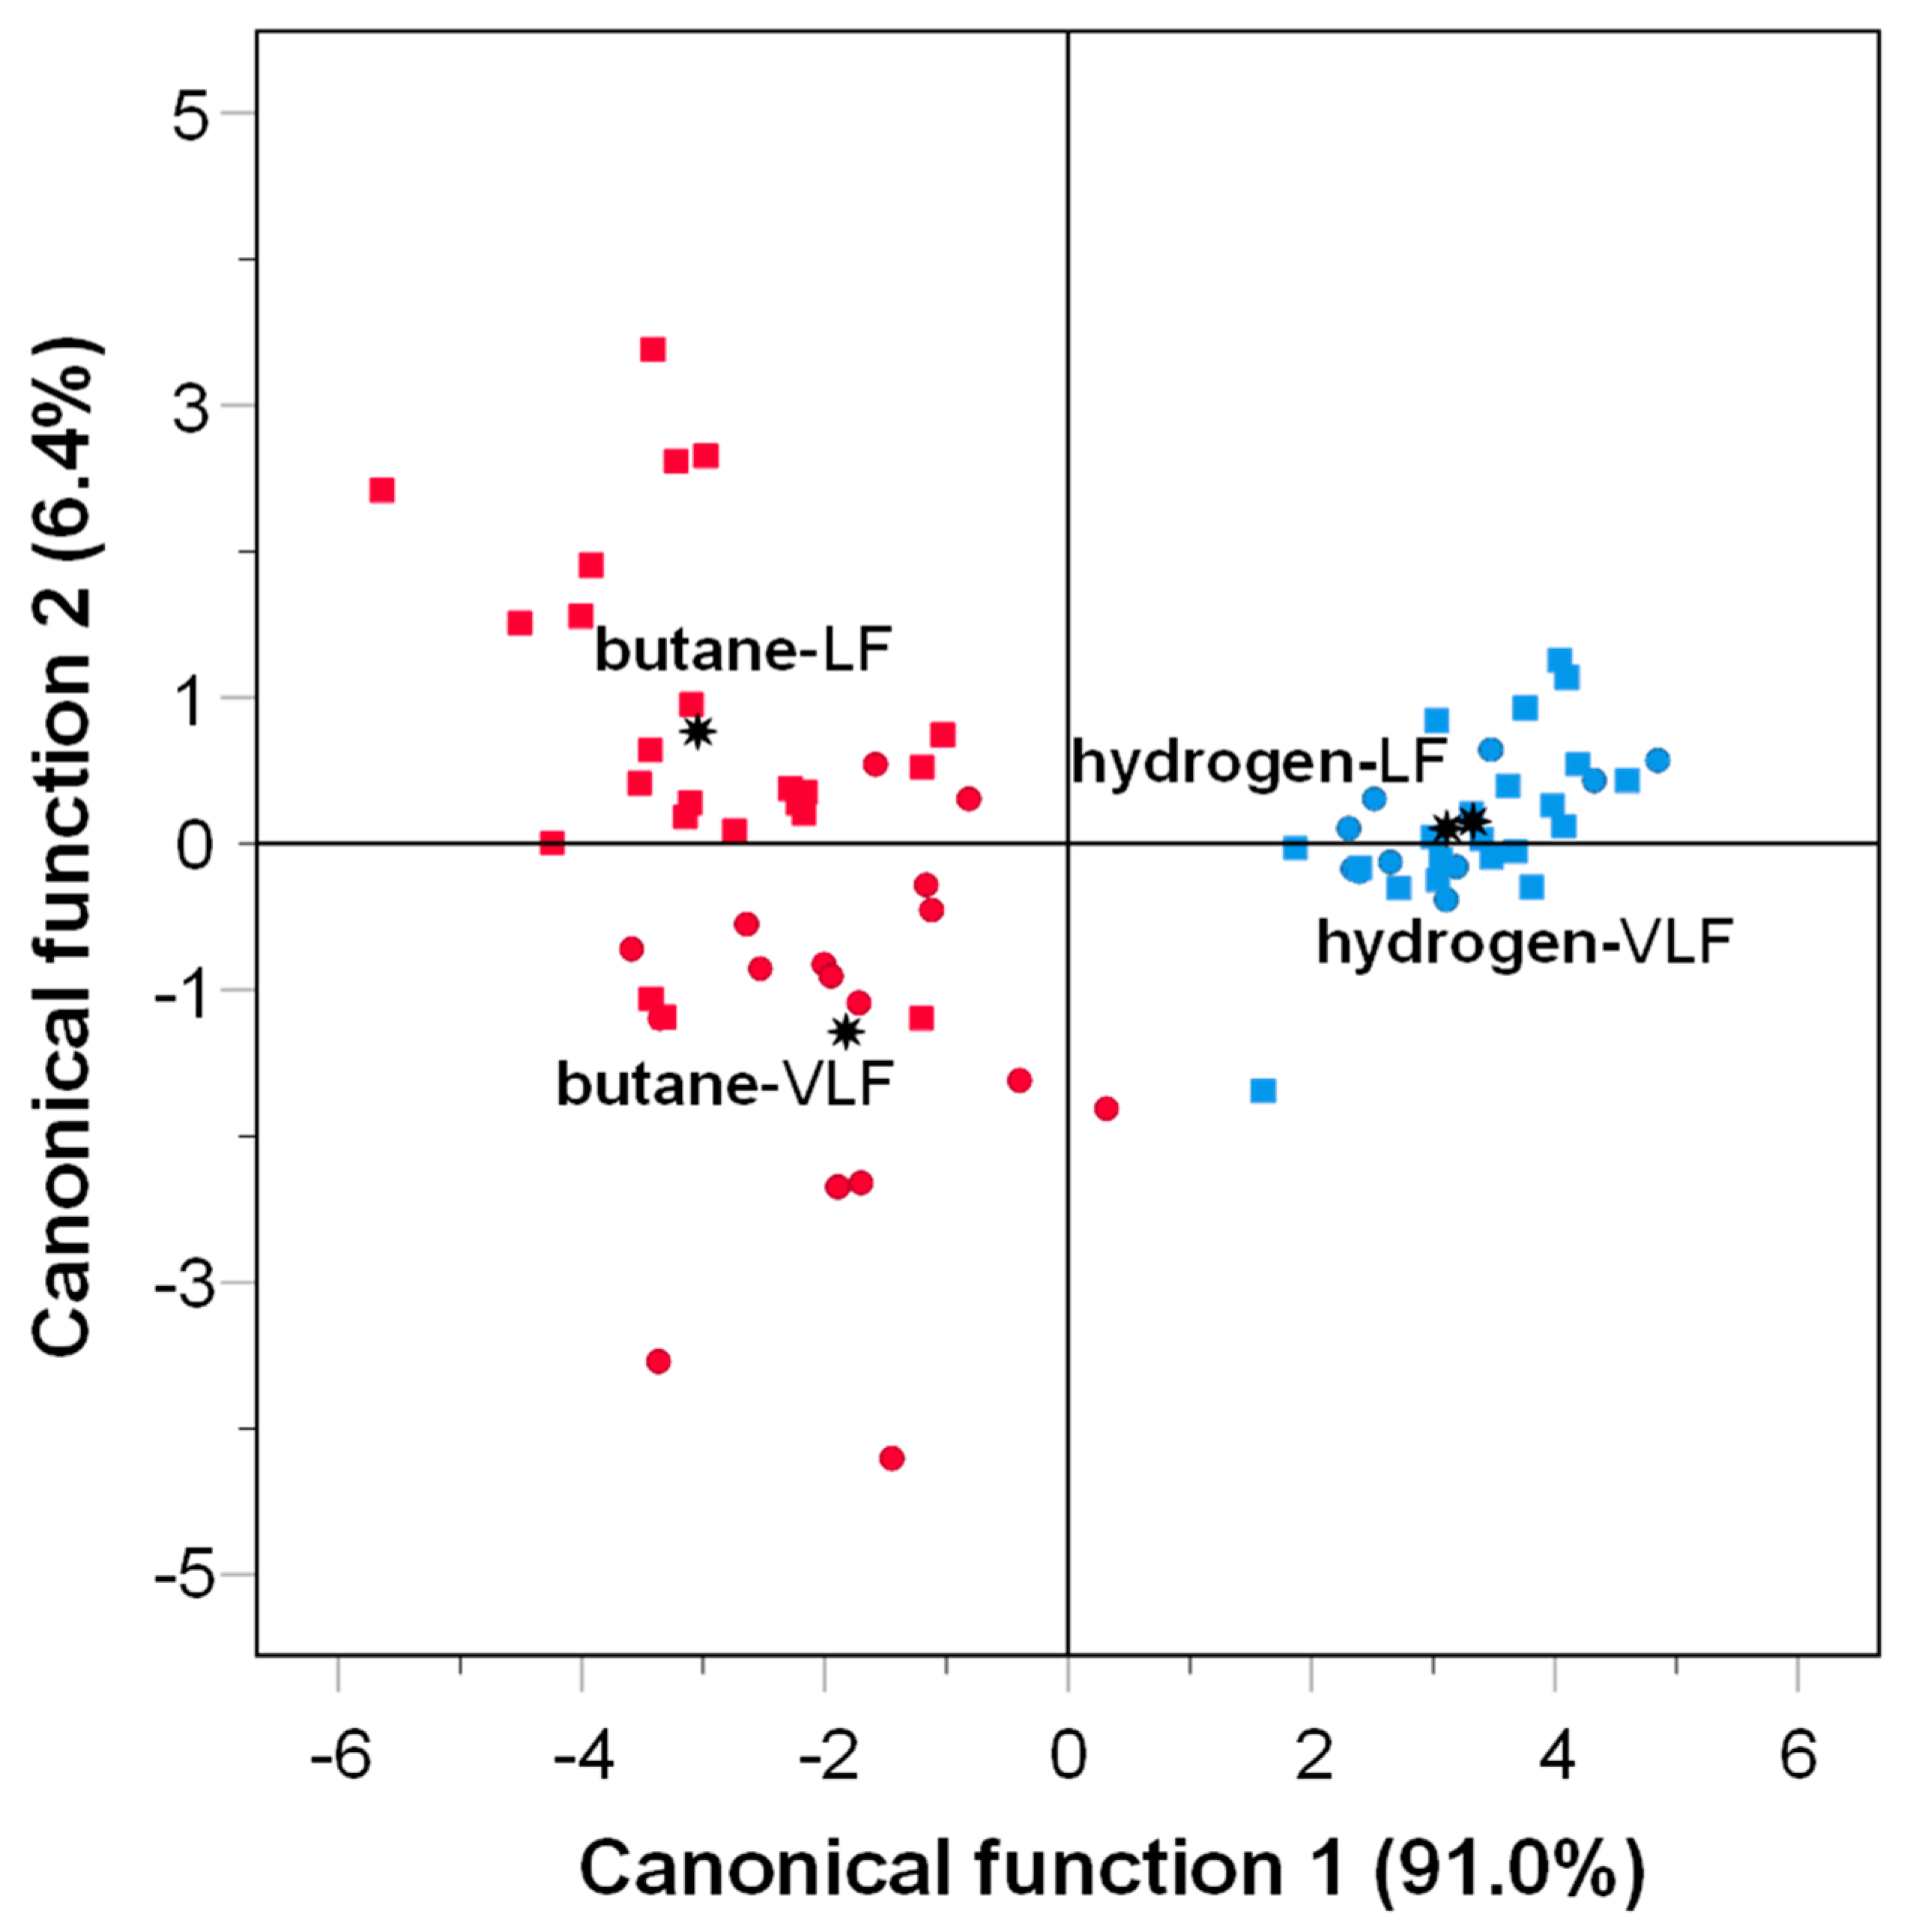 : group centroid.
: group centroid.
: group centroid.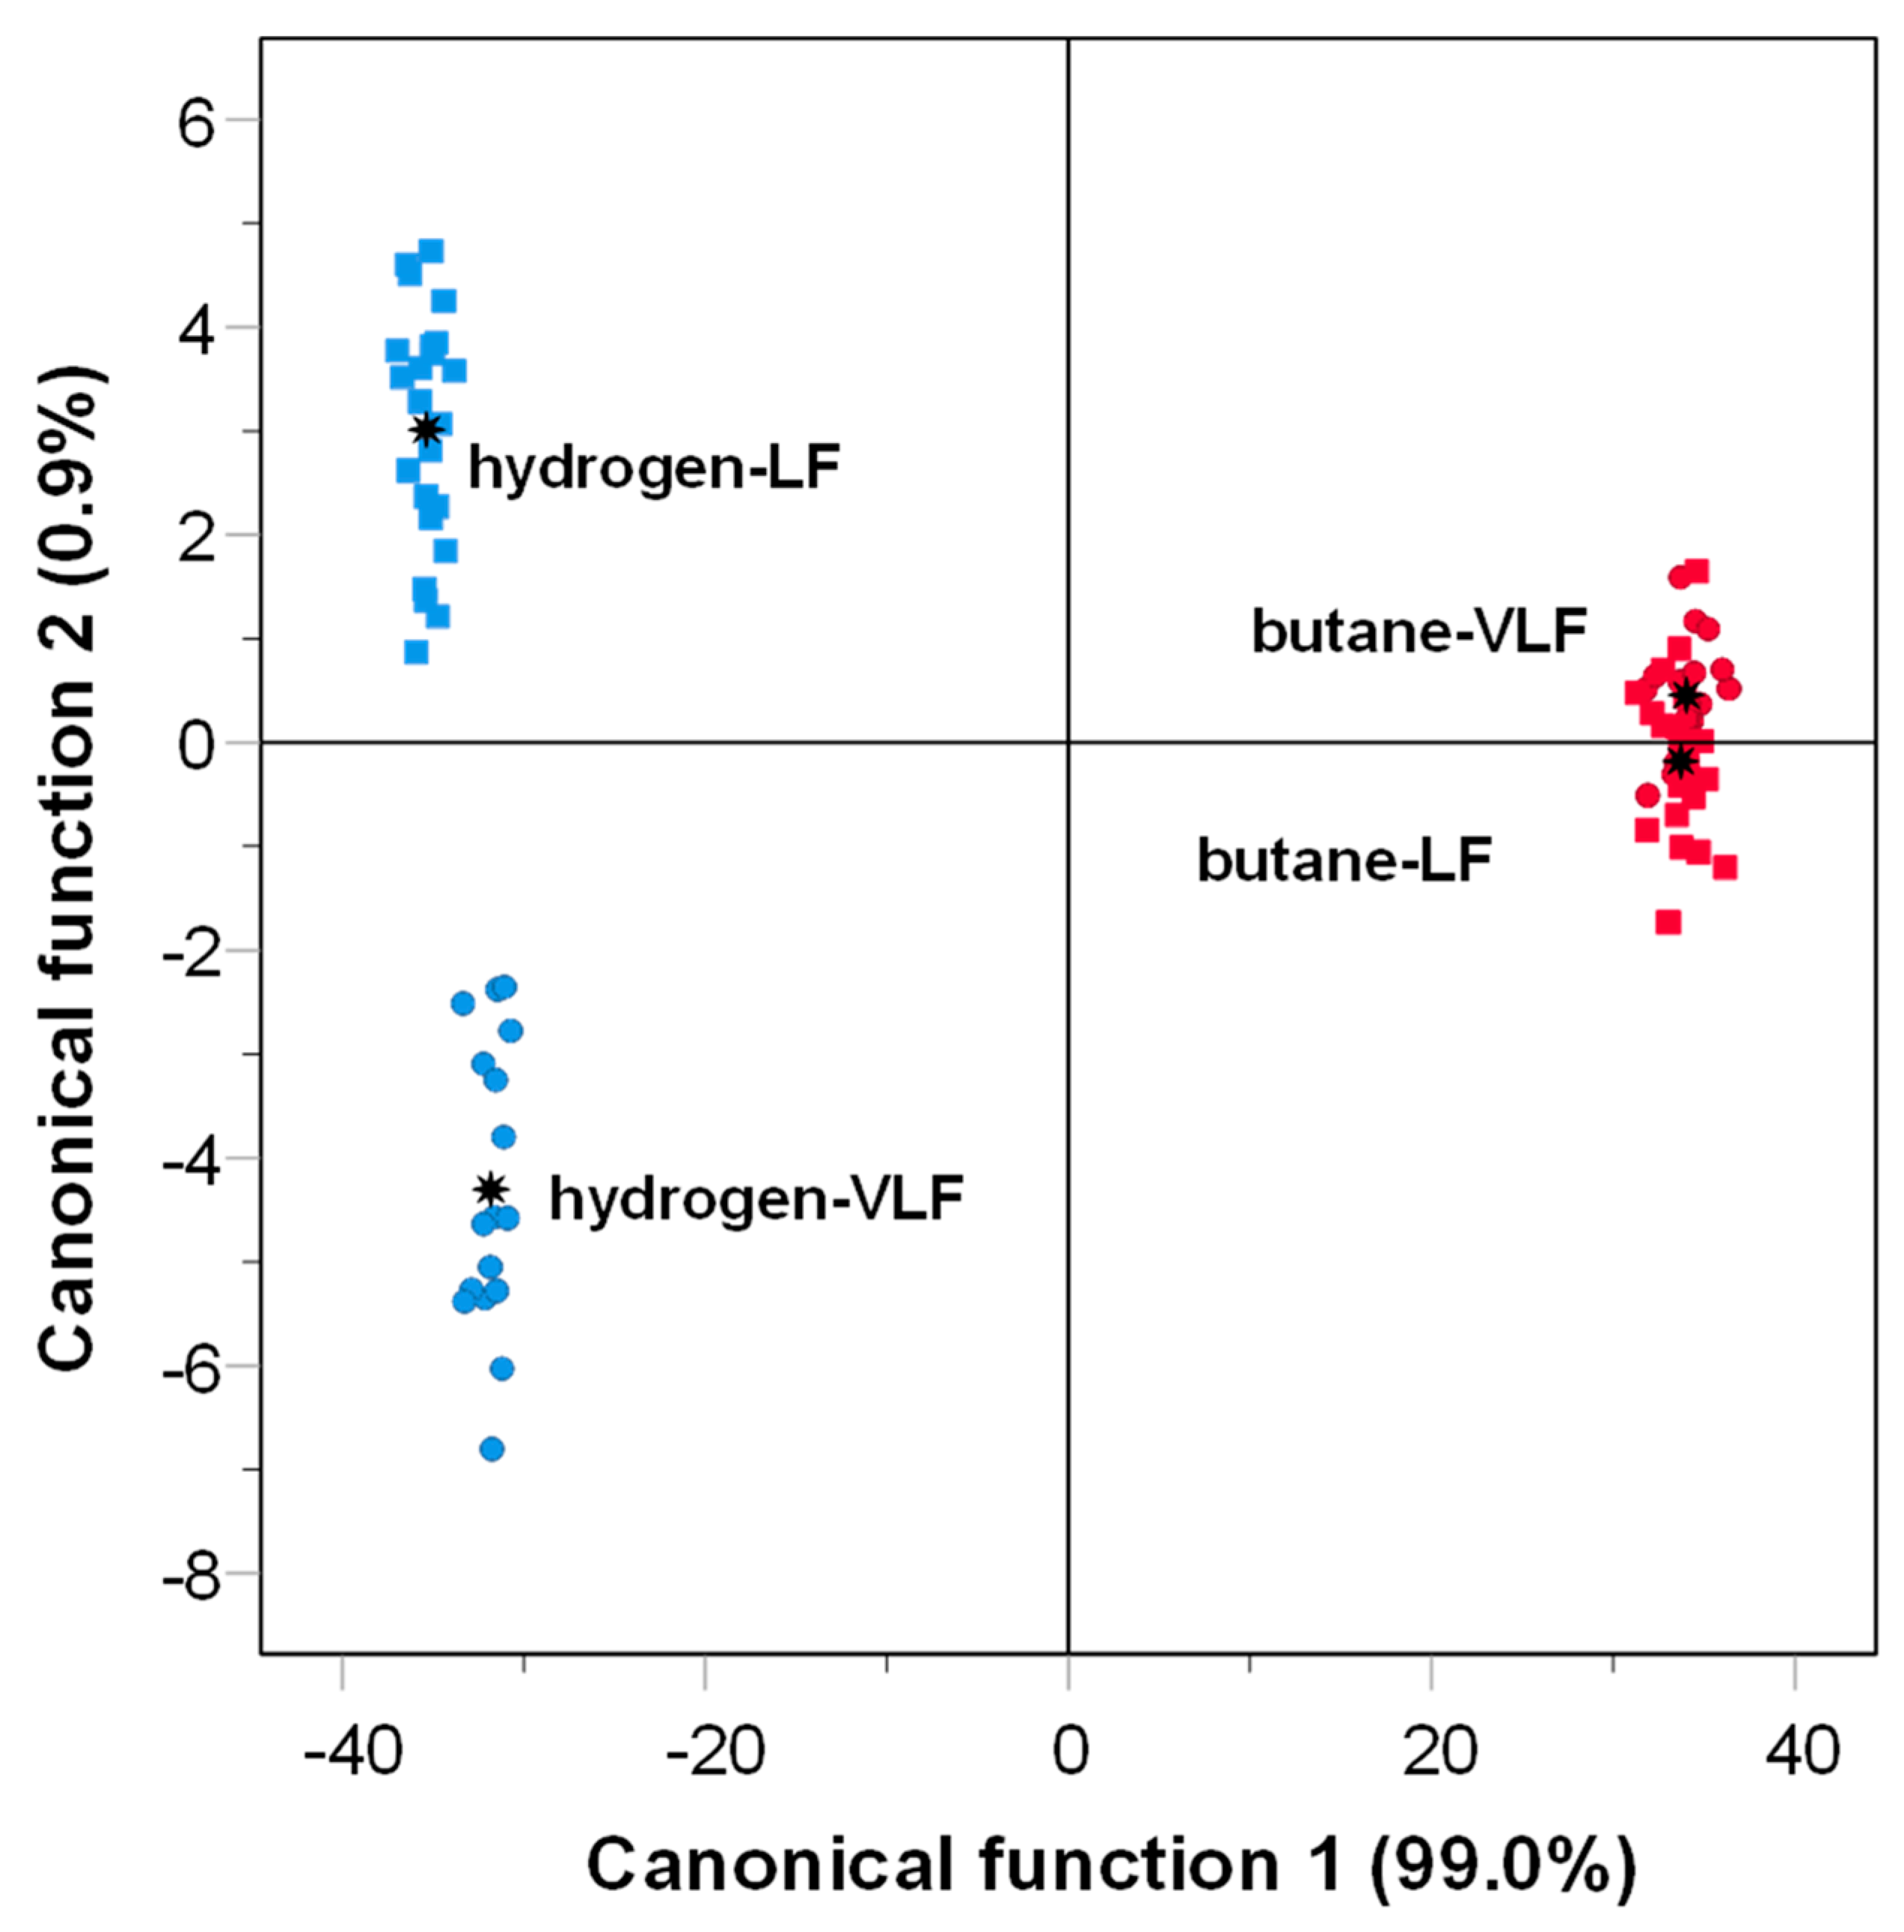 : group centroid.
: group centroid.
: group centroid.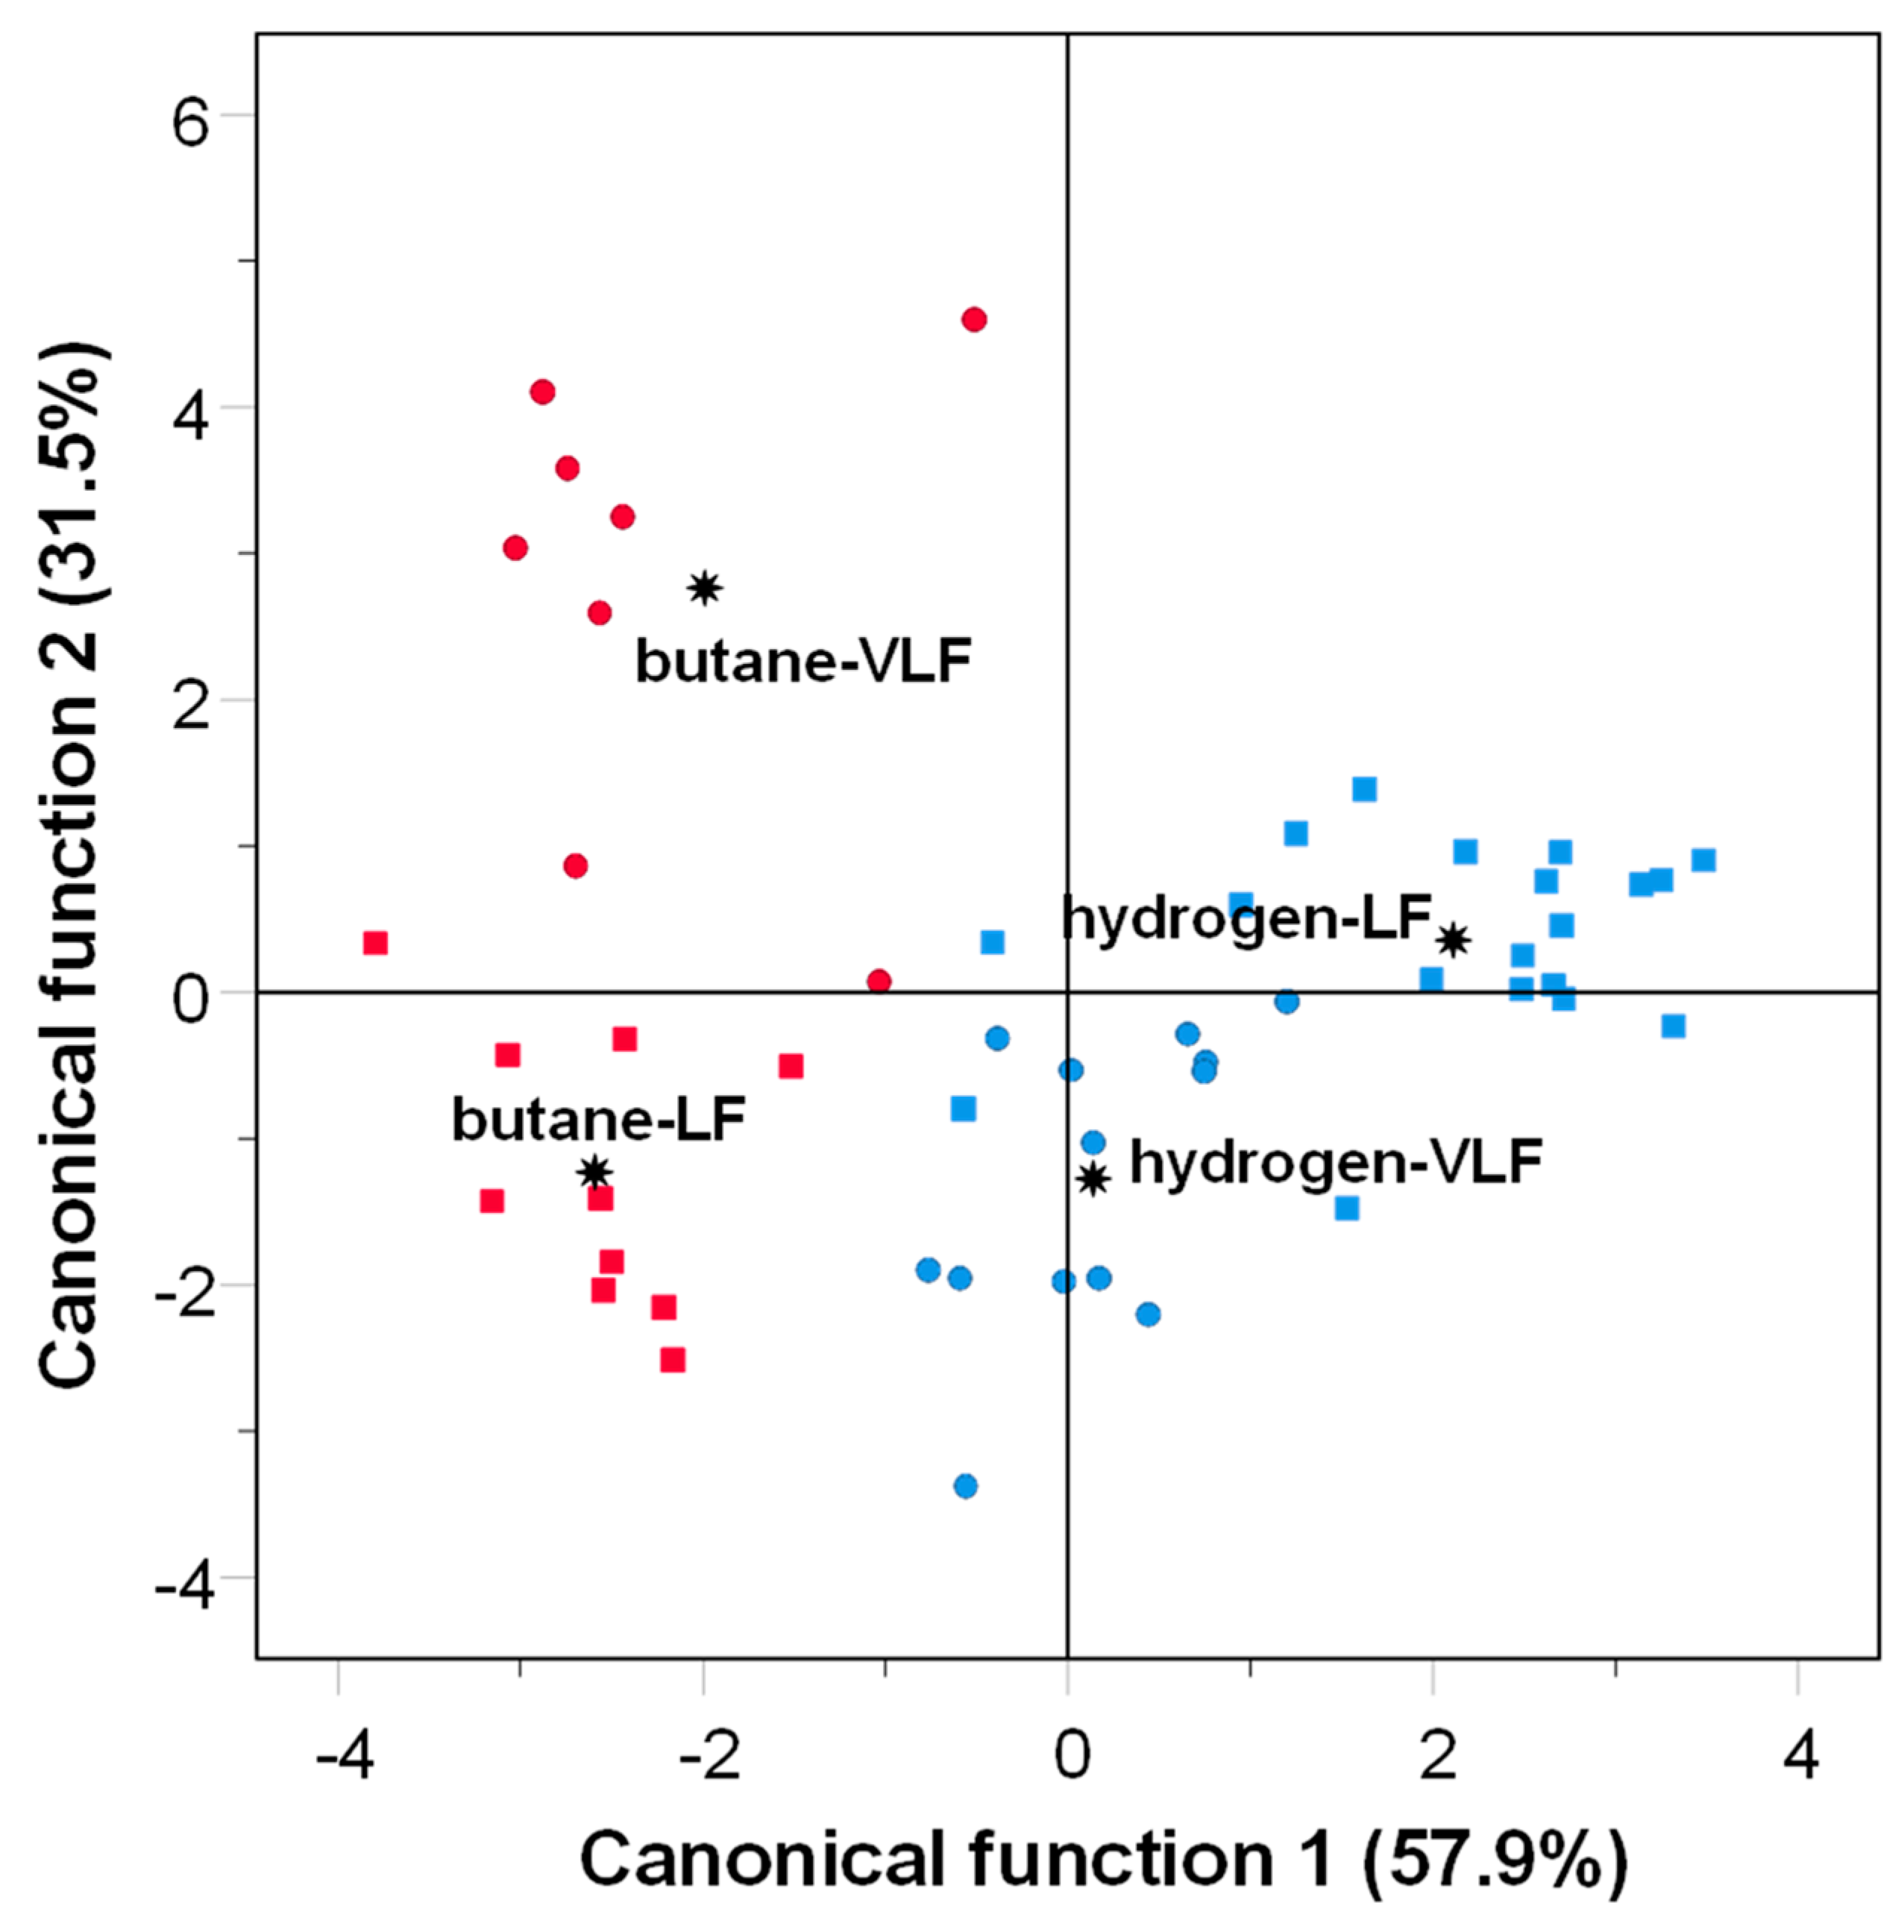

| Very Low-Fat Horse Meat | Low-Fat Horse Meat | |||
|---|---|---|---|---|
| Compounds | Butane Grill | Hydrogen Grill | Butane Grill | Hydrogen Grill |
| LMW PAHs | ||||
| acenaphthylene | 43.45 ± 21.02 b | 1.13 ± 1.06 a | 73.34 ± 32.74 c | 0.98 ± 0.89 a |
| naphthalene | 41.62 ± 12.86 b | 23.43 ± 3.00 a | 68.63 ± 25.36 c | 28.36 ± 10.73 b |
| pyrene | 34.56 ± 19.21 b | 0.55 ± 0.23 a | 51.13 ± 16.74 c | 0.62 ± 0.27 a |
| phenanthrene | 26.72 ± 12.82 b | 2.68 ± 0.53 a | 39.01 ± 12.86 c | 3.24 ± 0.65 a |
| fluoranthene | 17.82 ± 9.87 b | 0.53 ± 0.19 a | 27.00 ± 8.88 c | 0.59 ± 0.21 a |
| fluorene | 7.31 ± 3.39 b | 0.74 ± 0.33 a | 11.15 ± 4.38 c | 1.11 ± 0.33 a |
| acenaphthene | 5.57 ± 2.14 a | 7.22 ± 1.87 b | 5.35 ± 1.37 a | 6.06 ± 1.41 a |
| anthracene | 4.09 ± 1.76 b | 0.18 ± 0.06 a | 5.76 ± 2.46 c | 0.25 ± 0.08 a |
| chrysene | 1.67 ± 0.83 b | 0.17 ± 0.03 a | 2.34 ± 0.79 c | 0.13 ± 0.05 a |
| benzo[a]anthracene | 1.60 ± 0.81 b | 0.27 ± 0.09 a | 2.33 ± 0.75 c | 0.30 ± 0.07 a |
| Total LMW PAHs | 184.41 ± 77.73 b | 36.88 ± 5.56 a | 286.03 ± 95.66 c | 41.63 ± 11.47 a |
| HMW PAHs | ||||
| benzo[ghi]perylene | 9.61 ± 7.09 b | 0.60 ± 0.16 a | 13.97 ± 4.78 c | 0.41 ± 0.22 a |
| indeno[1,2,3-cd]pyrene | 3.38 ± 2.23 b | 0.28 ± 0.04 a | 4.81 ± 1.56 c | 0.24 ± 0.06 a |
| benzo[a]pyrene | 2.90 ± 1.62 b | 0.23 ± 0.12 a | 4.46 ± 1.76 c | 0.11 ± 0.07 a |
| benzo[b]fluoranthene | 1.96 ± 1.73 b | 0.13 ± 0.03 a | 3.13 ± 1.40 c | 0.19 ± 0.07 a |
| benzo[k]fluoranthene | 1.06 ± 0.81 b | 0.38 ± 0.08 a | 1.55 ± 0.67 b | 0.39 ± 0.13 a |
| dibenzo[a,h]anthracene | 0.69 ± 0.03 b | 0.38 ± 0.11 a | 0.73 ± 0.08 b | 0.31 ± 0.29 a |
| Total HMW PAHs | 19.59 ± 13.36 b | 1.83 ± 0.38 a | 28.65 ± 9.70 c | 1.61 ± 0.57 a |
| Very Low-Fat Horse Meat | Low-Fat Horse Meat | |||
|---|---|---|---|---|
| Compounds | Butane Grill | Hydrogen Grill | Butane Grill | Hydrogen Grill |
| Aldehydes | ||||
| hexanal | 20.03 ± 6.49 b | 0.84 ± 0.44 a | 21.42 ± 7.64 b | 0.37 ± 0.23 a |
| propanal | 19.75 ± 5.16 | 13.9 ± 3.73 | 18.69 ± 7.50 | 14.72 ± 9.86 |
| ethanal | 11.74 ± 6.58 ab | 16.16 ± 17.18 b | 8.74 ± 3.49 a | 7.19 ± 2.09 a |
| pentanal | 2.75 ± 1.10 b | 0.08 ± 0.04 a | 3.21 ± 1.48 b | 0.02 ± 0.01 a |
| heptanal | 1.57 ± 0.65 b | 0.00 ± 0.00 a | 1.70 ± 1.06 b | 0.02 ± 0.01 a |
| 2-methylpropanal | 1.14 ± 0.44 | 1.56 ± 0.75 | 1.21 ± 0.43 | 1.18 ± 0.50 |
| octanal | 0.79 ± 0.36 bc | 0.75 ± 0.38 bc | 0.87 ± 0.42 c | 0.36 ± 0.25 a |
| butanal | 0.71 ± 0.24 a | 0.75 ± 0.34 a | 0.87 ± 0.22 a | 1.41 ± 0.41 b |
| 3-methylbutanal | 0.60 ± 0.38 a | 1.35 ± 0.79 b | 0.64 ± 0.29 a | 0.89 ± 0.39 a |
| 2-methyl-butanal | 0.32 ± 0.26 a | 0.83 ± 0.67 b | 0.28 ± 0.17 a | 0.51 ± 0.28 ab |
| 2-pentenal | 0.13 ± 0.11 b | 0.00 ± 0.00 a | 0.19 ± 0.14 b | 0.00± 0.00 a |
| nonanal | 0.11 ± 0.11 b | 0.00 ± 0.00 a | 0.20 ± 0.13 b | 0.00± 0.00 a |
| (E)-2-octenal | 0.07 ± 0.05 | 0.20 ± 0.17 | 0.10 ± 0.08 | 0.58 ± 0.38 |
| benzaldehyde | 0.07 ± 0.05 | 0.27 ± 0.15 | 0.07 ± 0.06 | 0.16 ± 0.07 |
| 2-methyl-2-pentenal | <0.01 a | 0.16 ± 0.13 b | <0.01 a | 0.16 ± 0.13 b |
| Total aldehydes | 59.76 ±7.92 c | 36.84 ± 16.24 b | 58.13 ± 9.04 c | 27.37 ± 9.86 a |
| Alcohols | ||||
| ethanol | 5.16 ± 1.45 b | 1.03 ± 0.85 a | 1.01 ± 0.39 a | 0.63 ± 0.28 a |
| 1-penten-3-ol | 3.64 ± 1.74 b | 0.04 ± 0.01 a | 4.28 ± 1.58 b | 0.00 ± 0.00 a |
| 1-pentanol | 0.86 ± 0.45 a | 2.00 ± 1.63 b | 0.80 ± 0.39 a | 1.46 ± 1.14 ab |
| 2-penten-1-ol | 0.19 ± 0.16 a | 0.33 ± 0.24 a | 0.22 ± 0.13 a | 1.12 ± 1.09 b |
| 1-hexanol | 0.04 ± 0.02 a | 0.20 ± 0.10 c | 0.01 ± 0.03 a | 0.09 ± 0.08 b |
| 1-octen-3-ol | 0.02 ± 0.01 a | 8.54 ± 4.22 c | 0.01 ± 0.01 a | 4.2 0± 2.35 b |
| 1-butanol | <0.01 | 0.63 ± 0.43 | <0.01 | 0.51 ± 0.28 |
| Total alcohols | 9.88 ± 3.37 ab | 12.66 ± 5.57 b | 6.34 ± 1.98 a | 7.69 ± 3.51 a |
| Ketones | ||||
| 2-butanone | 1.11 ± 0.46 | 1.06 ± 0.39 | 0.83 ± 0.33 | 0.87 ± 0.38 |
| 2.3-butanedione | 0.38 ± 0.26 b | 0.13 ± 0.06 a | 0.26 ± 0.13 b | 0.13 ± 0.11 a |
| 2-pentanone | 0.20 ± 0.10 c | 0.07 ± 0.06 ab | 0.15 ± 0.05 bc | 0.11 ± 0.10 b |
| 2-heptanone | 0.14 ± 0.08 b | 0.04 ± 0.01 a | 0.15 ± 0.12 b | 0.03 ± 0.01 a |
| 3-octanone | 0.13 ± 0.09 a | 0.61 ± 0.45 b | 0.15 ± 0.08 a | 1.04 ± 0.90 b |
| 1-penten-3-one | 0.11 ± 0.08 a | 2.52 ± 1.08 b | 0.10 ± 0.08 a | 4.46 ± 1.50 c |
| 2,3-octanediona | 0.06 ± 0.03 | 0.07 ± 0.02 | 0.05 ± 0.03 | 0.10 ± 0.05 |
| 3-heptanone | 0.03 ± 0.03 a | 0.25 ± 0.10 b | 0.03 ± 0.02 a | 0.13 ± 0.06 b |
| 3-hexanone | <0.01 a | 0.05 ± 0.05 a | <0.01 a | 0.18 ± 0.15 b |
| Total ketones | 2.13 ± 0.77 a | 4.80 ± 1.26 b | 1.70 ± 0.47 a | 7.05 ± 2.18 c |
| Aliphatic hydrocarbons | ||||
| pentane | 10.72 ± 7.43 | 11.69 ± 5.12 | 9.40 ± 5.24 | 11.33 ± 6.76 |
| 2.2.4.6.6-pentamethylheptane | 4.73 ± 2.59 b | 0.09 ± 0.01 a | 5.77 ± 2.95 b | 0.05 ± 0.01 a |
| heptane | 2.13 ± 1.30 a | 2.49 ± 1.22 a | 2.66 ± 1.23 a | 4.86 ± 1.94 b |
| hexane | 0.83 ± 0.43 a | 1.02 ± 0.38 a | 1.08 ± 0.37 ab | 1.48 ± 0.73 b |
| 2-pentene | 0.72 ± 0.68 | 0.53 ± 0.48 | 0.68 ± 0.63 | 0.51 ± 0.42 |
| 3-methylene heptane | 0.52 ± 0.33 b | 0.04 ± 0.03 a | 0.61 ± 0.37 b | 0.04 ± 0.01 a |
| tetramethyl octane | 0.34 ± 0.22 b | 0.06 ± 0.05 a | 0.41 ± 0.19 b | 0.05 ± 0.02 a |
| 2.4-octadiene | 0.17 ± 0.08 c | 0.02 ± 0.01 a | 0.10 ± 0.06 b | 0.02 ± 0.01 a |
| 1,3-trans-5-cis-octatriene | 0.16 ± 0.10 b | 0.04 ± 0.04 a | 0.22 ± 0.13 b | 0.04 ± 0.02 a |
| 2,6,7-trimethyldecane | 0.14 ± 0.11 b | 0.04 ± 0.02 a | 0.16 ± 0.11 b | 0.02 ± 0.02 a |
| 1,3-cyclopentadiene | 0.13 ± 0.10 b | 0.10 ± 0.05 ab | 0.14 ± 0.11 b | 0.04 ± 0.01 a |
| 3-ethyl-1.5-octadiene | 0.12 ± 0.09 b | 0.03 ± 0.02 a | 0.17 ± 0.08 bc | 0.12 ± 0.10 b |
| 3-ethyl heptane | 0.07 ± 0.06 a | 0.29 ± 0.19 b | 0.14 ± 0.09 ab | 0.09 ± 0.05 a |
| decane | 0.07 ± 0.05 | 0.26 ± 0.21 | 0.11 ± 0.09 | 0.13 ± 0.09 |
| butyl-cyclopentane | 0.06 ± 0.03 a | 0.24 ± 0.16 b | 0.07 ± 0.06 a | 0.15 ± 0.11 ab |
| (Z)-2-octene | 0.04 ± 0.01 a | 13.77 ± 5.80 b | 0.06 ± 0.03 a | 28.71 ± 9.74 b |
| 1-heptene | <0.01 a | 0.15 ± 0.02 b | 0.01 ± 0.00 a | 0.13 ± 0.01 b |
| Total aliphatic hydrocarbons | 20.81 ±9.66 a | 30.78 ±10.71 b | 27.77 ±8.14 a | 47.75 ±9.74 c |
| Aromatic hydrocarbons | ||||
| benzene | 1.44 ± 1.05 b | 0.09 ± 0.02 a | 2.08 ± 1.33 b | 0.09 ± 0.06 a |
| toluene | 1.35 ± 0.95 b | 0.29 ± 0.19 a | 1.29 ± 0.74 b | 0.04 ± 0.03 a |
| ethenylbenzene | 0.13 ± 0.11 a | 1.66 ± 0.76 b | 0.19 ± 0.09 a | 2.96 ± 1.74 c |
| ethylbenzene | 0.04 ± 0.03 ab | 0.06 ± 0.02 b | 0.06 ± 0.03 b | 0.03 ± 0.02 a |
| Total aromatic hydrocarbons | 2.96 ±1.93 ab | 2.01 ± 0.65 a | 3.63 ± 1.89 b | 3.13 ± 1.73 b |
| Sulfur-containing compounds | ||||
| metanethiol | 0.36 ± 0.18 | 0.27 ± 0.24 | 0.23 ± 0.12 | 0.16 ± 0.12 |
| thiobis-methane | 0.38 ± 0.28 | 0.31 ± 0.25 | 0.25 ± 0.18 | 0.25 ± 0.17 |
| Total sulfur compounds | 0.76 ± 0.33 | 0.55 ± 0.31 | 0.48 ± 0.26 | 0.41 ± 0.21 |
| Others | ||||
| ethoxyethane | 1.60 ± 1.46 ab | 1.92 ± 1.15 ab | 5.52 ± 4.75 b | 1.09 ± 0.77 a |
| 4-bromoheptane | 0.39 ± 0.17 | 0.00 ± 0.00 | 0.26 ± 0.19 | 0.00 ± 0.00 |
| 2-ethylfurane | 0.22 ± 0.10 a | 2.73 ± 1.39 b | 0.29 ± 0.24 a | 3.46 ± 1.42 b |
| trichloromethane | 0.18 ± 0.10 a | 0.22 ± 0.15 a | 0.49 ± 0.35 b | 0.27 ± 0.18 a |
| hexyl formate | <0.01 a | 0.13 ± 0.10 b | <0.01 a | 0.14 ± 0.10 b |
| Total VOCs | 98.48 ± 1.09 | 92.64 ± 14.90 | 97.53 ± 4.14 | 98.37 ± 3.15 |
Disclaimer/Publisher’s Note: The statements, opinions and data contained in all publications are solely those of the individual author(s) and contributor(s) and not of MDPI and/or the editor(s). MDPI and/or the editor(s) disclaim responsibility for any injury to people or property resulting from any ideas, methods, instructions or products referred to in the content. |
© 2024 by the authors. Licensee MDPI, Basel, Switzerland. This article is an open access article distributed under the terms and conditions of the Creative Commons Attribution (CC BY) license (https://creativecommons.org/licenses/by/4.0/).
Share and Cite
Beriain, M.J.; Gómez, I.; García, S.; Urroz, J.C.; Diéguez, P.M.; Ibañez, F.C. Hydrogen Gas-Grilling in Meat: Impact on Odor Profile and Contents of Polycyclic Aromatic Hydrocarbons and Volatile Organic Compounds. Foods 2024, 13, 2443. https://doi.org/10.3390/foods13152443
Beriain MJ, Gómez I, García S, Urroz JC, Diéguez PM, Ibañez FC. Hydrogen Gas-Grilling in Meat: Impact on Odor Profile and Contents of Polycyclic Aromatic Hydrocarbons and Volatile Organic Compounds. Foods. 2024; 13(15):2443. https://doi.org/10.3390/foods13152443
Chicago/Turabian StyleBeriain, María José, Inmaculada Gómez, Susana García, José Carlos Urroz, Pedro María Diéguez, and Francisco C. Ibañez. 2024. "Hydrogen Gas-Grilling in Meat: Impact on Odor Profile and Contents of Polycyclic Aromatic Hydrocarbons and Volatile Organic Compounds" Foods 13, no. 15: 2443. https://doi.org/10.3390/foods13152443
APA StyleBeriain, M. J., Gómez, I., García, S., Urroz, J. C., Diéguez, P. M., & Ibañez, F. C. (2024). Hydrogen Gas-Grilling in Meat: Impact on Odor Profile and Contents of Polycyclic Aromatic Hydrocarbons and Volatile Organic Compounds. Foods, 13(15), 2443. https://doi.org/10.3390/foods13152443