
Impact of Sprouted Chickpea Grits and Flour on Dough Rheology and Bread Features

Abstract
:1. Introduction
2. Materials and Methods
2.1. Materials
2.2. Methods
2.2.1. Functional Properties of Chickpea Flour and Grits
2.2.2. Pasting Properties of Chickpea Flour, Grits, and Wheat–Chickpea Blends
2.2.3. Mixing Properties of Chickpea Flour and Grits, and What-Chickpea Blends
2.2.4. Gluten Aggregation Properties of Wheat–Chickpea Blends
2.2.5. Extensional Properties of Wheat–Chickpea Blends
2.2.6. Leavening Properties of Wheat–Chickpea Blends
2.2.7. Bread-Making
2.2.8. Bread Characterisation
2.2.9. Statistical Analysis
3. Results and Discussion
3.1. Chickpea Flour and Grits Characterisation
3.1.1. Functional Properties of Chickpea Flour and Grits
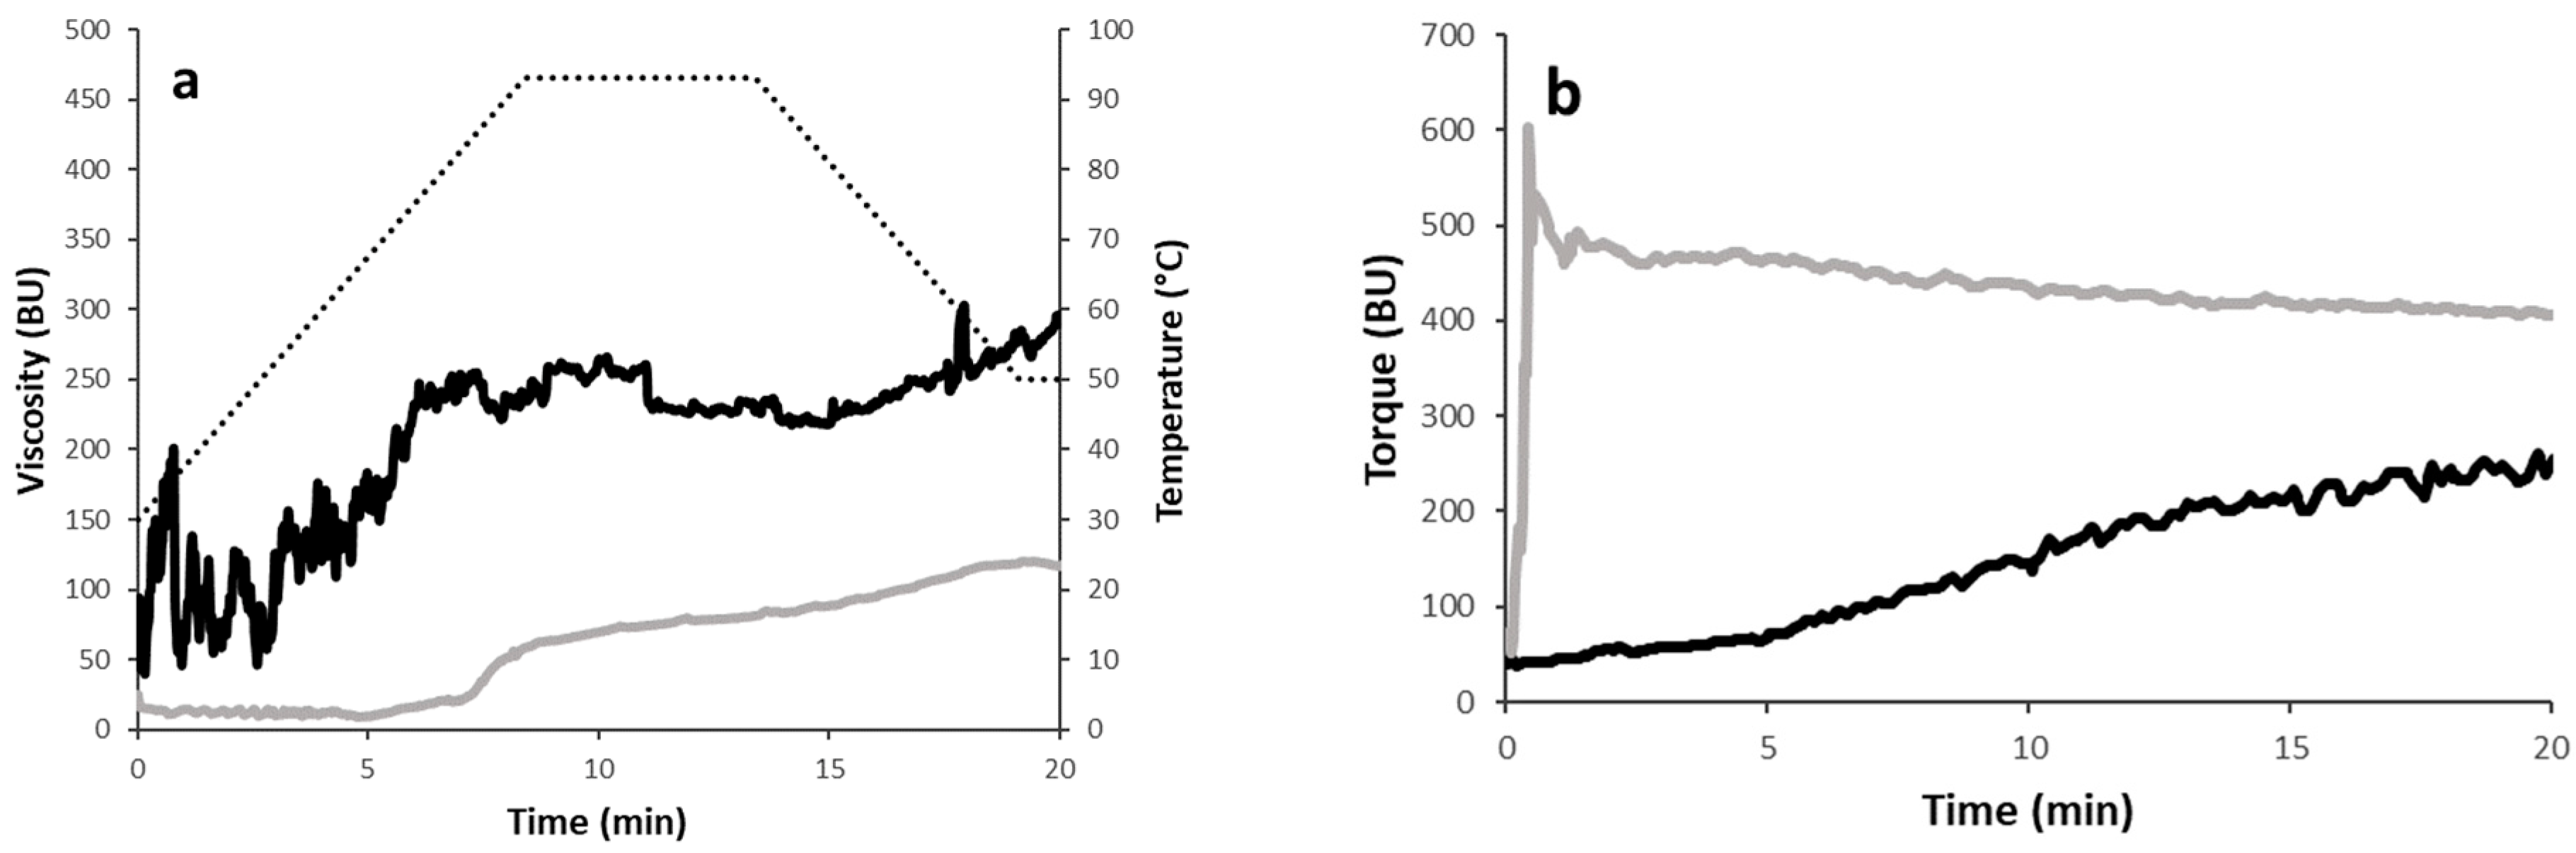
3.1.2. Pasting Properties of Chickpea Flour and Grits
3.1.3. Mixing Properties of Chickpea Flour and Grits
3.2. Dough Rheology
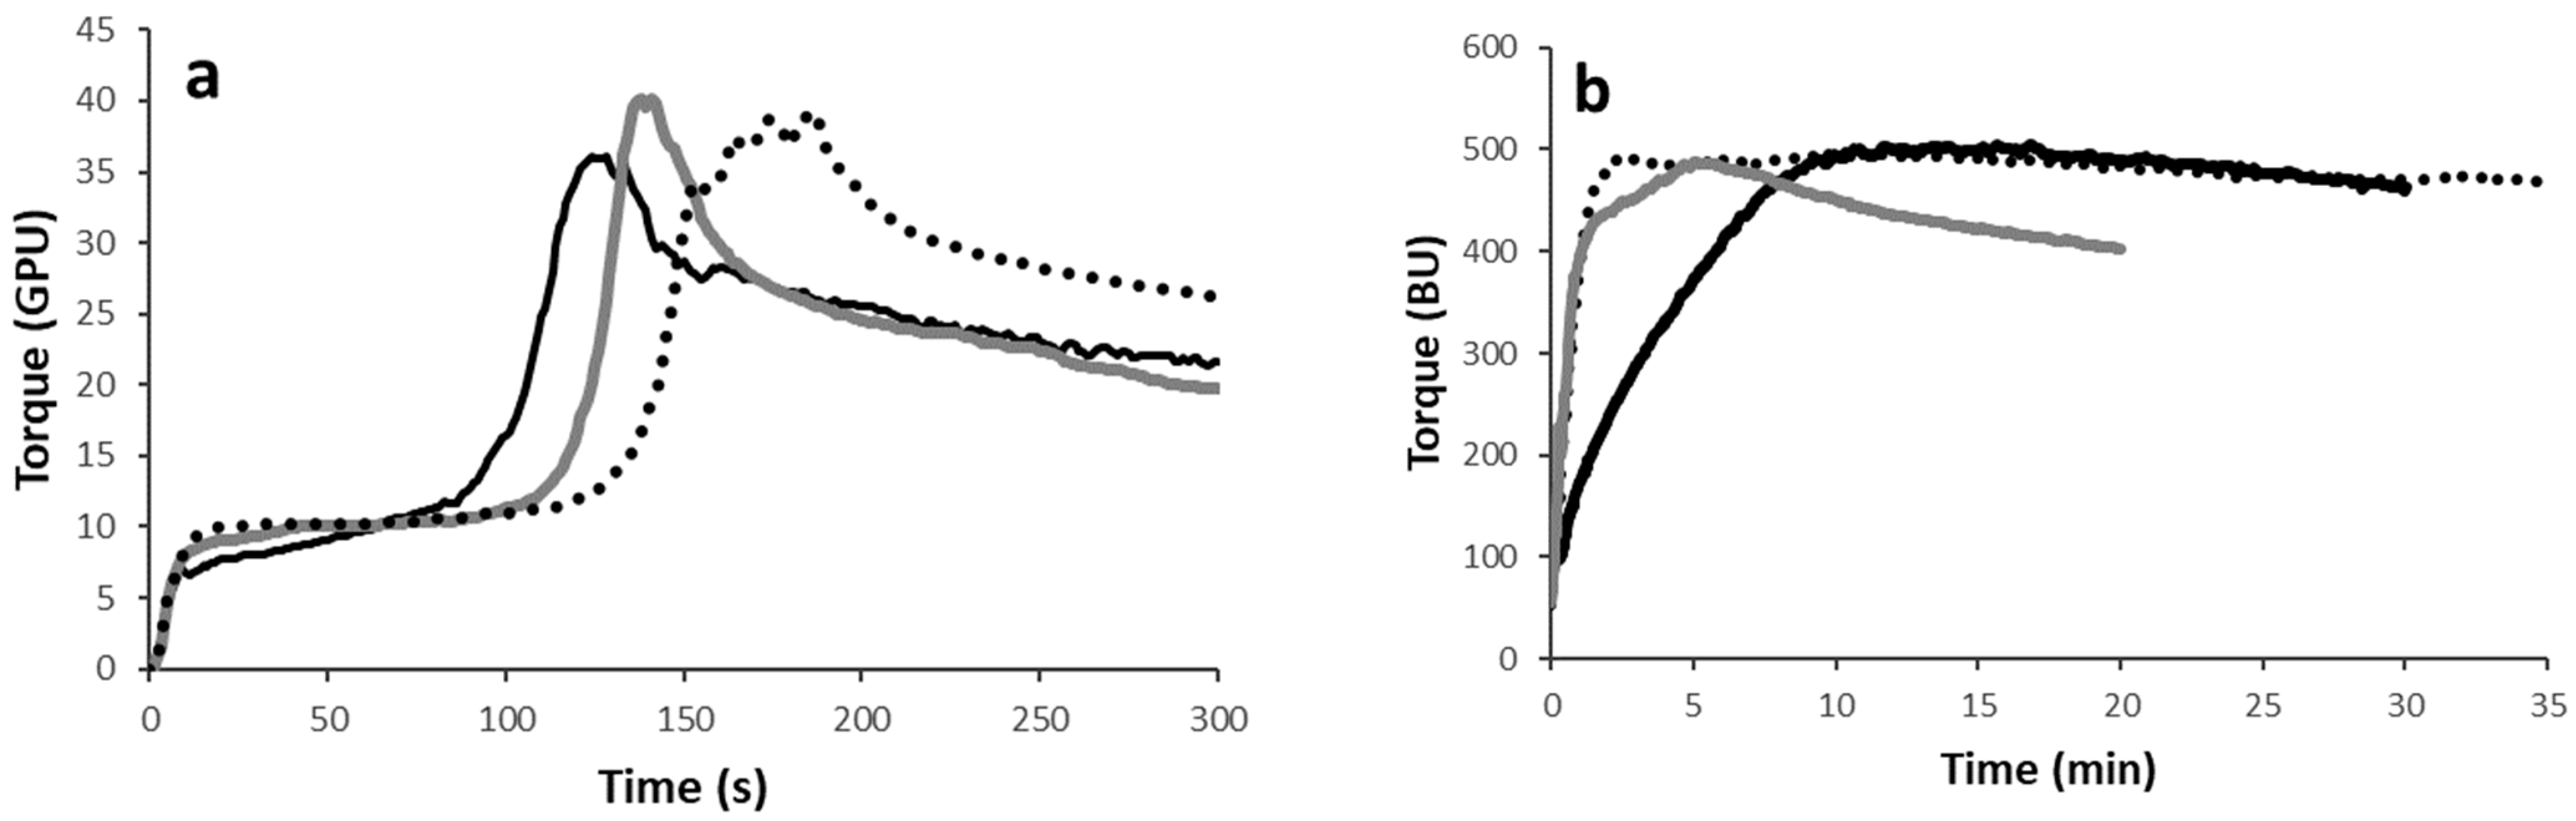
3.2.1. Gluten Aggregation Properties of Wheat–Chickpea Blends
3.2.2. Mixing Properties of Wheat–Chickpea Blends
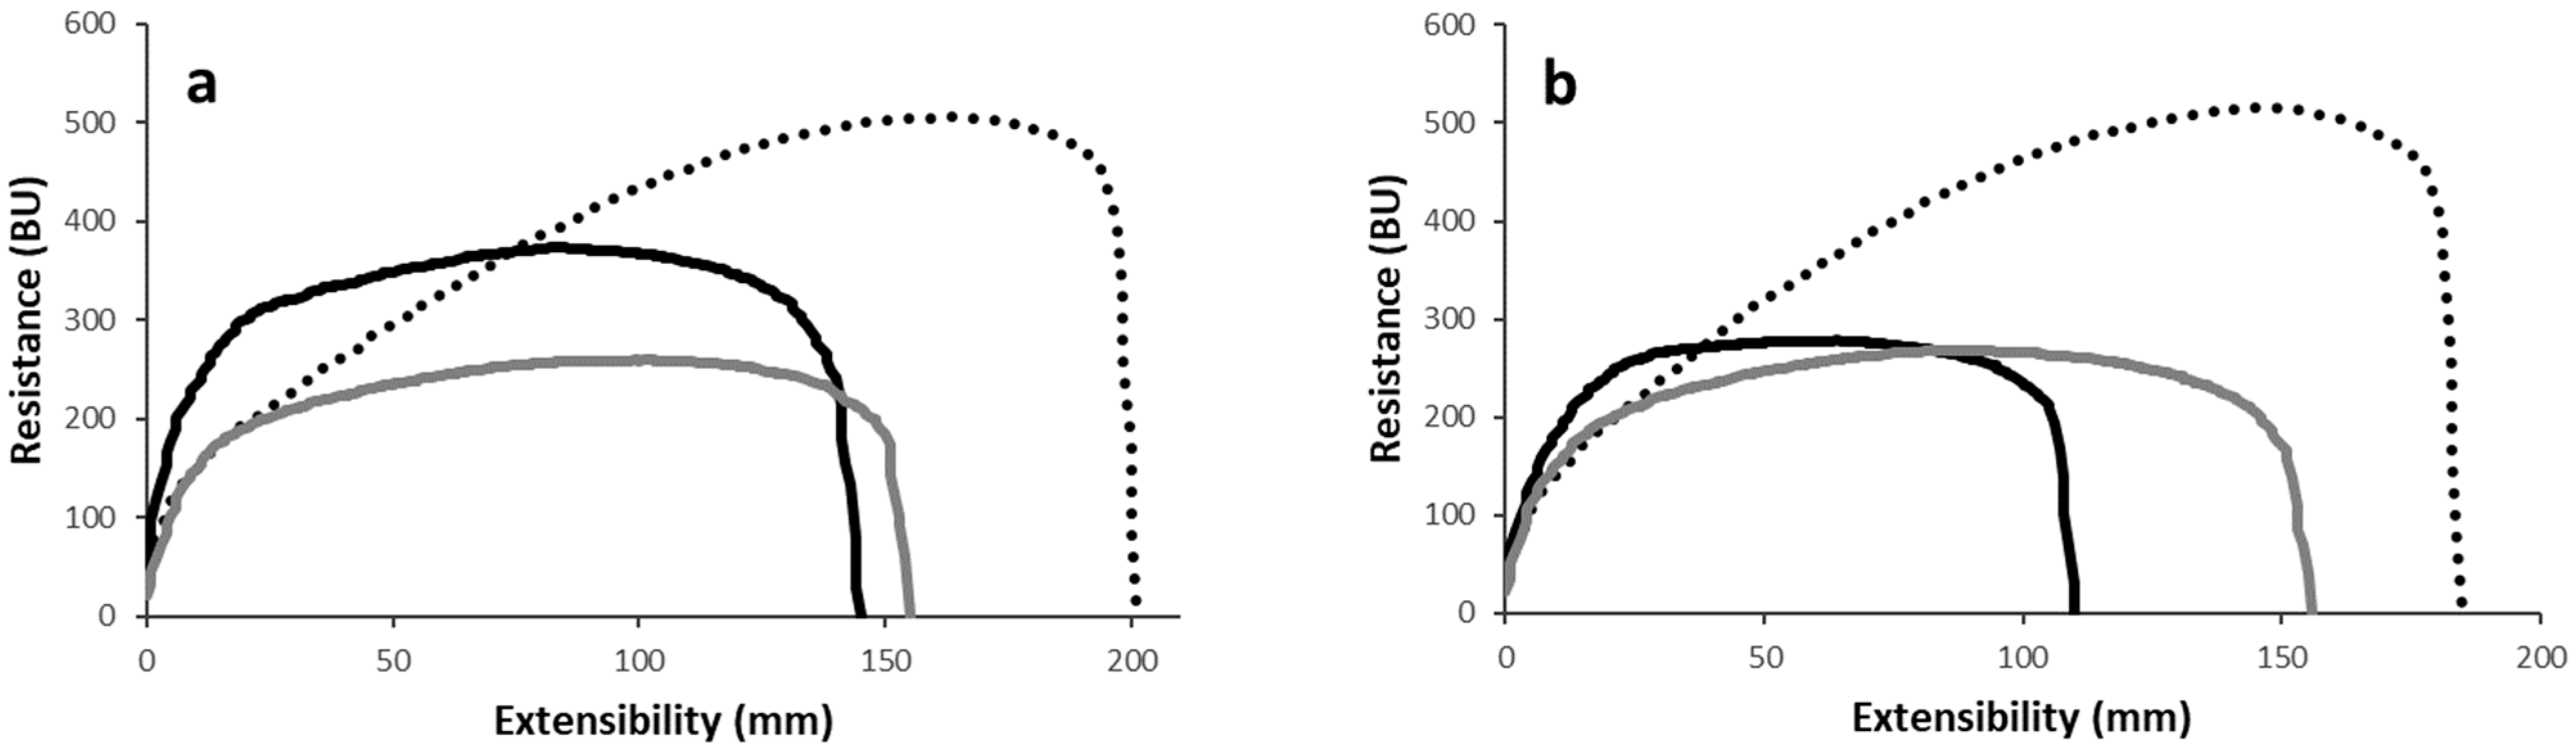
3.2.3. Extensional Properties of Wheat–Chickpea Blends
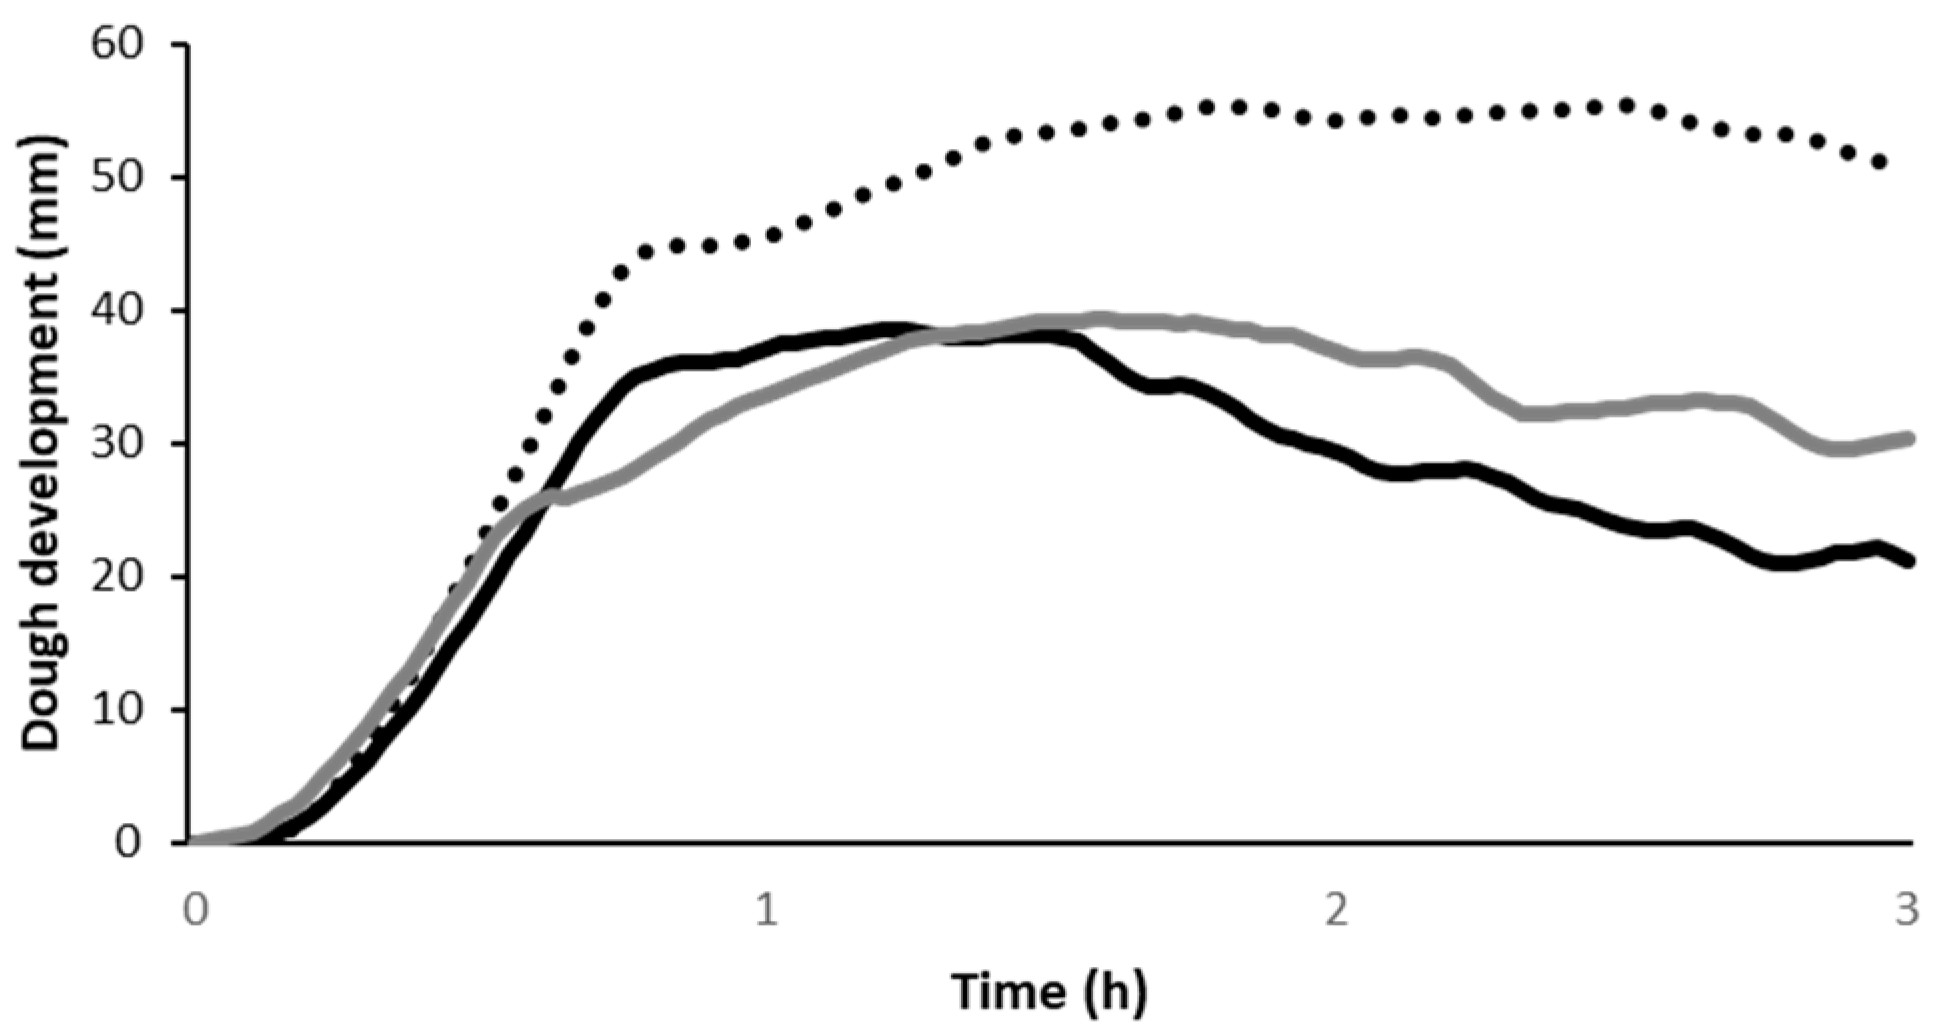
3.2.4. Leavening Properties of Wheat–Chickpea Blends
3.2.5. Pasting Properties of Wheat–Chickpea Blends
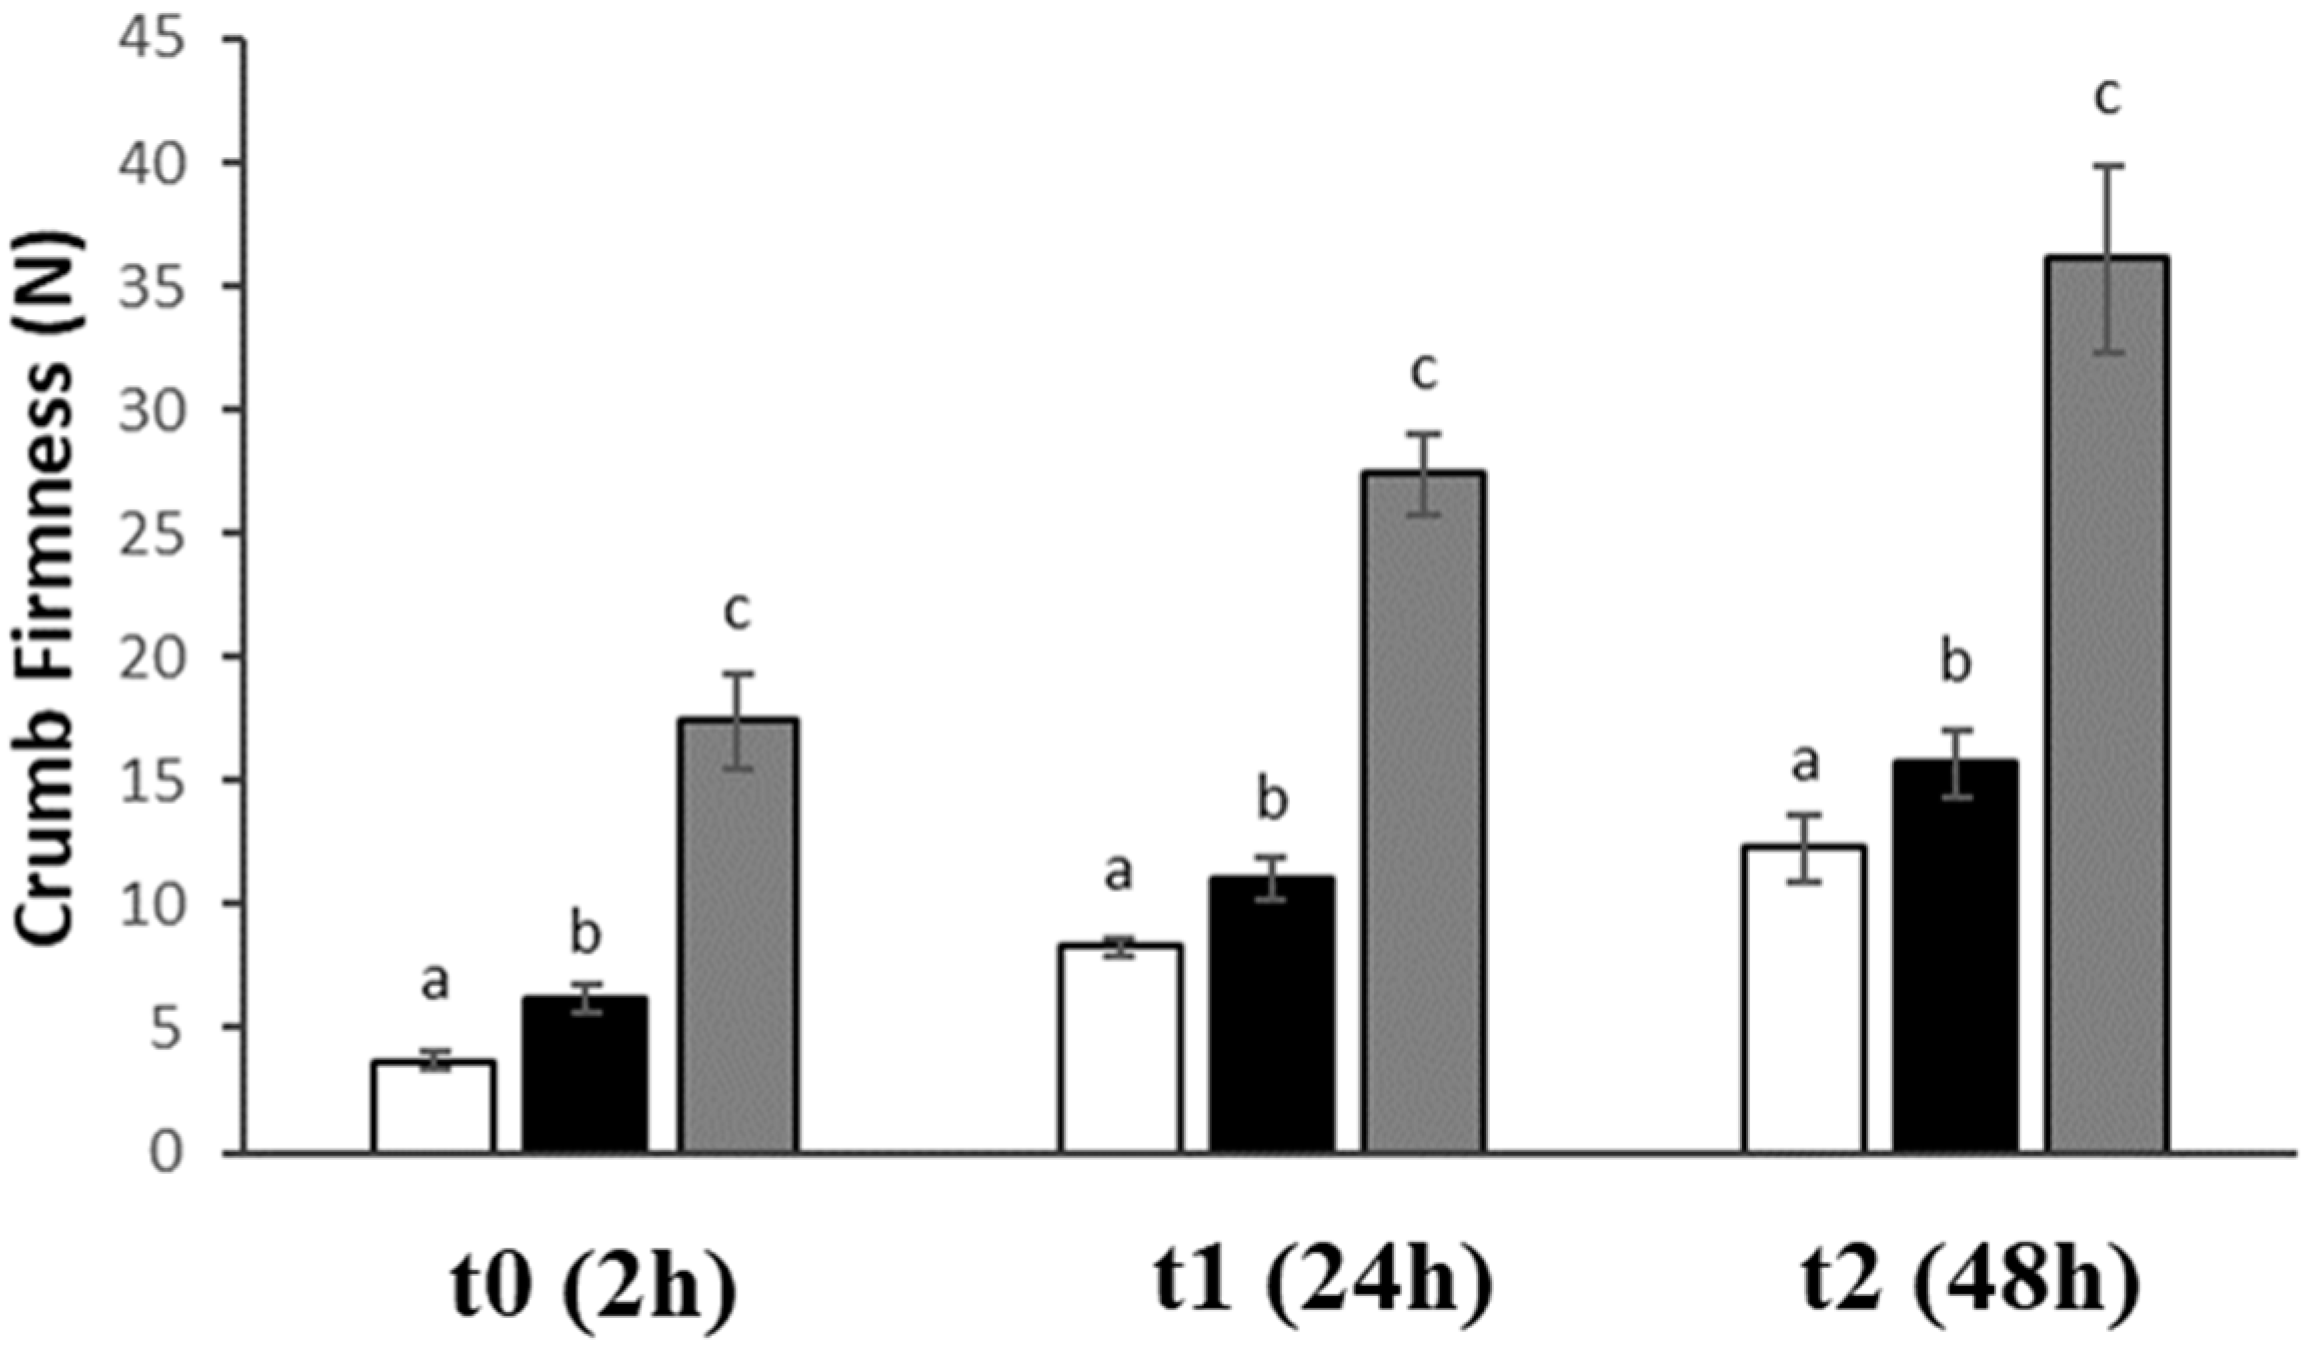
3.2.6. Bread Characterisation
4. Conclusions
Supplementary Materials
Author Contributions
Funding
Institutional Review Board Statement
Informed Consent Statement
Data Availability Statement
Acknowledgments
Conflicts of Interest
References
- Bar-El Dadon, S.; Abbo, S.; Reifen, R. Leveraging traditional crops for better nutrition and health-The case of chickpea. Trends Food Sci. Technol. 2017, 64, 39–47. [Google Scholar] [CrossRef]
- Rehm, C.D.; Goltz, S.R.; Katcher, J.A.; Guarneiri, L.L.; Dicklin, M.R.; Maki, K.C. Trends and Patterns of Chickpea Consumption among United States Adults: Analyses of National Health and Nutrition Examination Survey Data. J. Nutr. 2023, 153, 1567–1576. [Google Scholar] [CrossRef]
- Khalil, A.W.; Zeb, A.; Mahmood, F.; Tariq, S.; Khattak, A.B.; Shah, H. Comparison of sprout quality characteristics of desi and kabuli type chickpea cultivars (Cicer arietinum L.). LWT Food Sci. Technol. 2007, 40, 937–945. [Google Scholar] [CrossRef]
- Avezum, L.; Rondet, E.; Mestres, C.; Achir, N.; Madode, Y.; Gibert, O.; Lefevre, C.; Hemery, Y.; Verdeil, J.L.; Rajjou, L. Improving the nutritional quality of pulses via germination. Food Rev. Int. 2023, 39, 6011–6044. [Google Scholar] [CrossRef]
- Atudorei, D.; Codină, G.G. Perspectives on the use of germinated legumes in the bread making process, a review. Appl. Sci. 2020, 10, 6244. [Google Scholar] [CrossRef]
- Marengo, M.; Carpen, A.; Bonomi, F.; Casiraghi, M.C.; Meroni, E.; Quaglia, L.; Iametti, S.; Pagani, M.A.; Marti, A. Macromolecular and micronutrient profiles of sprouted chickpeas to be used for integrating cereal-based food. Cereal Chem. 2017, 94, 82–88. [Google Scholar] [CrossRef]
- Ouazib, M.; Garzon, R.; Zaidi, F.; Rosell, C.M. Germinated, toasted and cooked chickpea as ingredients for breadmaking. J. Food Sci. Technol. 2016, 53, 2664–2672. [Google Scholar] [CrossRef] [PubMed]
- Sofi, S.A.; Singh, J.; Muzaffar, K.; Majid, D.; Dar, B.N. Physicochemical characteristics of protein isolates from native and germinated chickpea cultivars and their noodle quality. Gastron. Food Sci. 2020, 22, 100258. [Google Scholar] [CrossRef]
- Guardado-Félix, D.; Lazo-Vélez, M.A.; Pérez-Carrillo, E.; Panata-Saquicili, D.E.; Serna-Saldívar, S.O. Effect of partial replacement of wheat flour with sprouted chickpea flours with or without selenium on physicochemical, sensory, antioxidant and protein quality of yeast-leavened breads. Food Sci. Technol. 2020, 129, 109517. [Google Scholar] [CrossRef]
- Bressiani, J.; Oro, T.; Santetti, G.S.; Almeida, J.L.; Bertolin, T.E.; Gómez, M.; Gutkoski, L.C. Properties of whole grain wheat flour and performance in bakery products as a function of particle size. J. Cereal Sci. 2017, 75, 269–277. [Google Scholar] [CrossRef]
- Bresciani, A.; Cardone, G.; Jucker, C.; Savoldelli, S.; Marti, A. Technological performance of cricket powder (Acheta domesticus L.) in wheat-based formulations. Insects 2022, 13, 546. [Google Scholar] [CrossRef] [PubMed]
- Yasumatsu, K.; Sawada, K.; Moritaka, S.; Misaki, M.; Toda, J.; Wada, T.; Ishii, K. Whipping and emulsifying properties of soybean products. Agric. Biol. Chem. 1972, 36, 719–727. [Google Scholar] [CrossRef]
- Bresciani, A.; Annor, G.A.; Gardella, M.; Marti, A. Use of the farinograph for gluten-free grains. In The Farinograph Handbook; Bock, J.E., Don, C., Eds.; Woodhead Publishing: Sawston, UK, 2022; pp. 111–126. [Google Scholar] [CrossRef]
- Standard No.115/1; Method for Using the Brabender Farinograph. ICC: Vienna, Austria, 1992.
- Chandi, G.K.; Seetharaman, K. Optimization of gluten peak tester: A statistical approach. J. Food Qual. 2012, 35, 69–75. [Google Scholar] [CrossRef]
- American Association of Cereal Chemists (AACC). AACC International Approved Methods of Analysis, 11th ed.; Cereals & Grains Association: St. Paul, MN, USA, 2009. [Google Scholar]
- Deep Singh, G.; Wani, A.A.; Kaur, D.; Sogi, D.S. Characterisation and functional properties of proteins of some Indian chickpea (Cicer arietinum) cultivars. J. Sci. Food Agric. 2008, 88, 778–786. [Google Scholar] [CrossRef]
- Kaur, M.; Singh, N. Studies on functional, thermal and pasting properties of flours from different chickpea (Cicer arietinum L.) cultivars. Food Chem. 2005, 91, 403–411. [Google Scholar] [CrossRef]
- Safo-Kantanka, K.O.; Acquistucci, R. The Physcio-chemical properties of Cassava starch in relation to the texture of the cooked root. Ghana J. Agric. Sci. 1996, 28–29, 69–80. [Google Scholar] [CrossRef]
- Summo, C.; De Angelis, D.; Ricciardi, L.; Caponio, F.; Lotti, C.; Pavan, S.; Pasqualone, A. Nutritional, physico-chemical and functional characterization of a global chickpea collection. J. Food Compos. Anal. 2019, 84, 103306. [Google Scholar] [CrossRef]
- Kaur, M.; Singh, N. Relationships between selected properties of seeds, flours, and starches from different chickpea cultivars. Int. J. Food Prop. 2006, 9, 597–608. [Google Scholar] [CrossRef]
- Hossen, M.S.; Sotome, I.; Takenaka, M.; Isobe, S.; Nakajima, M.; Okadome, H. Effect of particle size of different crop starches and their flours on pasting properties. Jpn. J. Food Eng. 2011, 12, 29–35. [Google Scholar] [CrossRef]
- Ahmed, J.; Taher, A.; Mulla, M.Z.; Al-Hazza, A.; Luciano, G. Effect of sieve particle size on functional, thermal, rheological and pasting properties of Indian and Turkish lentil flour. J. Food Eng. 2016, 186, 34–41. [Google Scholar] [CrossRef]
- Bresciani, A.; Giuberti, G.; Cervini, M.; Marti, A. Using pre-gelatinised red lentils in pasta production: Connecting starch features and pasta cooking behaviour. Int. J. Food Sci. Technol. 2023, 58, 1803–1809. [Google Scholar] [CrossRef]
- Cappa, C.; Lucisano, M.; Mariotti, M. Influence of Psyllium, sugar beet fibre and water on gluten-free dough properties and bread quality. Carbohydr. Polym. 2013, 98, 1657–1666. [Google Scholar] [CrossRef] [PubMed]
- Mohammed, I.; Ahmed, A.R.; Senge, B. Effects of chickpea flour on wheat pasting properties and bread making quality. J. Food Sci. Technol. 2014, 51, 1902–1910. [Google Scholar] [CrossRef] [PubMed]
- Mohammed, I.; Ahmed, A.R.; Senge, B. Dough rheology and bread quality of wheat–chickpea flour blends. Ind. Crops Prod. 2012, 36, 196–202. [Google Scholar] [CrossRef]
- Sabanis, D.; Makri, E.; Doxastakis, G. Effect of durum flour enrichment with chickpea flour on the characteristics of dough and lasagne. J. Sci. Food Agric. 2006, 86, 1938–1944. [Google Scholar] [CrossRef]
- Zafar, T.A.; Allafi, A.R.; Alkandari, D.; Al-Othman, A. Rheological characteristics of wheat–chickpea composite flour doughs and effect of Amla powder (Phyllanthus emblica L.) addition on the functional properties of bread. Food Sci. Technol. Int. 2021, 27, 264–275. [Google Scholar] [CrossRef]
- Kotsiou, K.; Sacharidis, D.D.; Matsakidou, A.; Biliaderis, C.G.; Lazaridou, A. Physicochemical and functional aspects of composite wheat-roasted chickpea flours in relation to dough rheology, bread quality and staling phenomena. Food Hydrocoll. 2022, 124, 107322. [Google Scholar] [CrossRef]
- Atudorei, D.; Atudorei, O.; Codină, G.G. The impact of germinated chickpea flour addition on dough rheology and bread quality. Plants 2022, 11, 1225. [Google Scholar] [CrossRef]
- Kaur, R.; Prasad, K. Technological, processing and nutritional aspects of chickpea (Cicer arietinum)—A review. Trends Food Sci. Technol. 2021, 109, 448–463. [Google Scholar] [CrossRef]
- Lemmens, E.; Moroni, A.V.; Pagand, J.; Heirbaut, P.; Ritala, A.; Karlen, Y.; Lê, K.A.; Van den Broeck, H.C.; Brouns, F.J.; De Brier, N.; et al. Impact of cereal seed sprouting on its nutritional and technological properties: A critical review. Compr. Rev. Food Sci. Food Saf. 2019, 18, 305–328. [Google Scholar] [CrossRef]
- Rachwa-Rosiak, D.; Nebesny, E.; Budryn, G. Chickpeas—Composition, nutritional value, health benefits, application to bread and snacks: A review. Crit. Rev. Food Sci. Nutr. 2015, 55, 1137–1145. [Google Scholar] [CrossRef] [PubMed]
- Yıltırak, S.; Kocadağlı, T.; Çelik, E.E.; Kanmaz, E.Ö.; Gökmen, V. Effects of sprouting and fermentation on the formation of Maillard reaction products in different cereals heated as wholemeal. Food Chem. 2022, 389, 133075. [Google Scholar] [CrossRef]
- Yamsaengsung, R.; Schoenlechner, R.; Berghofer, E. The effects of chickpea on the functional properties of white and whole wheat bread. Int. J. Food Sci. Technol. 2010, 45, 610–620. [Google Scholar] [CrossRef]
- Raza, H.; Zaaboul, F.; Shoaib, M.; Ashraf, W.; Hussain, A.; Zhang, L. Physicochemical and structural characterization of microwave-roasted chickpea. J. Glob. Innov. Agric. Soc. Sci. 2019, 7, 23–28. [Google Scholar] [CrossRef]
- Noort, M.W.; van Haaster, D.; Hemery, Y.; Schols, H.A.; Hamer, R.J. The effect of particle size of wheat bran fractions on bread quality–Evidence for fibre–protein interactions. J. Cereal Sci. 2010, 52, 59–64. [Google Scholar] [CrossRef]
- Lapčíková, B.; Burešová, I.; Lapčík, L.; Dabash, V.; Valenta, T. Impact of particle size on wheat dough and bread characteristics. Food Chem. 2019, 297, 124938. [Google Scholar] [CrossRef] [PubMed]
- Bourré, L.; Frohlich, P.; Young, G.; Borsuk, Y.; Sopiwnyk, E.; Sarkar, A.; Nickerson, M.T.; Ai, Y.; Dyck, A.; Malcolmson, L. Influence of particle size on flour and baking properties of yellow pea, navy bean, and red lentil flours. Cereal Chem. 2019, 96, 655–667. [Google Scholar] [CrossRef]
- Zi, Y.; Shen, H.; Dai, S.; Ma, X.; Ju, W.; Wang, C.; Guo, J.; Liu, A.; Cheng, D.; Li, H.; et al. Comparison of starch physicochemical properties of wheat cultivars differing in bread-and noodle-making quality. Food Hydrocoll. 2019, 93, 78–86. [Google Scholar] [CrossRef]
- Melis, S.; Delcour, J.A. Impact of wheat endogenous lipids on the quality of fresh bread: Key terms, concepts, and underlying mechanisms. Compr. Rev. Food Sci. Food Saf. 2020, 19, 3715–3754. [Google Scholar] [CrossRef]
- Marti, A.; Cardone, G.; Pagani, M.A.; Casiraghi, M.C. Flour from sprouted wheat as a new ingredient in bread-making. LWT-Food Sci. Technol. 2018, 89, 237–243. [Google Scholar] [CrossRef]


| Grits | Flour | ||
|---|---|---|---|
| Absorption properties (25 °C) | Water absorption capacity (g/g) | 1.8 ± 0.1 | 0.75 ± 0.01 *** |
| Oil absorption capacity (g/g) | 0.69 ± 0.01 | 0.91 ± 0.02 *** | |
| Water solubility index (g/g × 100) | 1.37 ± 0.08 | 2.06 ± 0.05 *** | |
| Water binding capacity (g/g) | 1.62 ± 0.01 | 0.69 ± 0.01 *** | |
| Absorption properties (90 °C) | Water absorption capacity (g/g) | 2.26 ± 0.13 | 1.96 ± 0.17 n.s. |
| Water solubility index (g/100 mL) | 1.39 ± 0.02 | 1.98 ± 0.13 ** | |
| Foaming properties | Foaming capacity (%) | 39.3 ± 1.2 | 32.7 ± 1.2 ** |
| Foaming stability (%) | 95.6 ± 1.8 | 93 ± 2 n.s. |
| Wheat | 25% Chickpea Grits | 25% Chickpea Flour | ||
|---|---|---|---|---|
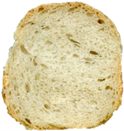 |  | 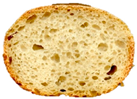 | ||
| Crust colour | L* | 57.4 ± 4.6 a | 50.1 ± 5.1 b | 49.1 ± 3.3 b |
| a* | 13.9 ± 2.1 a | 16.2 ± 1.7 b | 18.5 ± 1.7 c | |
| b* | 30.7 ± 1.7 a | 28 ± 3 b | 30.9 ± 2.3 a | |
| Crumb colour | L* | 68.6 ± 1.7 a | 65.04 ± 1.44 b | 58.9 ± 1.6 c |
| a* | 1.97 ± 0.15 a | 2.97 ± 0.29 b | 3.7 ± 0.3 c | |
| b* | 10.7 ± 0.7 a | 15.4 ± 1.2 b | 16.6 ± 0.8 c | |
| Specific volume (mL/g) | 3.1 ± 0.1 a | 2.5 ± 0.1 b | 2.1 ± 0.1 c | |
| Crumb moisture (%) | t0 | 42.4 ± 0.1 a | 43.1 ± 0.1 b | 43.3 ± 0.1 b |
| t1 | 41.4 ± 0.4 a | 42.3 ± 0.2 b | 42.2 ± 0.2 b | |
| t2 | 40.2 ± 0.2 a | 40.5 ± 0.2 ab | 40.8 ± 0.3 b | |
Disclaimer/Publisher’s Note: The statements, opinions and data contained in all publications are solely those of the individual author(s) and contributor(s) and not of MDPI and/or the editor(s). MDPI and/or the editor(s) disclaim responsibility for any injury to people or property resulting from any ideas, methods, instructions or products referred to in the content. |
© 2024 by the authors. Licensee MDPI, Basel, Switzerland. This article is an open access article distributed under the terms and conditions of the Creative Commons Attribution (CC BY) license (https://creativecommons.org/licenses/by/4.0/).
Share and Cite
Bresciani, A.; Sergiacomo, A.; De Stefani, A.; Marti, A. Impact of Sprouted Chickpea Grits and Flour on Dough Rheology and Bread Features. Foods 2024, 13, 2698. https://doi.org/10.3390/foods13172698
Bresciani A, Sergiacomo A, De Stefani A, Marti A. Impact of Sprouted Chickpea Grits and Flour on Dough Rheology and Bread Features. Foods. 2024; 13(17):2698. https://doi.org/10.3390/foods13172698
Chicago/Turabian StyleBresciani, Andrea, Alessio Sergiacomo, Andrea De Stefani, and Alessandra Marti. 2024. "Impact of Sprouted Chickpea Grits and Flour on Dough Rheology and Bread Features" Foods 13, no. 17: 2698. https://doi.org/10.3390/foods13172698