
Consumer Preference and Willingness to Pay for Rice Attributes in China: Results of a Choice Experiment


Abstract
1. Introduction
2. Literature Review
2.1. Extrinsic Attributes
2.2. Intrinsic Attributes
2.3. Addressing Limitations and Contributing to the Existing Literature
3. Materials and Methods
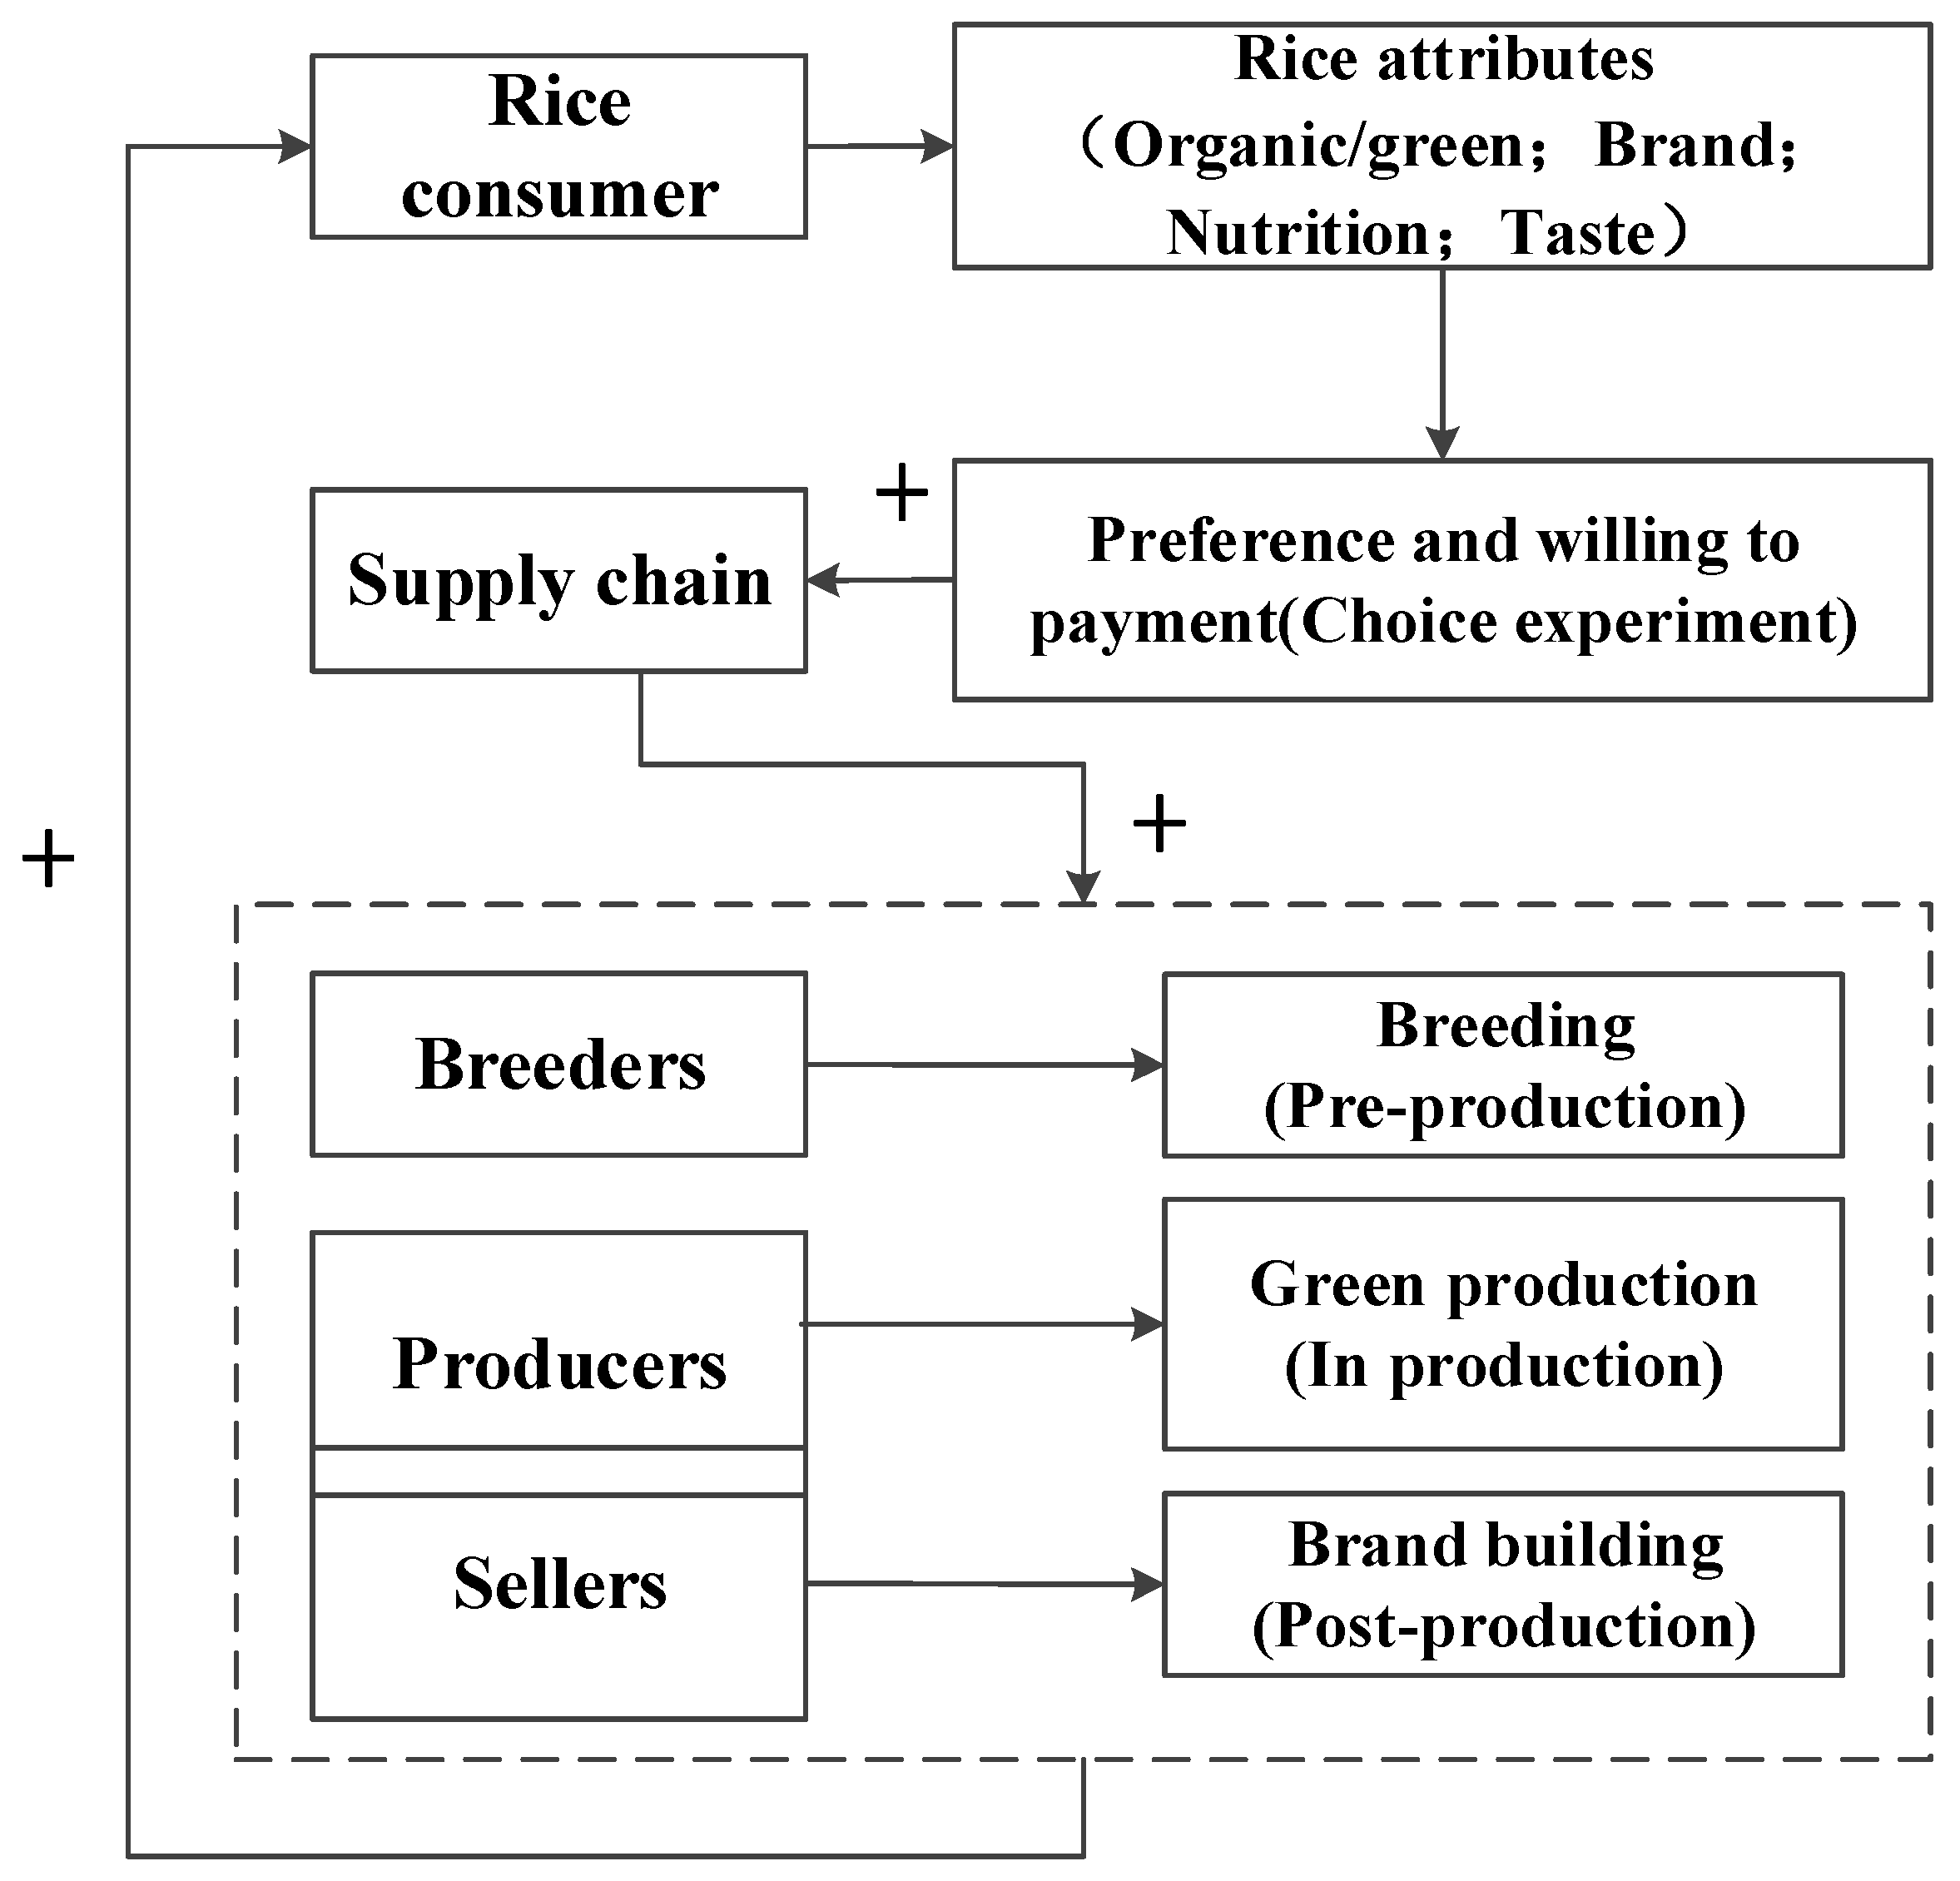
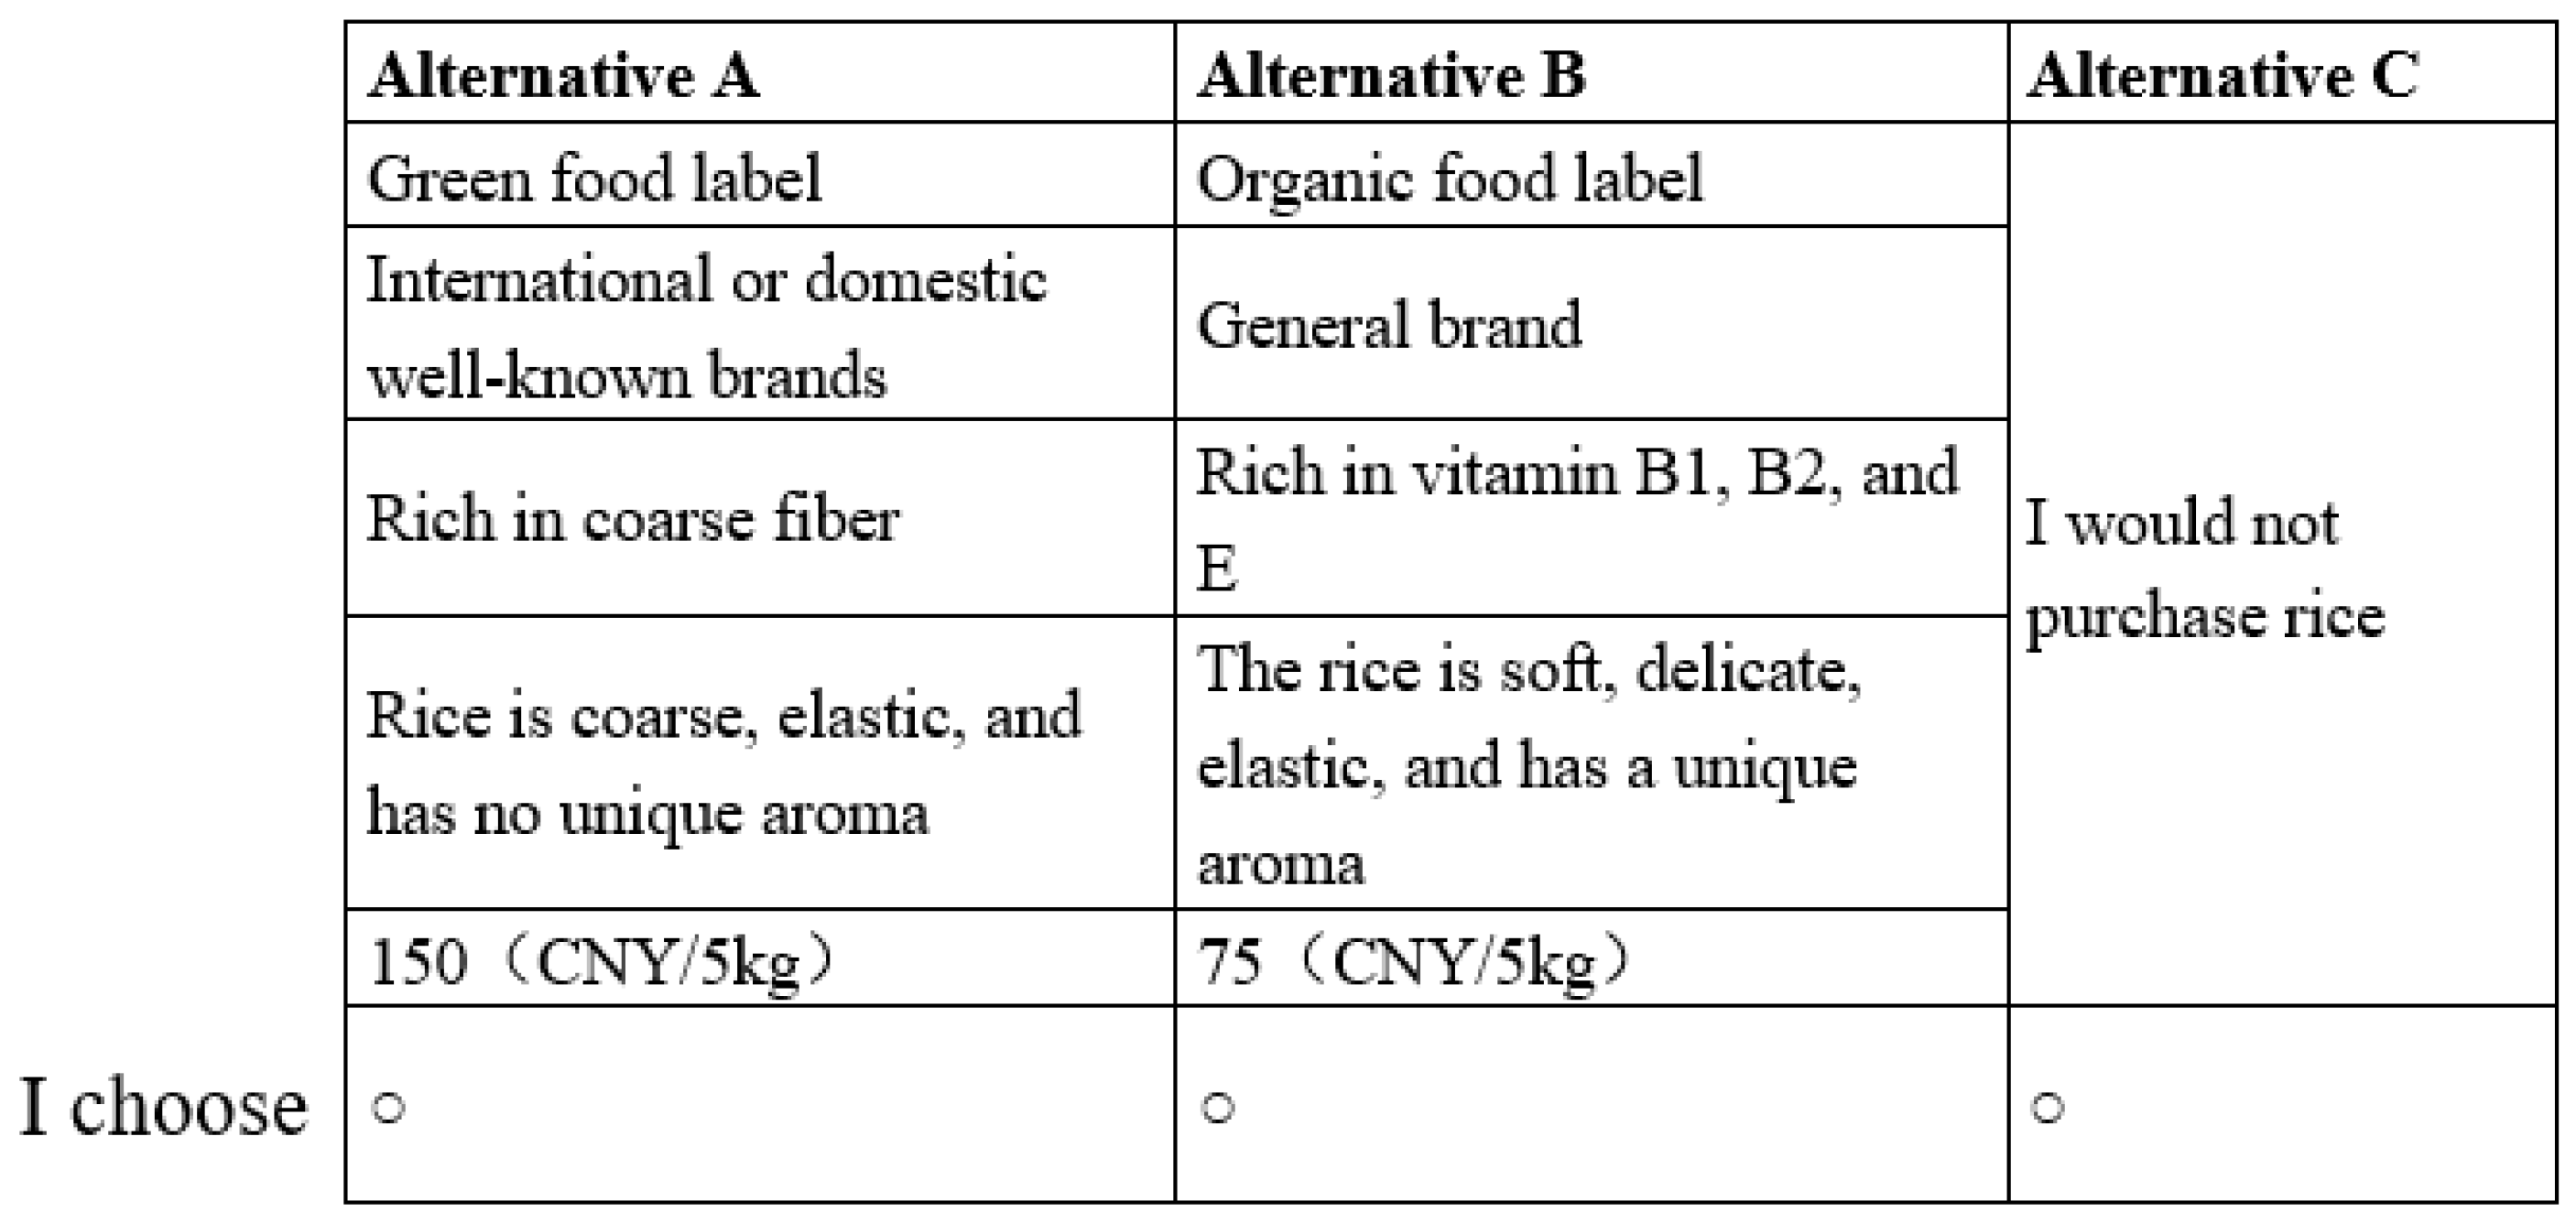
3.1. Choice Experiment
- (1)
- Designing a Virtual Rice Product Based on the 5 kg Packaging Specification
- (2)
- Selection of Experimental Attributes and Setting of Attribute Levels
- (3)
- Orthogonal experimental design
3.2. Data Collection and Sampling
3.3. Individual Characteristic Variables and Descriptive Statistics
3.4. Modeling Technique
4. Results and Discussion
4.1. General Preferences for Various Rice Attributes
4.2. Analysis of Synergistic Effect between Rice Brand and Safety Certification Labels
4.3. Analysis of Heterogeneity in Attribute Preferences and WTP for Rice
4.3.1. Estimation Results Based on the ML Model
4.3.2. Estimation Results Based on the LC Model
5. Conclusions and Policy Implications
Author Contributions
Funding
Institutional Review Board Statement
Informed Consent Statement
Data Availability Statement
Conflicts of Interest
References
- Custodio, M.C.; Demont, M.; Laborte, A.; Ynion, J. Improving Food Security in Asia through Consumer-Focused Rice Breeding. Glob. Food Secur. 2016, 9, 19–28. [Google Scholar] [CrossRef]
- Mohidem, N.A.; Hashim, N.; Shamsudin, R.; Che Man, H. Rice for Food Security: Revisiting Its Production, Diversity, Rice Milling Process and Nutrient Content. Agriculture 2022, 12, 741. [Google Scholar] [CrossRef]
- Nie, L.; Peng, S. Rice Production in China. In Rice Production Worldwide; Springer: Berlin/Heidelberg, Germany, 2017; pp. 33–52. [Google Scholar] [CrossRef]
- Ahmad Hanis, I.; Jinap, S.; Mad Nasir, S.; Alias, R.; Muhammad Shahrim, A. Consumers’ Demand and Willingness to Pay for Rice Attributes in Malaysia. Int. Food Res. J. 2012, 19, 363–369. [Google Scholar]
- Richardson, M.; Nalley, L.L.; Durand-Morat, A.; Crandall, P.; Scruggs, A.; Joseph, L.; Chouloute, J.; Yang, W. A Broken Market: Can Increased Access to Broken Rice Decrease Food Insecurity in Haiti? Food Secur. 2022, 14, 1387–1400. [Google Scholar] [CrossRef]
- Diagne, M.; Demont, M.; Ndour, M. Consumer Willingness to Pay for Rice Fragrance: Evidence from Senegal. In Proceedings of the 5th International Conference of the African Association of Agricultural Economists, Addis Ababa, Ethiopia, 23–26 September 2016. [Google Scholar]
- Kelley, K.M.; Primrose, R.; Crassweller, R.; Hayes, J.E.; Marini, R. Consumer Peach Preferences and Purchasing Behavior: A Mixed Methods Study. J. Sci. Food Agric. 2016, 96, 2451–2461. [Google Scholar] [CrossRef] [PubMed]
- Gallardo, R.K.; Ma, X.; Colonna, A.; Montero, M.L.; Ross, C. Consumers’ Preferences for Novel and Traditional Pear Cultivars: Evidence from Sensory Evaluation and Willingness-to-Pay Elicitation. Hortscience 2023, 58, 1474–1483. [Google Scholar] [CrossRef]
- Caputo, V.; Scarpa, R.; Nayga, R.M., Jr. Cue versus Independent Food Attributes: The Effect of Adding Attributes in Choice Experiments. Eur. Rev. Agric. Econ. 2017, 44, 211–230. [Google Scholar] [CrossRef]
- Khuu, T.P.D.; Saito, Y.; Tojo, N.; Nguyen, P.D.; Nguyen, T.N.H.; Matsuishi, T.F. Are Consumers Willing to Pay More for Traceability? Evidence from an Auction Experiment of Vietnamese Pork. Int. J. Food Agric. Econ. 2019, 7, 127–140. [Google Scholar] [CrossRef]
- Vriezen, R.; Plishka, M.; Cranfield, J. Consumer Willingness to Pay for Traceable Food Products: A Scoping Review. Br. Food J. 2023, 125, 1631–1665. [Google Scholar] [CrossRef]
- Shew, A.M.; Snell, H.A.; Nayga, R.M., Jr.; Lacity, M.C. Consumer Valuation of Blockchain Traceability for Beef in the United States. Appl. Econ. Perspect. Policy 2022, 44, 299–323. [Google Scholar] [CrossRef]
- Li, S.; Kallas, Z. Meta-Analysis of Consumers’ Willingness to Pay for Sustainable Food Products. Appetite 2021, 163, 105239. [Google Scholar] [CrossRef]
- Zhang, M.; Li, L.; Bai, J. Consumer Acceptance of Cultured Meat in Urban Areas of Three Cities in China. Food Control 2020, 118, 107390. [Google Scholar] [CrossRef]
- Lancaster, K.J. A New Approach to Consumer Theory. J. Political Econ. 1966, 74, 132–157. [Google Scholar] [CrossRef]
- Demont, M. Reversing Urban Bias in African Rice Markets: A Review of 19 National Rice Development Strategies. Glob. Food Secur. 2013, 2, 172–181. [Google Scholar] [CrossRef]
- Hoffmann, N.C.; Symmank, C.; Mai, R.; Stok, F.M.; Rohm, H.; Hoffmann, S. The Influence of Extrinsic Product Attributes on Consumers’ Food Decisions: Review and Network Analysis of the Marketing Literature. J. Mark. Manag. 2020, 36, 888–915. [Google Scholar] [CrossRef]
- Tran, D.; Schouteten, J.J.; Gellynck, X.; De Steur, H. How Do Consumers Value Food Traceability?—A Meta-Analysis. Food Control 2024, 162, 110453. [Google Scholar] [CrossRef]
- Yeh, C.; Hirsch, S. A Meta-regression Analysis on the Willingness-to-pay for Country-of-origin Labelling. J. Agric. Econ. 2023, 74, 719–743. [Google Scholar] [CrossRef]
- Naseem, A.; Mhlanga, S.; Diagne, A.; Adegbola, P.Y.; Midingoyi, G.S. Economic Analysis of Consumer Choices Based on Rice Attributes in the Food Markets of West Africa—The Case of Benin. Food Secur. 2013, 5, 575–589. [Google Scholar] [CrossRef]
- Bairagi, S.; Demont, M.; Custodio, M.C.; Ynion, J. What Drives Consumer Demand for Rice Fragrance? Evidence from South and Southeast Asia. Br. Food J. 2020, 122, 3473–3498. [Google Scholar] [CrossRef]
- Mottaleb, K.A.; Rahut, D.B.; Mishra, A.K. Modeling Rice Grain-Type Preferences in Bangladesh. Br. Food J. 2017, 119, 2049–2061. [Google Scholar] [CrossRef]
- Bu, T.; Tang, D.; Liu, Y.; Chen, D. Trends in Dietary Patterns and Diet-Related Behaviors in China. Am. J. Health Behav. 2021, 45, 371–383. [Google Scholar] [CrossRef]
- Cabral, D.; Moura, A.P.; Fonseca, S.C.; Oliveira, J.C.; Cunha, L.M. Exploring Rice Consumption Habits and Determinants of Choice, Aiming for the Development and Promotion of Rice Products with a Low Glycaemic Index. Foods 2024, 13, 301. [Google Scholar] [CrossRef]
- Freeman Iii, A.M.; Herriges, J.A.; Kling, C.L. The Measurement of Environmental and Resource Values: Theory and Methods; Routledge: London, UK, 2014; ISBN 1-315-78091-7. [Google Scholar]
- Girgenti, V.; Massaglia, S.; Mosso, A.; Peano, C.; Brun, F. Exploring Perceptions of Raspberries and Blueberries by Italian Consumers. Sustainability 2016, 8, 1027. [Google Scholar] [CrossRef]
- Bechtold, K.-B.; Abdulai, A. Combining Attitudinal Statements with Choice Experiments to Analyze Preference Heterogeneity for Functional Dairy Products. Food Policy 2014, 47, 97–106. [Google Scholar] [CrossRef]
- Xu, S.; He, X. Estimating the Recreational Value of a Coastal Wetland Park: Application of the Choice Experiment Method and Travel Cost Interval Analysis. J. Environ. Manag. 2022, 304, 114225. [Google Scholar] [CrossRef]
- Hensher, D.A.; Greene, W.H. The Mixed Logit Model: The State of Practice. Transportation 2003, 30, 133–176. [Google Scholar] [CrossRef]
- Uchida, H.; Onozaka, Y.; Morita, T.; Managi, S. Demand for Ecolabeled Seafood in the Japanese Market: A Conjoint Analysis of the Impact of Information and Interaction with Other Labels. Food Policy 2014, 44, 68–76. [Google Scholar] [CrossRef]
- Bi, X.; House, L.; Gao, Z. Impacts of Nutrition Information on Choices of Fresh Seafood among Parents. Mar. Resour. Econ. 2016, 31, 355–372. [Google Scholar] [CrossRef]
- Xu, P.; Su, H.; Lone, T. Chinese Consumers’ Willingness to Pay for Rice. J. Agribus. Dev. Emerg. Econ. 2018, 8, 256–269. [Google Scholar] [CrossRef]
- Xu, H.; Xiao, M.; Zeng, J.; Hao, H. Green-Labelled Rice versus Conventional Rice: Perception and Emotion of Chinese Consumers Based on Review Mining. Foods 2022, 12, 87. [Google Scholar] [CrossRef]
- Probst, L.; Houedjofonon, E.; Ayerakwa, H.M.; Haas, R. Will They Buy It? The Potential for Marketing Organic Vegetables in the Food Vending Sector to Strengthen Vegetable Safety: A Choice Experiment Study in Three West African Cities. Food Policy 2012, 37, 296–308. [Google Scholar] [CrossRef]
- Manski, C.F. Economic Analysis of Social Interactions. J. Econ. Perspect. 2000, 14, 115–136. [Google Scholar] [CrossRef]
- Fafchamps, M.; Vaz, A.; Vicente, P.C. Voting and Peer Effects: Experimental Evidence from Mozambique. Econ. Dev. Cult. Chang. 2020, 68, 567–605. [Google Scholar] [CrossRef]
- Nguyen, N.P.T.; Dang, H.D. Organic Food Purchase Decisions from a Context-Based Behavioral Reasoning Approach. Appetite 2022, 173, 105975. [Google Scholar] [CrossRef] [PubMed]
- Eyinade, G.A.; Mushunje, A.; Yusuf, S.F.G. The Willingness to Consume Organic Food: A Review. Food Agric. Immunol. 2021, 32, 78–104. [Google Scholar] [CrossRef]
- Yu, X.; Gao, Z.; Zeng, Y. Willingness to Pay for the “Green Food” in China. Food Policy 2014, 45, 80–87. [Google Scholar] [CrossRef]
- Wang, J.-J.; Liang, K.-L.; Lin, W.-J.; Chen, C.-Y.; Jiang, R.-S. Influence of Age and Sex on Taste Function of Healthy Subjects. PLoS ONE 2020, 15, e0227014. [Google Scholar] [CrossRef]
- Jeon, S.; Kim, Y.; Min, S.; Song, M.; Son, S.; Lee, S. Taste Sensitivity of Elderly People Is Associated with Quality of Life and Inadequate Dietary Intake. Nutrients 2021, 13, 1693. [Google Scholar] [CrossRef]
- Deaton, A. Quality, Quantity, and Spatial Variation of Price. Am. Econ. Rev. 1988, 78, 418–430. [Google Scholar]
- Yu, X.; Abler, D. The Demand for Food Quality in Rural China. Am. J. Agric. Econ. 2009, 91, 57–69. [Google Scholar] [CrossRef]
- Tian, X.; Yu, X. The Demand for Nutrients in China. Front. Econ. China 2013, 8, 186–206. [Google Scholar]

| Attribute | Level | Describe | Variable Assignment |
|---|---|---|---|
| Food safety labels | 3 | Organic certification labels (Organic) | Organic = 1; Green = 0 |
| Green certification labels (Green) | Organic = 0; Green = 1 | ||
| No food safety label | Organic = −1; Green = −1 | ||
| Brands | 3 | Well-known international or domestic brands (Brand1) | Brand1 = 1; Brand2 = 0 |
| Well-known local brands (Brand2) | Brand1 = 0; Brand2 = 1 | ||
| General brand | Brand1 = −1; Brand2 = −1 | ||
| Nutritional quality (https://www.cn-healthcare.com/articlewm/20200101/content-1080903.html (accessed on 30 June 2023)) | 3 | Rich in vitamin B1, B2, and E (Vitamin) | Vitamin = 1; Crude_fibre = 0 |
| Rich in coarse fiber (Crude_fibre) | Vitamin = 0; Crude_fibre = 1 | ||
| Rich in trace elements such as potassium, magnesium, and calcium | Vitamin = −1; Crude_fibre = −1 | ||
| Taste quality | 3 | The rice is soft, delicate, elastic, and has a unique aroma (Taste1) | Taste1 = 1; Taste2 = 0 |
| The rice is soft, delicate, elastic, and has no unique aroma (Taste2) | Taste1 = 0; Taste2 = 1 | ||
| Rice is coarse, elastic, and has no unique aroma | Taste1 = −1; Taste2 = −1 | ||
| Price | 6 | 25; 50; 75; 100; 125; 150 (CNY per 5 kg) | |
| “Do not buy” option | The “Do not buy” option is selected: NONE = 1; The “Do not buy” option is not selected: NONE = 0 | ||
| Variables | Problem Setting | Description | Percentage (%) | Mean |
|---|---|---|---|---|
| Age | How old are you? | Under 19 years old (=1) | 0.16 | |
| From 20 to 29 years old (=2) | 22.42 | |||
| From 30 to 39 years old (=3) | 31.64 | |||
| From 40 to 49 years old (=4) | 23.69 | |||
| From 50 to 59 years old (=5) | 14.47 | |||
| Over 60 years old (=6) | 7.63 | |||
| Sex | What is your gender? | Female (=0) | 55.64 | |
| Male (=1) | 44.36 | |||
| Education | What is your education level? | Primary and below (=1) | 1.43 | |
| Junior high school (=2) | 5.41 | |||
| High school/technical secondary school (=3) | 8.90 | |||
| Junior college (=4) | 17.65 | |||
| Bachelor’s (=5) | 34.82 | |||
| Master’s (=6) | 23.53 | |||
| Doctoral (=7) | 8.27 | |||
| Household scale | How many families live together? | Two people or less (=1) | 15.58 | |
| Three people (=2) | 31.80 | |||
| Four people (=3) | 22.42 | |||
| Five people and above (=4) | 30.21 | |||
| Monthly household income | What is your monthly household income? | Less than CNY 3000 (=1) | 3.34 | |
| From CNY 3000 to 6000 (=2) | 7.47 | |||
| From CNY 6000 to 10,000 (=3) | 21.94 | |||
| From CNY 10,000 to 15,000 (=5) | 23.05 | |||
| From CNY 15,000 to 20,000 (=7) | 15.74 | |||
| From CNY 20,000 to 30,000 (=10) | 15.74 | |||
| From CNY 30,000 to 50,000 (=14) | 7.47 | |||
| More than CNY 50,000 (=19) | 5.25 | |||
| Purchase frequency | The number of times a family buys rice in a year | The specific number of times | 8.14 | |
| Hazard cognition of rice production | How much pollution do you think rice production causes to the environment? | Small (=1) | 29.89 | |
| Less (=2) | 21.62 | |||
| General (=3) | 36.41 | |||
| Greater (=4) | 8.59 | |||
| Big (=5) | 3.50 | |||
| Safety cognition of organic rice | Do you think “organic rice” is safer than regular rice? | Complete disagreement (=1) | 2.70 | |
| Disagreement (=2) | 4.29 | |||
| Uncertain (=3) | 41.18 | |||
| Agreement (=4) | 38.47 | |||
| Strong agreement (=5) | 13.35 | |||
| Community influence | People you know around you eat organic rice | No (=0) | 28.78 | |
| Yes (=1) | 71.22 |
| Attributes | Hierarchy Variable | Mean Estimation Coefficient | SD | Relative Importance (%) |
|---|---|---|---|---|
| Price | −0.011 *** | |||
| (0.001) | ||||
| “Do not buy” option | −2.646 *** | 2.857 *** | ||
| (0.161) | (0.169) | |||
| Food safety labels | Organic certification labels | 0.567 *** | 0.792 *** | 14.00 |
| (0.048) | (0.053) | |||
| Green certification labels | 0.715 *** | 0.569 *** | ||
| (0.046) | (0.056) | |||
| Brands | Well-known international or domestic brands | 0.033 | 0.062 | 2.74 |
| (0.033) | (0.078) | |||
| Well-known local brands | 0.062 | −0.014 | ||
| (0.040) | (0.052) | |||
| Nutritional quality | Rich in vitamin B1, B2, and E | 0.217 *** | 0.035 | 33.40 |
| (0.040) | (0.056) | |||
| Rich in coarse fiber | −0.136 *** | 0.055 | ||
| (0.034) | (0.063) | |||
| Taste quality | The rice is soft, delicate, elastic and has no unique aroma (Superior taste quality) | 0.684 *** | 0.664 *** | 49.86 |
| (0.048) | (0.054) | |||
| The rice is soft, delicate, elastic and has no unique aroma (Medium taste quality) | 0.157 *** | 0.256 *** | ||
| (0.038) | (0.074) |
| Attributes | Hierarchy Variable | WTP | z | 95% Confidence Interval | Premium Rate (%) | |
|---|---|---|---|---|---|---|
| Food safety labels | Organic certification labels | 50.356 *** | 9.540 | 40.009 | 60.702 | 100.71 |
| Green certification labels | 63.468 *** | 11.890 | 53.006 | 73.930 | 126.94 | |
| Brands | Well-known international or domestic brands | 2.949 | 1.030 | −2.684 | 8.582 | 5.90 |
| Well-known local brands | 5.515 | 1.540 | −1.493 | 12.523 | 11.03 | |
| Nutritional quality | Rich in vitamin B1, B2, and E | 19.232 *** | 5.290 | 12.102 | 26.362 | 38.46 |
| Rich in coarse fiber | −12.090 *** | −4.020 | −17.989 | −6.191 | - | |
| Taste quality | Superior taste quality | 60.791 *** | 11.060 | 50.020 | 71.562 | 121.58 |
| Medium taste quality | 13.924 *** | 4.050 | 7.177 | 20.670 | 27.85 | |
| Variables | Coefficients | Standard Errors |
|---|---|---|
| Price | −0.0103 *** | 0.000829 |
| Organic certification labels × Well-known international or domestic brands | −0.365 *** | 0.0754 |
| Organic certification labels × Well-known local brands | 0.0817 | 0.0815 |
| Green certification labels × Well-known international or domestic brands | 0.199 *** | 0.0687 |
| Green certification labels × Well-known local brands | 0.0881 | 0.0804 |
| Attribute item | Yes | |
| Total | 16,983 | |
| Variables | Coefficients | Standard Errors |
|---|---|---|
| Price | −0.0113 *** | 0.000756 |
| External environment | ||
| Hazard cognition of rice production × Organic certification labels | 0.0274 | 0.0400 |
| Safety cognition of organic rice × Organic certification labels | 0.170 *** | 0.0516 |
| Community influence × Organic certification labels | 0.207 ** | 0.0984 |
| Consumption habits | ||
| Purchase frequency × Organic certification labels | 0.00728 | 0.00827 |
| Purchase frequency × Green certification labels | 0.00529 | 0.00726 |
| Purchase frequency × Well-known international or domestic brands | −0.0141 ** | 0.00587 |
| Purchase frequency × Well-known local brands | 0.0154 ** | 0.00710 |
| Purchase frequency × Superior taste quality | 0.00352 | 0.00767 |
| Purchase frequency × Medium taste quality | −0.00216 | 0.00678 |
| Personal characteristics | ||
| Age × Organic certification labels | 0.0266 | 0.0434 |
| Age × Green certification labels | −0.0534 | 0.0393 |
| Age × Well-known international or domestic brands | 0.0292 | 0.0306 |
| Age × Well-known local brands | −0.0254 | 0.0377 |
| Age × Superior taste quality | −0.124 *** | 0.0419 |
| Age × Medium taste quality | −0.0102 | 0.0353 |
| Sex × Organic certification labels | 0.0518 | 0.0943 |
| Sex × Green certification labels | −0.0686 | 0.0852 |
| Sex × Well-known international or domestic brands | −0.0427 | 0.0659 |
| Sex × Well-known local brands | 0.0751 | 0.0804 |
| Sex × Superior taste quality | −0.176 ** | 0.0881 |
| Sex × Medium taste quality | −0.0515 | 0.0768 |
| Education × Organic certification labels | 0.0373 | 0.0398 |
| Education × Green certification labels | −0.0192 | 0.0362 |
| Education × Well-known international or domestic brands | −0.0166 | 0.0282 |
| Education × Well-known local brands | −0.0144 | 0.0342 |
| Education × Superior taste quality | −0.00425 | 0.0371 |
| Education × Medium taste quality | −0.0212 | 0.0332 |
| Household scale × Organic certification labels | −0.0303 | 0.0442 |
| Household scale × Green certification labels | 0.00718 | 0.0406 |
| Household scale × Well-known international or domestic brands | −0.0199 | 0.0313 |
| Household scale × Well-known local brands | 0.0183 | 0.0382 |
| Household scale × Superior taste quality | −0.0480 | 0.0414 |
| Household scale × Medium taste quality | 0.0216 | 0.0361 |
| Monthly household income × Organic certification labels | 0.00533 | 0.0110 |
| Monthly household income × Green certification labels | 0.00502 | 0.0101 |
| Monthly household income × Well-known international or domestic brands | −0.000761 | 0.00790 |
| Monthly household income × Well-known local brands | 0.0136 | 0.00963 |
| Monthly household income × Superior taste quality | 0.0224 ** | 0.0104 |
| Monthly household income × Medium taste quality | 0.00858 | 0.00917 |
| Attribute item | Yes | |
| Total | 16,983 | 16,983 |
| Categorical Series | CAIC | BIC |
|---|---|---|
| 2 | 8788.018 | 8694.691 |
| 3 | 8567.716 | 8425.504 |
| 4 | 8396.378 | 8205.281 |
| 5 | 8371.814 | 8131.831 |
| 6 | 8348.107 | 8059.238 |
| 7 | 8367.641 | 8029.887 |
| (1) | (2) | (3) | (4) | (5) | |
|---|---|---|---|---|---|
| Variables | Strict Requirement I | Food Safety Label Preference | Price-Sensitive | Strict Requirement II | Disregard Food Safety Label |
| Utility function coefficients | |||||
| Price | 0.00339 * | −0.00306 | −0.0313 *** | −0.0114 *** | −0.0124 *** |
| (0.00199) | (0.00244) | (0.00262) | (0.00230) | (0.00233) | |
| None | −2.936 *** | −3.587 *** | −0.736 *** | −0.817 *** | −3.250 *** |
| (0.621) | (0.444) | (0.161) | (0.202) | (0.325) | |
| Organic certification labels | −0.0554 | 1.126 *** | 0.648 *** | 0.520 *** | 0.0188 |
| (0.141) | (0.148) | (0.114) | (0.125) | (0.102) | |
| Green certification labels | 0.605 *** | 0.806 *** | 0.197 * | 1.260 *** | −0.0710 |
| (0.169) | (0.102) | (0.107) | (0.143) | (0.0813) | |
| Well-known international or domestic brands | −0.0749 | 0.218 ** | 0.215 ** | −0.158 | −0.0296 |
| (0.111) | (0.0913) | (0.105) | (0.114) | (0.0960) | |
| Well-known local brands | 0.0752 | 0.0650 | −0.122 | 0.258 ** | 0.0496 |
| (0.105) | (0.115) | (0.114) | (0.108) | (0.0900) | |
| Rich in vitamin B1, B2, and E | 0.283 ** | 0.0225 | 0.135 | 0.303 *** | 0.174 ** |
| (0.133) | (0.0972) | (0.107) | (0.118) | (0.0816) | |
| Rich in coarse fiber | −0.297 *** | 0.0711 | −0.179 | −0.194 ** | −0.0256 |
| (0.108) | (0.0729) | (0.113) | (0.0966) | (0.0823) | |
| Superior taste quality | 1.003 *** | 0.126 | 0.491 *** | 1.339 *** | 0.202 ** |
| (0.199) | (0.101) | (0.103) | (0.143) | (0.0898) | |
| Medium taste quality | 0.364 *** | −0.0849 | −0.0155 | 0.641 *** | −0.106 |
| (0.0988) | (0.131) | (0.114) | (0.122) | (0.0895) | |
| Class membership Coefficients | |||||
| Hazard cognition of rice production | 0.421 ** | 0.0629 | 0.161 | 0.230 | |
| (0.189) | (0.161) | (0.162) | (0.164) | ||
| Safety cognition of organic rice | 0.296 | 0.323 * | −0.0882 | 0.149 | |
| (0.266) | (0.195) | (0.195) | (0.202) | ||
| Community influence | 0.742 | 0.892 ** | 0.191 | −0.0123 | |
| (0.465) | (0.376) | (0.354) | (0.369) | ||
| Purchase frequency | −0.00191 | 0.00406 | −0.0142 | 0.0234 | |
| (0.0362) | (0.0294) | (0.0330) | (0.0313) | ||
| Age | −0.481 ** | −0.132 | −0.160 | −0.293 * | |
| (0.196) | (0.156) | (0.156) | (0.160) | ||
| Sex | −0.624 | 0.167 | 0.246 | −0.200 | |
| (0.423) | (0.342) | (0.342) | (0.352) | ||
| Education | −0.147 | 0.0979 | −0.0965 | 0.167 | |
| (0.190) | (0.147) | (0.149) | (0.160) | ||
| Household scale | 0.584 *** | 0.320 ** | 0.352 ** | 0.0111 | |
| (0.208) | (0.161) | (0.165) | (0.172) | ||
| Monthly household income | −0.00253 | −0.00601 | 0.0152 | 0.0893 ** | |
| (0.0530) | (0.0421) | (0.0430) | (0.0415) | ||
| Constant | −1.409 | −1.978 | 0.158 | −1.132 | |
| (1.760) | (1.497) | (1.433) | (1.513) | ||
| Observations | 16,983 | 16,983 | 16,983 | 16,983 | 16,983 |
| Number of groups | 5661 | 5661 | 5661 | 5661 | 5661 |
| Latent class share | 15.1% | 31.1% | 18.7% | 21.6% | 13.5% |
Disclaimer/Publisher’s Note: The statements, opinions and data contained in all publications are solely those of the individual author(s) and contributor(s) and not of MDPI and/or the editor(s). MDPI and/or the editor(s) disclaim responsibility for any injury to people or property resulting from any ideas, methods, instructions or products referred to in the content. |
© 2024 by the authors. Licensee MDPI, Basel, Switzerland. This article is an open access article distributed under the terms and conditions of the Creative Commons Attribution (CC BY) license (https://creativecommons.org/licenses/by/4.0/).
Share and Cite
Fang, P.; Zhou, Z.; Wang, H.; Zhang, L. Consumer Preference and Willingness to Pay for Rice Attributes in China: Results of a Choice Experiment. Foods 2024, 13, 2774. https://doi.org/10.3390/foods13172774
Fang P, Zhou Z, Wang H, Zhang L. Consumer Preference and Willingness to Pay for Rice Attributes in China: Results of a Choice Experiment. Foods. 2024; 13(17):2774. https://doi.org/10.3390/foods13172774
Chicago/Turabian StyleFang, Pingping, Zhou Zhou, Hua Wang, and Lixia Zhang. 2024. "Consumer Preference and Willingness to Pay for Rice Attributes in China: Results of a Choice Experiment" Foods 13, no. 17: 2774. https://doi.org/10.3390/foods13172774
APA StyleFang, P., Zhou, Z., Wang, H., & Zhang, L. (2024). Consumer Preference and Willingness to Pay for Rice Attributes in China: Results of a Choice Experiment. Foods, 13(17), 2774. https://doi.org/10.3390/foods13172774