
Structured Triacylglycerol with Optimal Arachidonic Acid and Docosahexaenoic Acid Content for Infant Formula Development: A Bio-Accessibility Study

 , , and
Abstract
:1. Introduction
2. Materials and Methods
2.1. Materials
2.2. Methods
2.2.1. Analysis of Fatty Acid Profile
2.2.2. Analysis of Positional Distribution of Fatty Acids
2.2.3. Lipase-Catalyzed Hydrolysis of DHA-Oil
2.2.4. Lipase-Catalyzed Acidolysis
2.2.5. Analysis of Total FFAs
2.2.6. Neutralization of Acidolysis Aliquots and Products
2.2.7. In Vitro Gastrointestinal Digestion Model
Gastric Digestion
Intestinal Digestion
Phase Separation after In Vitro Digestion
Lipid Extraction
2.2.8. Analysis of Lipids from Gastrointestinal Digestion
3. Results and Discussion
3.1. Fatty Acid Profile and Positional Distribution of Initial Oils, Their Blending, and Formulaid™
3.2. Acidolysis
3.3. Scale-Up
3.4. In Vitro Gastrointestinal Digestion of the Scale-Up Product
4. Conclusions
Author Contributions
Funding
Data Availability Statement
Acknowledgments
Conflicts of Interest
References
- Djuricic, I.; Calder, P.C. Beneficial outcomes of omega-6 and omega-3 polyunsaturated fatty acids on human health: An update for 2021. Nutrients 2021, 13, 2421. [Google Scholar] [CrossRef] [PubMed]
- Heath, R.J.; Klevebro, S.; Wood, T.R. Maternal and neonatal polyunsaturated fatty acid intake and risk of neurodevelopmental impairment in premature infants. Int. J. Mol. Sci. 2022, 23, 700. [Google Scholar] [CrossRef]
- Duerden, E.G.; Taylor, M.J.; Miller, S.P. Brain development in infants born preterm: Looking beyond injury. Semin. Pediatr. Neurol. 2013, 20, 65–74. [Google Scholar] [CrossRef] [PubMed]
- Ohuma, E.O.; Moller, A.-B.; Bradley, E.; Chakwera, S.; Hussain-Alkhateeb, L.; Lewin, A.; Okwaraji, Y.B.; Mahanani, W.R.; Johansson, E.W.; Lavin, T. National, regional, and global estimates of preterm birth in 2020, with trends from 2010: A systematic analysis. Lancet 2023, 402, 1261–1271. [Google Scholar] [CrossRef]
- Floris, L.; Stahl, B.; Abrahamse-Berkeveld, M.; Teller, I. Human milk fatty acid profile across lactational stages after term and preterm delivery: A pooled data analysis. Prostaglandins Leukot. Essent. Fat. Acids 2020, 156, 102023. [Google Scholar] [CrossRef] [PubMed]
- Arslanoglu, S.; Boquien, C.-Y.; King, C.; Lamireau, D.; Tonetto, P.; Barnett, D.; Bertino, E.; Gaya, A.; Gebauer, C.; Grovslien, A. Fortification of human milk for preterm infants: Update and recommendations of the European Milk Bank Association (EMBA) Working Group on Human Milk Fortification. Front. Pediatr. 2019, 7, 76. [Google Scholar] [CrossRef] [PubMed]
- Alshweki, A.; Muñuzuri, A.P.; Baña, A.M.; de Castro, M.J.; Andrade, F.; Aldamiz-Echevarría, L.; de Pipaón, M.S.; Fraga, J.M.; Couce, M.L. Effects of different arachidonic acid supplementation on psychomotor development in very preterm infants: A randomized controlled trial. Nutr. J. 2015, 14, 101. [Google Scholar] [CrossRef] [PubMed]
- Bernhard, W.; Raith, M.; Koch, V.; Maas, C.; Abele, H.; Poets, C.F.; Franz, A.R. Developmental changes in polyunsaturated fetal plasma phospholipids and feto-maternal plasma phospholipid ratios and their association with bronchopulmonary dysplasia. Eur. J. Nutr. 2016, 55, 2265–2274. [Google Scholar] [CrossRef]
- Hellström, A.; Nilsson, A.K.; Wackernagel, D.; Pivodic, A.; Vanpee, M.; Sjöbom, U.; Hellgren, G.; Hallberg, B.; Domellöf, M.; Klevebro, S. Effect of enteral lipid supplement on severe retinopathy of prematurity: A randomized clinical trial. JAMA Pediatr. 2021, 175, 359–367. [Google Scholar] [CrossRef]
- Martin, C.R.; Cheesman, A.; Brown, J.; Makda, M.; Kutner, A.J.; DaSilva, D.; Zaman, M.; Freedman, S.D. Factors determining optimal fatty acid absorption in preterm infants. J. Pediatr. Gastroenterol. Nutr. 2016, 62, 130–136. [Google Scholar] [CrossRef]
- Chabni, A.; Pardo de Donlebún, B.; Romero, M.; Torres, C.F. Predigested Mixture of Arachidonic and Docosahexaenoic Acids for Better Bio-Accessibility. Mar. Drugs 2024, 22, 224. [Google Scholar] [CrossRef]
- Guo, Y.; Cai, Z.; Xie, Y.; Ma, A.; Zhang, H.; Rao, P.; Wang, Q. Synthesis, physicochemical properties, and health aspects of structured lipids: A review. Compr. Rev. Food Sci. Food Saf. 2020, 19, 759–800. [Google Scholar] [CrossRef]
- Kim, B.H.; Akoh, C.C. Recent research trends on the enzymatic synthesis of structured lipids. J. Food Sci. 2015, 80, C1713–C1724. [Google Scholar] [CrossRef] [PubMed]
- Jin, J.; Jin, Q.; Wang, X.; Akoh, C.C. High sn-2 docosahexaenoic acid lipids for brain benefits, and their enzymatic syntheses: A review. Engineering 2020, 6, 424–431. [Google Scholar] [CrossRef]
- Lopes, P.A.; Pestana, J.M.; Coelho, D.; Madeira, M.S.; Alfaia, C.M.; Prates, J.A. From natural triacylglycerols to novel structured lipids containing n-3 long-chain polyunsaturated fatty acids. Mol. Nutr. Fats 2019, 225–235. [Google Scholar] [CrossRef]
- Iwasaki, Y.; Yamane, T. Enzymatic synthesis of structured lipids. J. Mol. Catal. B Enzym. 2000, 10, 129–140. [Google Scholar] [CrossRef]
- Turan, D.; Şahin Yeşilçubuk, N.E.; Akoh, C.C. Production of human milk fat analogue containing docosahexaenoic and arachidonic acids. J. Agric. Food Chem. 2012, 60, 4402–4407. [Google Scholar] [CrossRef]
- Nagachinta, S.; Akoh, C.C. Synthesis of structured lipid enriched with omega fatty acids and sn-2 palmitic acid by enzymatic esterification and its incorporation in powdered infant formula. J. Agric. Food Chem. 2013, 61, 4455–4463. [Google Scholar] [CrossRef] [PubMed]
- Wang, X.; Zou, S.; Miu, Z.; Jin, Q.; Wang, X. Enzymatic preparation of structured triacylglycerols with arachidonic and palmitic acids at the sn-2 position for infant formula use. Food Chem. 2019, 283, 331–337. [Google Scholar] [CrossRef]
- Tecelão, C.; Silva, J.; Dubreucq, E.; Ribeiro, M.H.; Ferreira-Dias, S. Production of human milk fat substitutes enriched in omega-3 polyunsaturated fatty acids using immobilized commercial lipases and Candida parapsilosis lipase/acyltransferase. J. Mol. Catal. B Enzym. 2010, 65, 122–127. [Google Scholar] [CrossRef]
- Dima, C.; Assadpour, E.; Dima, S.; Jafari, S.M. Bioavailability and bioaccessibility of food bioactive compounds; overview and assessment by in vitro methods. Compr. Rev. Food Sci. Food Saf. 2020, 19, 2862–2884. [Google Scholar] [CrossRef] [PubMed]
- Rodrigues, D.B.; Marques, M.C.; Hacke, A.; Loubet Filho, P.S.; Cazarin, C.B.B.; Mariutti, L.R.B. Trust your gut: Bioavailability and bioaccessibility of dietary compounds. Curr. Res. Food Sci. 2022, 5, 228–233. [Google Scholar] [CrossRef] [PubMed]
- Chabni, A.; Bañares, C.; Reglero, G.; Torres, C.F. A comparative study of in vitro gastrointestinal digestion of three strategic edible oils. J. Food Sci. 2022, 87, 3268–3278. [Google Scholar] [CrossRef] [PubMed]
- Mackie, A.; Mulet-Cabero, A.-I.; Torcello-Gómez, A. Simulating human digestion: Developing our knowledge to create healthier and more sustainable foods. Food Funct. 2020, 11, 9397–9431. [Google Scholar] [CrossRef] [PubMed]
- Sensoy, I. A review on the food digestion in the digestive tract and the used in vitro models. Curr. Res. Food Sci. 2021, 4, 308–319. [Google Scholar] [CrossRef] [PubMed]
- Vázquez de Frutos, L.; Prados, I.M.; Reglero, G.; Torres, C.F. Identification and quantification of ethyl carbamate occurring in urea complexation processes commonly utilized for polyunsaturated fatty acid concentration. Food Chem. 2017, 229, 28–34. [Google Scholar] [CrossRef]
- Rozema, B.; Mitchell, B.; Winters, D.; Kohn, A.; Sullivan, D.; Meinholz, E. Proposed modifications to AOAC 996.06, optimizing the determination of trans fatty acids: Presentation of data. J. AOAC Int. 2008, 91, 92–97. [Google Scholar] [CrossRef] [PubMed]
- Watanabe, Y.; Sato, S.; Sera, S.; Sato, C.; Yoshinaga, K.; Nagai, T.; Sato, R.; Iwasaka, H.; Aki, T. Enzymatic Analysis of Positional Distribution of Fatty Acids in Solid Fat by 1, 3-Selective Transesterification with Candida antarctica Lipase B. J. Am. Oil Chem. Soc. 2014, 91, 1323–1330. [Google Scholar] [CrossRef]
- ISO 660:2020; Animal and Vegetable Fats and Oils—Determination of Acid Value And acidity. ISO: Geneva, Switzerland, 2020.
- Araújo, M.E.M.B.d.; Campos, P.R.B.; Alberto, T.G.; Contesini, F.J.; Carvalho, P.d.O. Synthesis of structured triacylglycerols enriched in n-3 fatty acids by immobilized microbial lipase. Braz. J. Microbiol. 2016, 47, 1006–1013. [Google Scholar] [CrossRef]
- Martin, D.; Moran-Valero, M.I.; Vázquez, L.; Reglero, G.; Torres, C.F. Comparative in vitro intestinal digestion of 1, 3-diglyceride and 1-monoglyceride rich oils and their mixtures. Food Res. Int. 2014, 64, 603–609. [Google Scholar] [CrossRef]
- Corzo-Martínez, M.; Bañares, C.; Díaz, A.; Vázquez, L.; Reglero, G.; Torres, C.F. In vitro digestibility and bioaccessibility of lipid-based delivery systems obtained via enzymatic glycerolysis: A case study of rosemary extract bioaccessibility. Food Funct. 2020, 11, 813–823. [Google Scholar] [CrossRef] [PubMed]
- Torres, C.F.; Tenllado, D.; Señorans, F.J.; Reglero, G. A versatile GC method for the analysis of alkylglycerols and other neutral lipid classes. Chromatographia 2009, 69, 729–734. [Google Scholar] [CrossRef]
- Dhasco and Arasco Oils as Sources of Long-Chain Polyunsaturated Fatty Acids in Infant Formula: A Safety Assesment; Food Standards Australia New Zealand: Canberra, Australia; Wellington, New Zealand, 2003.
- He, Y.; Qiu, C.; Guo, Z.; Huang, J.; Wang, M.; Chen, B. Production of new human milk fat substitutes by enzymatic acidolysis of microalgae oils from Nannochloropsis oculata and Isochrysis galbana. Bioresour. Technol. 2017, 238, 129–138. [Google Scholar] [CrossRef]
- Zou, X.; Ye, L.; He, X.; Wu, S.; Zhang, H.; Jin, Q. Preparation of DHA-rich medium-and long-chain triacylglycerols by lipase-catalyzed acidolysis of microbial oil from Schizochytrium sp. with medium-chain fatty acids. Appl. Biochem. Biotechnol. 2020, 191, 1294–1314. [Google Scholar] [CrossRef]
- Wang, J.; Wang, X.-D.; Zhao, X.-Y.; Liu, X.; Dong, T.; Wu, F.-A. From microalgae oil to produce novel structured triacylglycerols enriched with unsaturated fatty acids. Bioresour. Technol. 2015, 184, 405–414. [Google Scholar] [CrossRef] [PubMed]
- Watanabe, Y.; Nagao, T.; Shimada, Y. Control of the regiospecificity of Candida antarctica lipase by polarity. New Biotechnol. 2009, 26, 23–28. [Google Scholar] [CrossRef] [PubMed]
- Simões, T.; Valero, F.; Tecelão, C.; Ferreira-Dias, S. Production of human milk fat substitutes catalyzed by a heterologous Rhizopus oryzae lipase and commercial lipases. J. Am. Oil Chem. Soc. 2014, 91, 411–419. [Google Scholar] [CrossRef]
- McClements, D.J.; Decker, E.A.; Park, Y. Controlling lipid bioavailability through physicochemical and structural approaches. Crit. Rev. Food Sci. Nutr. 2008, 49, 48–67. [Google Scholar] [CrossRef] [PubMed]
- McClements, D.J.; Li, Y. Review of in vitro digestion models for rapid screening of emulsion-based systems. Food Funct. 2010, 1, 32–59. [Google Scholar] [CrossRef]
 ) 1:1; (
 ) 1:3; (
 ) 1:6.
) 1:1; () 1:3; () 1:6.
) 1:6.
) 1:1; () 1:3; () 1:6.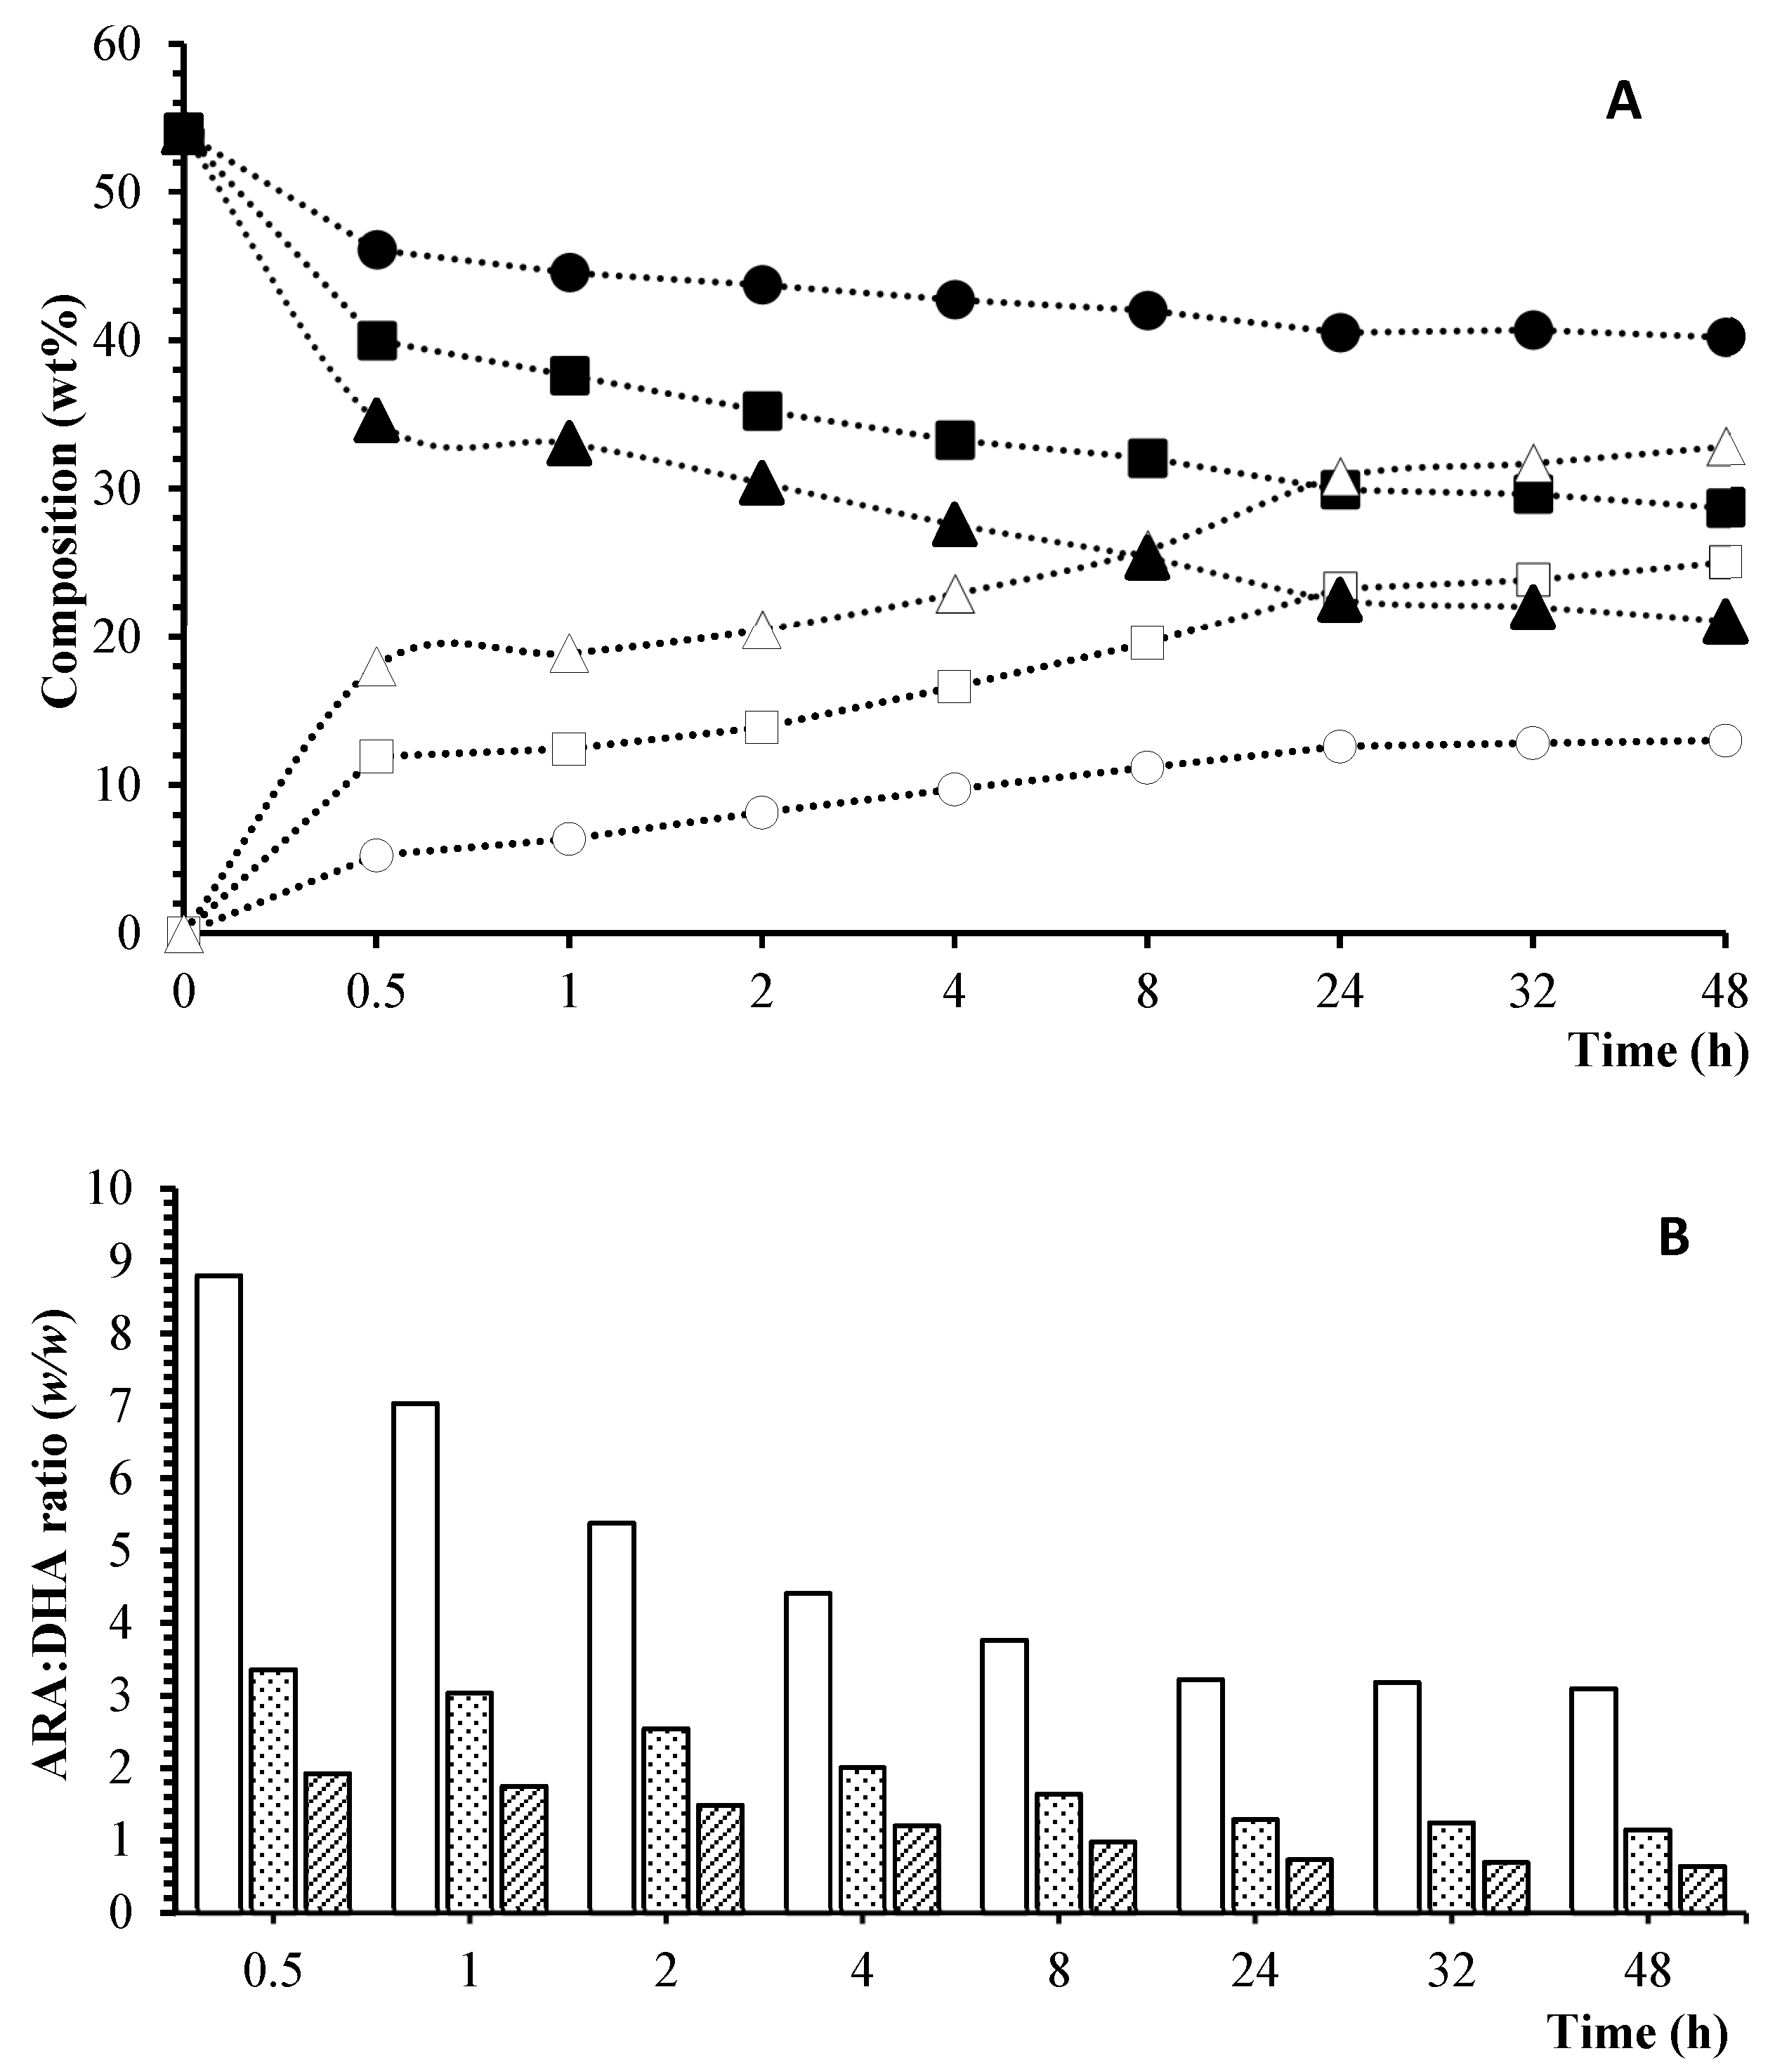
 ) CA; (
 ) TL; (
 ) RM.
) CA; () TL; () RM.
) RM.
) CA; () TL; () RM.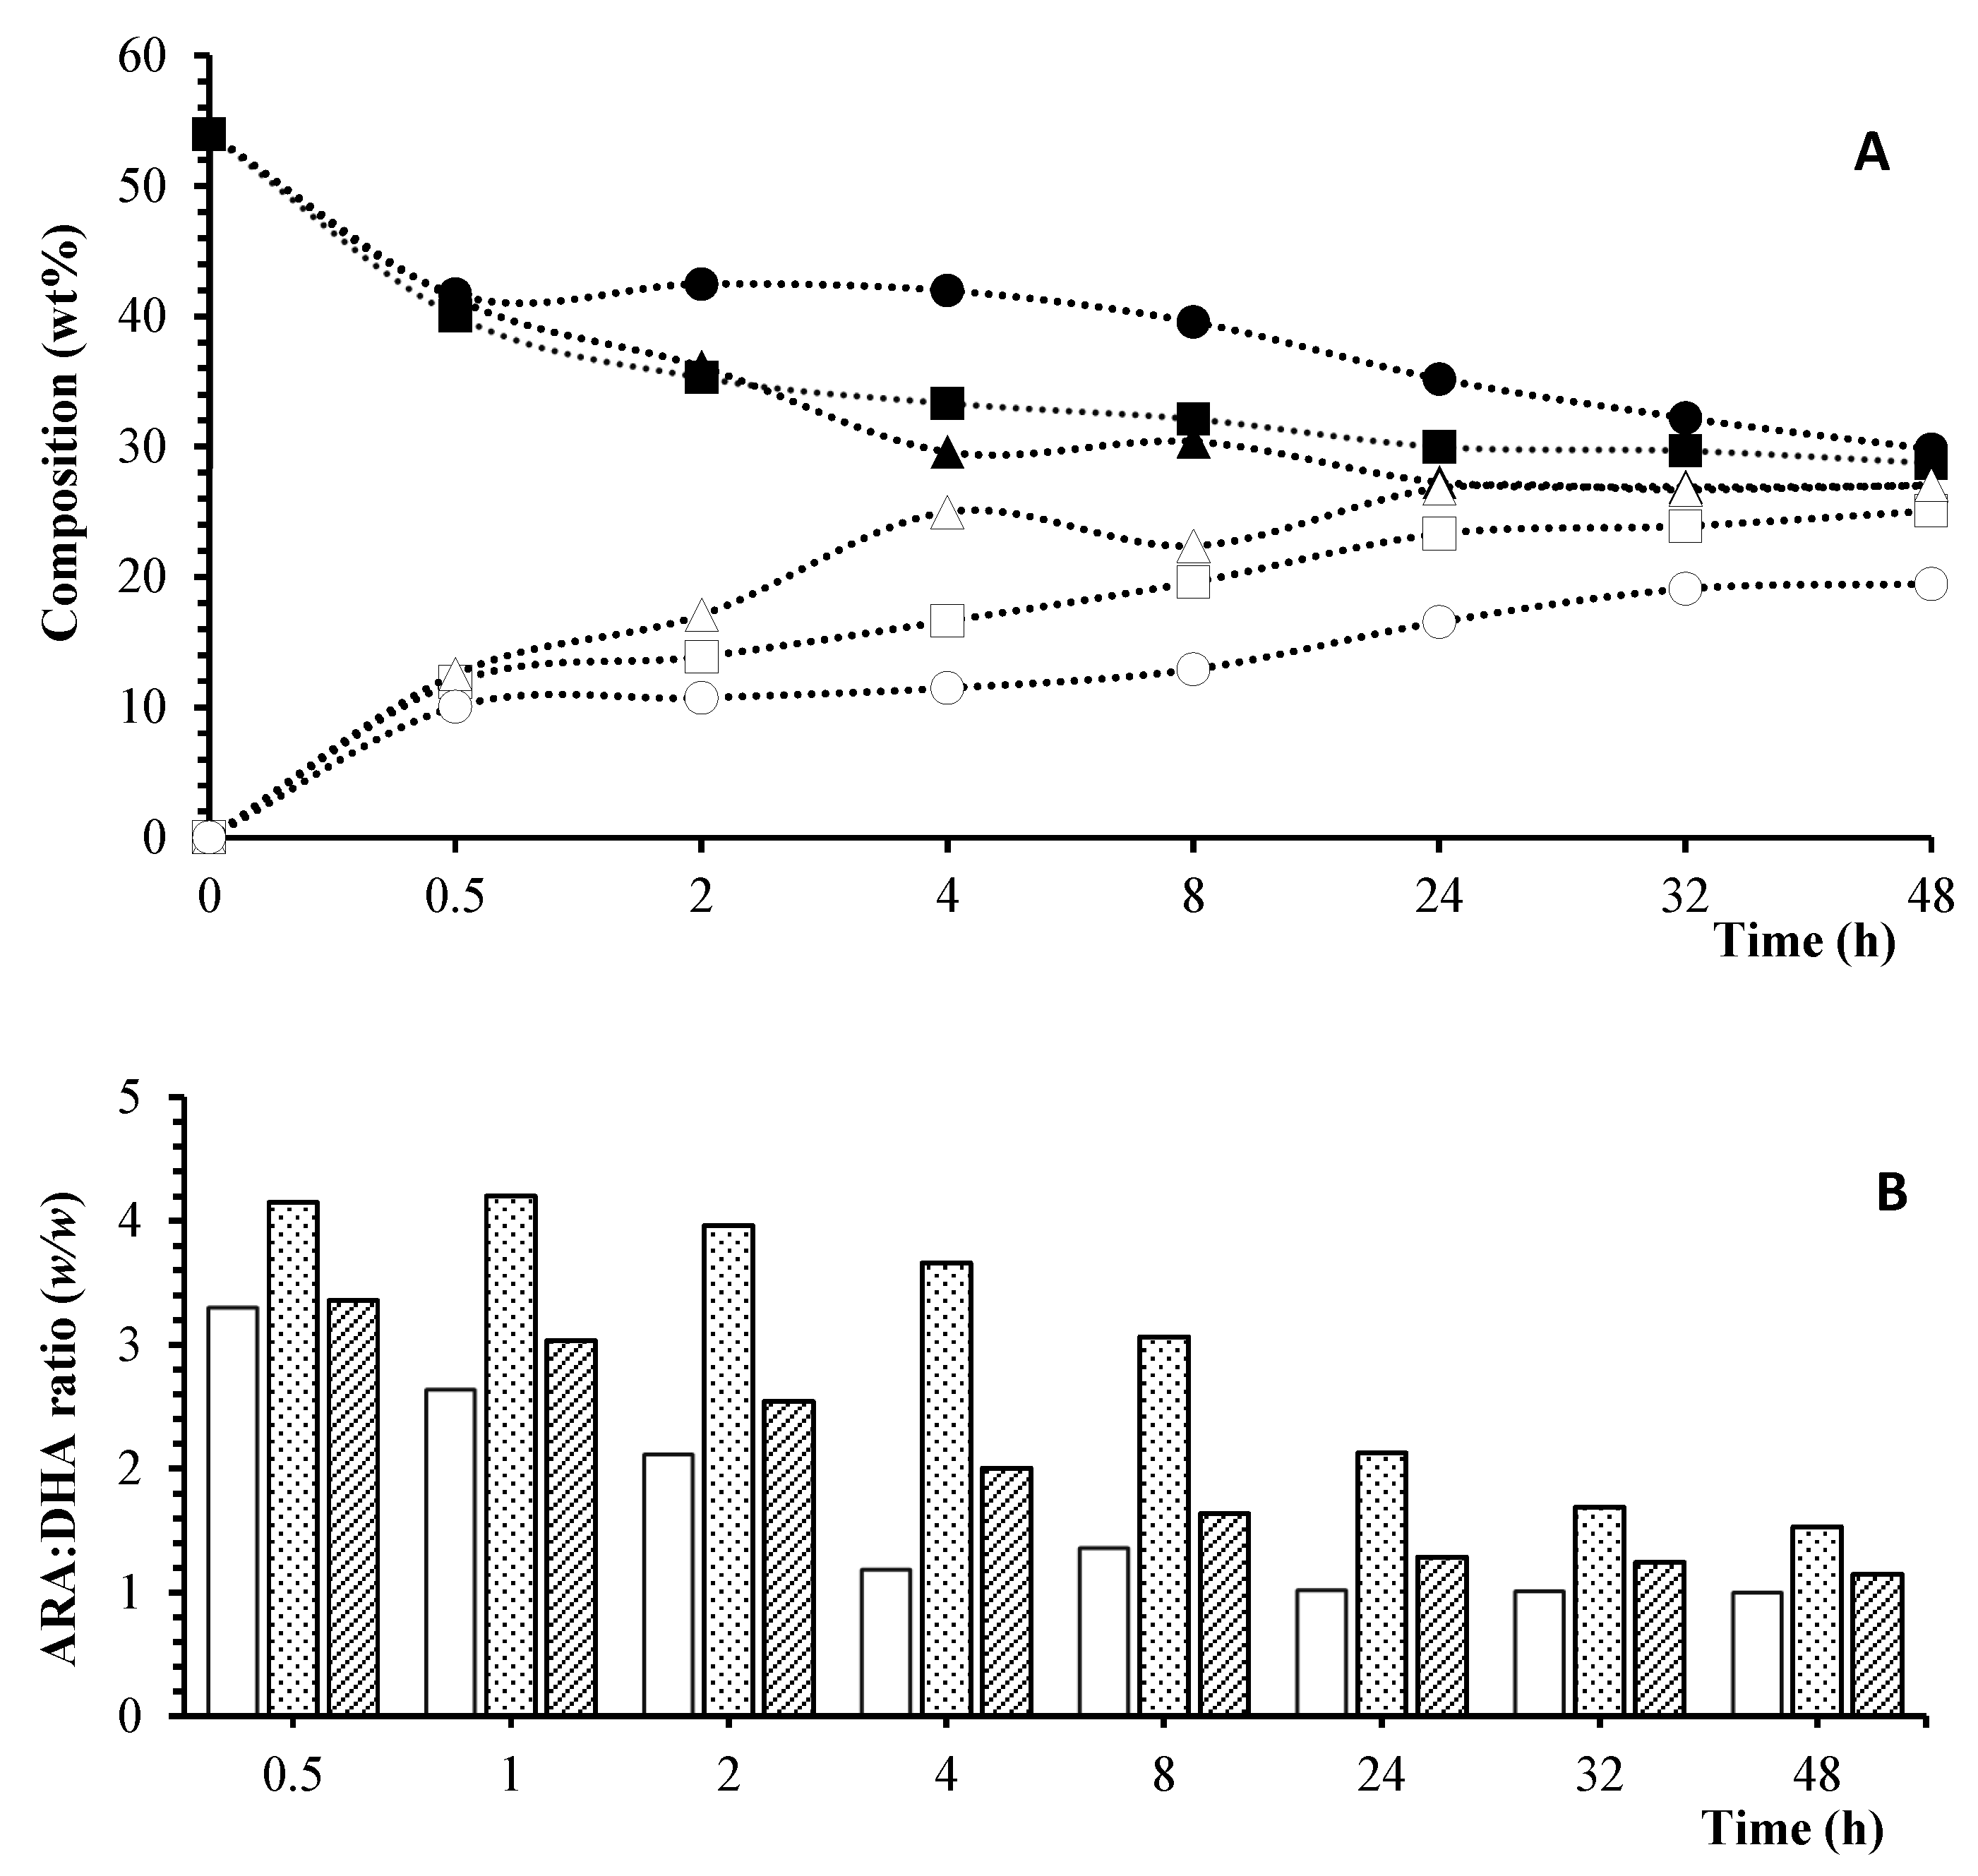
 FFA,
FFA,  MAG,
MAG,  cholesterol,
  DAG,
DAG,  TAG.
FFA, MAG, cholesterol, DAG, TAG.
TAG.
FFA, MAG, cholesterol, DAG, TAG.
 FFA: free fatty acid,
  MAG: monoacylglycerol,
  Cholesterol,
  DAG: diacylglycerol,
  TAG: triacylglycerol.
  OP: oil phase,
  MP: micellar phase,
  PP: precipitate phase.
FFA: free fatty acid, MAG: monoacylglycerol, Cholesterol, DAG: diacylglycerol, TAG: triacylglycerol. OP: oil phase, MP: micellar phase, PP: precipitate phase.
PP: precipitate phase.
FFA: free fatty acid, MAG: monoacylglycerol, Cholesterol, DAG: diacylglycerol, TAG: triacylglycerol. OP: oil phase, MP: micellar phase, PP: precipitate phase.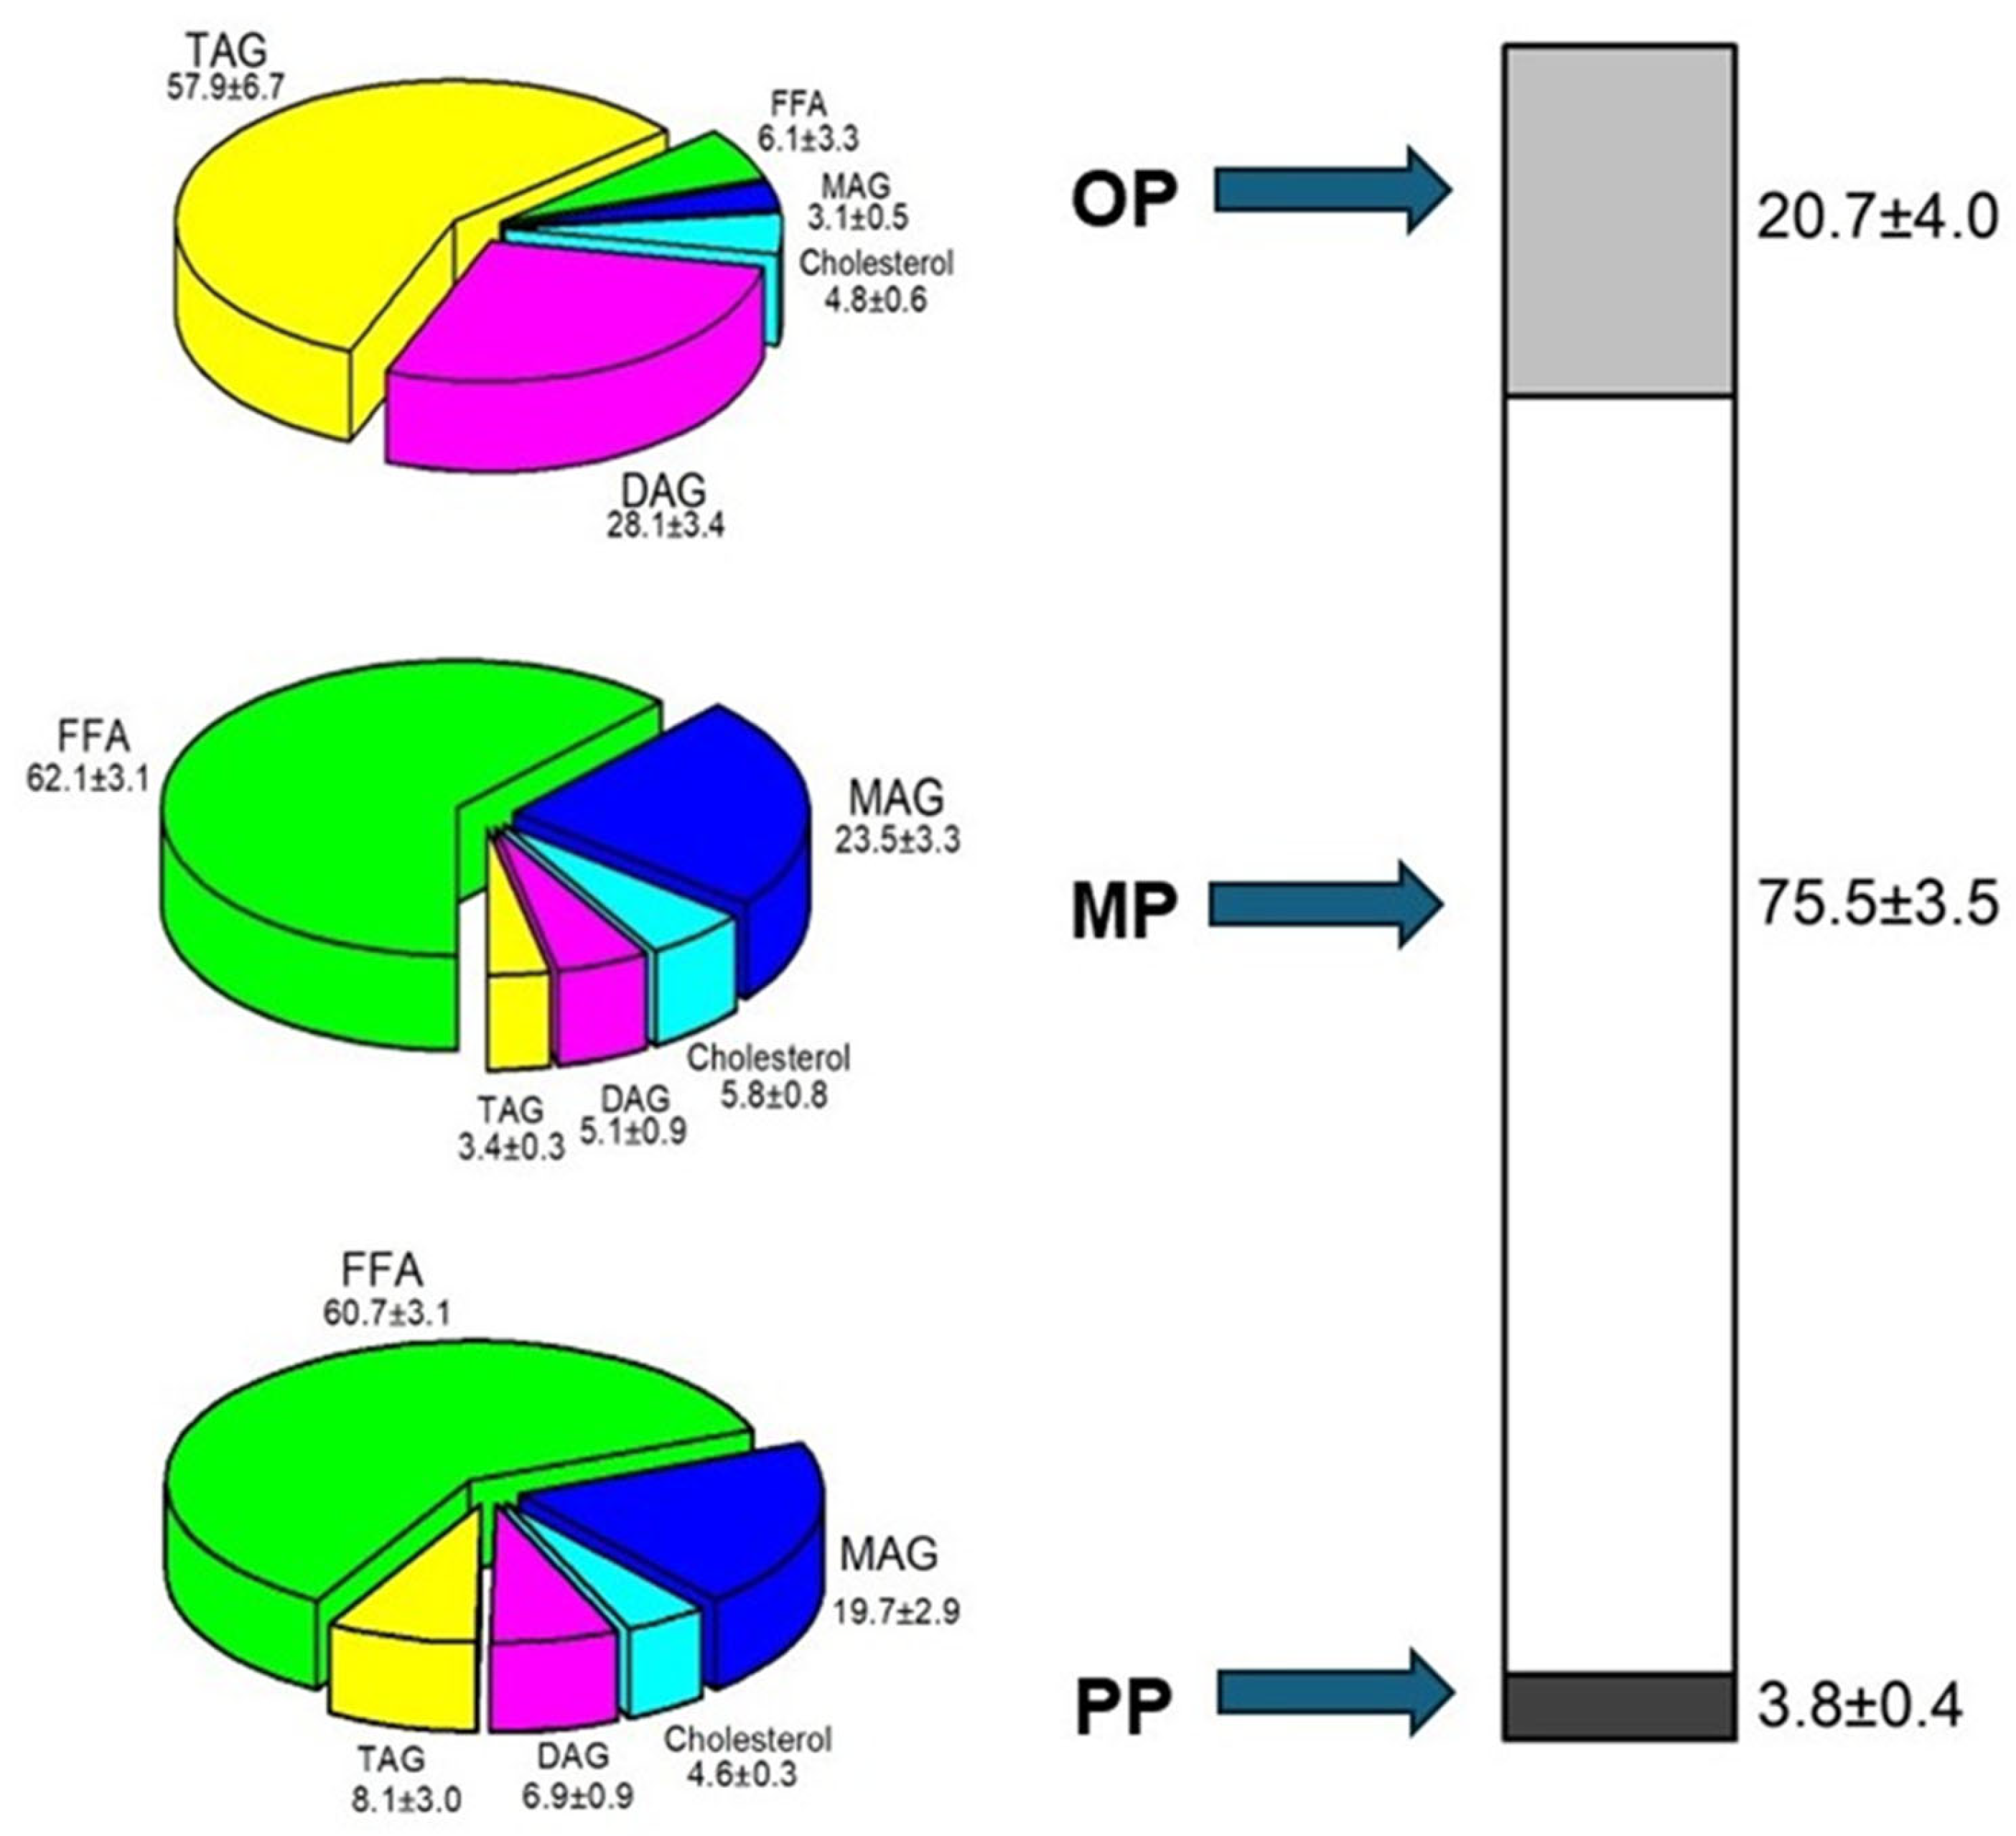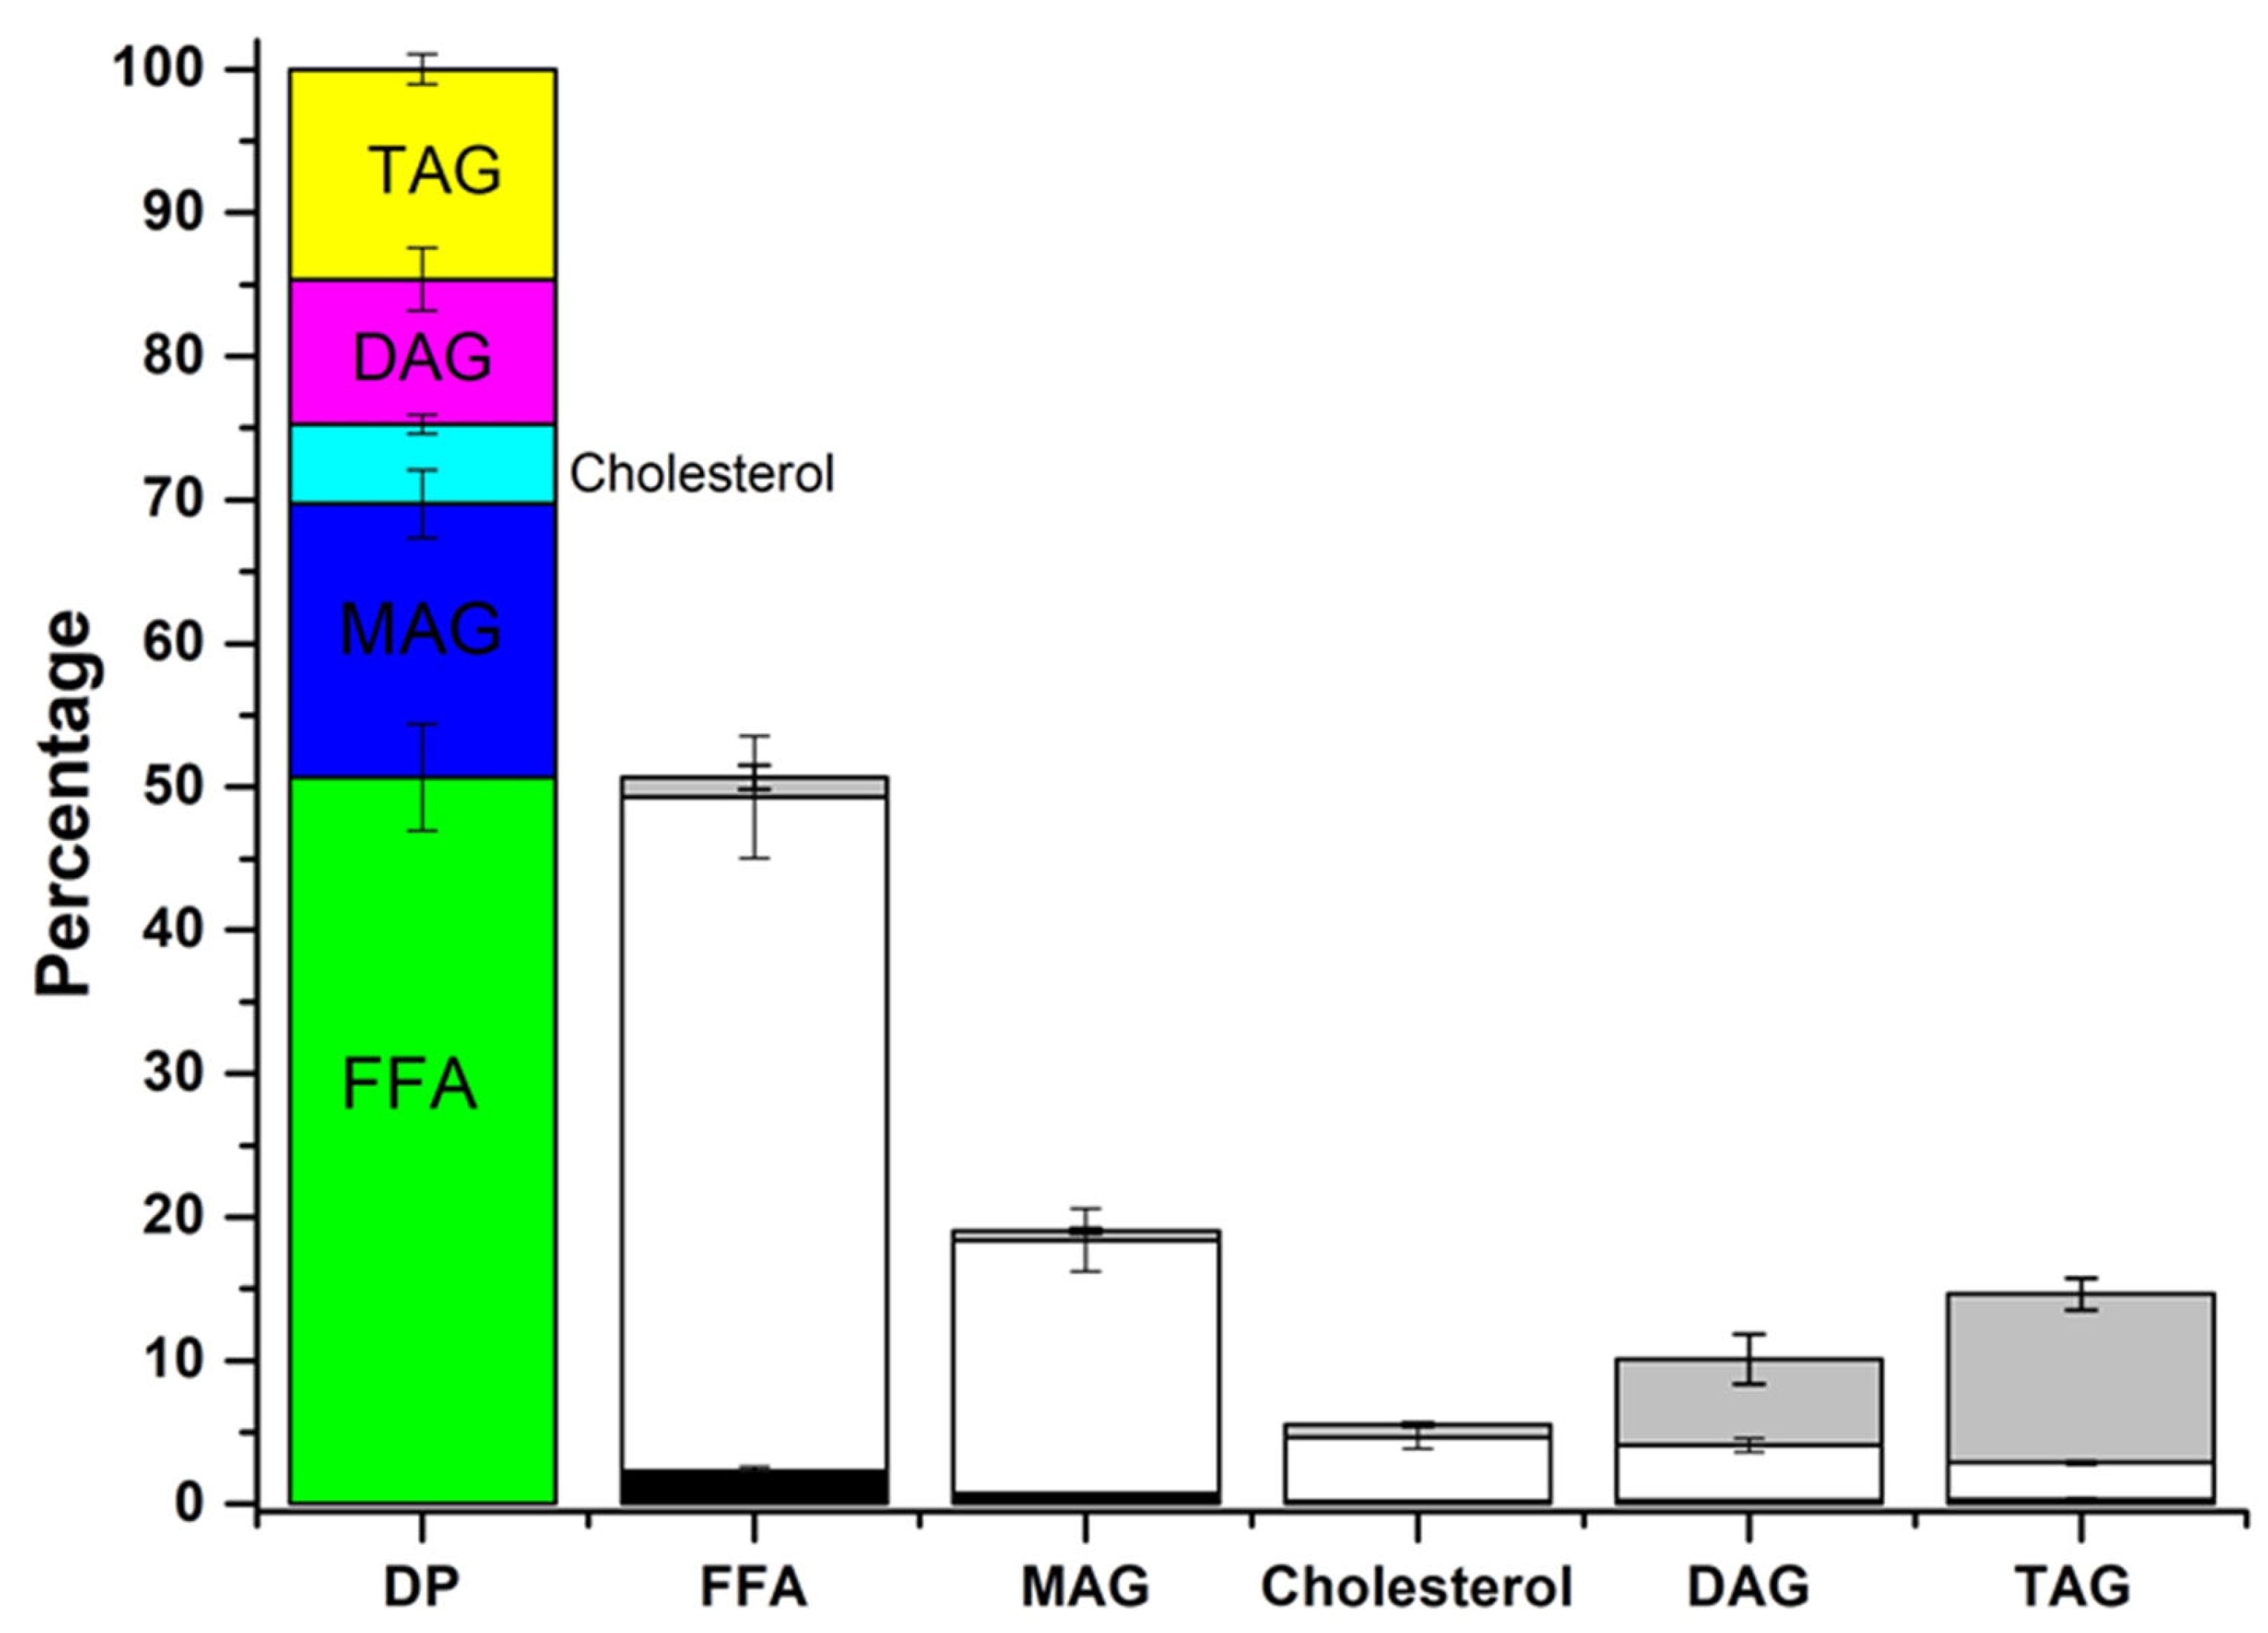

| Fatty Acid (wt%) | ARA-Oil | DHA-Oil | Blending | Formulaid™ | ||||||||
|---|---|---|---|---|---|---|---|---|---|---|---|---|
| Total | sn-2 | sn-1,3 | Total | sn-2 | sn-1,3 | Total | sn-2 | sn-1,3 | Total | sn-2 | sn-1,3 | |
| Myristic | 0.3 | 0.3 | 0.3 | 0.8 | 0.5 | 1.0 | 0.5 | 0.1 | 0.0 | 4.6 | 0.9 | 6.5 |
| Palmitic | 6.9 | 1.2 | 9.8 | 18.4 | 5.0 | 25.1 | 10.6 | 3.4 | 14.2 | 10.1 | 1.4 | 14.5 |
| Palmitoleic | 0.3 | 0.4 | 0.2 | 0.5 | 0.3 | 0.7 | 0.4 | 0.4 | 0.4 | 1.0 | 0.7 | 1.2 |
| Margaric | 0.5 | 0.1 | 0.7 | 0.2 | 0.1 | 0.2 | 0.4 | 0.4 | 0.5 | 0.2 | 0.2 | 0.3 |
| Stearic | 10.8 | 1.5 | 15.5 | 1.5 | 0.6 | 1.9 | 7.7 | 1.7 | 10.7 | 5.7 | 0.6 | 8.2 |
| Oleic | 8.6 | 15.2 | 5.2 | 6.9 | 7.3 | 6.7 | 7.7 | 19.4 | 1.9 | 20.5 | 29.8 | 15.9 |
| Linoleic | 6.1 | 14.8 | 1.8 | 0.9 | 1.2 | 0.8 | 4.4 | 10.2 | 1.5 | 5.3 | 11.1 | 2.4 |
| γ-Linolenic | 2.8 | 5.2 | 1.5 | 0.3 | 0.2 | 0.4 | 2.8 | 3.5 | 2.5 | 2.5 | 2.8 | 2.4 |
| α-Linolenic | 1.9 | 1.1 | 2.3 | 0.2 | 0.2 | 0.2 | 0.4 | 0.7 | 0.3 | 0.3 | 0.2 | 0.3 |
| Eicosenoic | 0.7 | 0.1 | 1.0 | 0.3 | 0.1 | 0.6 | 0.5 | 0.4 | 0.5 | 0.0 | 0.0 | 0.0 |
| Behenic | 4.6 | 5.2 | 4.2 | 1.2 | 0.5 | 1.6 | 3.3 | 2.8 | 3.6 | 3.2 | 3.5 | 3 |
| ARA | 54.0 | 54.0 | 54.0 | 0.1 | 0.6 | 0.0 | 35.4 | 30.9 | 37.6 | 27.3 | 22.5 | 29.7 |
| Erucic | 0.0 | 0.0 | 0.0 | 0.8 | 0.6 | 1.0 | 0.7 | 0.3 | 0.9 | 0.0 | 0.0 | 0.0 |
| Eicosapentaenoic | 0.0 | 0.0 | 0.0 | 0.7 | 0.4 | 0.9 | 0.4 | 0.2 | 0.6 | 0.7 | 0.0 | 1.0 |
| Lignoceric | 1.9 | 0.2 | 2.8 | 0.3 | 0.2 | 0.4 | 1.4 | 0.1 | 2.1 | 0.0 | 0.0 | 0.0 |
| Nervonic | 0.0 | 0.0 | 0.0 | 11.6 | 15.6 | 9.6 | 3.9 | 4.6 | 3.5 | 0.0 | 0.0 | 0.0 |
| DHA | 0.0 | 0.0 | 0.0 | 54.3 | 66.4 | 48.3 | 18.6 | 19.9 | 17.9 | 15.5 | 25.1 | 10.7 |
| ARA:DHA (w/w) | 1.9 | 1.6 | 2.1 | 1.8 | 0.9 | 2.8 | ||||||
| Fatty Acid (wt%) | RM Lipase—8 h | CA Lipase—4 h | ||||
|---|---|---|---|---|---|---|
| Total | sn-2 | sn-1,3 | Total | sn-2 | sn-1,3 | |
| Myristic | 0.6 | 0.3 | 0.7 | 0.5 | 0.4 | 0.6 |
| Palmitic | 13.0 | 4.2 | 17.4 | 11.1 | 4.2 | 14.5 |
| Palmitoleic | 0.5 | 0.4 | 0.5 | 0.4 | 0.4 | 0.4 |
| Margaric | 0.5 | 0.2 | 0.5 | 0.4 | 0.2 | 0.6 |
| Stearic | 6.3 | 2.1 | 8.4 | 7.1 | 1.7 | 9.8 |
| Oleic | 8.7 | 16.1 | 5.1 | 7.4 | 11.7 | 5.3 |
| Linoleic | 4.9 | 10.1 | 2.3 | 4.4 | 10.7 | 1.2 |
| γ-Linolenic | 3.0 | 4.3 | 2.3 | 2.8 | 3.7 | 2.3 |
| α-Linolenic | 0.8 | 0.9 | 0.8 | 0.9 | 0.9 | 0.9 |
| Eicosenoic | 0.3 | 0.6 | 0.2 | 0.4 | 0.4 | 0.3 |
| Behenic | 3.1 | 4.1 | 2.5 | 3.0 | 4.1 | 2.4 |
| ARA | 33.9 | 41.7 | 29.9 | 35.6 | 39.1 | 33.9 |
| Erucic | 1.1 | 0.4 | 1.5 | 1.3 | 0.4 | 1.8 |
| Eicosapentaenoic | 0.5 | 0.2 | 0.6 | 0.4 | 0.3 | 0.5 |
| Lignoceric | 1.1 | 0.4 | 1.5 | 1.3 | 0.4 | 1.8 |
| Nervonic | 3.8 | 2.4 | 4.4 | 4.1 | 3.9 | 4.2 |
| DHA | 17.3 | 11.0 | 20.5 | 18.7 | 16.9 | 19.6 |
| ARA:DHA (w/w) | 2.0 | 3.8 | 1.5 | 1.9 | 2.3 | 1.7 |
| Fatty Acid (wt%) | Scale-Up Processes | ||
|---|---|---|---|
| Total | sn-2 | sn-1,3 | |
| Myristic | 0.5 ± 0.0 | 0.4 ± 0.1 | 0.6 ± 0.0 |
| Palmitic | 9.3 ± 2.0 | 4.6 ± 0.2 | 13.4 ± 0.1 |
| Palmitoleic | 0.4 ± 0.0 | 0.4 ± 0.0 | 0.4 ± 0.0 |
| Margaric | 0.4 ± 0.0 | 0.1 ± 0.0 | 0.5 ± 0.0 |
| Stearic | 7.7 ± 0.6 | 2.0 ± 0.2 | 9.6 ± 0.4 |
| Oleic | 7.5 ± 0.0 | 11.7 ± 0.0 | 5.5 ± 0.1 |
| Linoleic | 4.6 ± 0.2 | 10.6 ± 0.1 | 1.3 ± 0.1 |
| γ-Linolenic | 2.7 ± 0.1 | 3.7 ± 0.0 | 2.2 ± 0.1 |
| α-Linolenic | 0.8 ± 0.0 | 0.9 ± 0.0 | 0.8 ± 0.0 |
| Eicosenoic | 0.3 ± 0.0 | 0.4 ± 0.0 | 0.3 ± 0.0 |
| Behenic | 3.4 ± 0.2 | 4.1 ± 0.0 | 2.7 ± 0.0 |
| ARA | 38.8 ± 2.4 | 39.3 ± 0.6 | 34.4 ± 1.1 |
| Erucic | 0.9 ± 0.0 | 0.6 ± 0.0 | 1.1 ± 0.0 |
| Eicosapentaenoic | 0.4 ± 0.0 | 0.2 ± 0.0 | 0.5 ± 0.0 |
| Lignoceric | 1.3 ± 0.0 | 0.3 ± 0.0 | 1.8 ± 0.0 |
| Nervonic | 3.5 ± 0.4 | 3.6 ± 0.2 | 4.1 ± 0.3 |
| DHA | 16.4 ± 2.3 | 16.5 ± 0.7 | 20.0 ± 1.4 |
| ARA:DHA (w/w) | 2.3 | 2.4 | 1.7 |
Disclaimer/Publisher’s Note: The statements, opinions and data contained in all publications are solely those of the individual author(s) and contributor(s) and not of MDPI and/or the editor(s). MDPI and/or the editor(s) disclaim responsibility for any injury to people or property resulting from any ideas, methods, instructions or products referred to in the content. |
© 2024 by the authors. Licensee MDPI, Basel, Switzerland. This article is an open access article distributed under the terms and conditions of the Creative Commons Attribution (CC BY) license (https://creativecommons.org/licenses/by/4.0/).
Share and Cite
Vázquez, L.; Pardo de Donlebún, B.; Gutiérrez-Guibelalde, A.; Chabni, A.; Torres, C.F. Structured Triacylglycerol with Optimal Arachidonic Acid and Docosahexaenoic Acid Content for Infant Formula Development: A Bio-Accessibility Study. Foods 2024, 13, 2797. https://doi.org/10.3390/foods13172797
Vázquez L, Pardo de Donlebún B, Gutiérrez-Guibelalde A, Chabni A, Torres CF. Structured Triacylglycerol with Optimal Arachidonic Acid and Docosahexaenoic Acid Content for Infant Formula Development: A Bio-Accessibility Study. Foods. 2024; 13(17):2797. https://doi.org/10.3390/foods13172797
Chicago/Turabian StyleVázquez, Luis, Blanca Pardo de Donlebún, Alejandra Gutiérrez-Guibelalde, Assamae Chabni, and Carlos F. Torres. 2024. "Structured Triacylglycerol with Optimal Arachidonic Acid and Docosahexaenoic Acid Content for Infant Formula Development: A Bio-Accessibility Study" Foods 13, no. 17: 2797. https://doi.org/10.3390/foods13172797