
The Effects of Single- or Mixed-Strain Fermentation of Red Bean Sourdough, with or without Wheat Bran, on Bread Making Performance and Its Potential Health Benefits in Mice Model

 ,
,  ,
, 
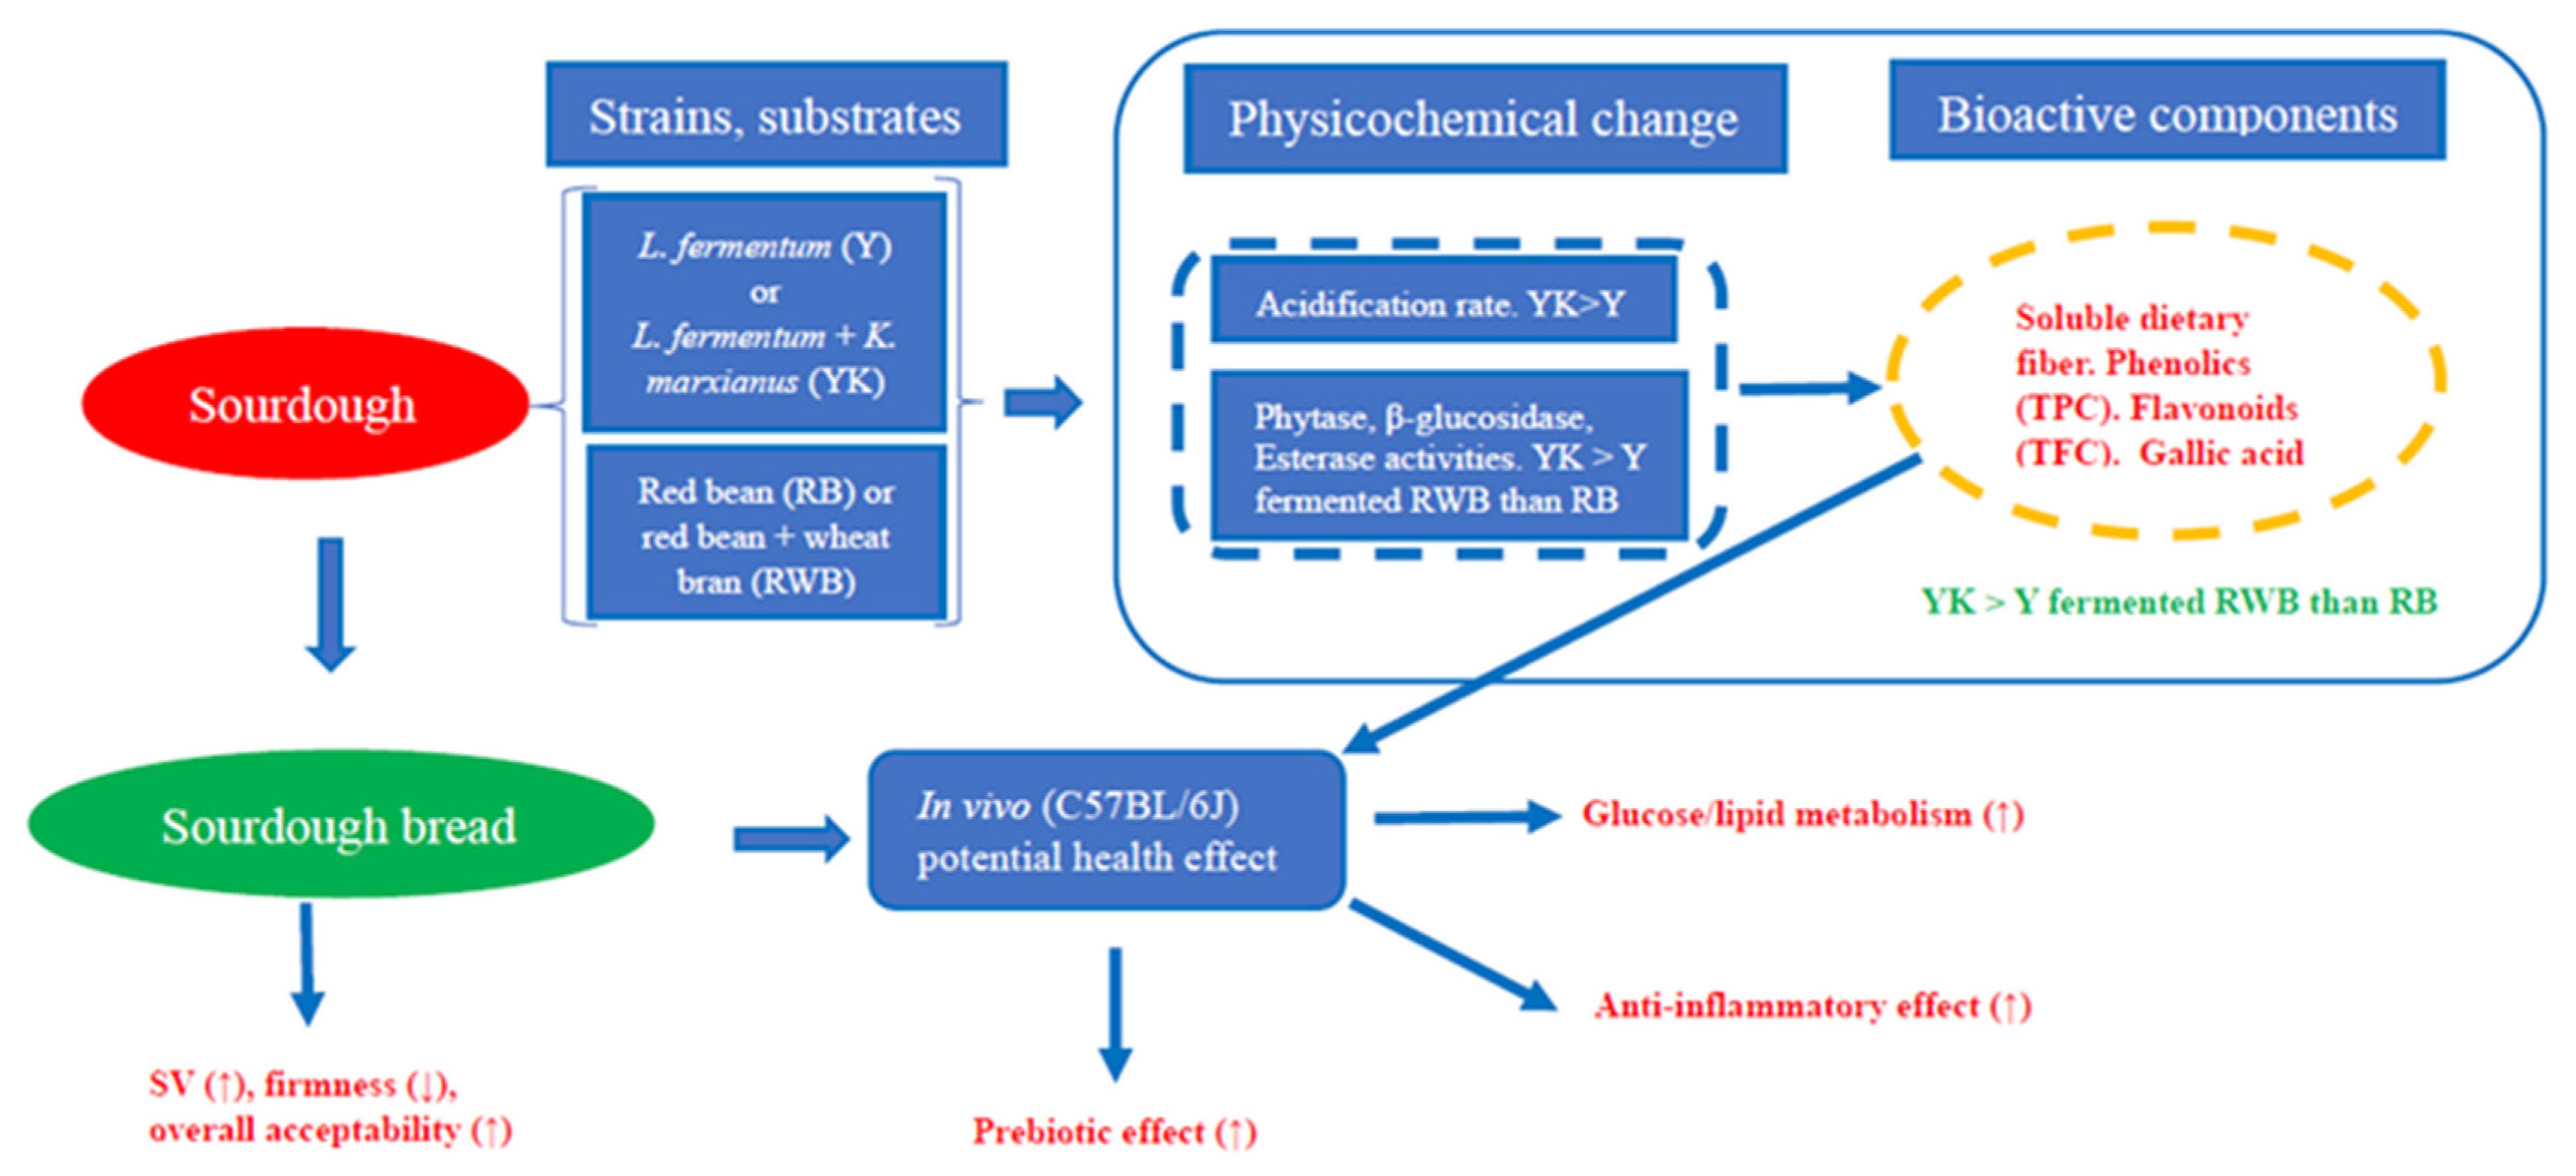
Abstract
:1. Introduction
2. Materials and Methods
2.1. Materials
2.2. Sourdough Preparation of Red Bean Supplemented with Wheat Bran via Either Single or Mixed-Strains Fermentation
2.2.1. Preparation of LAB and Yeast Inoculum
2.2.2. Single- and Mixed-Strains Sourdough Fermentation
2.3. Physicochemical Analysis of Single- and Mixed-Fermented Sourdough of Red Bean Following Wheat Bran Supplementation
2.3.1. pH and Total Titratable Acidity (TTA) of Sourdough Following Different Fermentation
2.3.2. Trypsin Inhibitor Activity (TIA), Phytic Acid (PA), and Condensed Tannin Content
2.3.3. Total Phenolic, Total Flavonoid Content, and Phenolic Acid Composition of Sourdough Following Different Fermentation
2.3.4. Dietary Fiber Composition of Sourdough Following Different Fermentation
2.4. Changes in β-Glucosidase, Phytase, and Feruloyl Esterase Enzyme Activities during Sourdough Fermentation
2.5. Sourdough Bread Preparation Following Either Single- or Mixed-Strains Fermentation
2.6. Physicochemical Analysis of Sourdough Bread Prepared with Either Single- or Mixed-Strains Fermentation
2.6.1. Specific Volume
2.6.2. Textural Profile Analysis
2.6.3. Sensory Evaluation
2.7. Customized Bread Diets and Animal Study Design
2.7.1. Preparation of Customized Bread Diet
2.7.2. Animal Experimental Design
2.8. Potential Health Benefits of Intake of the Customized Bread Diets on Mice
2.8.1. Anti-Inflammatory Effect Based on Pro-Inflammatory Content in Mice
2.8.2. Serum Lipid Profile in Mice
2.8.3. Oral Glucose Tolerance Test (OGTT)
2.8.4. Insulin Resistance (HOMA-IR) Analysis
2.9. Gut Microbiota Composition
2.10. Short-Chain Fatty Acid (SCFA) Content in Feces of Mice
2.11. Statistical Analysis
3. Results and Discussion
3.1. Physicochemical Characteristics of Sourdough via Either Single- or Mixed-Strains Fermentation with Supplementation of Wheat Bran
3.1.1. Impact of Single- or Mixed-Strains Fermentation on the Changes in pH and TTA of Sourdough
3.1.2. Impact of Single- or Mixed-Strains Fermentation on the Changes in the Anti-Nutritional Factors (ANFs) Content of Sourdough
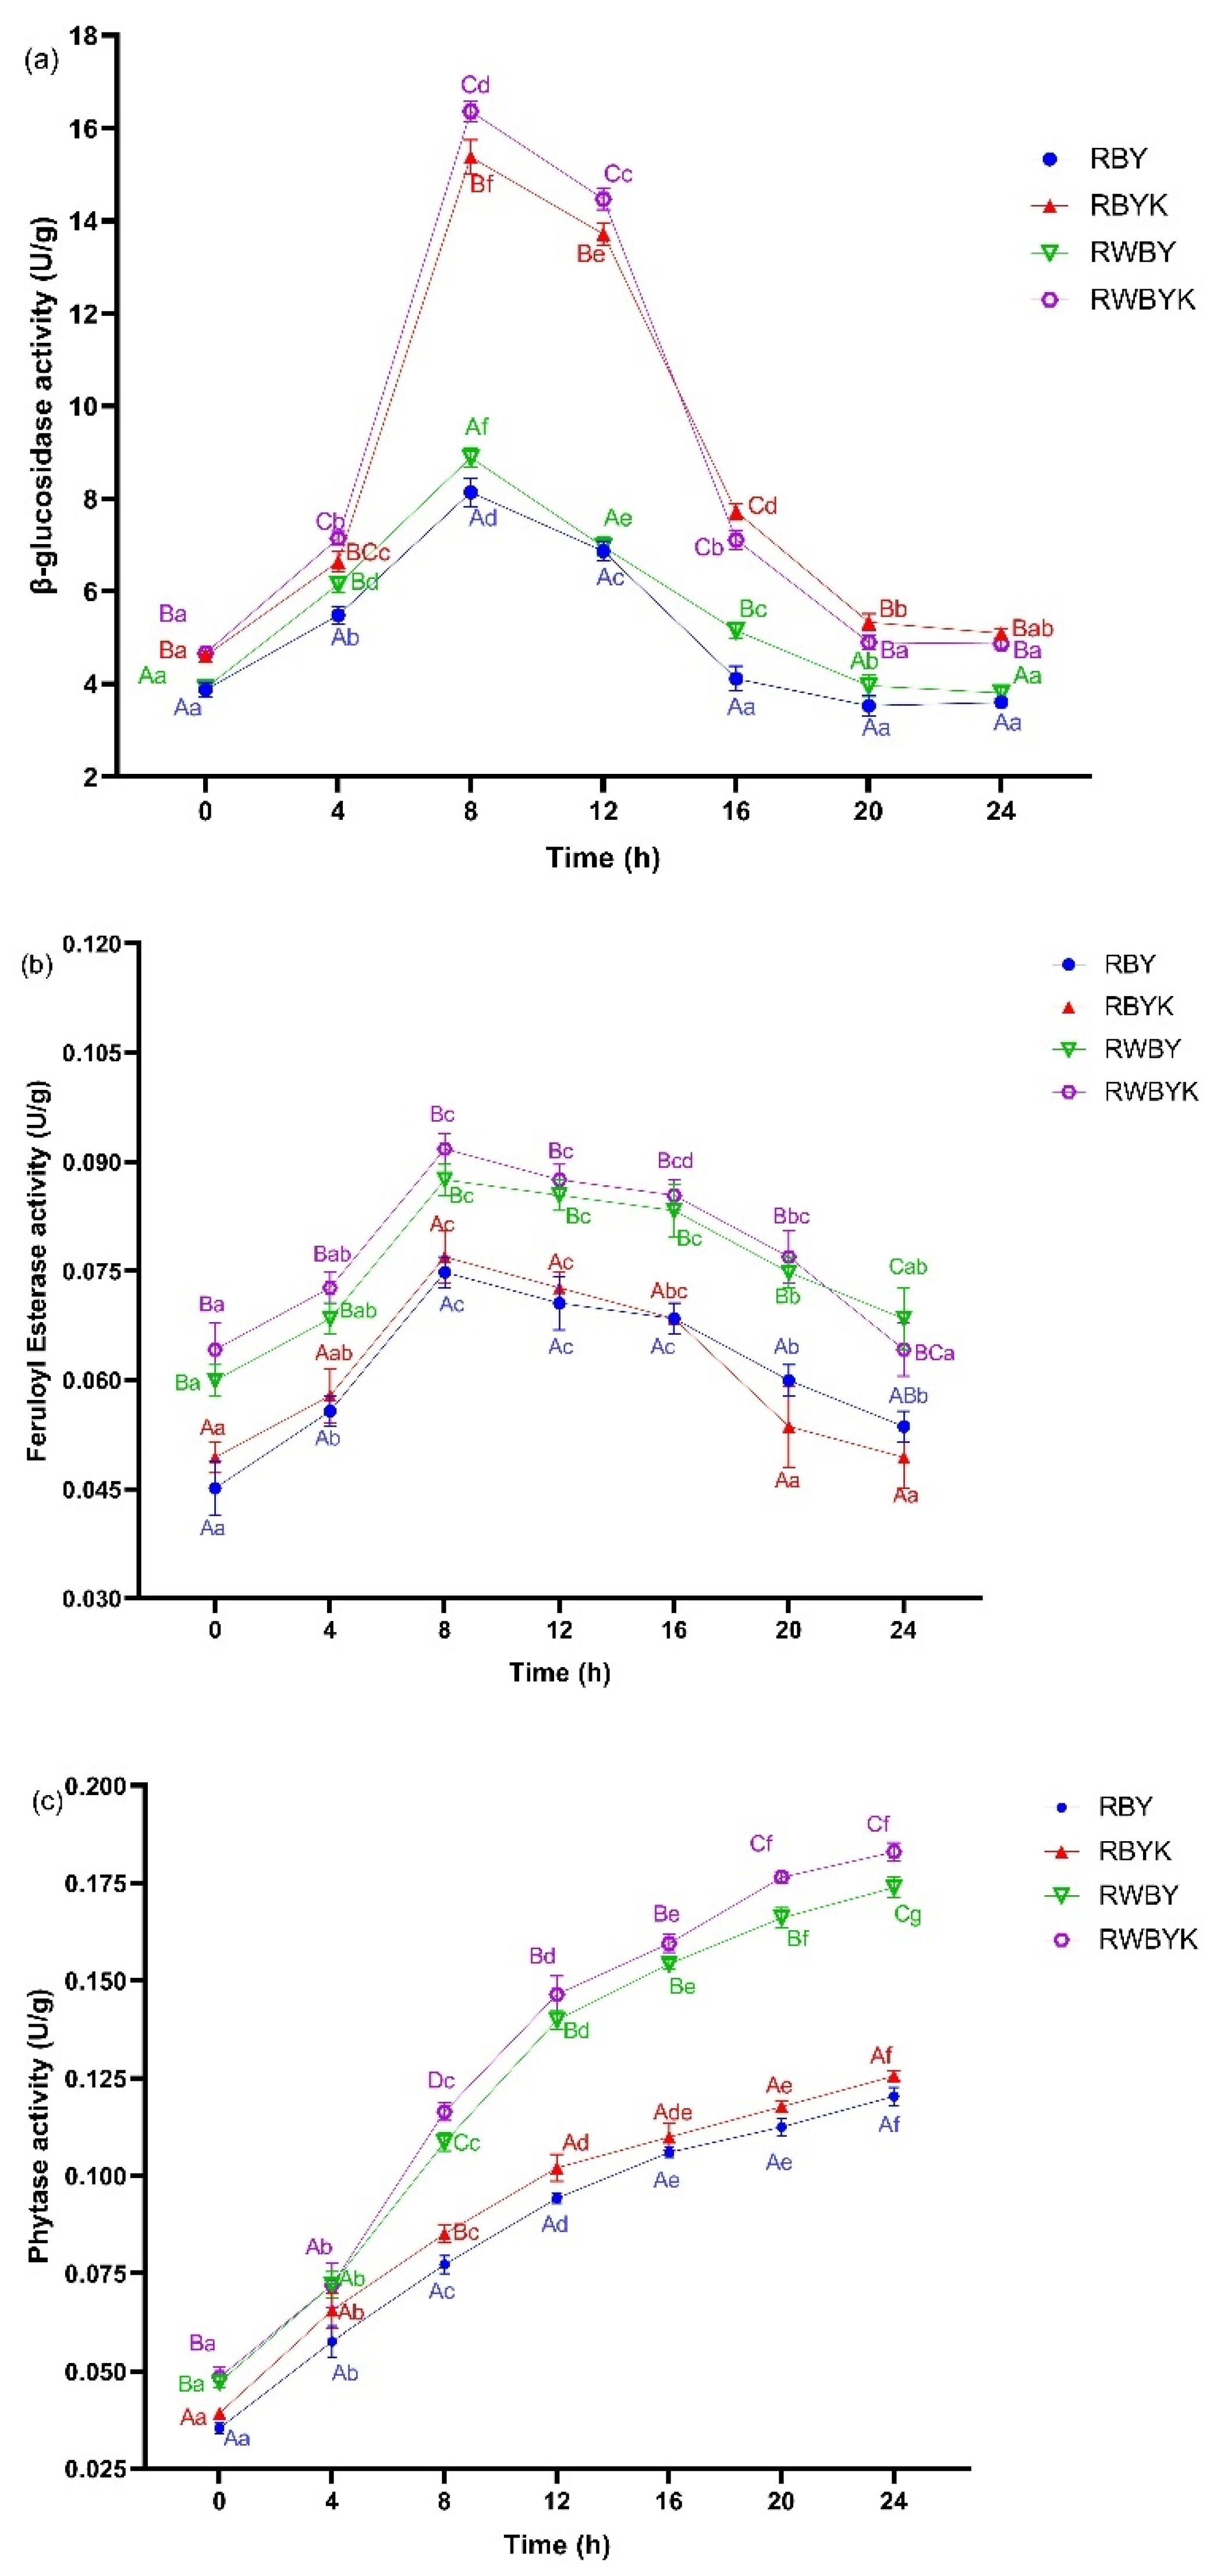
3.1.3. Impact of Single- or Mixed-Strains Fermentation on the Changes in Key Enzymatic Activities during Sourdough Fermentation
3.2. Bioactive Content of Single- or Mixed-Strains-Fermented Red Bean Supplemented with Wheat Bran Sourdough
3.3. Baking Characteristics of Bread Prepared with Single- or Mixed-Strain-Fermented Red Bean Supplemented with Wheat Bran Sourdough
3.3.1. Specific Volume and Textural Profile Characteristics of Bread
3.3.2. Sensory Evaluation of Bread
3.4. Effect of Intake of Customized Sourdough Bread Diets on Biochemical Parameters of Serum Samples of Different Mice Groups
3.4.1. Oral Glucose Tolerance Test (OGTT) and Homeostasis Model Assessment-Insulin Resistance (HOMA-IR) of Mice
3.4.2. Lipid Profile in Serum of Mice among Different Groups
3.4.3. Pro-Inflammatory Cytokine Content in Serum of Mice among Different Groups
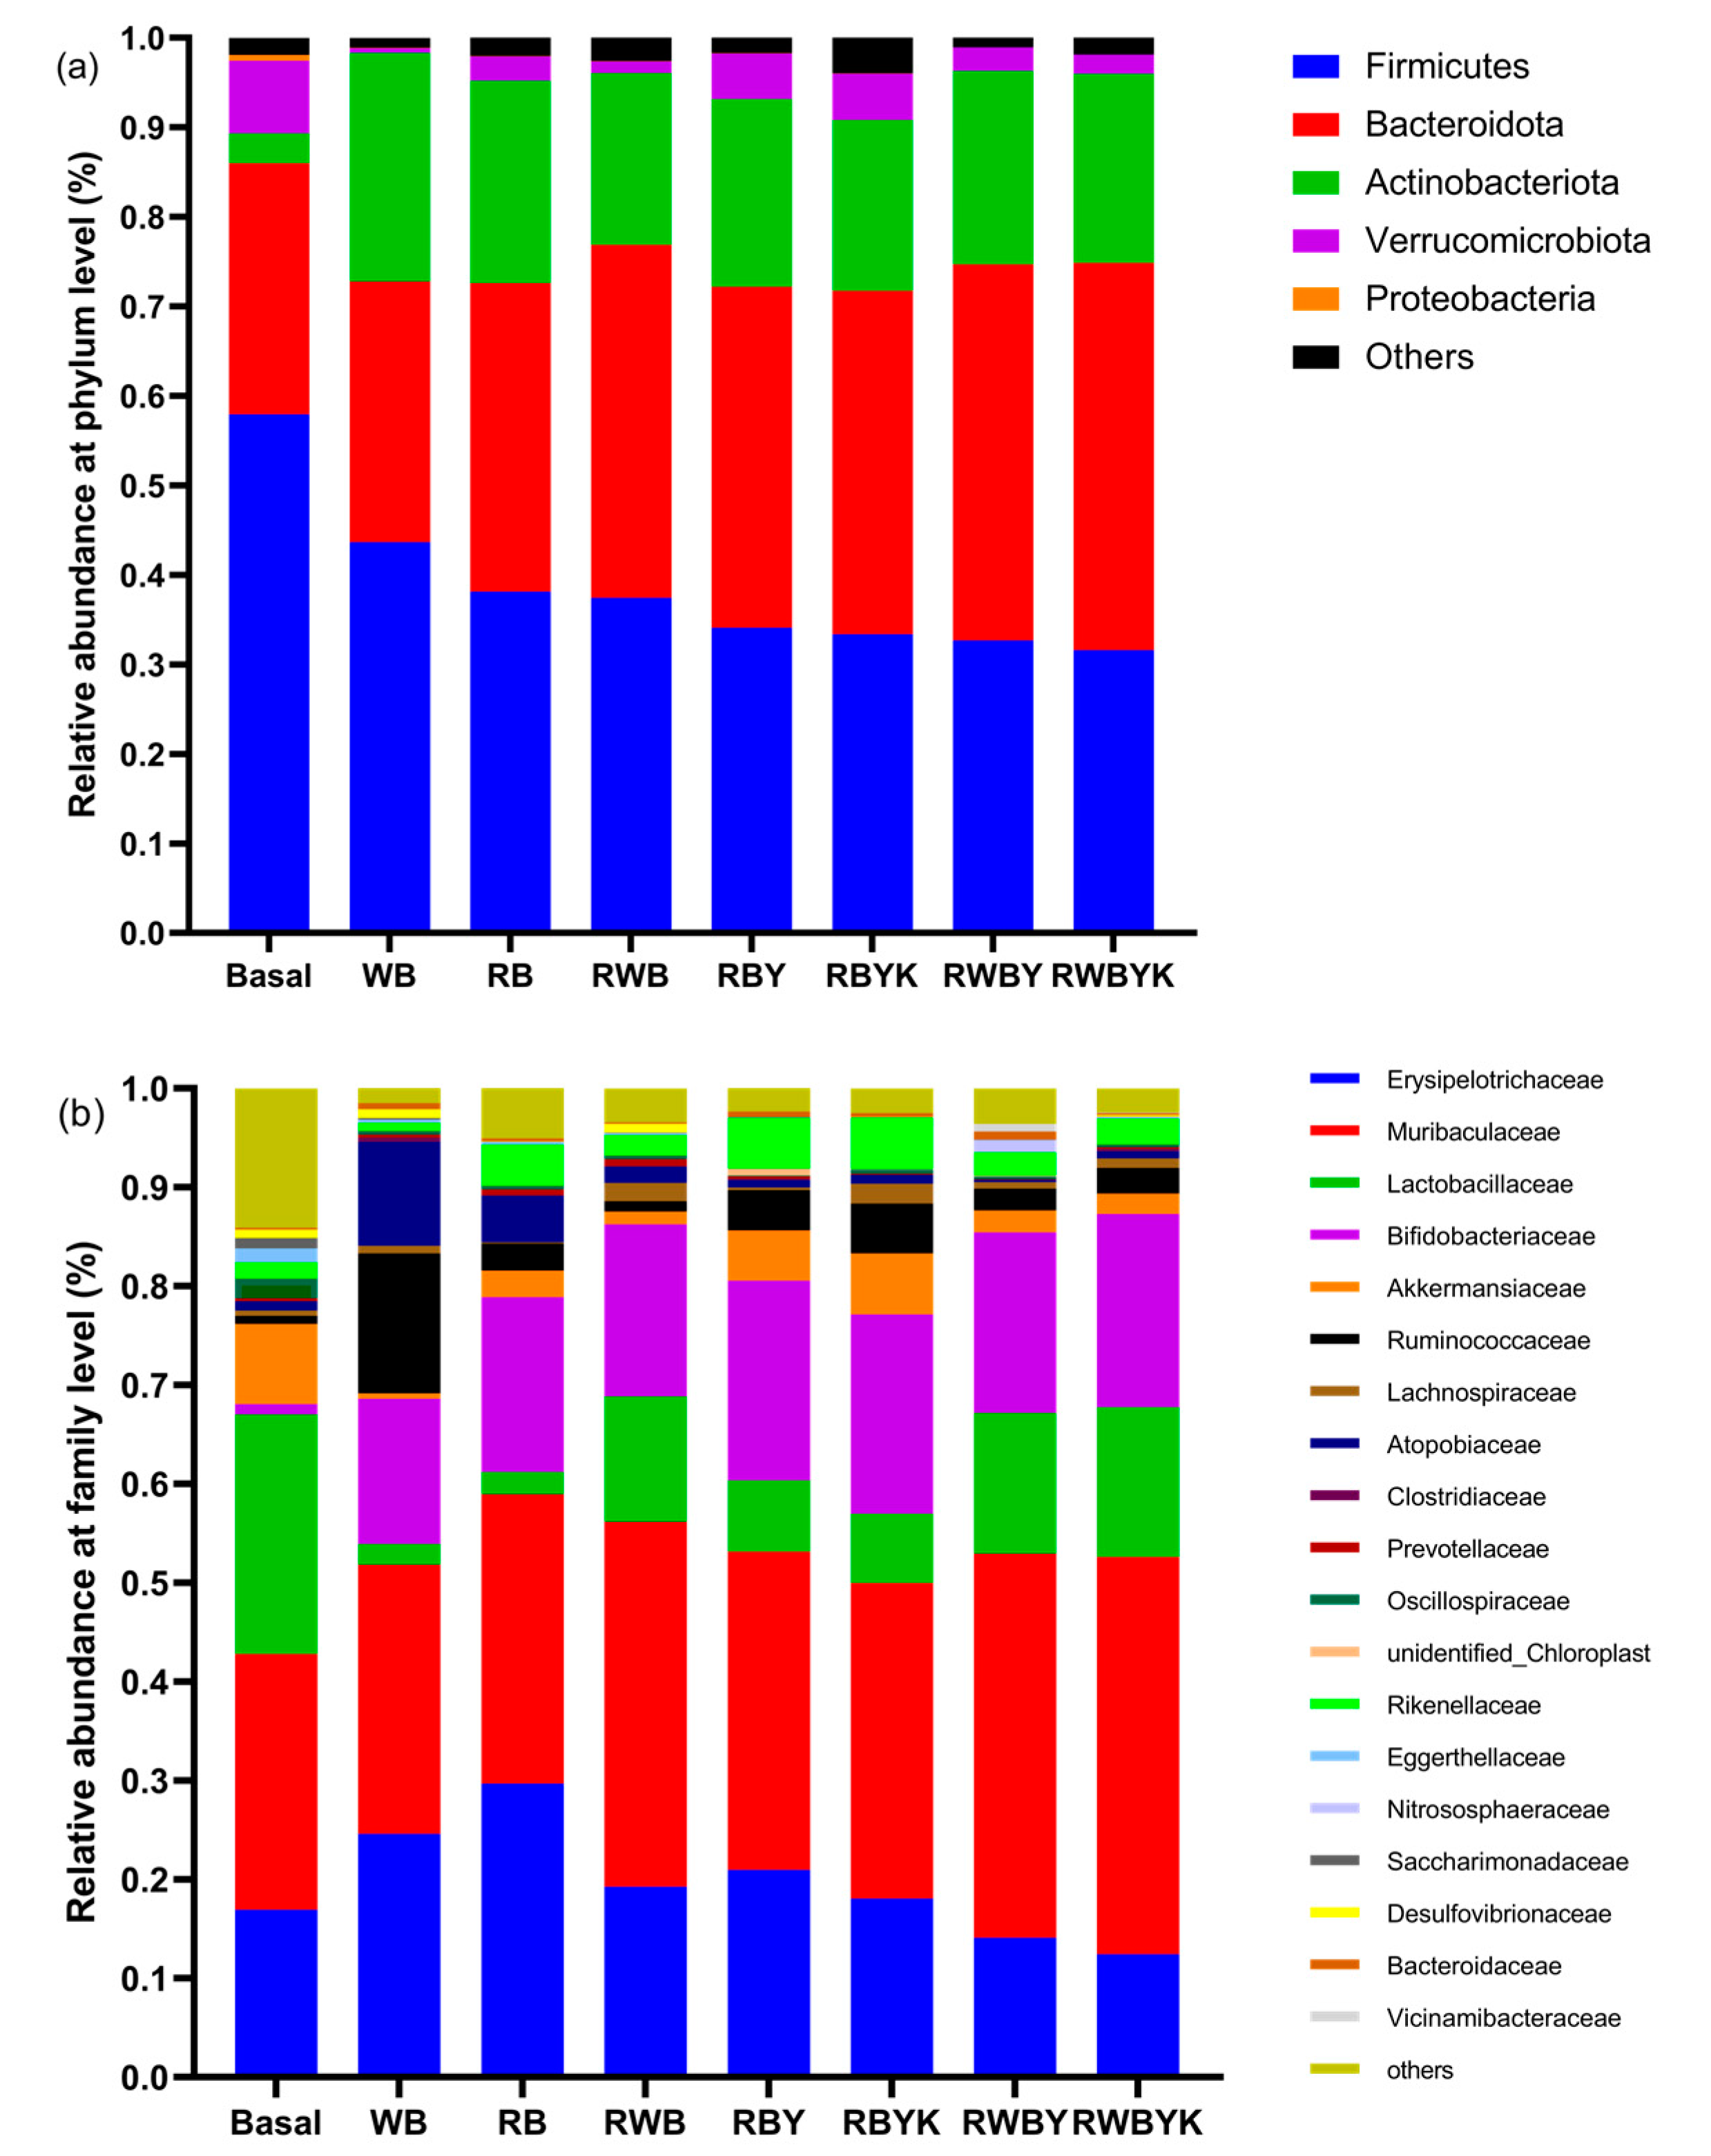
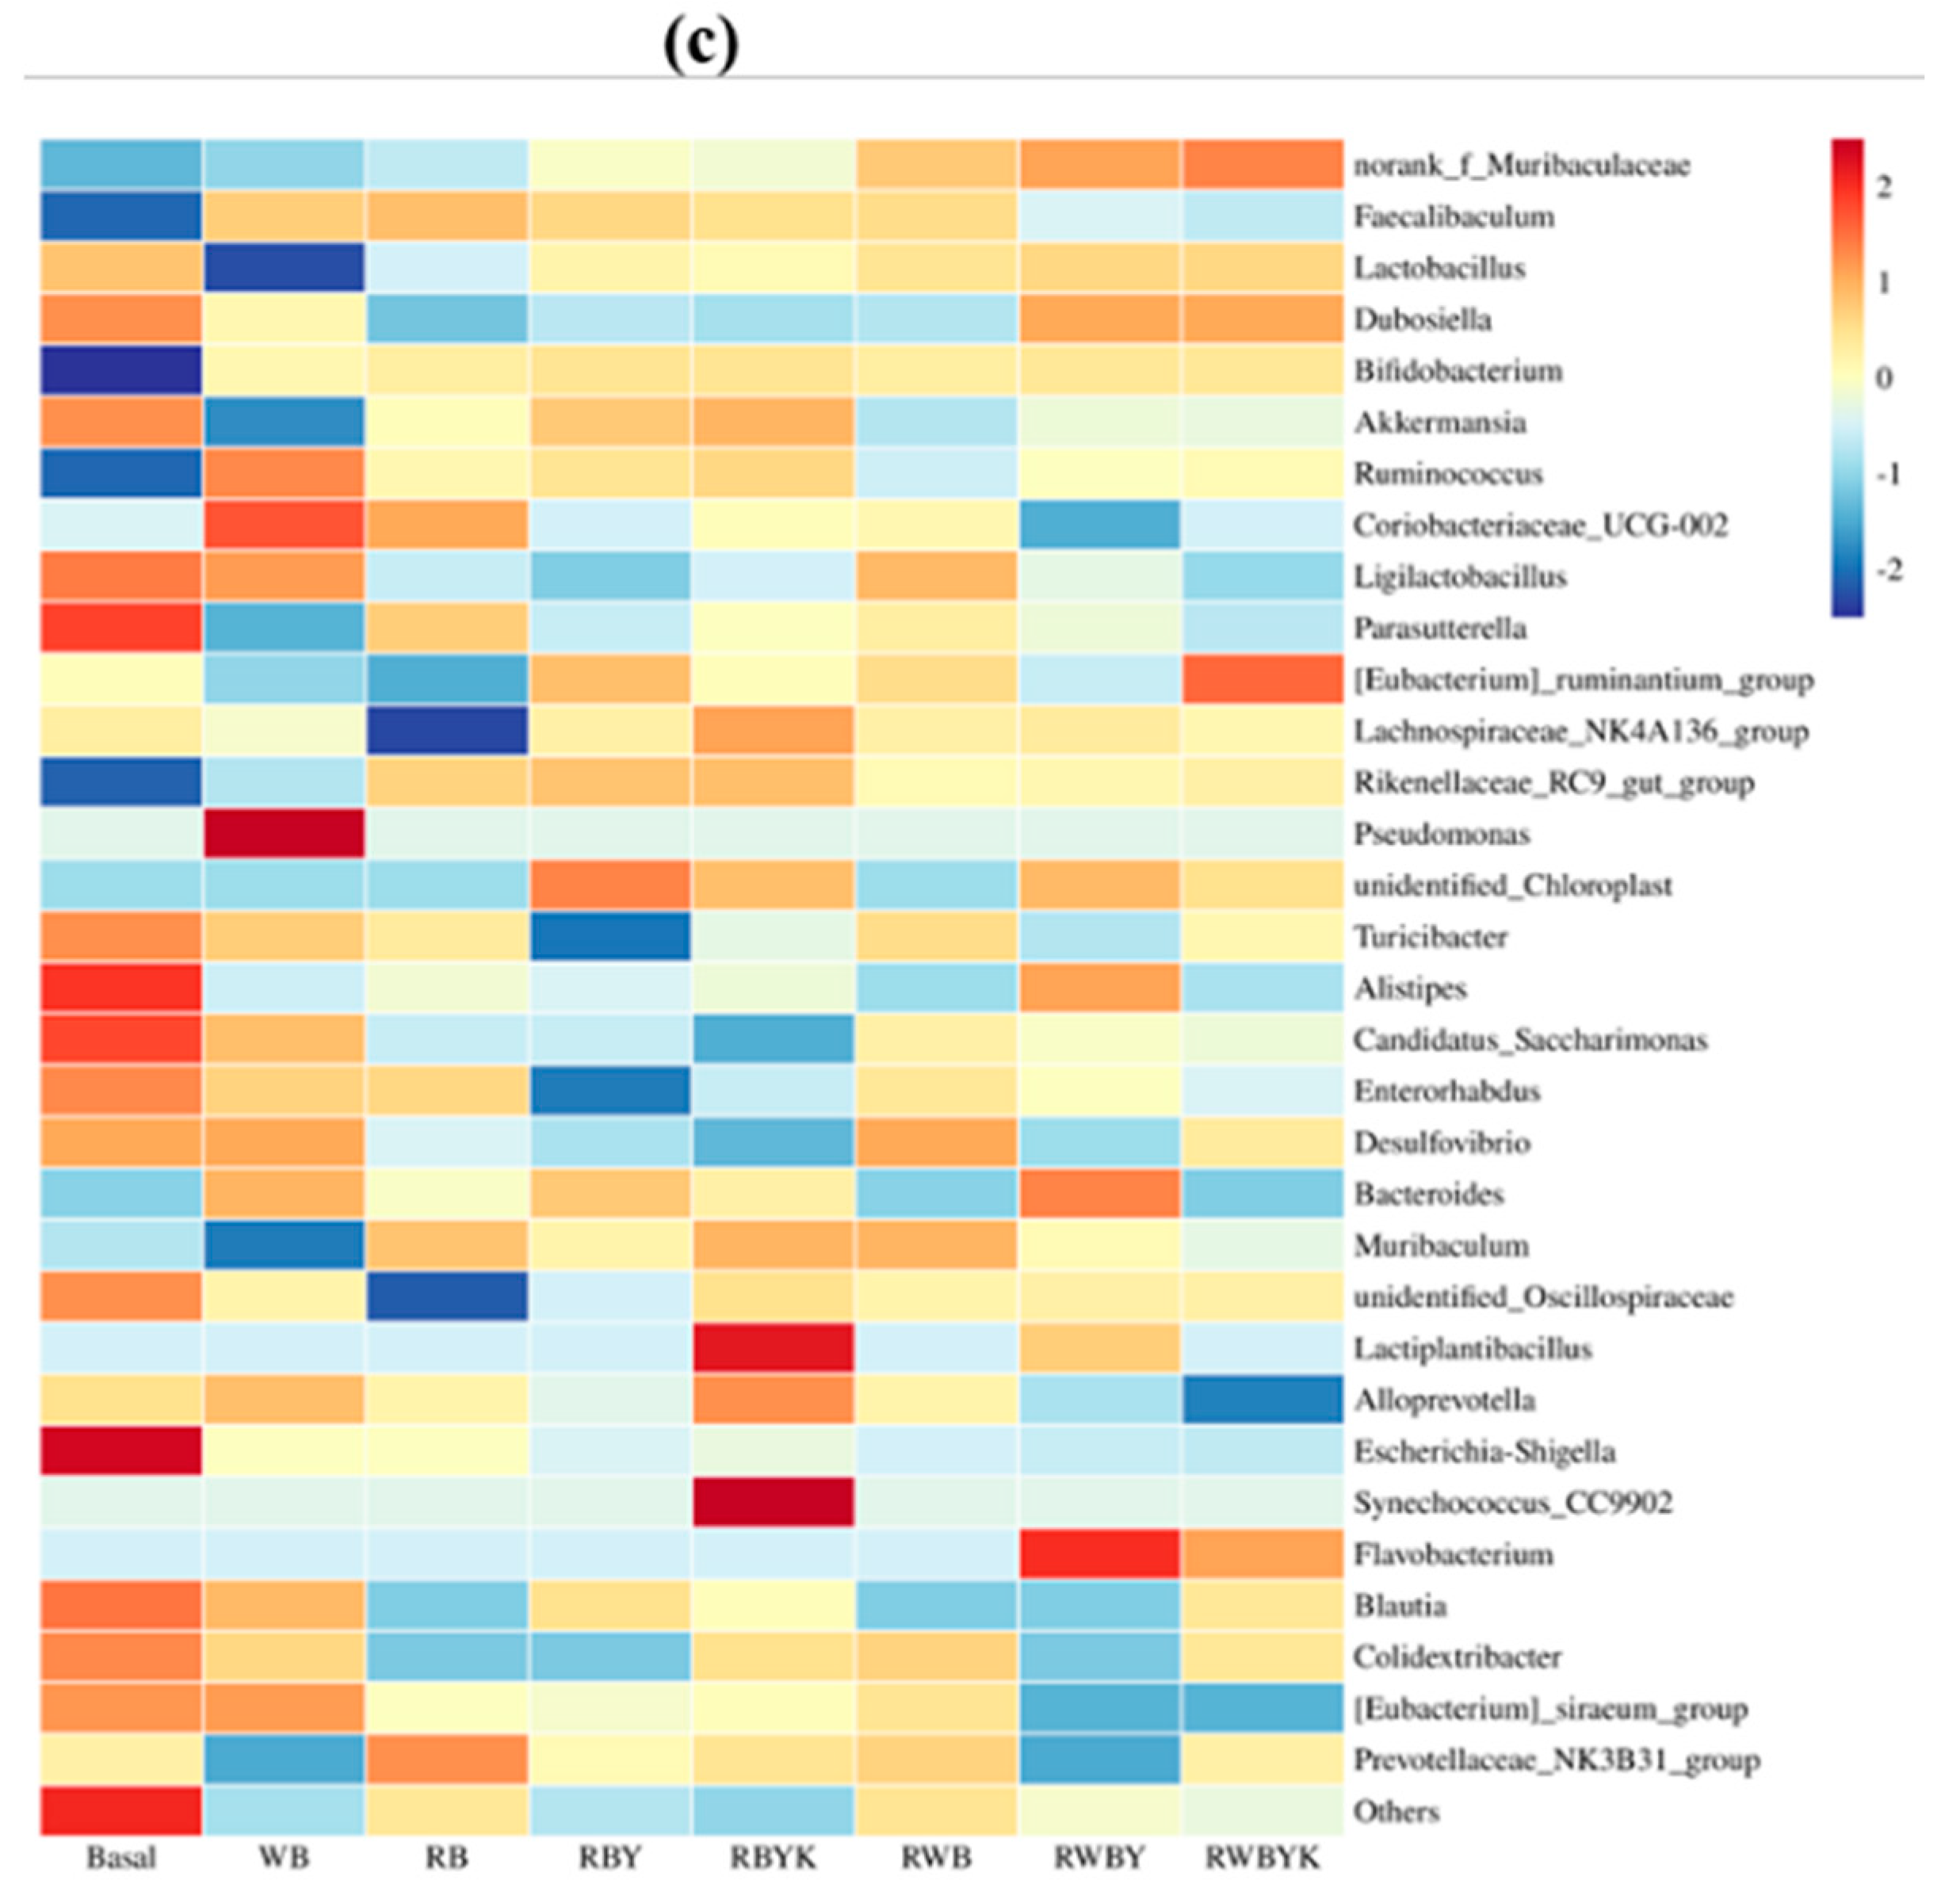
3.5. Effect of Customized Sourdough Bread Diets on Gut Microbiota of Mice
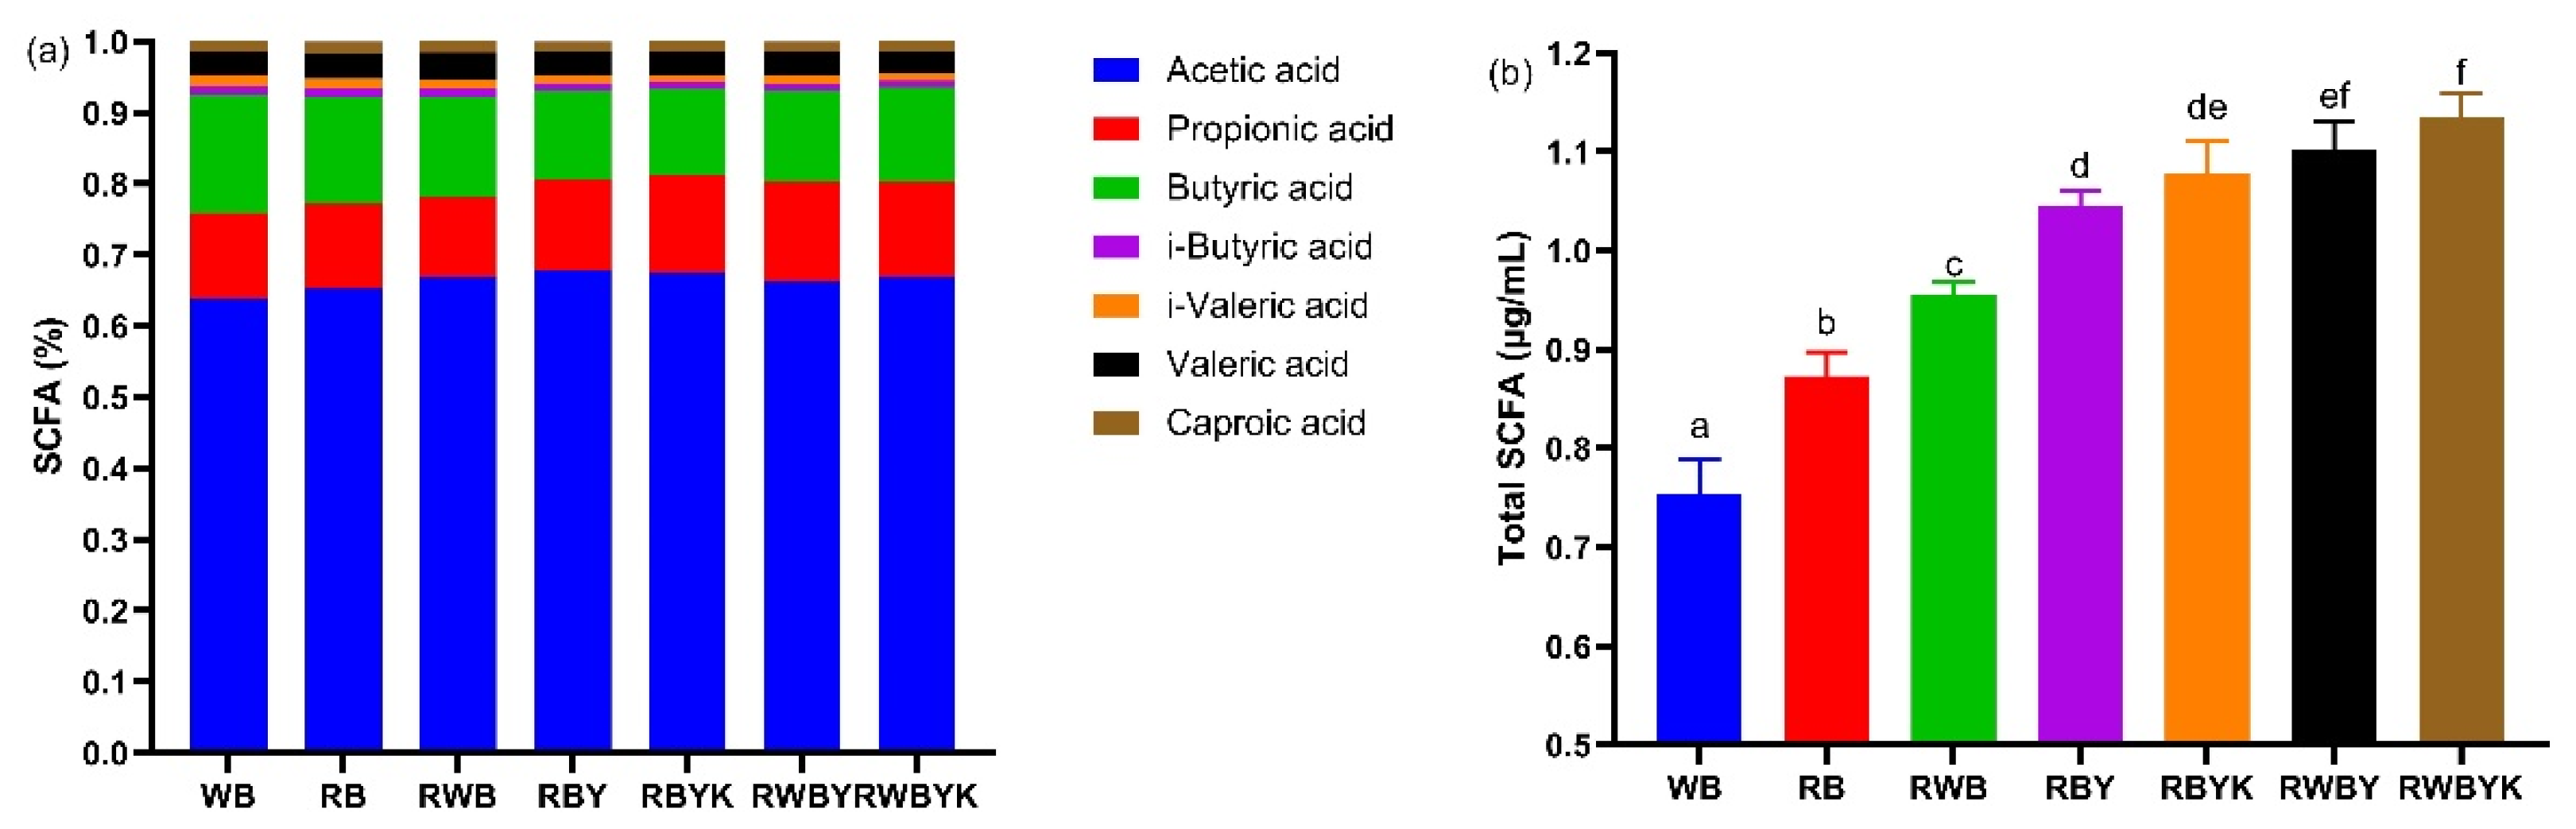
3.6. Effect of Customized Sourdough Bread Diets on Short-Chain Fatty Acids (SCFAs) in Mice
4. Conclusions
Supplementary Materials
Author Contributions
Funding
Institutional Review Board Statement
Informed Consent Statement
Data Availability Statement
Conflicts of Interest
References
- Gobbetti, M.; Rizzello, C.G.; Di Cagno, R.; De Angelis, M. How the sourdough may affect the functional features of leavened baked goods. Food Microbiol. 2014, 37, 30–40. [Google Scholar] [CrossRef] [PubMed]
- Huang, J.; Omedi, J.O.; Huang, C.; Chen, C.; Liang, L.; Zheng, J.; Zeng, Y.; Xu, Y.; Huang, W. Effect of black bean supplemented with wheat bran sourdough fermentation by Pediococcus acidilactici or Pediococcus pentosaceus on baking quality and staling characteristics of wheat composite bread. Appl. Food Res. 2024, 4, 100425. [Google Scholar] [CrossRef]
- Arora, K.; Ameur, H.; Polo, A.; Di Cagno, R.; Rizzello, C.G.; Gobbetti, M. Thirty years of knowledge on sourdough fermentation: A systematic review. Trends Food Sci. Technol. 2021, 108, 71–83. [Google Scholar] [CrossRef]
- Luti, S.; Mazzoli, L.; Ramazzotti, M.; Galli, V.; Venturi, M.; Marino, G.; Lehmann, M.; Guerrini, S.; Granchi, L.; Paoli, P.; et al. Antioxidant and anti-inflammatory properties of sourdoughs containing selected Lactobacilli strains are retained in breads. Food Chem. 2020, 322, 126710. [Google Scholar] [CrossRef]
- Huang, C.; Huang, J.; Zhang, B.; Omedi, J.O.; Chen, C.; Zhou, L.; Liang, L.; Zou, Q.; Zheng, J.; Zeng, Y.; et al. Rheo-Fermentation Dough Properties, Bread-Making Quality and Aroma Characteristics of Red Bean (Vigna angularis) Sourdough Induced by LAB Weissella confusa QS813 Strain Fermentation. Foods 2023, 12, 605. [Google Scholar] [CrossRef]
- Chen, C.; Huang, J.; Omedi, J.O.; Huang, C.; Cheng, X.; Zhang, B.; Li, N.; Gao, T.; Liang, L.; Zheng, J.; et al. Characteristics of the microstructure and the key components of white kidney bean sourdough bread induced by mixed-strain fermentation and its influence on gut microbiota. Food Funct. 2023, 14, 7413–7425. [Google Scholar] [CrossRef] [PubMed]
- Struyf, N.; Vandewiele, H.; Herrera-Malaver, B.; Verspreet, J.; Verstrepen, K.J.; Courtin, C.M. Kluyveromyces marxianus yeast enables the production of low FODMAP whole wheat breads. Food Microbiol. 2018, 76, 135–145. [Google Scholar] [CrossRef] [PubMed]
- Liang, L.; Omedi, J.O.; Huang, W.; Zheng, J.; Zeng, Y.; Huang, J.; Zhang, B.; Zhou, L.; Li, N.; Gao, T.; et al. Antioxidant, flavor profile and quality of wheat dough bread incorporated with kiwifruit fermented by β-glucosidase producing lactic acid bacteria strains. Food Biosci. 2022, 46, 101450. [Google Scholar] [CrossRef]
- Chun, J.Y.; Kim, J.S.; Kim, J.H. Enrichment of isoflavone aglycones in soymilk by fermentation with single and mixed cultures of Streptococcus infantarius 12 and Weissella sp 4. Food Chem. 2008, 109, 278–284. [Google Scholar] [CrossRef]
- Alvarez-Martín, P.; Flórez, A.B.; Hernández-Barranco, A.; Mayo, B. Interaction between dairy yeasts and lactic acid bacteria strains during milk fermentation. Food Control 2008, 19, 62–70. [Google Scholar] [CrossRef]
- Lucio, O.; Pardo, I.; Heras, J.M.; Krieger, S.; Ferrer, S. Influence of yeast strains on managing wine acidity using Lactobacillus plantarum. Food Control 2018, 92, 471–478. [Google Scholar] [CrossRef]
- Garrido-Galand, S.; Asensio-Grau, A.; Calvo-Lerma, J.; Heredia, A.; Andres, A. The potential of fermentation on nutritional and technological improvement of cereal and legume flours: A review. Food Res. Int. 2021, 145, 110398. [Google Scholar] [CrossRef] [PubMed]
- Leonard, W.; Zhang, P.; Ying, D.; Adhikari, B.; Fang, Z. Fermentation transforms the phenolic profiles and bioactivities of plant-based foods. Biotechnol. Adv. 2021, 49, 107763. [Google Scholar] [CrossRef]
- Crowe, K.M.; Francis, C. Position of the Academy of Nutrition and Dietetics: Functional Foods. J. Acad. Nutr. Dietitics 2013, 113, 1096–1103. [Google Scholar] [CrossRef]
- Wang, Y.; Yao, X.M.; Shen, H.F.; Zhao, R.; Li, Z.B.; Shen, X.T.; Wang, F.; Chen, K.X.; Zhou, Y.; Li, B.; et al. Nutritional Composition, Efficacy, and Processing of Vigna angularis (Adzuki Bean) for the Human Diet: An Overview. Molecules 2022, 27, 6079. [Google Scholar] [CrossRef]
- Cheng, W.; Sun, Y.J.; Fan, M.C.; Li, Y.; Wang, L.; Qian, H.F. Wheat bran, as the resource of dietary fiber: A review. Crit. Rev. Food Sci. Nutr. 2021, 62, 7269–7281. [Google Scholar] [CrossRef] [PubMed]
- Liu, W.J.; Brennan, M.; Serventi, L.; Brennan, C. Effect of wheat bran on dough rheology and final quality of chinese steamed bread. Cereal Chem. 2017, 94, 581–587. [Google Scholar] [CrossRef]
- Cheni, Y.H.; Yang, X.S.; Guo, H.M.; Li, J.C.; Ren, G.X. Effect of extruded adzuki bean flour on the quality and α-glucosidase inhibitory activity of Chinese steamed bread. Food Sci. Nutr. 2019, 7, 3244–3252. [Google Scholar] [CrossRef]
- Cho, S.S.; Qi, L.; Fahey, G.; Klurfeld, D.M. Consumption of cereal fiber, mixtures of whole grains and bran, and whole grains and risk reduction in type 2 diabetes, obesity, and cardiovascular disease. Am. J. Clin. Nutr. 2013, 98, 594–619. [Google Scholar] [CrossRef]
- Qin, H.B.; Wu, H.B.; Shen, K.; Liu, Y.L.; Li, M.; Wang, H.G.; Qiao, Z.J.; Mu, Z.X. Fermented Minor Grain Foods: Classification, Functional Components, and Probiotic Potential. Foods 2022, 11, 3155. [Google Scholar] [CrossRef]
- Tanaskovic, S.J.; Sekuljica, N.; Jovanovic, J.; Gazikalovic, I.; Grbavcic, S.; Dordevic, N.; Sekulic, M.V.; Hao, J.; Lukovic, N.; Knezevic-Jugovic, Z. Upgrading of valuable food component contents and anti-nutritional factors depletion by solid-state fermentation: A way to valorize wheat bran for nutrition. J. Cereal Sci. 2021, 99, 103159. [Google Scholar] [CrossRef]
- Klomklao, S.; Benjakul, S. Effect of trypsin inhibitor in adzuki bean (Vigna angularis) on proteolysis and gel properties of threadfin bream (Nemipterus bleekeri). LWT Food Sci. Technol. 2015, 63, 906–911. [Google Scholar] [CrossRef]
- Buddrick, O.; Jones, O.A.H.; Cornell, H.J.; Small, D.M. The influence of fermentation processes and cereal grains in wholegrain bread on reducing phytate content. J. Cereal Sci. 2014, 59, 3–8. [Google Scholar] [CrossRef]
- Richard, B.; Broadhurst, W.T.J. Analysis of condensed tannins using acidified vanillin. J. Sci. Food Agric. 1978, 29, 788–794. [Google Scholar]
- Guergoletto, K.B.; Costabile, A.; Flores, G.; Garcia, S.; Gibson, G.R. In vitro fermentation of juçara pulp (Euterpe edulis) by human colonic microbiota. Food Chem. 2016, 196, 251–258. [Google Scholar] [CrossRef] [PubMed]
- Luo, J.Q.; Cai, W.X.; Wu, T.; Xu, B.J. Phytochemical distribution in hull and cotyledon of adzuki bean (Vigna angularis L.) and mung bean (Vigna radiate L.), and their contribution to antioxidant, anti-inflammatory and anti-diabetic activities. Food Chem. 2016, 201, 350–360. [Google Scholar] [CrossRef]
- Omedi, J.O.; Li, N.; Chen, C.; Cheng, X.; Huang, J.; Zhang, B.; Gao, T.; Liang, L.; Zhou, Z.; Huang, W. Potential Health Benefits of Yeast-Leavened Bread Containing LAB Pediococcus pentosaceus Fermented Pitaya (Hylocereus undatus): Both In Vitro and In Vivo Aspects. Foods 2022, 11, 3416. [Google Scholar] [CrossRef]
- Fekri, A.; Torbati, M.; Yari Khosrowshahi, A.; Bagherpour Shamloo, H.; Azadmard-Damirchi, S. Functional effects of phytate-degrading, probiotic lactic acid bacteria and yeast strains isolated from Iranian traditional sourodugh on the technological and nutritional properties of whole wheat bread. Food Chem. 2020, 306, 125620. [Google Scholar] [CrossRef]
- Scortichini, S.; Boarelli, M.C.; Silvi, S.; Fiorini, D. Development and validation of a GC-FID method for the analysis of short chain fatty acids in rat and human faeces and in fermentation fluids. J. Chromatogr. B 2020, 1142, 121972. [Google Scholar] [CrossRef]
- Vogelmann, S.A.; Seitter, M.; Singer, U.; Brandt, M.J.; Hertel, C. Adaptability of lactic acid bacteria and yeasts to sourdoughs prepared from cereals, pseudocereals and cassava and use of competitive strains as starters. Int. J. Food Microbiol. 2009, 130, 205–212. [Google Scholar] [CrossRef]
- Onipe, O.O.; Jideani, A.I.O.; Beswa, D. Composition and functionality of wheat bran and its application in some cereal food products. Int. J. Food Sci. Technol. 2015, 50, 2509–2518. [Google Scholar] [CrossRef]
- Ma, S.; Wang, Z.; Guo, X.; Wang, F.; Huang, J.; Sun, B.; Wang, X. Sourdough improves the quality of whole-wheat flour products: Mechanisms and challenges—A review. Food Chem. 2021, 360, 130038. [Google Scholar] [CrossRef] [PubMed]
- Reale, A.; Konietzny, U.; Coppola, R.; Sorrentino, E.; Greiner, R. The importance of lactic acid bacteria for phytate degradation during cereal dough fermentation. J. Agric. Food Chem. 2007, 55, 2993–2997. [Google Scholar] [CrossRef] [PubMed]
- Karaman, K.; Sagdic, O.; Durak, M.Z. Use of phytase active yeasts and lactic acid bacteria isolated from sourdough in the production of whole wheat bread. LWT Food Sci. Technol. 2018, 557, 567. [Google Scholar] [CrossRef]
- Fang, L.P.; Wang, W.J.; Dou, Z.X.; Chen, J.; Meng, Y.C.; Cai, L.Q.; Li, Y.H. Effects of mixed fermentation of different lactic acid bacteria and yeast on phytic acid degradation and flavor compounds in sourdough. LWT Food Sci. Technol. 2023, 174, 114438. [Google Scholar] [CrossRef]
- Filannino, P.; Di Cagno, R.; Gobbetti, M. Metabolic and functional paths of lactic acid bacteria in plant foods: Get out of the labyrinth. Curr. Opin. Biotechnol. 2018, 49, 64–72. [Google Scholar] [CrossRef]
- Yang, F.; Chen, C.; Ni, D.R.; Yang, Y.B.; Tian, J.H.; Li, Y.Y.; Chen, S.G.; Ye, X.Q.; Wang, L. Effects of Fermentation on Bioactivity and the Composition of Polyphenols Contained in Polyphenol-Rich Foods: A Review. Foods 2023, 12, 3315. [Google Scholar] [CrossRef]
- Li, W.; Sun, X.; Du, Y.; Su, A.; Fang, Y.; Hu, Q.; Pei, F. Effects of co-fermentation on the release of ferulic acid and the rheological properties of whole wheat dough. J. Cereal Sci. 2023, 111, 103669. [Google Scholar] [CrossRef]
- Michlmayr, H.; Kneifel, W. β-Glucosidase activities of lactic acid bacteria: Mechanisms, impact on fermented food and human health. FEMS Microbiol. Lett. 2014, 352, 1–10. [Google Scholar] [CrossRef]
- Wronkowska, M.; Jadacka, K.; Soral-Smietana, M.; Zander, L.; Dajnowiec, F.; Banaszcyk, P.; Jelinski, Z.; Szmatowicz, B. Acid whey concentrated by ultrafiltration a toll for modeling bread properties. LWT Food Sci. Technol. 2015, 61, 172–175. [Google Scholar] [CrossRef]
- Goesaert, H.; Brijs, K.; Veraverbeke, W.S.; Courtin, C.M.; Gebruers, K.; Delcour, J.A. Wheat flour constituents: How they impact bread quality, and how to impact their functionality. Trends Food Sci. Technol. 2005, 16, 12–30. [Google Scholar] [CrossRef]
- Schadow, A.M.; Revheim, I.; Spielau, U.; Dierkes, J.; Schwingshackl, L.; Frank, J.; Hodgson, J.M.; Moreira-Rosário, A.; Seal, C.J.; Buyken, A.E.; et al. The Effect of Regular Consumption of Reformulated Breads on Glycemic Control: A Systematic Review and Meta-Analysis of Randomized Clinical Trials. Adv. Nutr. Int. Rev. J. 2023, 14, 30–43. [Google Scholar] [CrossRef] [PubMed]
- Winn, N.C.; Schleh, M.W.; Garcia, J.N.; Lantier, L.; McGuinness, O.P.; Blair, J.A.; Hasty, A.H.; Wasserman, D.H. Insulin at the intersection of thermoregulation and glucose homeostasis. Mol. Metab. 2024, 81, 101901. [Google Scholar] [CrossRef] [PubMed]
- Busik, J.V. Lipid metabolism dysregulation in diabetic retinopathy. J. Lipid Res. 2021, 62, 100017. [Google Scholar] [CrossRef] [PubMed]
- Chen, H.R.; Guan, K.F.; Qi, X.F.; Wang, R.C.; Ma, Y. α-Lactalbumin ameliorates hepatic lipid metabolism in high-fat-diet induced obese C57BL/6J mice. J. Funct. Foods 2020, 75, 104253. [Google Scholar] [CrossRef]
- Ma, Y.; Lu, Y.; Petrofsky, K.; Liu, J.; Cheng, Y.; Ruan, R.; Chen, C. Double-edged metabolic effects from short-term feeding of functionalized wheat bran to mouse revealed by metabolomic profiling. J. Agric. Food Chem. 2021, 69, 6543–6555. [Google Scholar] [CrossRef]
- Tarfa, A.; Alonazi, M.A. Lycopene corrects metabolic syndrome and liver injury induced by high fat diet in obese rats through antioxidant, anti-inflammatory, antifibrotic pathways. Biomed. Pharmacother. 2021, 141, 111831. [Google Scholar]
- Li, J.J.; Jin, H.; Yan, X.M.; Shao, D.Y.; Hu, X.Z.; Shi, J.L. The anti-obesity effects exerted by different fractions of Artemisia sphaerocephala Krasch polysaccharide in diet-induced obese mice. Int. J. Biol. Macromol. 2021, 182, 825–837. [Google Scholar] [CrossRef]
- Zhu, R.Y.; Wei, J.P.; Liu, H.X.; Liu, C.Y.; Wang, L.L.; Chen, B.B.; Li, L.; Jia, Q.Q.; Tian, Y.M.; Li, R.; et al. Lycopene attenuates body weight gain through induction of browning via regulation of peroxisome proliferator-activated receptor γ in high-fat diet-induced obese mice. J. Nutr. Biochem. 2020, 78, 108335. [Google Scholar] [CrossRef]
- Yan, Y.L.; Hu, Y.; Gänzle, M.G. Prebiotics, FODMAPs and dietary fiber—Conflicting concepts in development of functional food products? Curr. Opin. Food Sci. 2018, 20, 30–37. [Google Scholar] [CrossRef]
- Moorthy, M.; Chaiyakunapruk, N.; Jacob, S.A.; Palanisamy, U.D. Prebiotic potential of polyphenols, its effect on gut microbiota and anthropometric/clinical markers: A systematic review of randomised controlled trials. Trends Food Sci. Technol. 2020, 99, 634–649. [Google Scholar] [CrossRef]
- Rezende, E.S.V.; Lima, G.C.; Naves, M.M.V. Dietary fibers as beneficial microbiota modulators: A proposed classification by prebiotic categories. Nutrition 2021, 89, 111217. [Google Scholar] [CrossRef] [PubMed]
- Mo, X.X.; Sun, Y.H.; Liang, X.L.; Li, L.Y.; Hu, S.; Xu, Z.H.; Liu, S.; Zhang, Y.; Li, X.Q.; Liu, L.G. Insoluble yeast β-glucan attenuates high-fat diet-induced obesity by regulating gut microbiota and its metabolites. Carbohydr. Polym. 2022, 281, 119046. [Google Scholar] [CrossRef]
- Peluzio, M.D.G.; Martinez, J.A.; Milagro, F.I. Postbiotics: Metabolites and mechanisms involved in microbiota-host interactions. Trends Food Sci. Technol. 2021, 108, 11–26. [Google Scholar] [CrossRef]
- Alvarez, J.; Real, J.M.F.; Guarner, F.; Gueimonde, M.; Rodríguez, J.M.; de Pipaon, M.S.; Sanz, Y. Gut microbes and health. Gastroenterol. Hepatol. 2021, 44, 519–535. [Google Scholar] [CrossRef]


| Item | RB | RWB | RBY | RBYK | RWBY | RWBYK | |
|---|---|---|---|---|---|---|---|
| Physicochemical characteristics | pH | 6.46 ± 0.03 e | 6.39 ± 0.06 d | 4.37 ± 0.03 c | 4.27 ± 0.02 ab | 4.31 ± 0.04 bc | 4.23 ± 0.02 a |
| TTA (mL) | 4.52 ± 0.03 a | 4.48 ± 0.07 a | 18.28 ± 0.15 b | 19.99 ± 0.14 d | 19.27 ± 0.09 c | 20.39 ± 0.07 e | |
| Anti-nutritional factors | Condensed tannin (mg/g) | 6.14 ± 0.34 c | 3.59 ± 0.22 b | 3.61 ± 0.31 b | 3.68 ± 0.19 b | 2.47 ± 0.26 a | 2.43 ± 0.12 a |
| Phytic acid (mg/g) | 6.54 ± 0.28 b | 11.65 ± 0.25 d | 5.09 ± 0.09 a | 4.98 ± 0.06 a | 8.22 ± 0.14 c | 8.14 ± 0.14 c | |
| Trypsin inhibitor (mg/g) | 13.95 ± 0.21 d | 9.34 ± 0.25 c | 8.14 ± 0.13 b | 8.20 ± 0.14 b | 5.05 ± 0.07 c | 5.12 ± 0.11 c | |
| Phytochemical content | TPC (mg GAE/g) | 4.02 ± 0.08 a | 4.95 ± 0.08 b | 5.24 ± 0.12 c | 5.60 ± 0.12 d | 6.63 ± 0.13 e | 7.18 ± 0.14 f |
| TFC (mg RE/g) | 2.39 ± 0.10 a | 2.31 ± 0.16 a | 2.94 ± 0.14 b | 3.32 ± 0.13 c | 2.82 ± 0.15 b | 3.17 ± 0.11 c | |
| Phenolic acids (µg/g) | Gallic acid | 47.74 ± 3.27 a | 54.74 ± 4.78 ab | 59.67 ± 4.28 bc | 68.19 ± 5.28 de | 64.72 ± 3.84 cd | 73.12 ± 4.41 e |
| Protocatechuic acid | 73.26 ± 2.22 f | 60.80 ± 3.67 e | 35.18 ± 2.58 d | 19.07 ± 2.56 a | 28.02 ± 2.05 c | 20.35 ± 2.33 b | |
| Chlorogenic acid | 28.63 ± 2.60 d | 15.19 ± 0.75 b | 14.73 ± 0.53 b | 17.83 ± 0.96 c | 4.49 ± 0.40 a | 4.32 ± 0.49 a | |
| Caffeic acid | 17.06 ± 1.11 d | 8.90 ± 0.41 bc | 8.65 ± 0.51 b | 9.92 ± 0.49 c | 4.51 ± 0.48 a | 4.09 ± 0.43 a | |
| p-Coumaric acid | - | 0.54 ± 0.12 c | 0.18 ± 0.12 a | 0.26 ± 0.09 b | 1.23 ± 0.10 e | 0.92 ± 0.19 d | |
| Ferulic acid | 11.18 ± 0.32 d | 16.55 ± 1.07 e | 8.82 ± 0.39 a | 8.98 ± 0.34 b | 10.34 ± 0.45 cd | 10.11 ± 0.40 c | |
| Dietary fiber (g/100 g) | IDF | 4.23 ± 0.07 c | 7.26 ± 0.09 f | 3.72 ± 0.08 b | 3.01 ± 0.05 a | 5.60 ± 0.08 e | 4.97 ± 0.07 d |
| SDF | 0.82 ± 0.03 a | 1.55 ± 0.04 d | 1.03 ± 0.05 b | 1.22 ± 0.02 c | 1.96 ± 0.03 e | 2.31 ± 0.04 f | |
| TDF | 5.05 ± 0.04 c | 8.81 ± 0.14 f | 4.75 ± 0.09 b | 4.23 ± 0.07 a | 7.56 ± 0.06 e | 7.27 ± 0.08 d |
| Specific Volume (mL/g) | Textural Profile Characteristics | Sensory Evaluation | |||||||
|---|---|---|---|---|---|---|---|---|---|
| Sample (s) | Firmess (g) | Chewiness (mJ) | Texture | Taste | Color | Aroma | Appearance | Overall Acceptability | |
| WB | 6.08 ± 0.14 e | 234.33 ± 8.14 a | 14.40 ± 0.66 a | 7.35 ± 0.49 c | 7.50 ± 0.71 d | 6.95 ± 0.21 b | 7.05 ± 0.14 d | 7.65 ± 0.35 c | 7.70 ± 0.14 d |
| RB | 4.52 ± 0.17 a | 474.67 ± 5.03 f | 35.97 ± 1.59 f | 5.70 ± 0.28 a | 6.30 ± 0.14 ab | 6.75 ± 0.07 ab | 6.45 ± 0.14 b | 6.60 ± 0.14 ab | 5.95 ± 0.24 a |
| RWB | 4.69 ± 0.08 a | 463.00 ± 9.16 e | 30.83 ± 1.17 e | 5.40 ± 0.14 a | 6.15 ± 0.07 a | 6.55 ± 0.14 a | 6.00 ± 0.13 a | 6.35 ± 0.07 a | 5.65 ± 0.21 a |
| RBY | 4.93 ± 0.09 b | 414.00 ± 6.08 d | 28.20 ± 1.18 d | 6.50 ± 0.14 b | 6.85 ± 0.14 abcd | 6.80 ± 0.07 ab | 6.95 ± 0.07 d | 6.60 ± 0.21 ab | 6.80 ± 0.07 b |
| RBYK | 5.15 ± 0.02 cd | 383.00 ± 6.24 c | 24.63 ± 0.87 bc | 6.75 ± 0.06 b | 7.05 ± 0.08 cd | 6.75 ± 0.01 ab | 7.10 ± 0.01 d | 6.90 ± 0.01 bc | 6.90 ± 0.14 b |
| RWBY | 5.04 ± 0.04 bc | 393.67 ± 4.51 c | 25.57 ± 0.65 c | 6.60 ± 0.03 b | 6.70 ± 0.01 abc | 6.70 ± 0.07 ab | 6.60 ± 0.06 bc | 6.90 ± 0.14 bc | 7.00 ± 0.07 bc |
| RWBYK | 5.25 ± 0.04 d | 371.33 ± 5.20 b | 22.80 ± 0.89 b | 6.85 ± 0.04 bc | 7.00 ± 0.07 bcd | 6.85 ± 0.07 b | 6.80 ± 0.21 cd | 7.20 ± 0.28 c | 7.30 ± 0.06 c |
| Lipid Profile (mmol/L) | Cytokine Content | ||||||||
|---|---|---|---|---|---|---|---|---|---|
| Sample (s) | TC | TG | HDL | LDL | HDL:LDL | IL-1β (pg/L) | IL-6 (pg/L) | TNF-α (ng/L) | LPS (ng/L) |
| WB | 3.64 ± 0.06 c | 0.20 ± 0.00 b | 1.21 ± 0.02 a | 2.28 ± 0.02 c | 0.53 ± 0.01 a | 116.10 ± 0.56 d | 123.98 ± 1.89 d | 564.69 ± 5.05 d | 341.24 ± 5.63 e |
| RB | 3.57 ± 0.05 b | 0.20 ± 0.00 b | 1.23 ± 0.01 b | 2.28 ± 0.02 c | 0.54 ± 0.01 ab | 114.02 ± 1.24 c | 119.45 ± 1.45 c | 548.40 ± 3.55 c | 314.33 ± 2.96 d |
| RWB | 3.56 ± 0.04 b | 0.20 ± 0.00 b | 1.24 ± 0.01 bc | 2.27 ± 0.02 c | 0.55 ± 0.00 b | 114.46 ± 0.96 c | 118.83 ± 1.41 c | 551.30 ± 4.60 c | 309.60 ± 3.40 c |
| RBY | 3.41 ± 0.06 a | 0.19 ± 0.00 a | 1.25 ± 0.01 cd | 2.22 ± 0.02 b | 0.56 ± 0.01 c | 111.26 ± 0.76 b | 116.27 ± 1.60 b | 536.40 ± 4.85 b | 293.36 ± 2.72 ab |
| RBYK | 3.37 ± 0.04 a | 0.19 ± 0.00 a | 1.25 ± 0.01 cd | 2.20 ± 0.02 ab | 0.57 ± 0.01 cd | 110.12 ± 1.14 ab | 113.52 ± 1.09 a | 531.40 ± 3.97 b | 291.10 ± 2.81 a |
| RWBY | 3.37 ± 0.02 a | 0.19 ± 0.01 a | 1.25 ± 0.01 cd | 2.21 ± 0.04 ab | 0.57 ± 0.01 cd | 110.63 ± 0.72 b | 115.59 ± 1.77 b | 532.49 ± 6.24 b | 296.60 ± 2.56 b |
| RWBYK | 3.39 ± 0.06 a | 0.19 ± 0.00 a | 1.26 ± 0.02 d | 2.19 ± 0.02 a | 0.57 ± 0.01 d | 109.46 ± 1.02 a | 111.92 ± 1.38 a | 520.20 ± 3.44 a | 293.96 ± 3.29 ab |
Disclaimer/Publisher’s Note: The statements, opinions and data contained in all publications are solely those of the individual author(s) and contributor(s) and not of MDPI and/or the editor(s). MDPI and/or the editor(s) disclaim responsibility for any injury to people or property resulting from any ideas, methods, instructions or products referred to in the content. |
© 2024 by the authors. Licensee MDPI, Basel, Switzerland. This article is an open access article distributed under the terms and conditions of the Creative Commons Attribution (CC BY) license (https://creativecommons.org/licenses/by/4.0/).
Share and Cite
Huang, C.; Zhang, B.; Huang, J.; Liu, Y.; Chen, C.; Omedi, J.O.; Liang, L.; Zhou, Z.; Huang, W.; Li, N. The Effects of Single- or Mixed-Strain Fermentation of Red Bean Sourdough, with or without Wheat Bran, on Bread Making Performance and Its Potential Health Benefits in Mice Model. Foods 2024, 13, 2856. https://doi.org/10.3390/foods13172856
Huang C, Zhang B, Huang J, Liu Y, Chen C, Omedi JO, Liang L, Zhou Z, Huang W, Li N. The Effects of Single- or Mixed-Strain Fermentation of Red Bean Sourdough, with or without Wheat Bran, on Bread Making Performance and Its Potential Health Benefits in Mice Model. Foods. 2024; 13(17):2856. https://doi.org/10.3390/foods13172856
Chicago/Turabian StyleHuang, Chengye, Binle Zhang, Jing Huang, Youyi Liu, Cheng Chen, Jacob Ojobi Omedi, Li Liang, Zhongkai Zhou, Weining Huang, and Ning Li. 2024. "The Effects of Single- or Mixed-Strain Fermentation of Red Bean Sourdough, with or without Wheat Bran, on Bread Making Performance and Its Potential Health Benefits in Mice Model" Foods 13, no. 17: 2856. https://doi.org/10.3390/foods13172856
APA StyleHuang, C., Zhang, B., Huang, J., Liu, Y., Chen, C., Omedi, J. O., Liang, L., Zhou, Z., Huang, W., & Li, N. (2024). The Effects of Single- or Mixed-Strain Fermentation of Red Bean Sourdough, with or without Wheat Bran, on Bread Making Performance and Its Potential Health Benefits in Mice Model. Foods, 13(17), 2856. https://doi.org/10.3390/foods13172856