
Application of 2D Extension of Hjorth’s Descriptors to Distinguish Defined Groups of Bee Pollen Images

 , , and
Abstract
1. Introduction
2. Materials and Methods
2.1. Materials
2.1.1. Image Acquisition Procedure
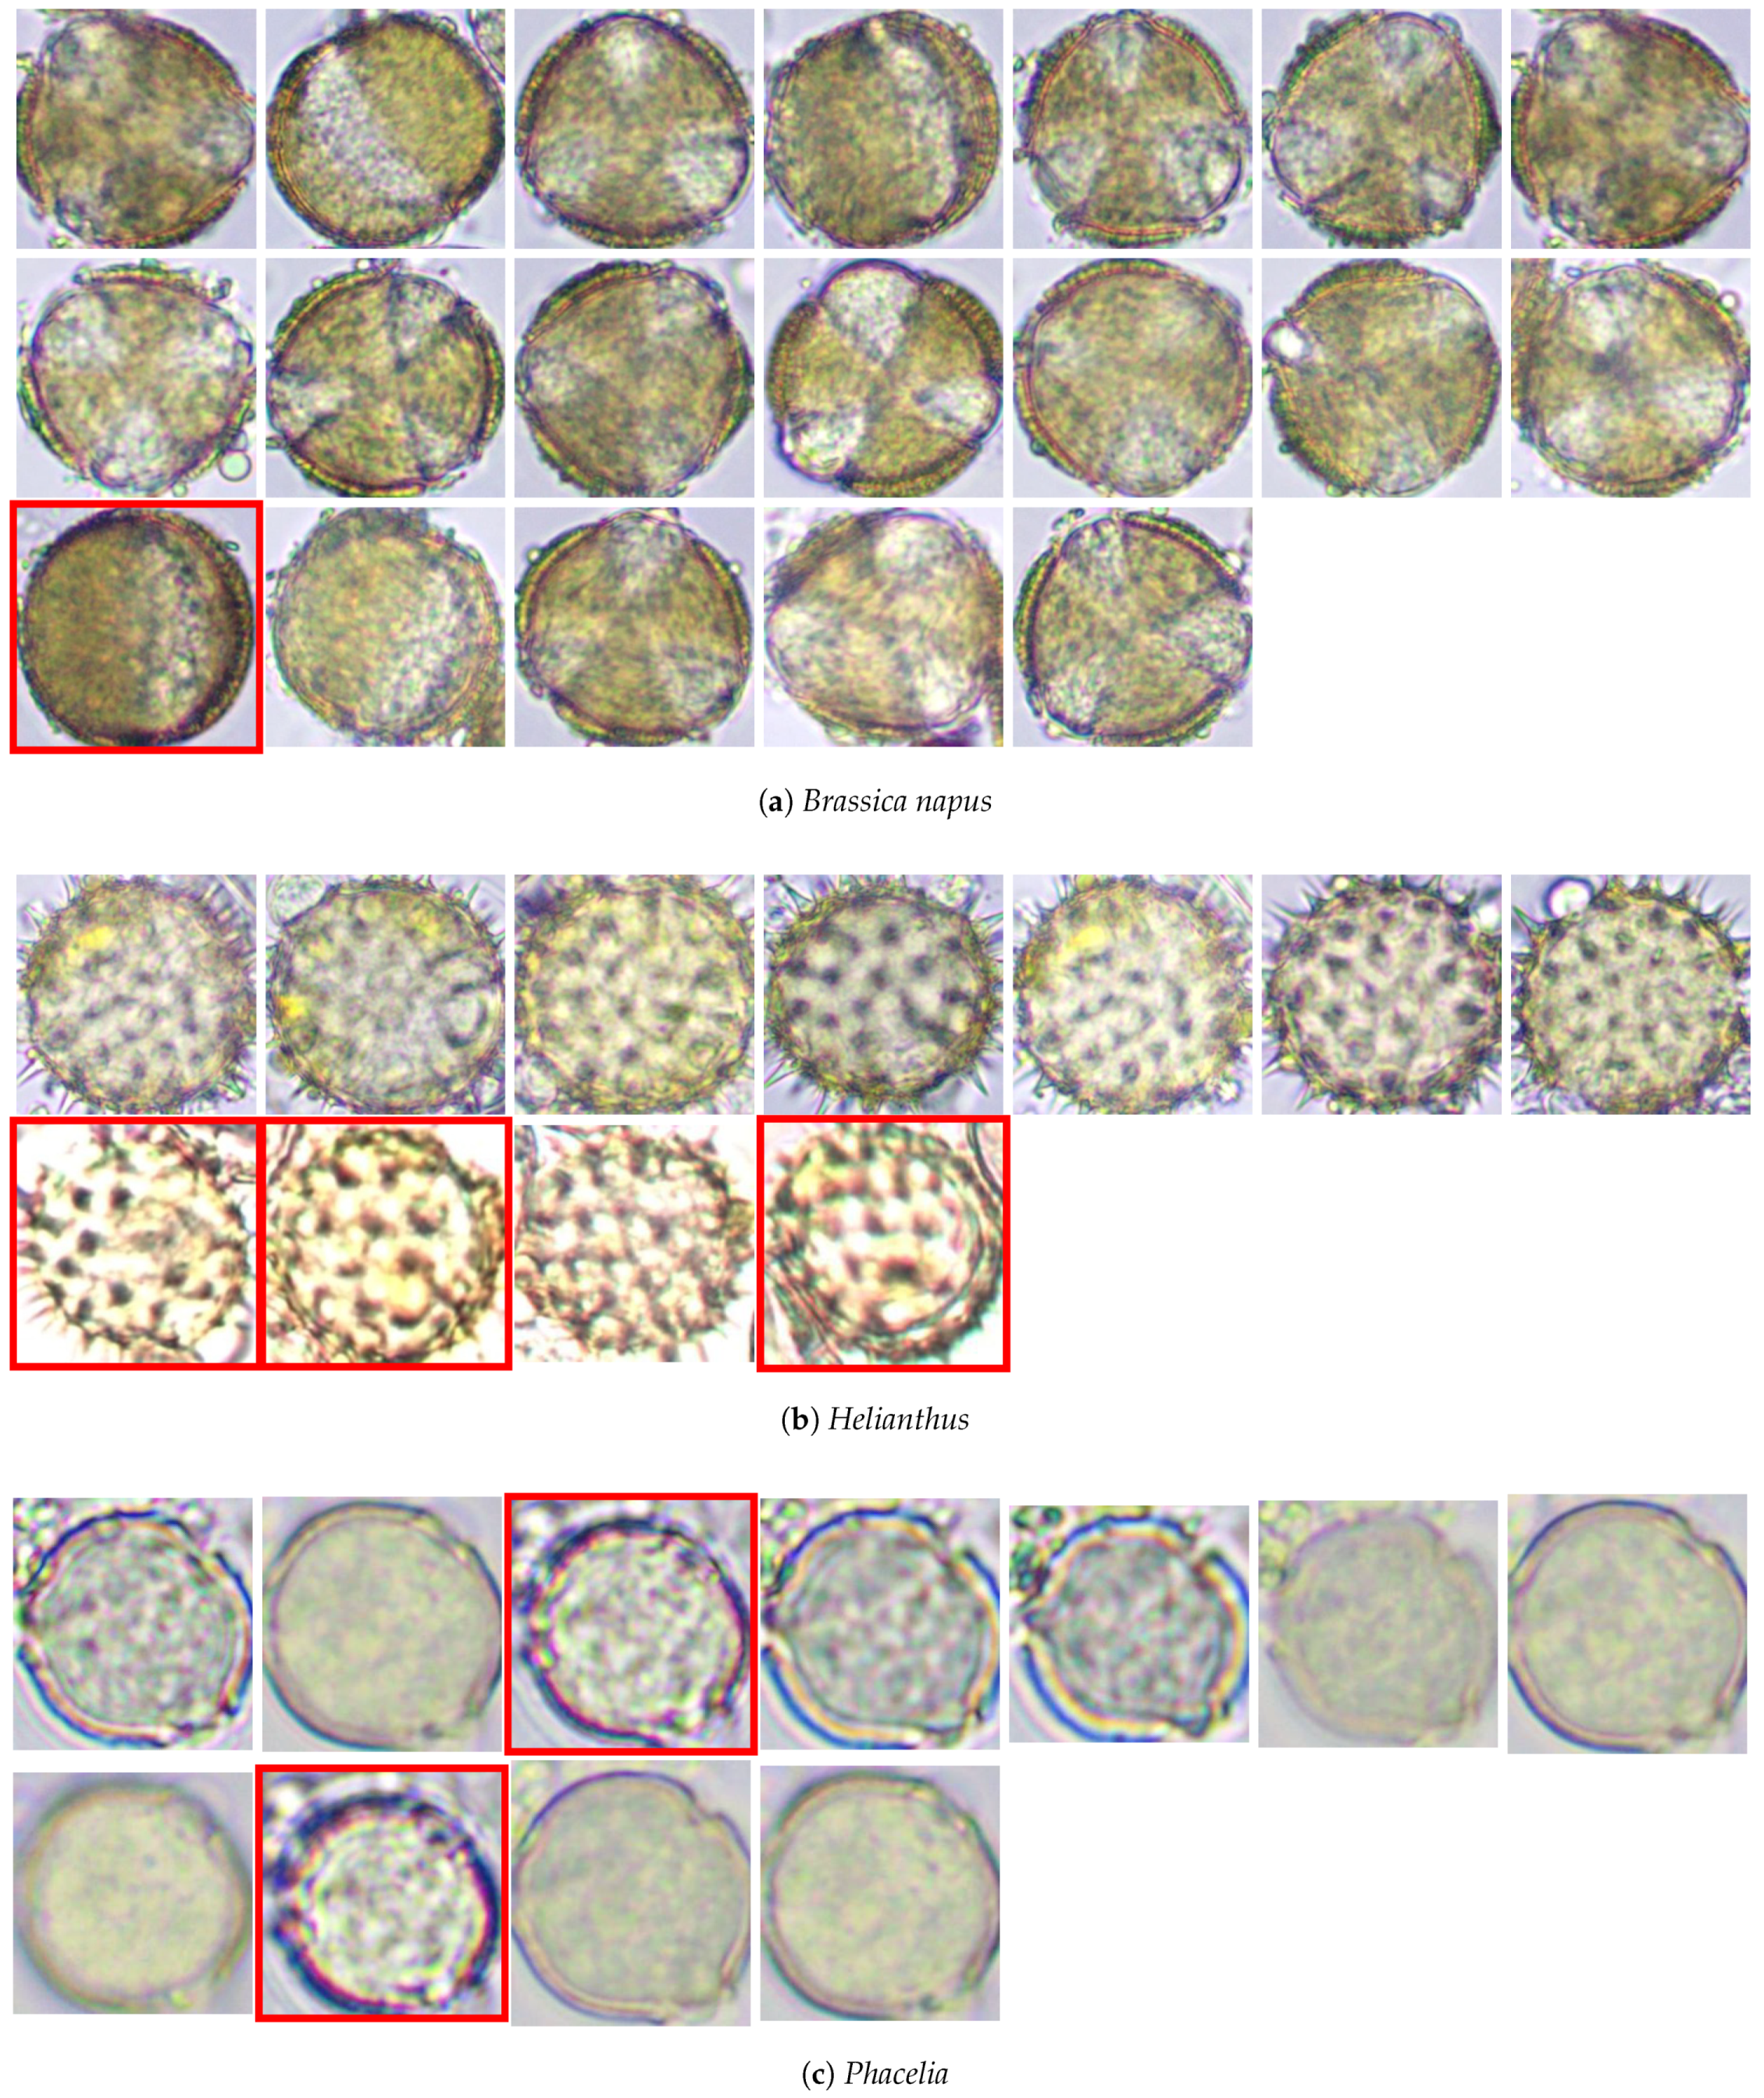
2.1.2. Database
2.2. Methods
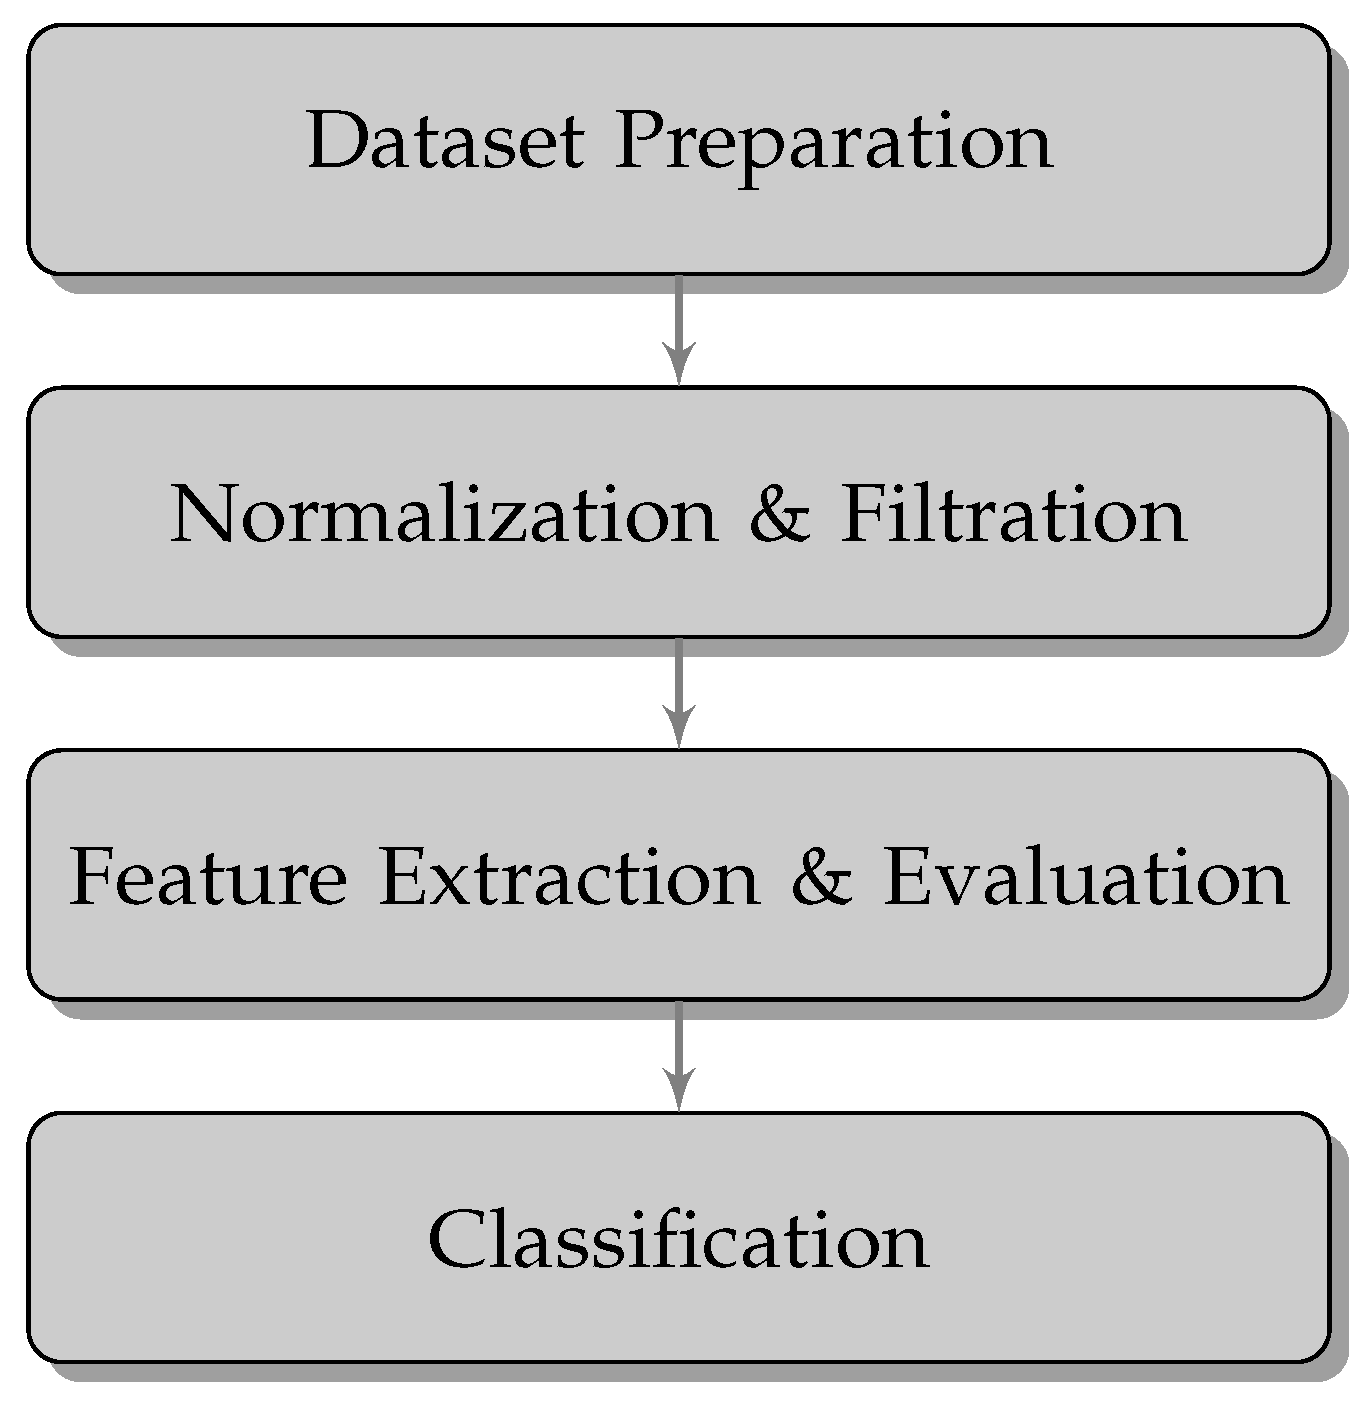
2.2.1. Data Preparation
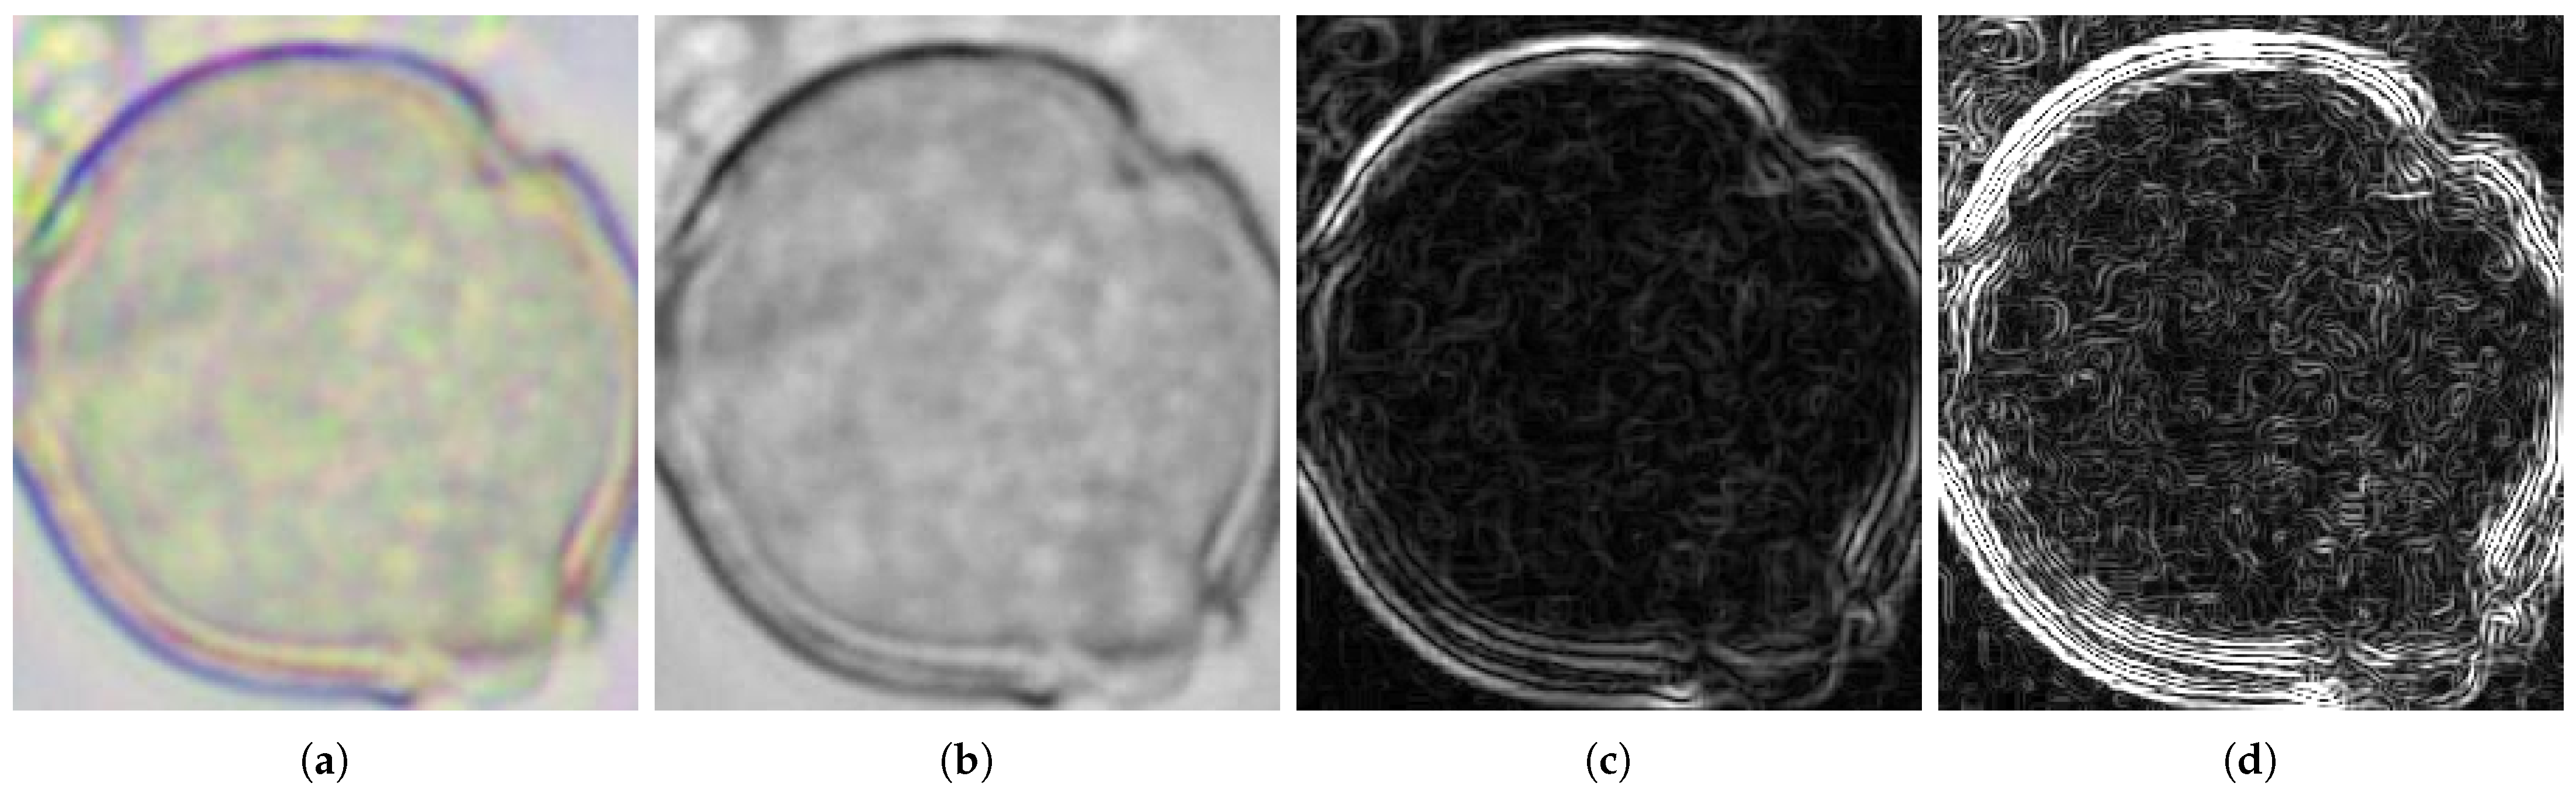
2.2.2. Normalization and Filtration
2.2.3. Feature Extraction and Evaluation
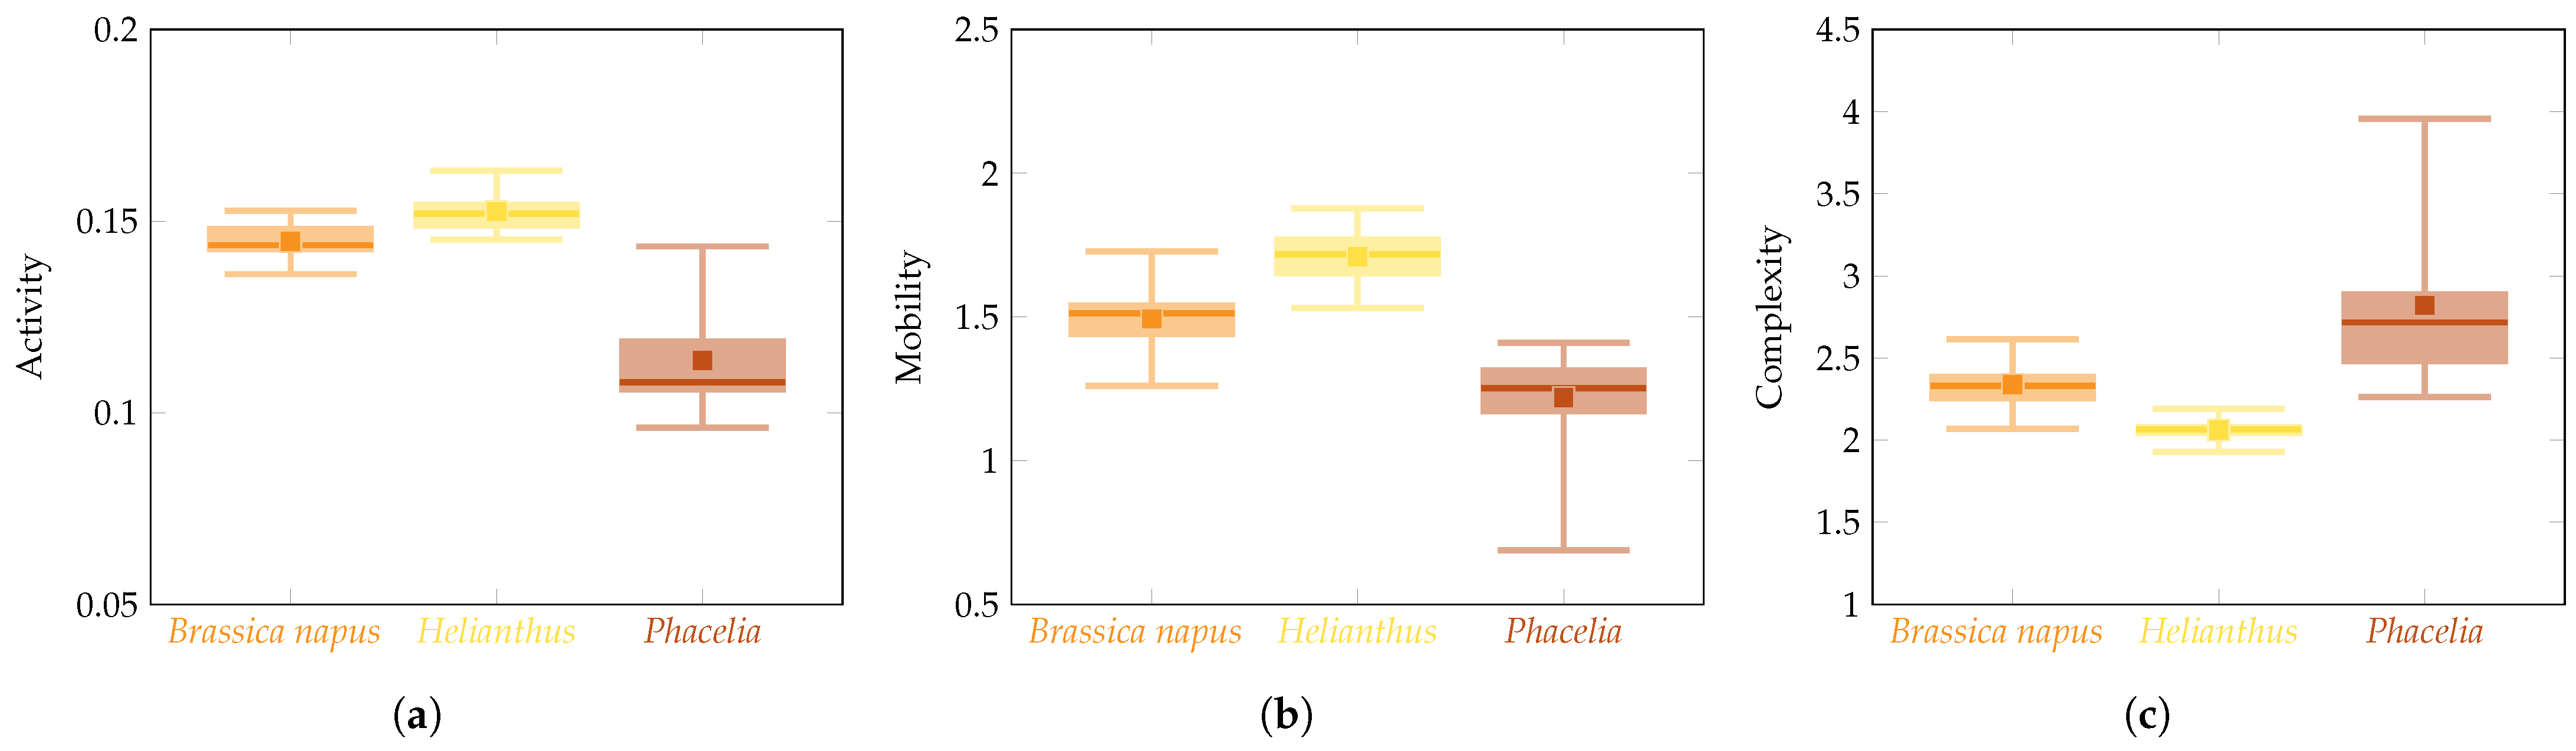
Hjorth’s Descriptors
2.2.4. Implementation
2.2.5. Statistical Approach to Bee Pollen Type Differentiation
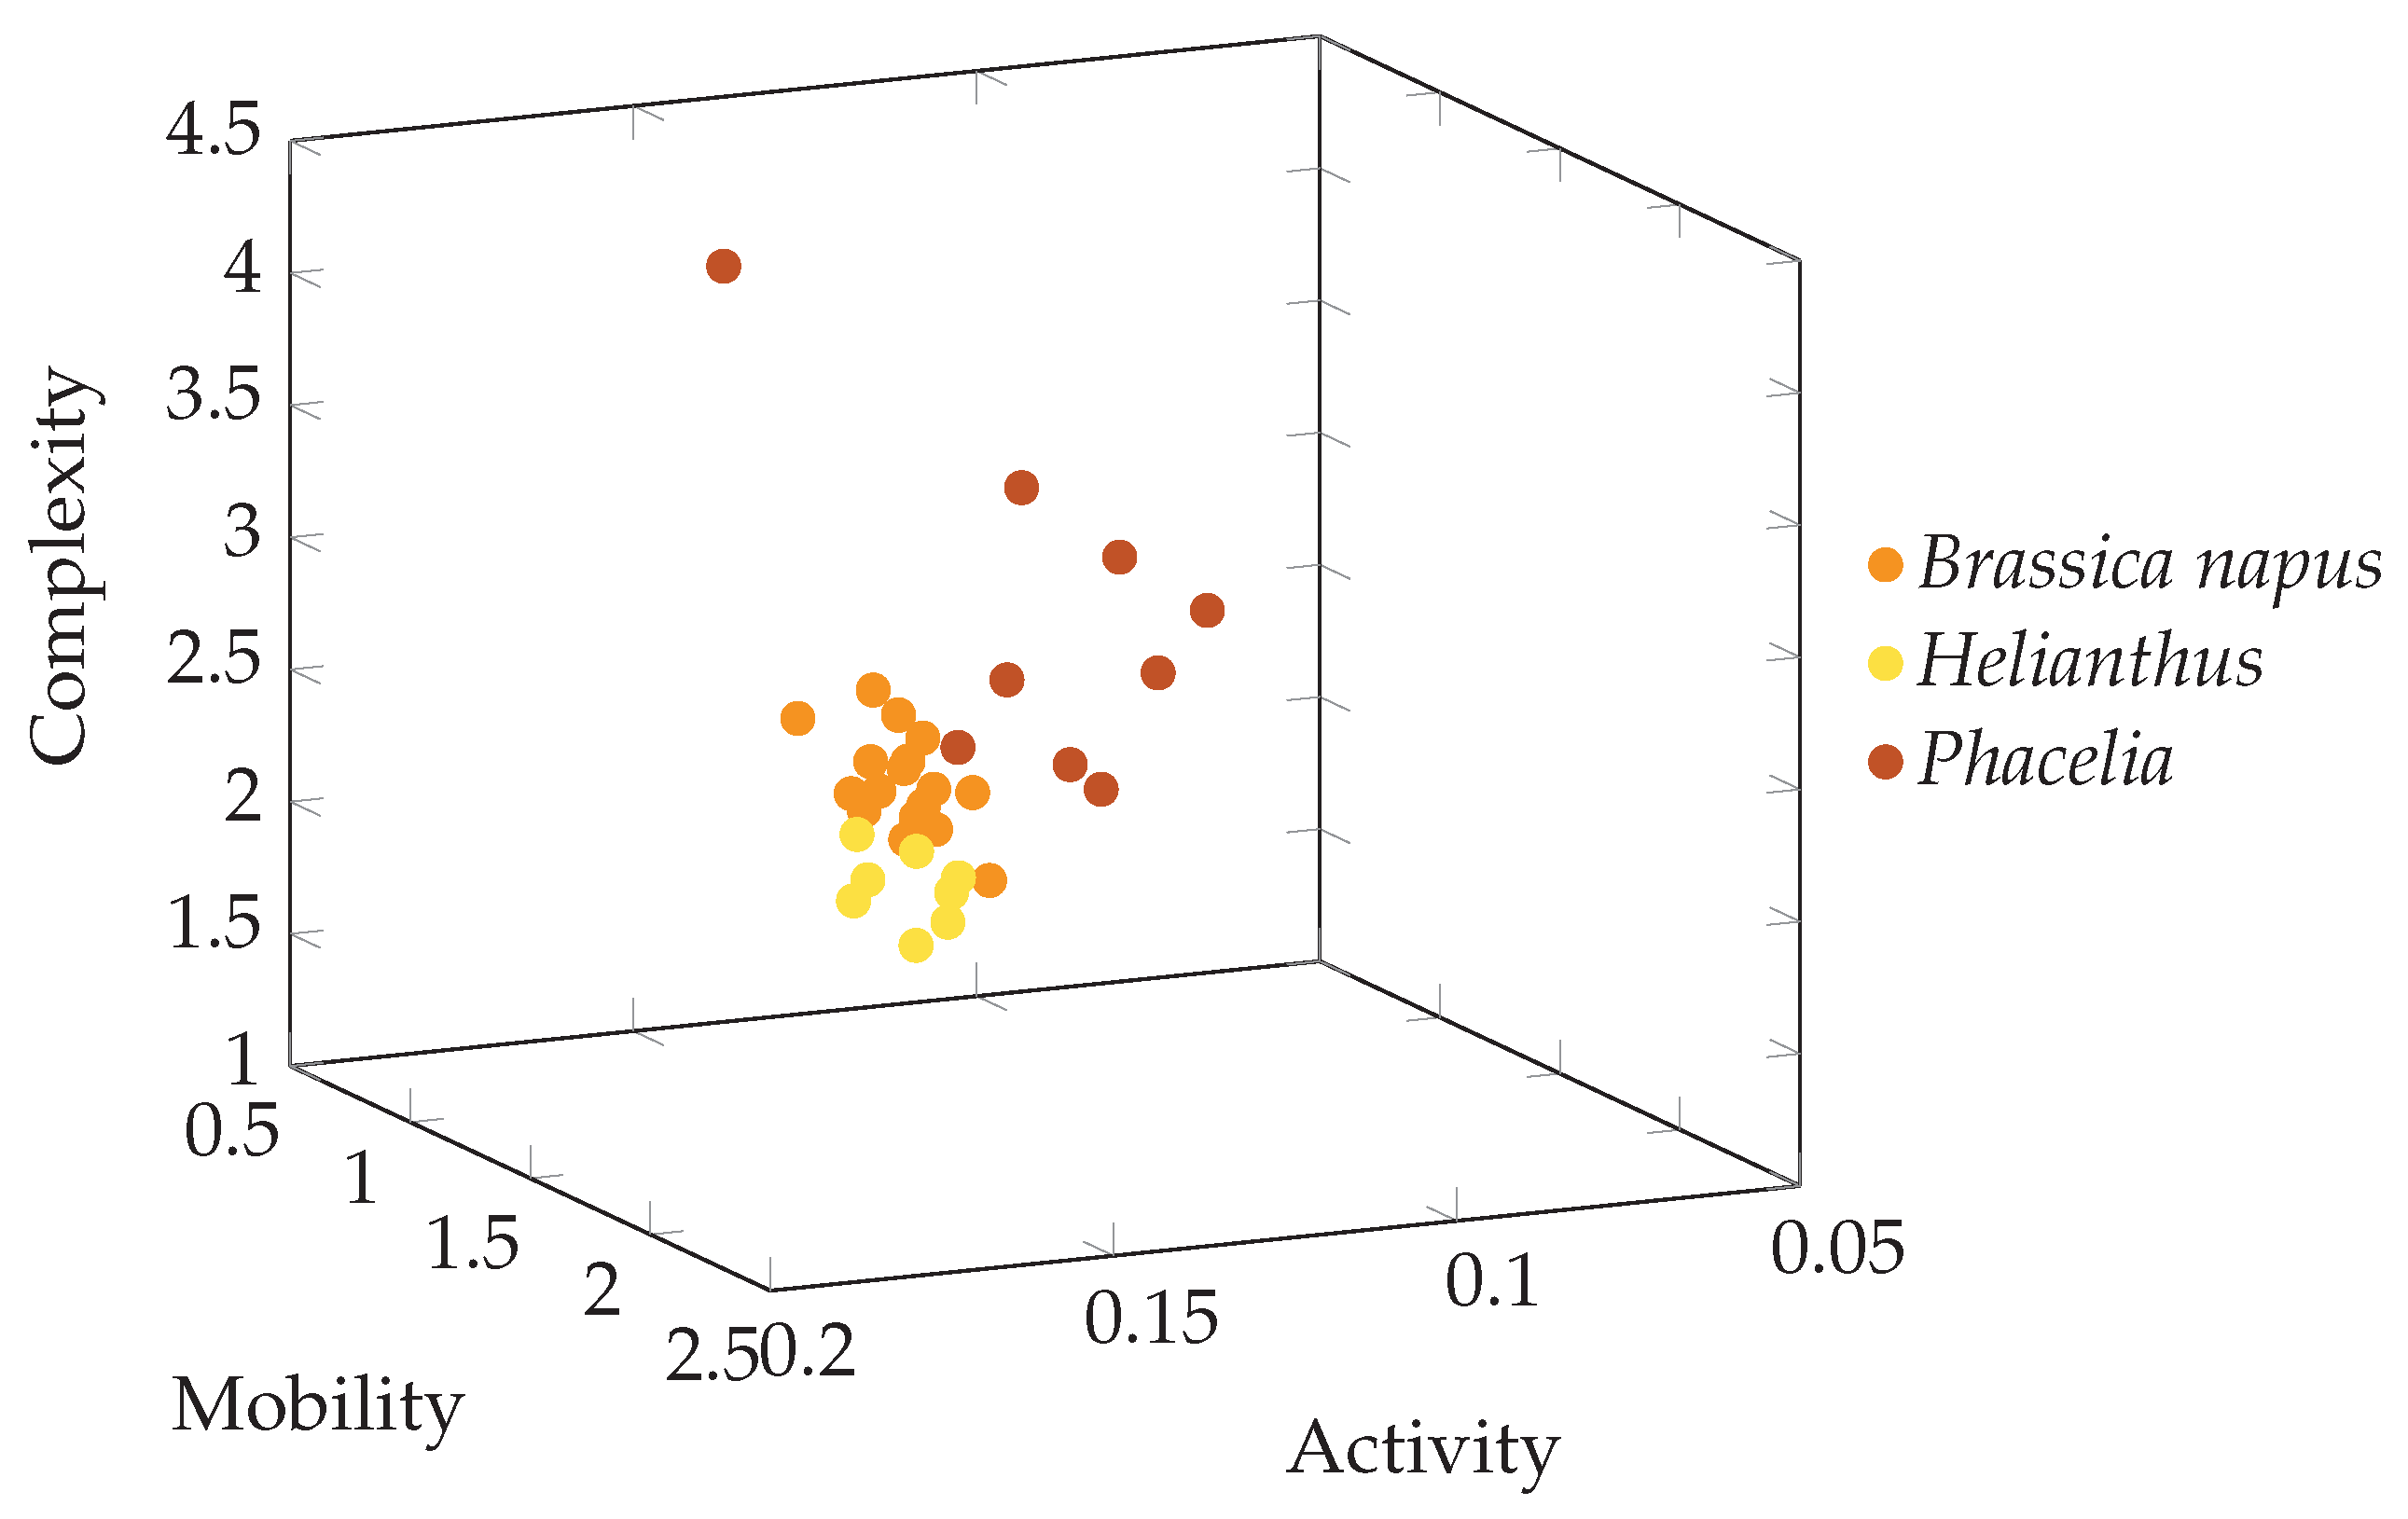
3. Results
4. Discussion
5. Conclusions
Author Contributions
Funding
Institutional Review Board Statement
Informed Consent Statement
Data Availability Statement
Acknowledgments
Conflicts of Interest
References
- Puścion-Jakubik, A.; Borawska, M. Odmianowe miody pszczele—Pyłki główne i towarzyszące jako podstawa ich zaklasyfikowania. Probl. Hig. Epidemiol. 2015, 97, 275–278. [Google Scholar]
- Ministry for Primary Industries. Criteria for Identifying Manuka Honey; New Zealand Ministry for Primary Industries: Wellington, New Zealand, 2017.
- Alshallash, K.S.; Abolaban, G.; Elhamamsy, S.M.; Zaghlool, A.; Nasr, A.; Nagib, A.; El-Hakim, A.F.A.; Zahra, A.A.; Hamdy, A.E.; Taha, I. Bee Pollen as a Functional Product–Chemical Constituents and Nutritional Properties. J. Ecol. Eng. 2023, 24, 173–183. [Google Scholar] [CrossRef]
- European Commission. Coordinated Control Plan to Establish the Prevalence of Fraudulent Practices in the Marketing of Honey. 2015. Available online: https://food.ec.europa.eu/system/files/2016-10/official-controls_food-fraud_honey_control-plan-outline_201512.pdf (accessed on 8 June 2024).
- Hjorth, B. EEG analysis based on time domain properties. Electroencephalogr. Clin. Neurophysiol. 1970, 29, 306–310. [Google Scholar] [CrossRef]
- Feradov, F.; Markova, V.; Ganchev, T. Automated Detection of Improper Sitting Postures in Computer Users Based on Motion Capture Sensors. Computers 2022, 11, 116. [Google Scholar] [CrossRef]
- Kacemi, R.; Campos, M.G. Translational Research on Bee Pollen as a Source of Nutrients: A Scoping Review from Bench to Real World. Nutrients 2023, 15, 2413. [Google Scholar] [CrossRef]
- Campos, M.G.; Frigerio, C.; Bobis, O.; Urcan, A.C.; Gomes, N.G.M. Infrared irradiation drying impact on bee pollen: Case study on the phenolic composition of Eucalyptus globulus labill and Salix atrocinerea Brot. pollens. Processes 2021, 9, 890. [Google Scholar] [CrossRef]
- Campos, M.G.; Anjos, O.; Chica, M.; Campoy, P.; Nozkova, J.; Almaraz-Abarca, N.; Barreto, L.M.R.C.; Nordi, J.C.; Estevinho, L.M.; Pascoal, A.; et al. Standard methods for pollen research. J. Apic. Res. 2021, 60, 1–109. [Google Scholar] [CrossRef]
- Matuszewska, E.; Plewa, S.; Pietkiewicz, D.; Kossakowski, K.; Matysiak, J.; Rosinski, G.; Matysiak, J. Mass Spectrometry-Based Identification of Bioactive Bee Pollen Proteins: Evaluation of Allergy Risk after Bee Pollen Supplementation. Molecules 2022, 27, 7733. [Google Scholar] [CrossRef]
- Kostic, A.Ž.; Milinčić, D.D.; Barać, M.B.; Shariati, M.A.; Tešić, L.; Pešić, M.B. The Application of Pollen as a Functional Food and Feed Ingredient-The Present and Perspectives. Biomolecules 2020, 10, 84. [Google Scholar] [CrossRef]
- Baky, M.H.; Abouelela, M.B.; Wang, K.; Farag, M.A. Bee Pollen and Bread as a Super-Food: A Comparative Review of Their Metabolome Composition and Quality Assessment in the Context of Best Recovery Conditions. Molecules 2023, 28, 715. [Google Scholar] [CrossRef]
- Chelucci, E.; Chiellini, C.; Cavallero, A.; Gabriele, M. Bio-Functional Activities of Tuscan Bee Pollen. Antioxidants 2023, 12, 115. [Google Scholar] [CrossRef] [PubMed]
- Qiao, J.; Feng, Z.; Zhang, Y.; Xiao, X.; Dong, J.; Haubruge, E.; Zhang, H. Phenolamide and flavonoid glycoside profiles of 20 types of monofloral bee pollen. Food Chem. 2023, 405, 134800. [Google Scholar] [CrossRef] [PubMed]
- Xue, F.; Li, C. Effects of ultrasound assisted cell wall disruption on physicochemical properties of camellia bee pollen protein isolates. Ultrason. Sonochem. 2023, 92, 106249. [Google Scholar] [CrossRef]
- Han, S.; Chen, L.; Zhang, Y.; Xie, S.; Yang, J.; Su, S.; Yao, H.; Shi, P. Lotus Bee Pollen Extract Inhibits Isoproterenol-Induced Hypertrophy via JAK2/STAT3 Signaling Pathway in Rat H9c2 Cells. Antioxidants 2022, 12, 88. [Google Scholar] [CrossRef]
- ISO 24382:2023; Bee Pollen, Edition 1. International Organization for Standardization: Geneva, Switzerland, 2023. Available online: https://www.iso.org/standard/78544.html?browse=tc (accessed on 8 June 2024).
- El-Seedi, H.R.; Khalifa, S.A.M.; El-Wahed, A.A.; Gao, R.; Guo, Z.; Tahir, H.E.; Zhao, C.; Du, M.; Farag, M.A.; Musharraf, S.G.; et al. Honeybee products: An updated review of neurological actions. Trends Food Sci. Technol. 2020, 101, 17–27. [Google Scholar] [CrossRef]
- Camacho-Bernal, G.I.; Cruz-Cansino, N.d.S.; Ramírez-Moreno, E.; Delgado-Olivares, L.; Zafra-Rojas, Q.Y.; Castañeda-Ovando, A.; Suárez-Jacobo, Á. Addition of Bee Products in Diverse Food Sources: Functional and Physicochemical Properties. Appl. Sci. 2021, 11, 8156. [Google Scholar] [CrossRef]
- Xi, X.; Li, J.; Guo, S.; Li, Y.; Xu, F.; Zheng, M.; Cao, H.; Cui, X.; Guo, H.; Han, C. The Potential of Using Bee Pollen in Cosmetics: A Review. J. Oleo Sci. 2018, 67, 1071–1082. [Google Scholar] [CrossRef]
- Lu, P.; Takiguchi, S.; Honda, Y.; Lu, Y.; Mitsui, T.; Kato, S.; Kodera, R.; Furihata, K.; Zhang, M.; Okamoto, K.; et al. NMR and HPLC profiling of bee pollen products from different countries. Food Chem. Mol. Sci. 2022, 5, 100119. [Google Scholar] [CrossRef]
- Tao, Y.; Zhou, E.; Li, F.; Meng, L.; Li, Q.; Wu, L. Allergenicity Alleviation of Bee Pollen by Enzymatic Hydrolysis: Regulation in Mice Allergic Mediators, Metabolism, and Gut Microbiota. Foods 2022, 11, 3454. [Google Scholar] [CrossRef]
- Von Der Ohe, W.; Oddo, L.P.; Piana, M.L.; Morlot, M.; Martin, P. Harmonized methods of melissopalynology. Apidologie 2004, 35, S18–S25. [Google Scholar] [CrossRef]
- PN-88/A-77626; Miód Pszczeli. Polski Komitet Normalizacyjny: Warsaw, Poland, 1988.
- CELEX-32001L0110-PL-TXT; Council Directive 2001/110/EC of 20 December 2001 Relating to Honey. Council of the European Union: Brussels, Belgium, 2001.
- Potrimba, P. What Is ResNet-50? Available online: https://blog.roboflow.com/what-is-resnet-50/ (accessed on 16 July 2024).
- Huang, G.; Liu, Z.; Van Der Maaten, L.; Weinberger, K.Q. Densely Connected Convolutional Networks. In Proceedings of the IEEE Conference on Computer Vision and Pattern Recognition (CVPR), Honolulu, HI, USA, 21–26 July 2017; pp. 2261–2269. [Google Scholar] [CrossRef]
- Yang, C.; An, Z.; Zhu, H.; Hu, X.; Zhang, K.; Xu, K.; Li, C.; Xu, Y. Gated Convolutional Networks with Hybrid Connectivity for Image Classification. Proc. AAAI Conf. Artif. Intell. 2020, 34, 12581–12588. [Google Scholar] [CrossRef]
- Smith, S.W. The Scientist and Engineer’s Guide to Digital Signal Processing; California Technical Publishing: San Diego, CA, USA, 1997. [Google Scholar]
- Cocconcelli, M.; Strozzi, M.; Cavalaglio Camargo Molano, J.; Rubini, R. Detectivity: A combination of Hjorth’s parameters for condition monitoring of ball bearings. Mech. Syst. Signal Process. 2022, 164, 108247. [Google Scholar] [CrossRef]

| Hjorth Descriptors Variable | Normal Distribution Shapiro–Wilk Test p-Value | Homogeneity of Variance Levene Test p-Value |
|---|---|---|
| Activity | 0.000177 | 0.001101 |
| Mobility | 0.017085 | 0.031298 |
| Complexity | 0.000026 | 0.000900 |
| Statistical Test | Hjorth Descriptors | Effect | Error | F | p | ||||
|---|---|---|---|---|---|---|---|---|---|
| SS | df | MS | SS* | df* | MS* | ||||
| Levene | Activity | 0.000395 | 2 | 0.000197 | 0.000744 | 32 | 0.000023 | 8.491422 | 0.001101 |
| Mobility | 0.079244 | 2 | 0.039622 | 0.327807 | 32 | 0.010244 | 3.867815 | 0.031298 | |
| Complexity | 0.563294 | 2 | 0.281647 | 1.023957 | 32 | 0.031999 | 8.801832 | 0.000900 | |
| Hjorth Descriptors | Group | Group Size | Rank Sum | Rank Average | Kruskal–Wallis | |
|---|---|---|---|---|---|---|
| Test Value | p-Value | |||||
| Activity | Brassica napus | 18 | 348 | 19.333 | 21.478 | 0.00001 |
| Helianthus | 8 | 229 | 28.625 | |||
| Phacelia | 9 | 53 | 5.888 | |||
| Mobility | Brassica napus | 18 | 310 | 17.222 | 19.004 | 0.0001 |
| Helianthus | 8 | 242 | 30.250 | |||
| Phacelia | 9 | 78 | 8.666 | |||
| Complexity | Brassica napus | 18 | 339 | 18.833 | 20.944 | 0.00001 |
| Helianthus | 8 | 41 | 5.125 | |||
| Phacelia | 9 | 250 | 27.777 | |||
| (a) Activity | |||
| Group | Brassica napus | Helianthus | Phacelia |
| RA = 19.333 | RA = 28.625 | RA = 5.888 | |
| Brassica napus | 0.098529 | 0.003929 | |
| Helianthus | 0.098529 | 0.000015 | |
| Phacelia | 0.003929 | 0.000015 | |
| (b) Mobility | |||
| Group | Brassica napus | Helianthus | Phacelia |
| RA = 17.222 | RA = 30.250 | RA = 8.666 | |
| Brassica napus | 0.008313 | 0.122515 | |
| Helianthus | 0.008313 | 0.000044 | |
| Phacelia | 0.122515 | 0.000044 | |
| (c) Complexity | |||
| Group | Brassica napus | Helianthus | Phacelia |
| RA = 18.833 | RA = 5.125 | RA = 27.777 | |
| Brassica napus | 0.004926 | 0.097518 | |
| Helianthus | 0.004926 | 0.000016 | |
| Phacelia | 0.097518 | 0.000016 | |
Disclaimer/Publisher’s Note: The statements, opinions and data contained in all publications are solely those of the individual author(s) and contributor(s) and not of MDPI and/or the editor(s). MDPI and/or the editor(s) disclaim responsibility for any injury to people or property resulting from any ideas, methods, instructions or products referred to in the content. |
© 2024 by the authors. Licensee MDPI, Basel, Switzerland. This article is an open access article distributed under the terms and conditions of the Creative Commons Attribution (CC BY) license (https://creativecommons.org/licenses/by/4.0/).
Share and Cite
Tkacz, E.; Rujna, P.; Więcławek, W.; Lewandowski, B.; Mika, B.; Sieciński, S. Application of 2D Extension of Hjorth’s Descriptors to Distinguish Defined Groups of Bee Pollen Images. Foods 2024, 13, 3193. https://doi.org/10.3390/foods13193193
Tkacz E, Rujna P, Więcławek W, Lewandowski B, Mika B, Sieciński S. Application of 2D Extension of Hjorth’s Descriptors to Distinguish Defined Groups of Bee Pollen Images. Foods. 2024; 13(19):3193. https://doi.org/10.3390/foods13193193
Chicago/Turabian StyleTkacz, Ewaryst, Przemysław Rujna, Wojciech Więcławek, Bartosz Lewandowski, Barbara Mika, and Szymon Sieciński. 2024. "Application of 2D Extension of Hjorth’s Descriptors to Distinguish Defined Groups of Bee Pollen Images" Foods 13, no. 19: 3193. https://doi.org/10.3390/foods13193193
APA StyleTkacz, E., Rujna, P., Więcławek, W., Lewandowski, B., Mika, B., & Sieciński, S. (2024). Application of 2D Extension of Hjorth’s Descriptors to Distinguish Defined Groups of Bee Pollen Images. Foods, 13(19), 3193. https://doi.org/10.3390/foods13193193