
Oat Kilning and Its Effects on Liquid Oat-Base Production

 , , ,
, , ,  and
and
Abstract
:
1. Introduction
2. Materials and Methods
2.1. Materials
2.1.1. Chemicals
2.1.2. Oats
2.2. Storage
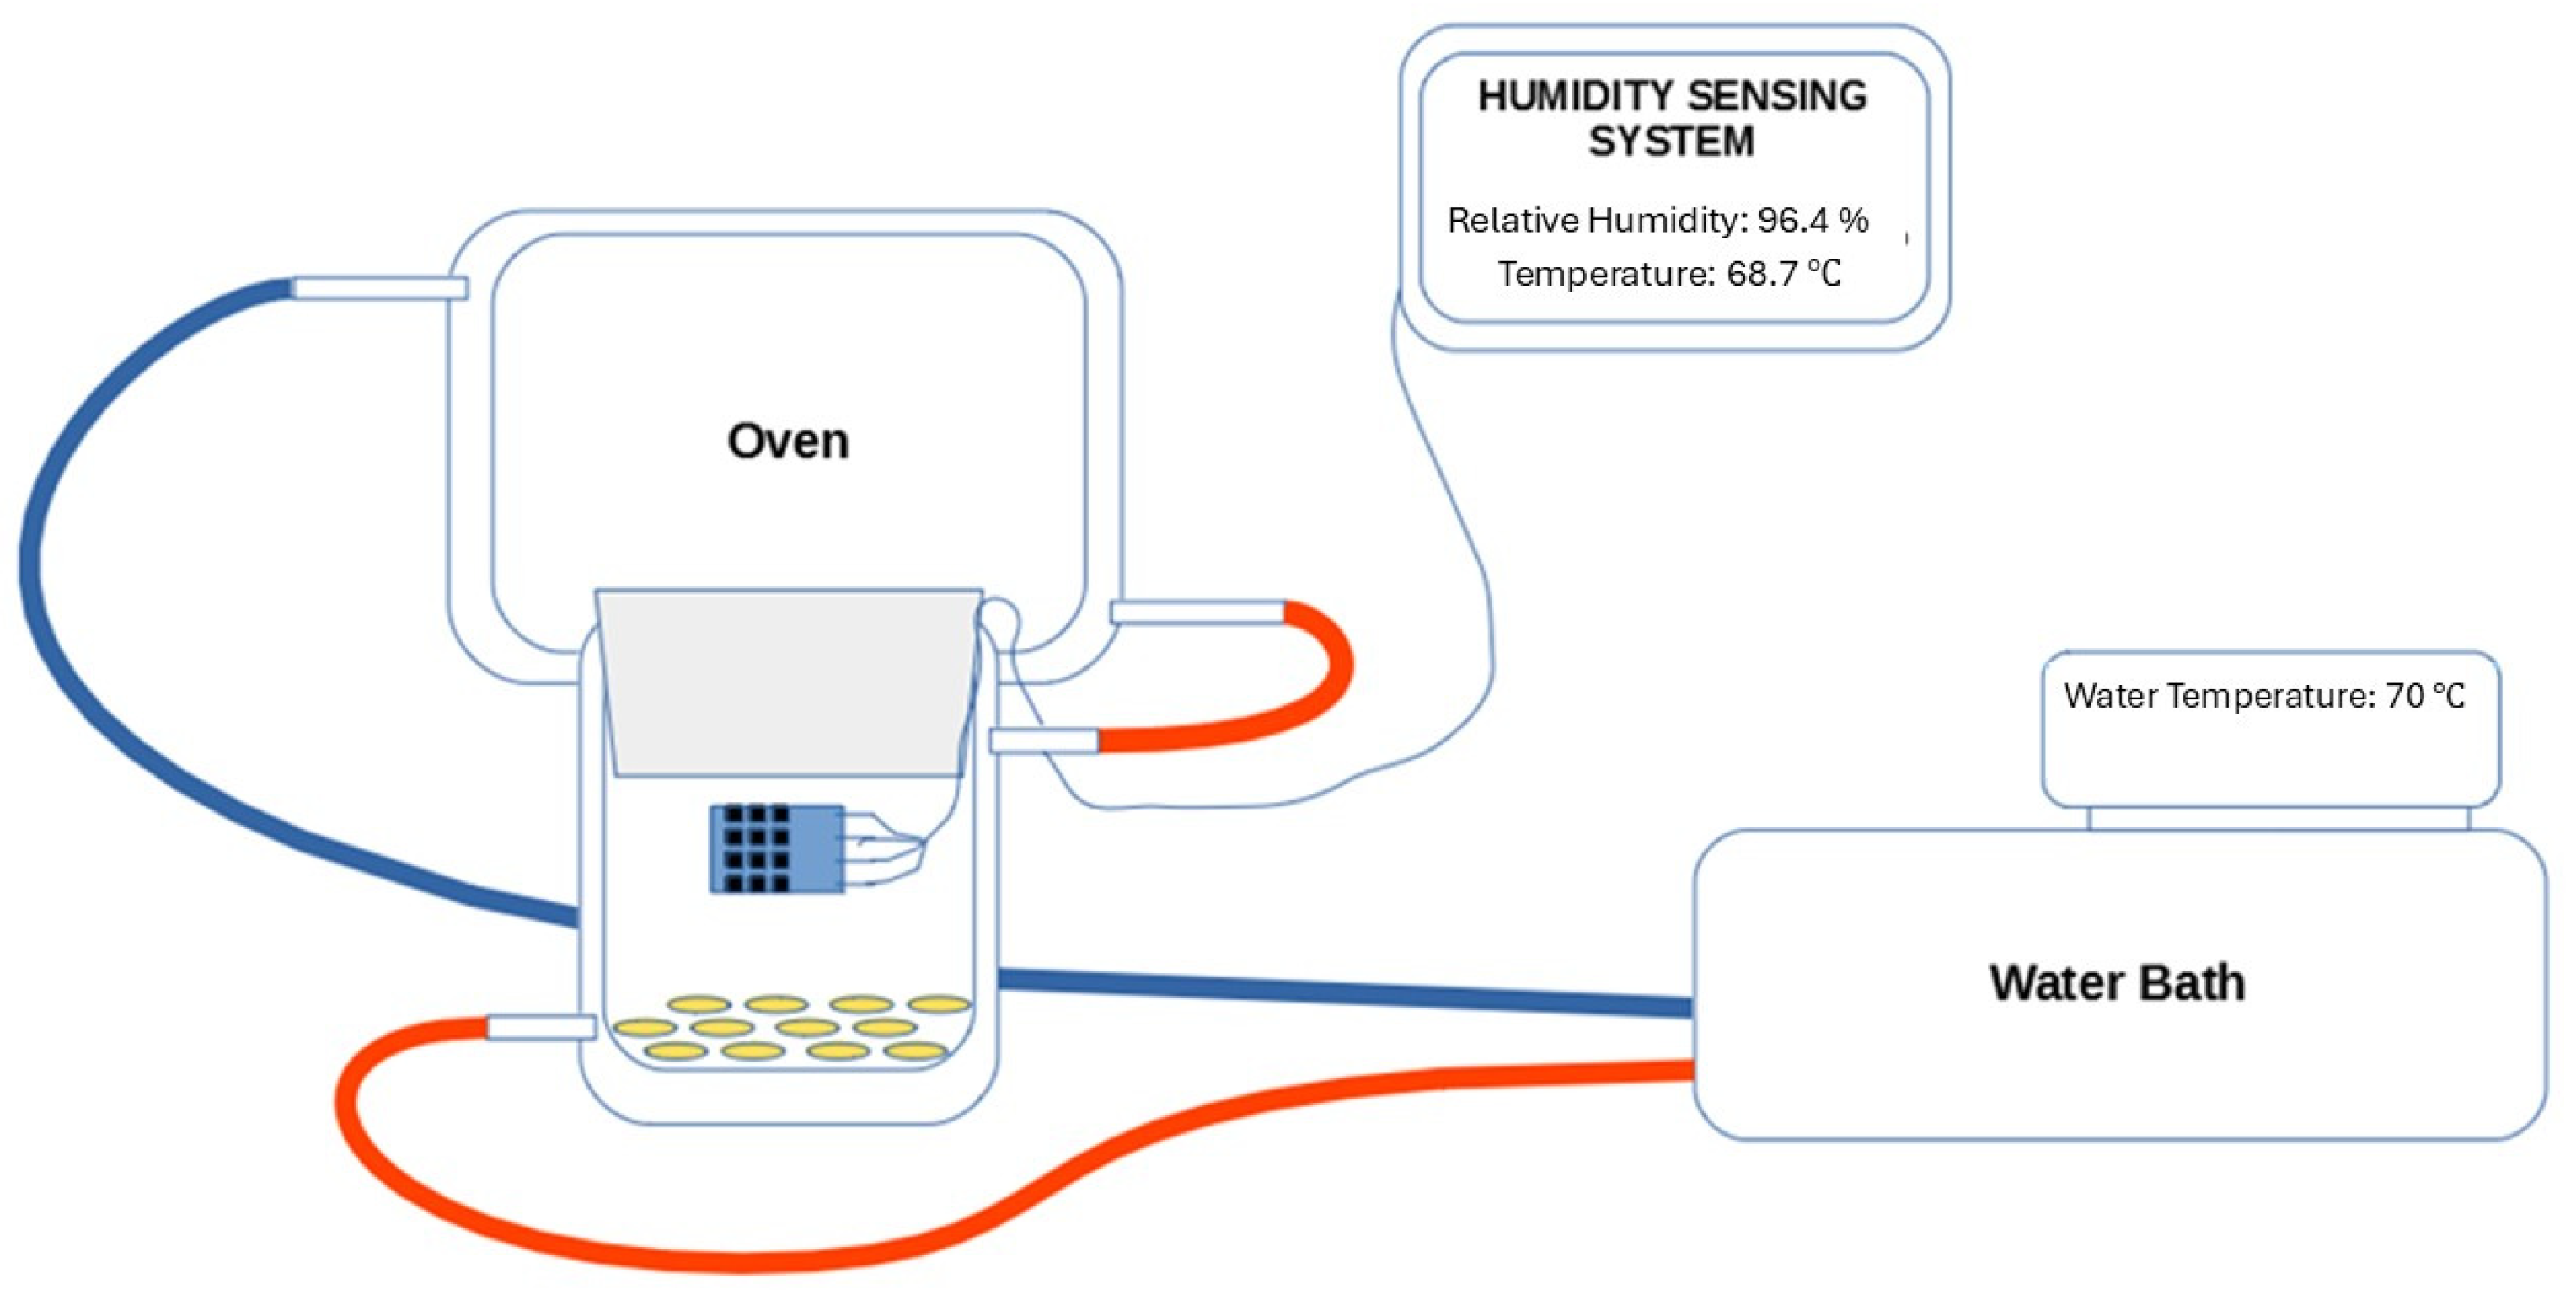
2.3. Kilning
2.4. Determination of Water Activity
2.5. Determination of Moisture Content
2.6. Determination of Colour
2.6.1. Spectrophotometric Measurement
2.6.2. RGB Analysis
2.7. Determination of Lipase Activity
2.8. Determination of Peroxide Value
2.9. Determination of Protein Solubility
2.10. Preparation of Oat-Base
2.11. Determination of Total Protein of Oat-Base
2.12. Sensory Evaluation
2.13. Statistics
3. Results
3.1. Effects of Storage
3.1.1. Moisture Content and Water Activity During Storage
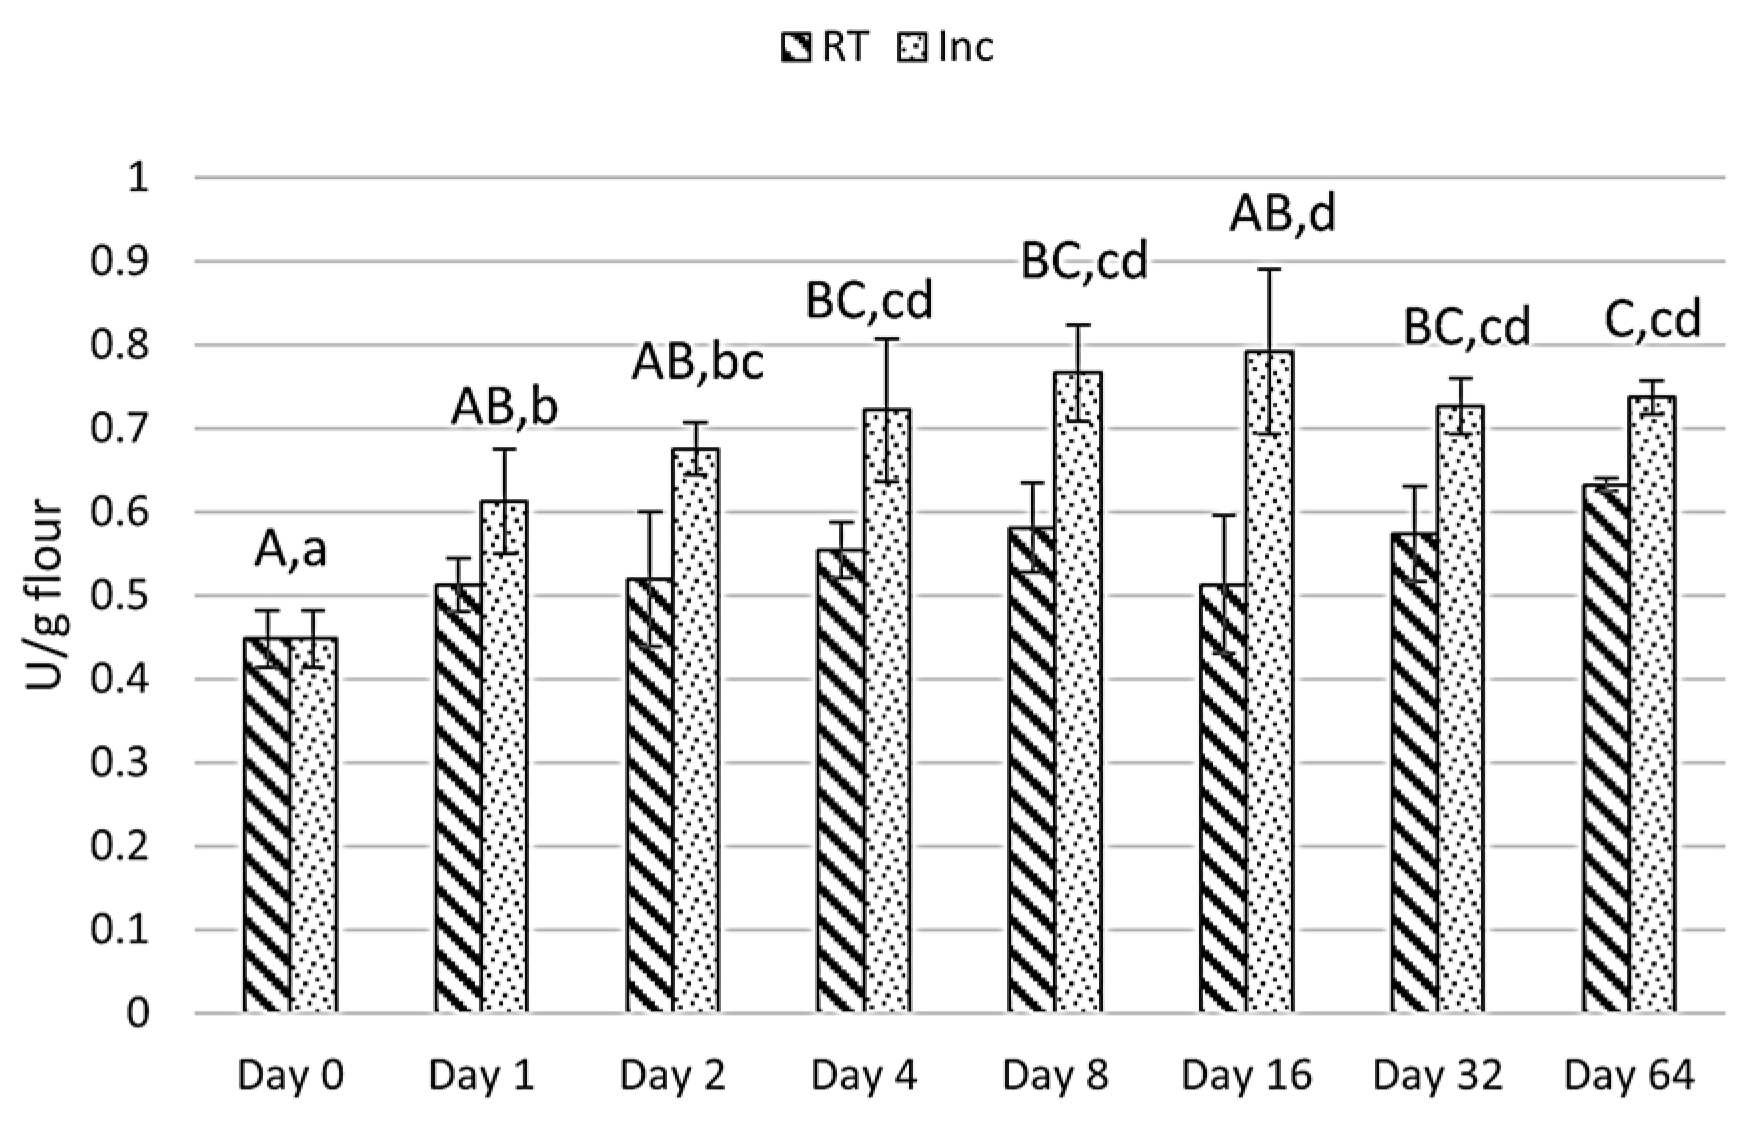
3.1.2. Lipase Activity During Storage
3.1.3. Color Change During Storage
3.1.4. Peroxide Value During Storage
3.2. Effects of Kilning
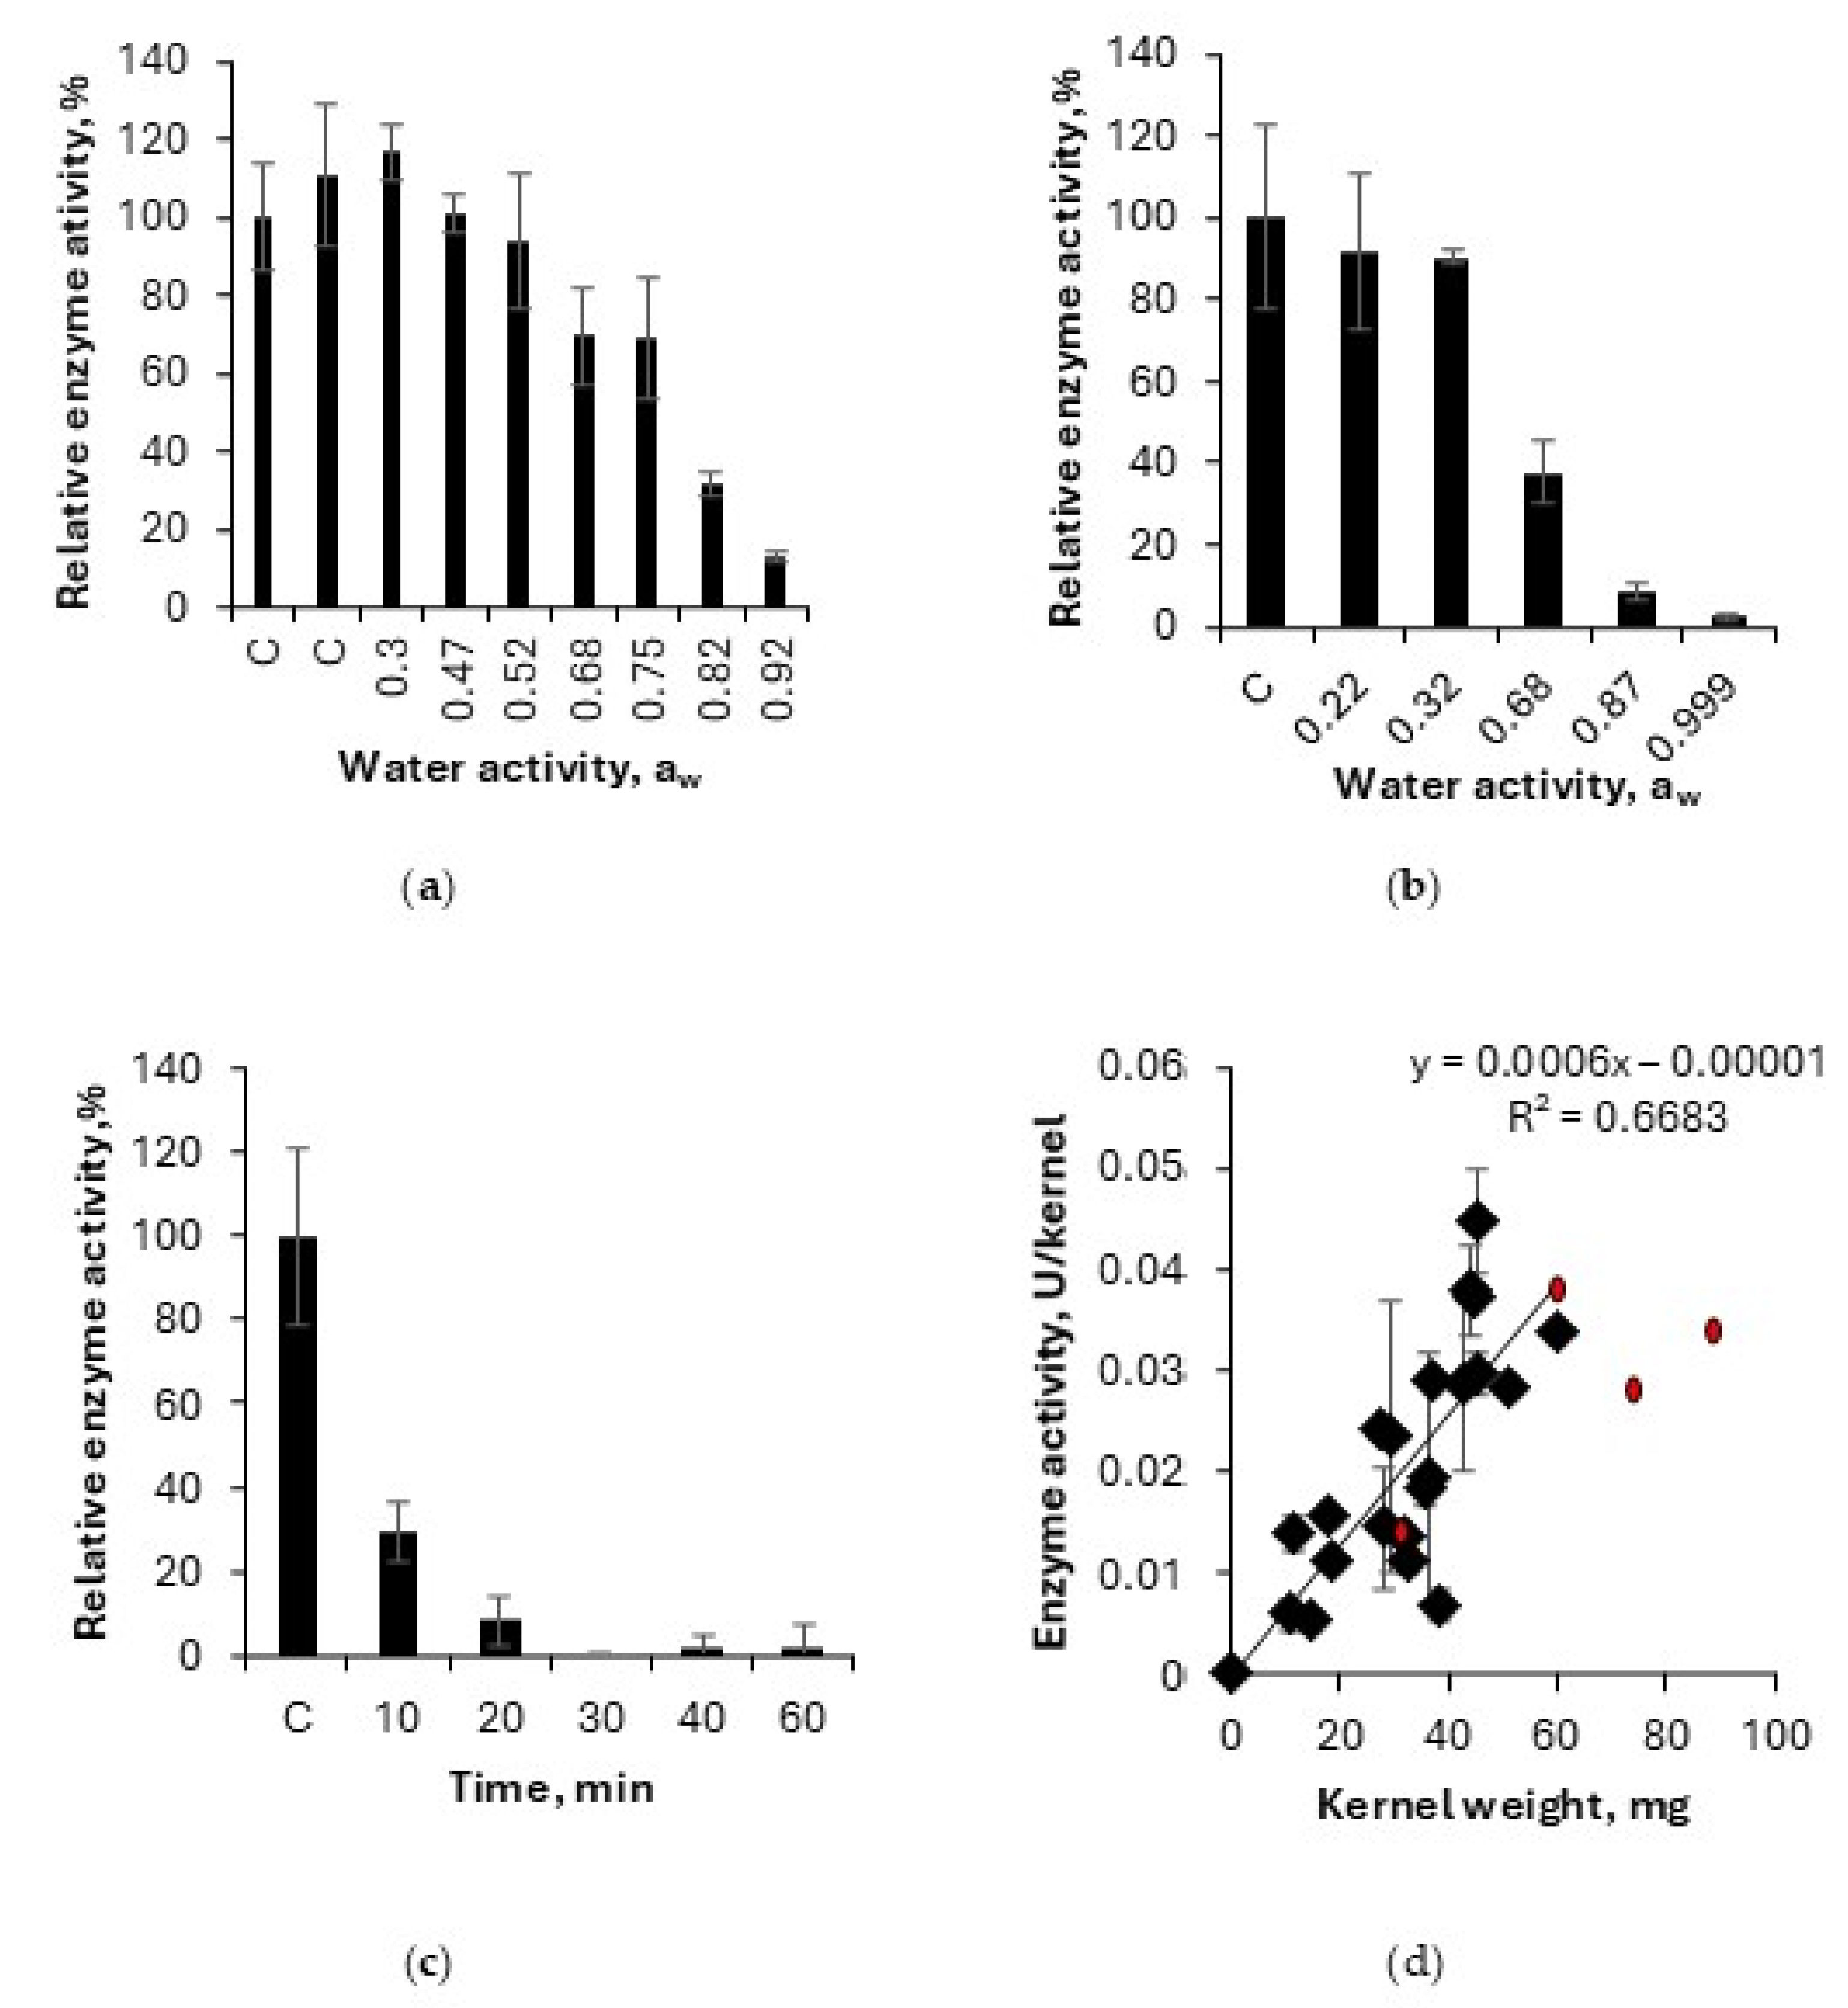
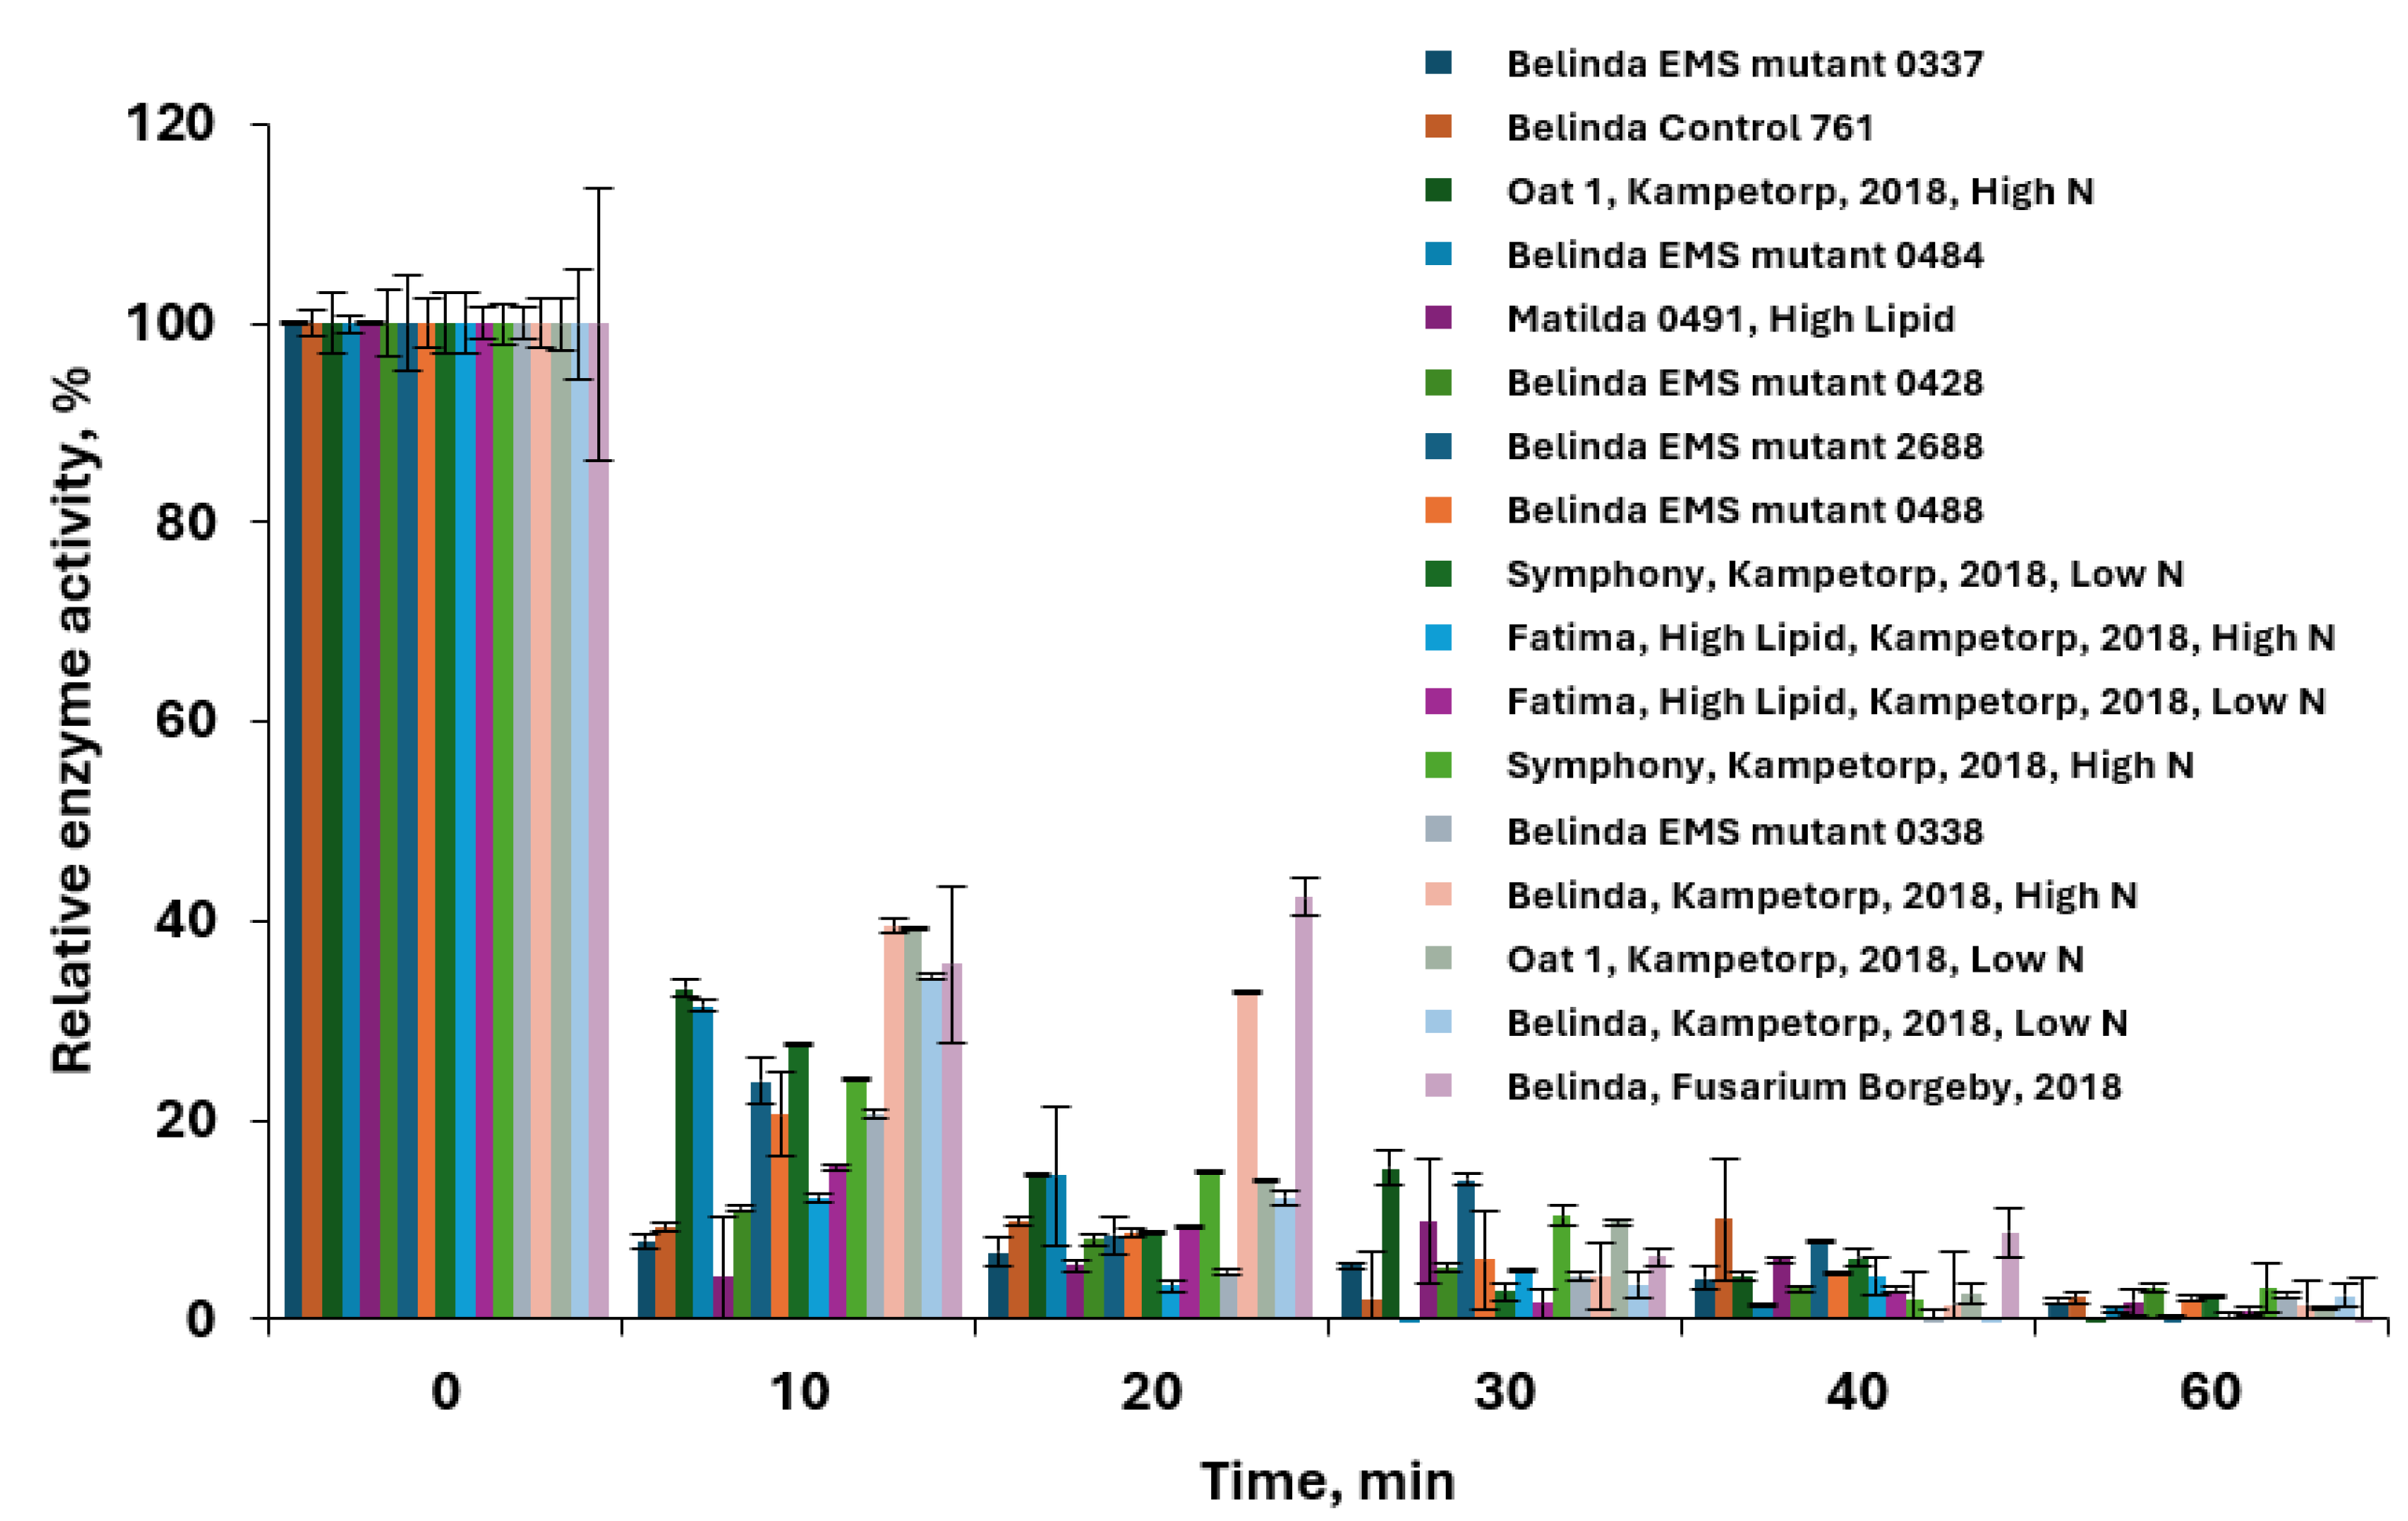
3.2.1. Kinetic Study of Lipase Deactivation
3.2.2. Effect of Steam Oven Kilning on Lipase Activity
3.2.3. Protein Solubility
3.2.4. Moisture Content and Water Activity
3.2.5. Color
3.3. Oat-Base Results
3.3.1. Total Protein in the Oat Flour
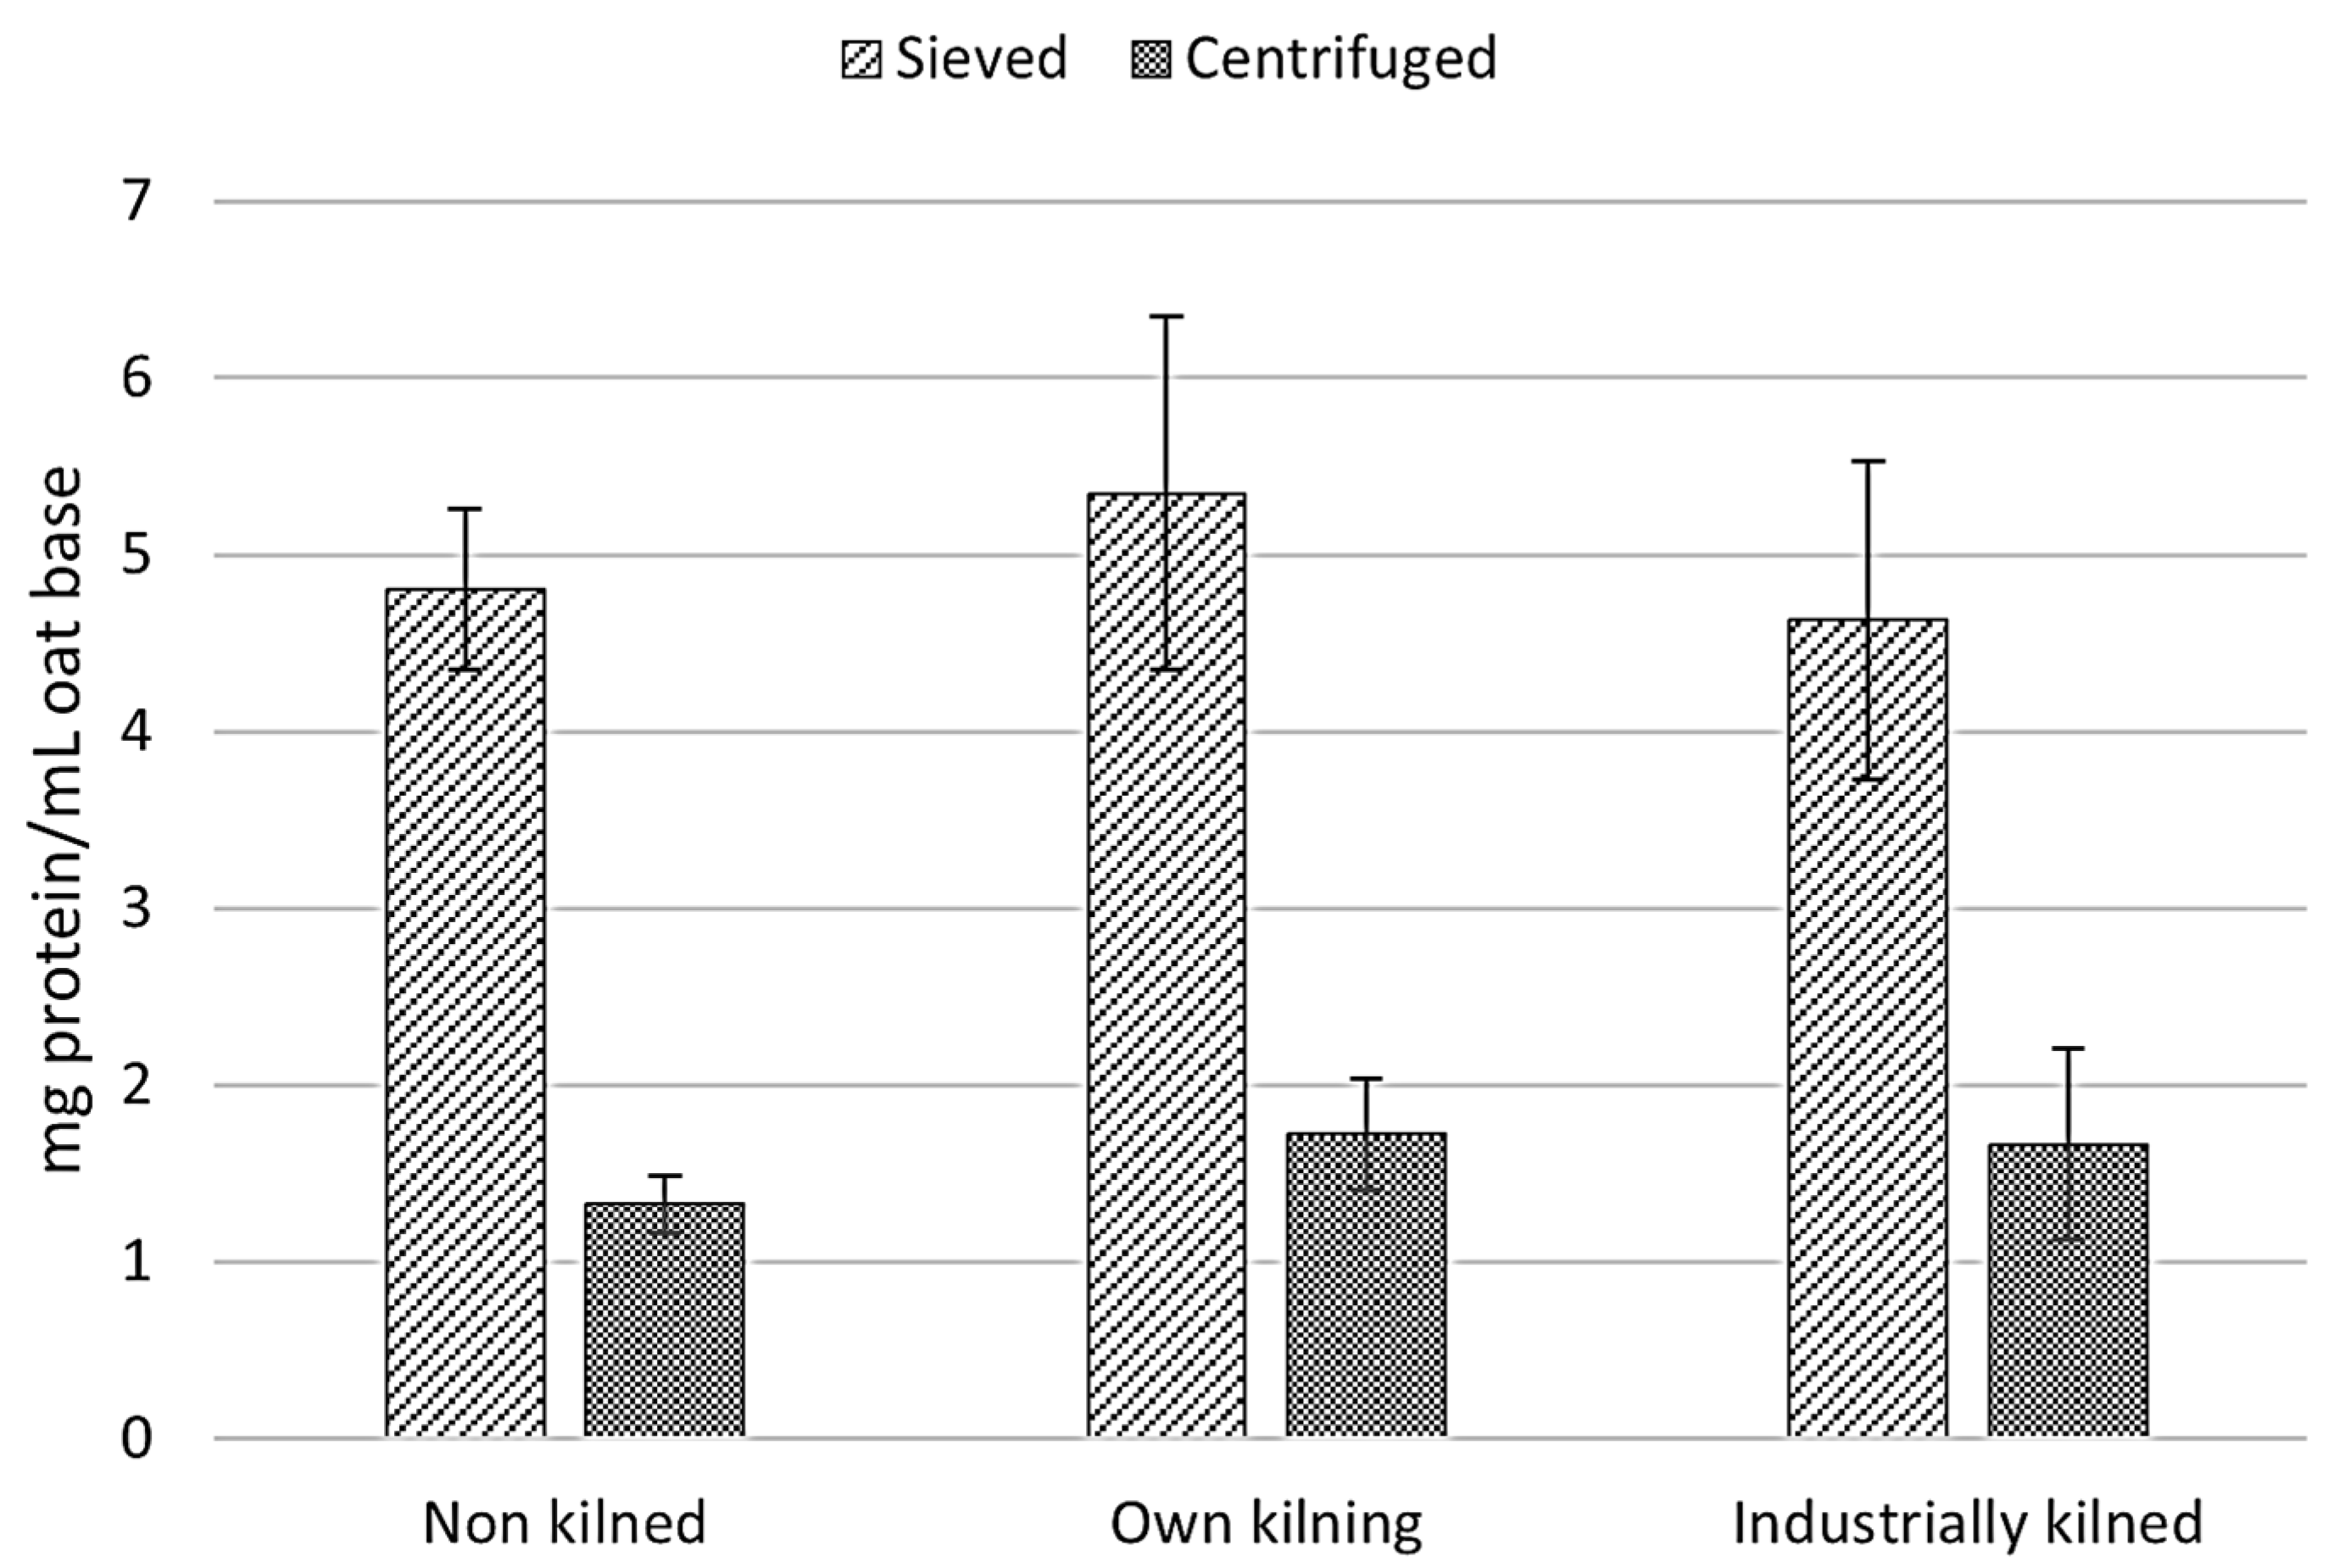
3.3.2. Separation Method of Solids for Oat-Base Production
3.3.3. Moisture Content of the Oat-Bases
3.3.4. Protein Content in the Oat-Bases
3.3.5. Viscosity Measurements
3.3.6. Sensory Properties
4. Discussion
4.1. Storage Stability of Dehulled, Non-Kilned Oats
4.2. Effect of Kilning on Oats
4.2.1. Lipase Inactivation Using Miniaturized Oven and Steam Oven
4.2.2. Effect of Kilning on Protein Solubility
4.3. Oat-Base Production
4.4. Sensory Aspects
5. Conclusions
Supplementary Materials
Author Contributions
Funding
Institutional Review Board Statement
Informed Consent Statement
Data Availability Statement
Conflicts of Interest
References
- Head, D.S.; Cenkowski, S.; Arntfield, S.; Henderson, K. Superheated steam processing of oat groats. LWT–Food Sci. Technol. 2010, 43, 690–694. [Google Scholar] [CrossRef]
- Rasane, P.; Jha, A.; Sabikhi, L.; Kumar, A.; Unnikrishnan, V.S. Nutritional advantages of oats and opportunities for its processing as value added foods—A review. J. Food Sci. Technol. 2015, 52, 662–675. [Google Scholar] [CrossRef]
- Tosh, S.M.; Miller, S.S. Oats. In Encyclopedia of Food and Health; Caballero, B., Finglas, P.M., Toldrá, F., Eds.; Academic Press: Oxford, UK, 2016; pp. 119–125. [Google Scholar]
- Londono, D.M.; Smulders, M.J.M.; Visser, R.G.F.; Gilissen, L.J.W.J.; Hamer, R.J. Effect of kilning and milling on the dough-making properties of oat flour. LWT—Food Sci. Technol. 2015, 63, 960–965. [Google Scholar] [CrossRef]
- Runyon, J.R.; Sunilkumar, B.A.; Nilsson, L.; Rascon, A.; Bergenståhl, B. The effect of heat treatment on the soluble protein content of oats. J. Cereal Sci. 2015, 65, 119–124. [Google Scholar] [CrossRef]
- Meydani, M. Potential health benefits of avenanthramides of oats. Nutr. Rev. 2009, 67, 731–735. [Google Scholar] [CrossRef]
- Grundy, M.M.L.; Fardet, A.; Tosh, S.M.; Rich, G.T.; Wilde, P.J. Processing of oat: The impact on oat’s cholesterol lowering effect. Food Funct. 2018, 9, 1328–1343. [Google Scholar] [CrossRef] [PubMed]
- Hayes, M. Measuring Protein Content in Food: An Overview of Methods. Foods 2020, 9, 1340. [Google Scholar] [CrossRef]
- Lehtinen, P.; Kaukovirta-Norja, A. Chapter 9—Oat Lipids, Enzymes, and Quality. In Oats, 2nd ed.; Webster, F.H., Wood, P.J., Eds.; AACC International Press: St Paul, MN, USA, 2011; pp. 143–156. [Google Scholar]
- Li, X.; Oey, I.; Kebede, B. Effect of industrial processing on the volatiles, enzymes and lipids of wholegrain and rolled oats. Food Res. Int. 2022, 157, 111243. [Google Scholar] [CrossRef] [PubMed]
- Viscidi, K.A.; Dougherty, M.P.; Briggs, J.; Camire, M.E. Complex phenolic compounds reduce lipid oxidation in extruded oat cereals. LWT—Food Sci. Technol. 2004, 37, 789–796. [Google Scholar] [CrossRef]
- Ekstrand, B.; Gangby, I.; Akesson, G. Lipase activity in oats—distribution, pH-dependence, and heat inactivation. Cereal Chem. 1992, 69, 379–381. [Google Scholar]
- Ekstrand, B.; Gangby, I.; Åkesson, G.; Stöllman, U.; Lingnert, H.; Dahl, S. Lipase Activity and Development of Rancidity in Oats and Oat Products Related to Heat Treatment during Processing. J. Cereal Sci. 1993, 17, 247–254. [Google Scholar] [CrossRef]
- Girardet, N.; Webster, F.H. Oat Milling, Specifications, Storage, and Processing. In OATS: Chemistry and Technology, 2nd ed.; Webster, F.H., Wood, P.J., Eds.; AACC International Press: St Paul, MN, USA, 2011; pp. 301–319. [Google Scholar]
- McGorrin, R.J. Key Aroma Compounds in Oats and Oat Cereals. J. Agric. Food Chem. 2019, 67, 13778–13789. [Google Scholar] [CrossRef]
- Bryngelsson, S.; Dimberg, L.H.; Kamal-Eldin, A. Effects of Commercial Processing on Levels of Antioxidants in Oats (Avena sativa L.). J. Agric. Food Chem. 2002, 50, 1890–1896. [Google Scholar] [CrossRef]
- Gates, F. Role of heat treatment in the processing and quality of oat flakes. In Departmenent of Food Technology; University of Helsinki: Helsinki, Finland, 2007; p. 69. [Google Scholar]
- Norlander, S.; Dahlgren, L.; Sardari, R.R.R.; Marmon, S.; Tullberg, C.; Nordberg Karlsson, E.; Grey, C. Effect of kilning on the macronutrient composition profile of three Swedish oat varieties. Cereal Chem. 2024, 101, 382–396. [Google Scholar] [CrossRef]
- Jaksics, E.; Németh, R.; Schall, E.; Szentmiklóssy, M.K.J.; Bidló, G.; Simon, K.; Tömösközi, S. Study of the effects of heat treatment on the composition, functionality, and oxidative and hydrolytic stability of oat. Cereal Chem. 2023, 100, 708–720. [Google Scholar] [CrossRef]
- Salmenkallio-Marttila, M.; Heiniö, R.-L.; Kaukovirta-Norja, A.; Poutanen, K. Flavor and Texture in Processing of New Oat Foods. In OATS: Chemistry and Technology; Webster, F.H., Wood, P.J., Eds.; Woodhead Publishing: Cambridge, UK; AACC International Press: St Paul, MN, USA, 2011; pp. 333–346. [Google Scholar]
- Starowicz, M.; Zieliński, H. How Maillard Reaction Influences Sensorial Properties (Color, Flavor and Texture) of Food Products? Food Rev. Int. 2019, 35, 707–725. [Google Scholar] [CrossRef]
- Singh, R.P.; Heldman, D.R. Introduction to Food Engineering; Academic Press: Cambridge, MA, USA, 2008; p. 864. [Google Scholar]
- Liu, K. Fractionation of oats into products enriched with protein, beta-glucan, starch, or other carbohydrates. J. Cereal Sci. 2014, 60, 317–322. [Google Scholar] [CrossRef]
- Yang, Z.; Xie, C.; Bao, Y.; Liu, F.; Wang, H.; Wang, Y. Oat: Current state and challenges in plant-based food applications. Trends Food Sci. Technol. 2023, 134, 56–71. [Google Scholar] [CrossRef]
- Mohammadi, M.; Norlander, S.; Hedström, M.; Adlercreutz, P.; Grey, C. Xylanases and high-degree wet milling improve soluble dietary fibre content in liquid oat base. Food Chem. 2024, 442, 138619. [Google Scholar] [CrossRef] [PubMed]
- Deswal, A.; Deora, N.S.; Mishra, H.N. Optimization of Enzymatic Production Process of Oat Milk Using Response Surface Methodology. Food Bioprocess. Technol. 2014, 7, 610–618. [Google Scholar] [CrossRef]
- Silventoinen-Veijalainen, P.; Sneck, A.-M.; Nordlund, E.; Rosa-Sibakov, N. Influence of oat flour characteristics on the physicochemical properties of oat-based milk substitutes. Food Hydrocoll. 2024, 147, 109402. [Google Scholar] [CrossRef]
- Silva, A.R.A.; Silva, M.M.N.; Ribeiro, B.D. Health issues and technological aspects of plant-based alternative milk. Food Res. Int. 2020, 131, 108972. [Google Scholar] [CrossRef] [PubMed]
- Bonke, A.; Sieuwerts, S.; Petersen, I.L. Amino Acid Composition of Novel Plant Drinks from Oat, Lentil and Pea. Foods 2020, 9, 429. [Google Scholar] [CrossRef] [PubMed]
- Liu, S.; Zhao, L.; Zhang, J.; Wang, L.; Liu, H. Functional drink powders from vertical-stone-milled oat and highland barley with high dietary-fiber levels decrease the postprandial glycemic response. J. Funct. Foods 2021, 83, 104548. [Google Scholar] [CrossRef]
- McGrath, J.R.; Beck, M.; Hill, M.E. Replicating Red: Analysis of ceramic slip color with CIELAB color data. J. Archaeol. Sci. Rep. 2017, 14, 432–438. [Google Scholar] [CrossRef]
- Pålsson, D.; Penttinen, H.; Malmberg, C.; Adlercreutz, P.; Tullberg, C. Rancidity development in oat during industrial processing. LWT–Food Sci. Technol. 2024, 204, 116448. [Google Scholar] [CrossRef]
- Quinn, D.M.; Shirai, K.; Jackson, R.L.; Harmony, J.A. Lipoprotein lipase catalyzed hydrolysis of water-soluble p-nitrophenyl esters. Inhibition by apolipoprotein C-II. Biochemistry 1982, 21, 6872–6879. [Google Scholar] [PubMed]
- Lindberg Yilmaz, J.; Adlercreutz, P.; Tullberg, C. Polar Lipids Reduce In Vitro Duodenal Lipolysis Rate of Oat Oil and Liquid Oat Base Products. Eur. J. Lipid Sci. Technol. 2021, 123, 2000317. [Google Scholar] [CrossRef]
- Undeland, I.; Hultin, H.O.; Richards, M.P. Added Triacylglycerols Do Not Hasten Hemoglobin-Mediated Lipid Oxidation in Washed Minced Cod Muscle. J. Agric. Food Chem. 2002, 50, 6847–6853. [Google Scholar] [CrossRef] [PubMed]
- Serrano, S.; Rincón, F.; García-Olmo, J. Cereal protein analysis via Dumas method: Standardization of a micro-method using the EuroVector Elemental Analyser. J. Cereal Sci. 2013, 58, 31–36. [Google Scholar] [CrossRef]
- Fujihara, S.; Sasaki, H.; Aoyagi, Y.; Sugahara, T. Nitrogen-to-protein conversion factors for some cereal products in Japan. J. Food Sci. 2008, 73, C204–C209. [Google Scholar] [CrossRef] [PubMed]
- Decker, E.A.; Rose, D.J.; Stewart, D. Processing of oats and the impact of processing operations on nutrition and health benefits. Br. J. Nutr. 2014, 112, 58–64. [Google Scholar] [CrossRef] [PubMed]
- Derossi, A.; Severini, C.; Cassi, D. Mass Transfer Mechanisms during Dehydration of Vegetable Food: Traditional and Innovative Approaches. In Advanced Topics in Mass Transfer; Mohamed, E.-A., Ed.; IntechOpen: Rijeka, Croatia, 2011; p. 626. [Google Scholar]
- Hutchinson, J.B.; Martin, H.F.; Moran, T. Location and Destruction of Lipase in Oats. Nature 1951, 167, 758–759. [Google Scholar] [CrossRef] [PubMed]
- Ganßmann, W.; Vorwerck, K. Oat milling, processing and storage. In The Oat Crop: Production and Utilization; Welch, R.W., Ed.; Springer: Dordrecht, The Netherlands, 1995; pp. 369–408. [Google Scholar]
- Halling, P.J. What can we learn by studying enzymes in non-aqueous media? Philos. Trans. R. Soc. Lond. B Biol. Sci. 2004, 359, 1287–1297; discussion 1296-7, 1323–1328. [Google Scholar] [CrossRef]
- Siguemoto, E.; Atmani, L.; Mestres, C.; Meot, J.-M. Modelling cowpea beans α-galactosidase inactivation dependence on temperature and moisture content. LWT–Food Sci. Technol. 2023, 190, 115571. [Google Scholar] [CrossRef]
- Peterson, D.M. Storage Proteins. In OATS: Chemistry and Technology; Webster, F.H., Wood, P.J., Eds.; AACC International Press: St Paul, MN, USA, 2011; pp. 123–142. [Google Scholar]
- Jeske, S.; Zannini, E.; Arendt, E.K. Evaluation of Physicochemical and Glycaemic Properties of Commercial Plant-Based Milk Substitutes. Plant Foods Hum. Nutr. 2017, 72, 26–33. [Google Scholar] [CrossRef]
- Roland, I.S.; Aguilera-Toro, M.; Nielsen, S.D.; Poulsen, N.A.; Larsen, L.B. Processing-Induced Markers in Proteins of Commercial Plant-Based Drinks in Relation to Compositional Aspects. Foods 2023, 12, 3282. [Google Scholar] [CrossRef] [PubMed]

| Treatment Name | Steaming (30 min) |
|---|---|
| 60 °C steaming temperature | 60 °C, 100% RH |
| 70 °C steaming temperature | 70 °C, 100% RH |
| 80 °C steaming temperature | 80 °C, 100% RH |
| 85 °C steaming temperature | 85 °C, 100% RH |
| 90 °C steaming temperature | 90 °C, 100% RH |
| 100 °C steaming temperature and RH 1 humidity | 100 °C, 100% RH |
| 110 °C steaming temperature | 110 °C, 100% RH |
| 120 °C steaming temperature | 120 °C, 100% RH |
| 40% RH 1 steaming humidity | 100 °C, 40% RH |
| 60% RH 1 steaming humidity | 100 °C, 60% RH |
| Kilning Temperature | Lipase Activity (Units/g Flour) | Statistical Letter (Mann–Whitney) |
|---|---|---|
| Non-kilned | 0.379 ± 0.081 | A |
| 60 °C | 0.113 ± 0.081 | B |
| 70 °C | 0.026 ± 0.003 | C |
| 80 °C | 0.008 ± 0.002 | D |
| 85 °C | 0.003 ± 0.001 | E |
| 90 °C | n.d. | F |
| 100 °C | n.d. | F |
| Industrially kilned | n.d. | F |
| Kilning Humidity | Lipase Activity (Units/g Flour) | Statistical Letter (Mann–Whitney) |
|---|---|---|
| Non-kilned | 0.379 ± 0.081 | A |
| 40% RH | 0.018 ± 0.009 | B |
| 60% RH | n.d. | C |
| 100% RH | n.d. | C |
| Industrially kilned | n.d. | C |
| Kilning Program | Protein Solubility % (mg Protein/mg Oats × 100) | Relative Protein Solubility (% of Non-Kilned Flour Solubility) | Statistical Letter (ANOVA) |
|---|---|---|---|
| Non-kilned | 2.17 ± 0.03 | 100 ± 1.5 | A |
| 60 °C steaming temperature | 1.72 ± 0.02 | 79.4 ± 0.77 | B |
| 70 °C steaming temperature | 1.64 ± 0.06 | 75.6 ± 2.7 | B |
| 80 °C steaming temperature | 1.17 ± 0.06 | 53.8 ± 2.8 | C |
| 40% RH 1 steaming humidity | 1.23 ± 0.03 | 56.7 ± 1.5 | C |
| 90 °C steaming temperature | 0.914 ± 0.09 | 42.2 ± 4.2 | D |
| 60% RH 1 steaming humidity | 0.772 ± 0.06 | 35.6 ± 2.5 | D |
| 100 °C steaming temperature and 100% RH 1 humidity | 0.336 ± 0.02 | 15.5 ± 1.1 | E |
| Industrially kilned | 0.172 ± 0.07 | 7.95 ± 3.3 | F |
| Milled Oat Flour | Protein % | Statistical Letter (t-Test) |
|---|---|---|
| Non-kilned | 13.4 ± 0.12 | A |
| Industrially kilned | 12.8 ± 0.074 | B |
| Oat-Base | Moisture Content % | Statistical Letter (ANOVA) |
|---|---|---|
| Non-kilned | 86.2 ± 0.16 | A |
| In-house kilning | 85.5 ± 0.0058 | B |
| Industrially kilned | 86.4 ± 0.17 | A |
| Oat-Base | Protein % | mg Protein/mL Oat-Base | Statistical Letter (ANOVA) |
|---|---|---|---|
| Non-kilned | 12.2 ± 0.21 | 16.9 ± 0.30 | A |
| In-house kilning | 12.0 ± 0.26 | 17.4 ± 0.38 | A |
| Industrially kilned | 11.4 ±0.040 | 15.4 ± 0.054 | B |
Disclaimer/Publisher’s Note: The statements, opinions and data contained in all publications are solely those of the individual author(s) and contributor(s) and not of MDPI and/or the editor(s). MDPI and/or the editor(s) disclaim responsibility for any injury to people or property resulting from any ideas, methods, instructions or products referred to in the content. |
© 2024 by the authors. Licensee MDPI, Basel, Switzerland. This article is an open access article distributed under the terms and conditions of the Creative Commons Attribution (CC BY) license (https://creativecommons.org/licenses/by/4.0/).
Share and Cite
Ekelund, S.; Gladkauskas, E.; Krause, S.; Sirijovski, N.; Adlercreutz, P.; Rayner, M.; Grey, C.; Tullberg, C. Oat Kilning and Its Effects on Liquid Oat-Base Production. Foods 2024, 13, 4083. https://doi.org/10.3390/foods13244083
Ekelund S, Gladkauskas E, Krause S, Sirijovski N, Adlercreutz P, Rayner M, Grey C, Tullberg C. Oat Kilning and Its Effects on Liquid Oat-Base Production. Foods. 2024; 13(24):4083. https://doi.org/10.3390/foods13244083
Chicago/Turabian StyleEkelund, Sofie, Eimantas Gladkauskas, Svenja Krause, Nick Sirijovski, Patrick Adlercreutz, Marilyn Rayner, Carl Grey, and Cecilia Tullberg. 2024. "Oat Kilning and Its Effects on Liquid Oat-Base Production" Foods 13, no. 24: 4083. https://doi.org/10.3390/foods13244083
APA StyleEkelund, S., Gladkauskas, E., Krause, S., Sirijovski, N., Adlercreutz, P., Rayner, M., Grey, C., & Tullberg, C. (2024). Oat Kilning and Its Effects on Liquid Oat-Base Production. Foods, 13(24), 4083. https://doi.org/10.3390/foods13244083