
Autochthonous Fermentation as a Means to Improve the Bioaccessibility and Antioxidant Activity of Proteins and Phenolic Compounds of Yellow Pea Flour


Abstract
1. Introduction
2. Materials and Methods
2.1. Chemicals and Samples
2.2. Autochthonous Fermentation
2.2.1. Preliminary Tests
2.2.2. Preparation of Fermented Flour
2.2.3. Microbiological Analysis
2.3. Centesimal Composition
2.4. Simulated Gastrointestinal Digestion (SGID)
2.5. Characterization of Polypeptide/Peptide Fraction
2.6. Characterization of PCs
2.7. Antioxidant Activity
2.8. Statistical Analysis
3. Results and Discussion
3.1. Preliminary Assays on Natural Fermentation of Yellow Pea Flour
3.2. Preparation of Fermented Flours in Bioreactor
3.3. Composition of Fermented Flours
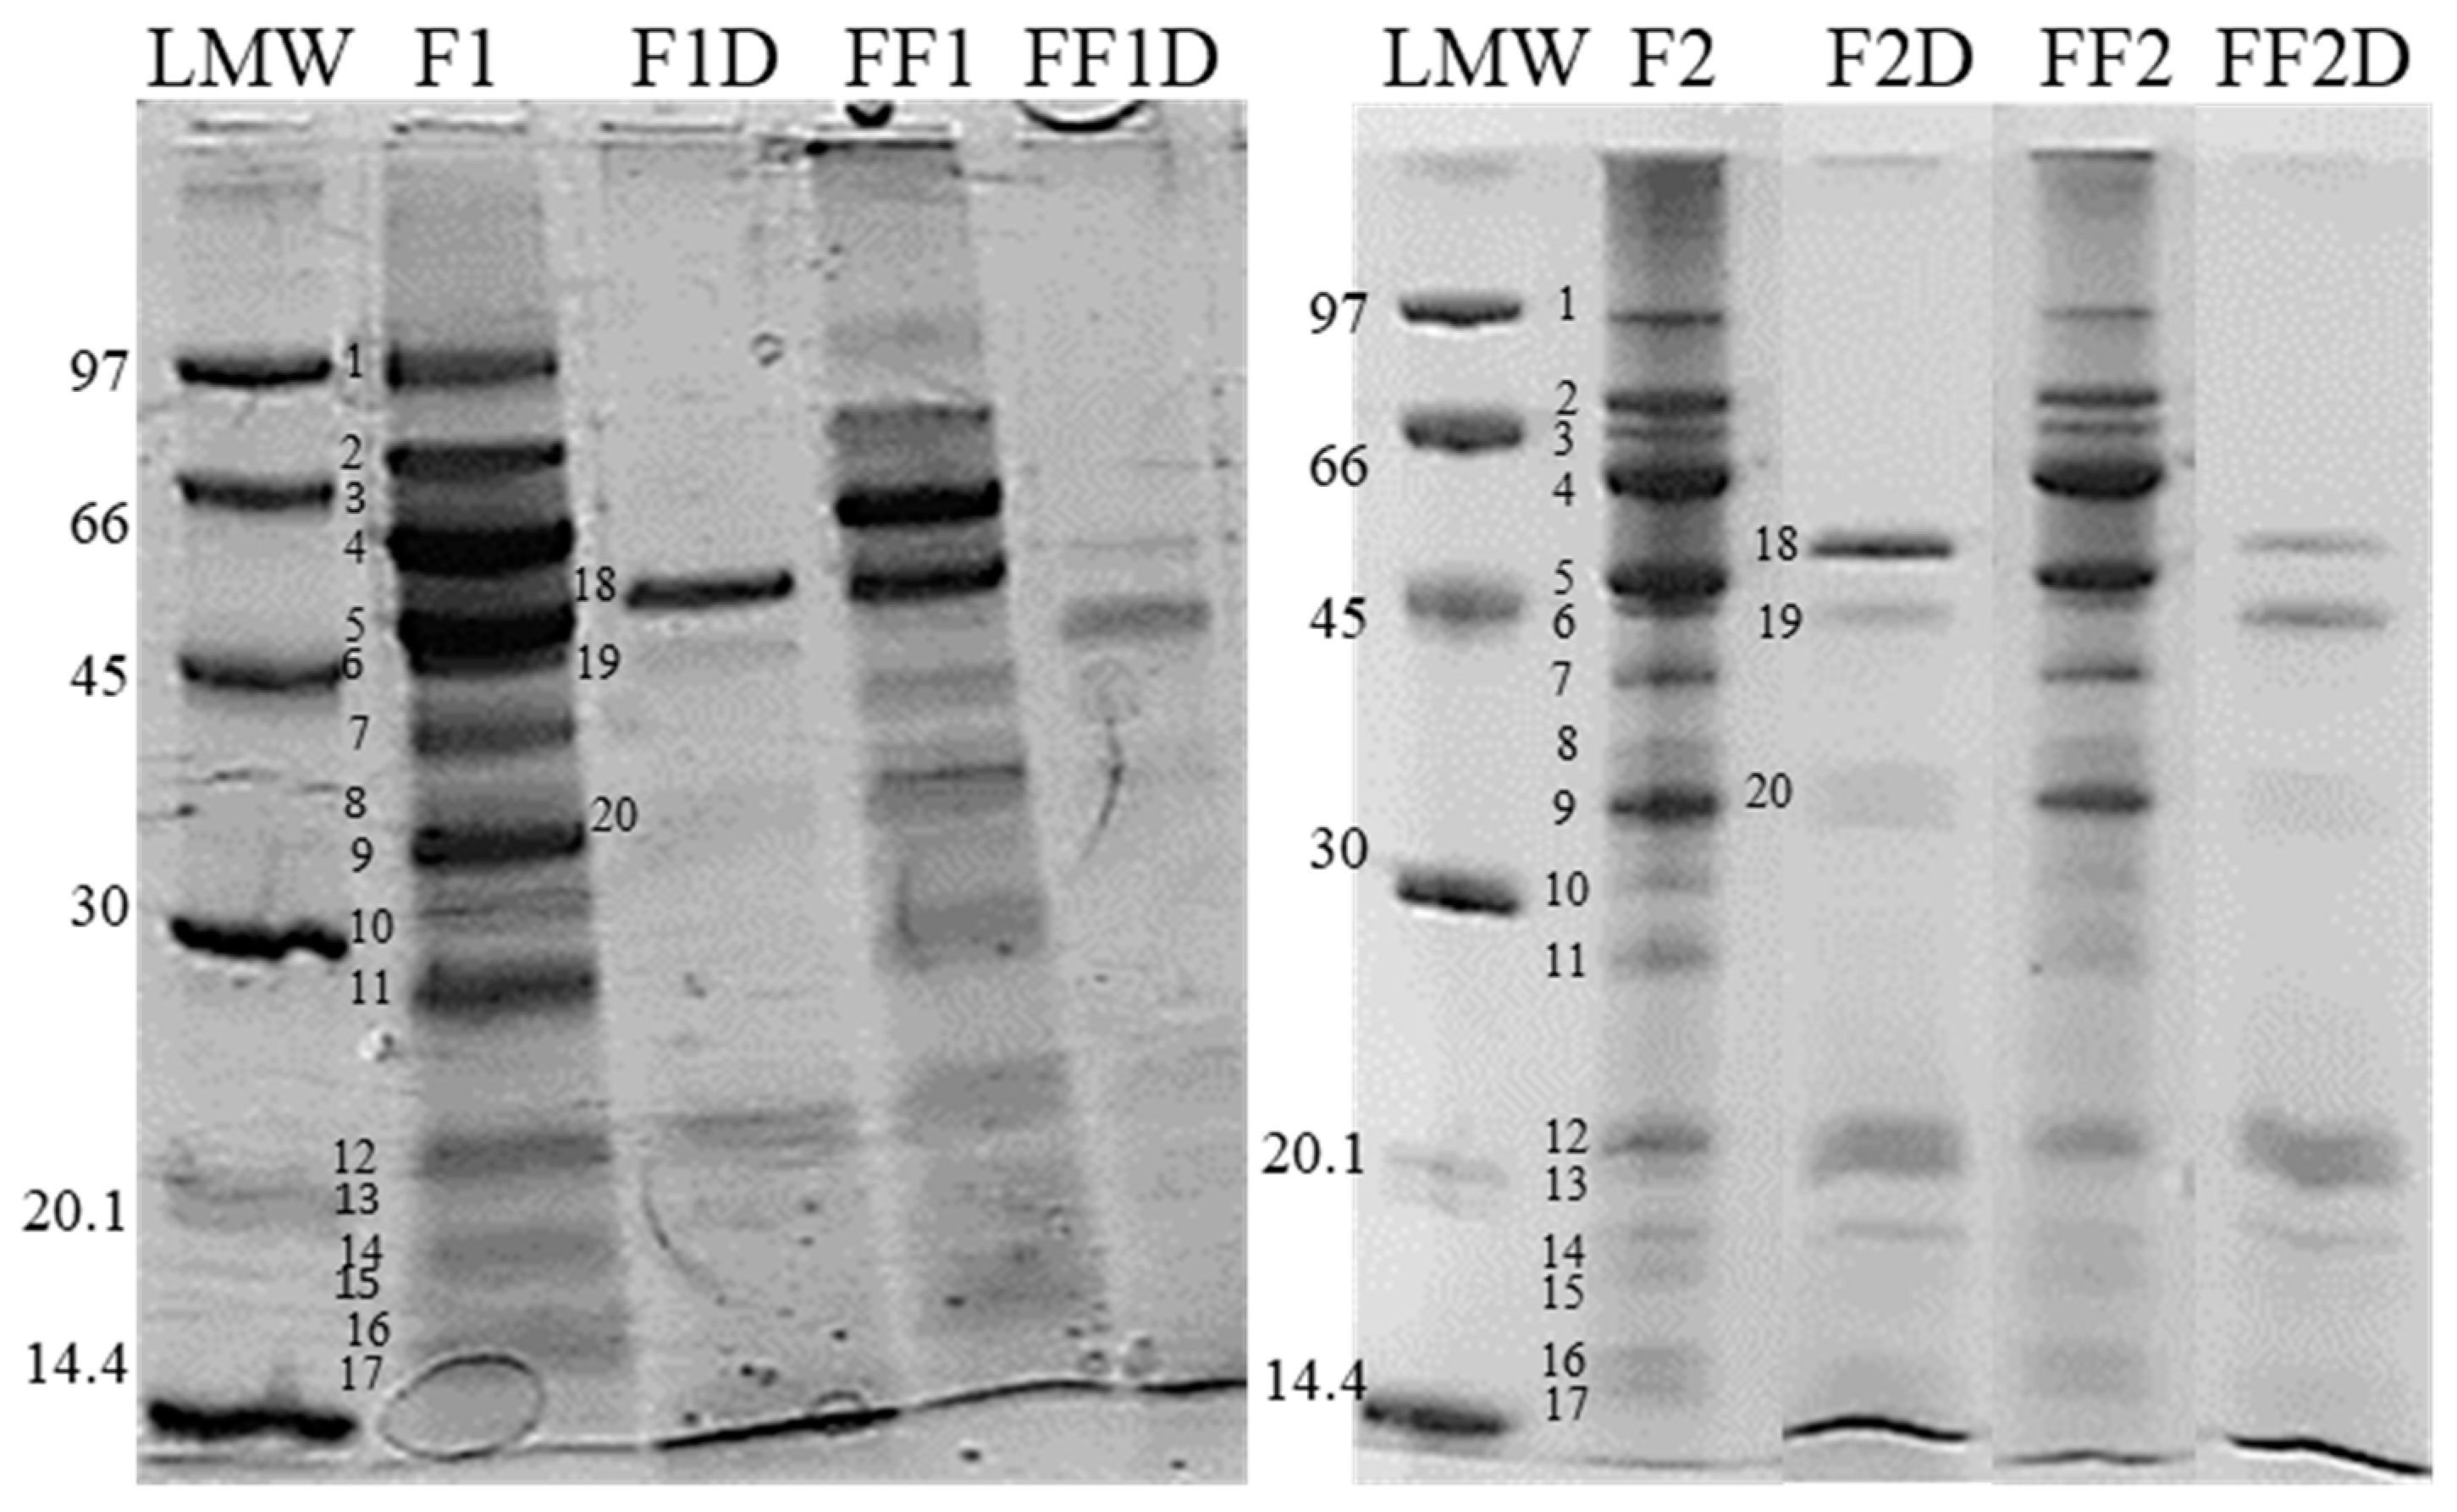
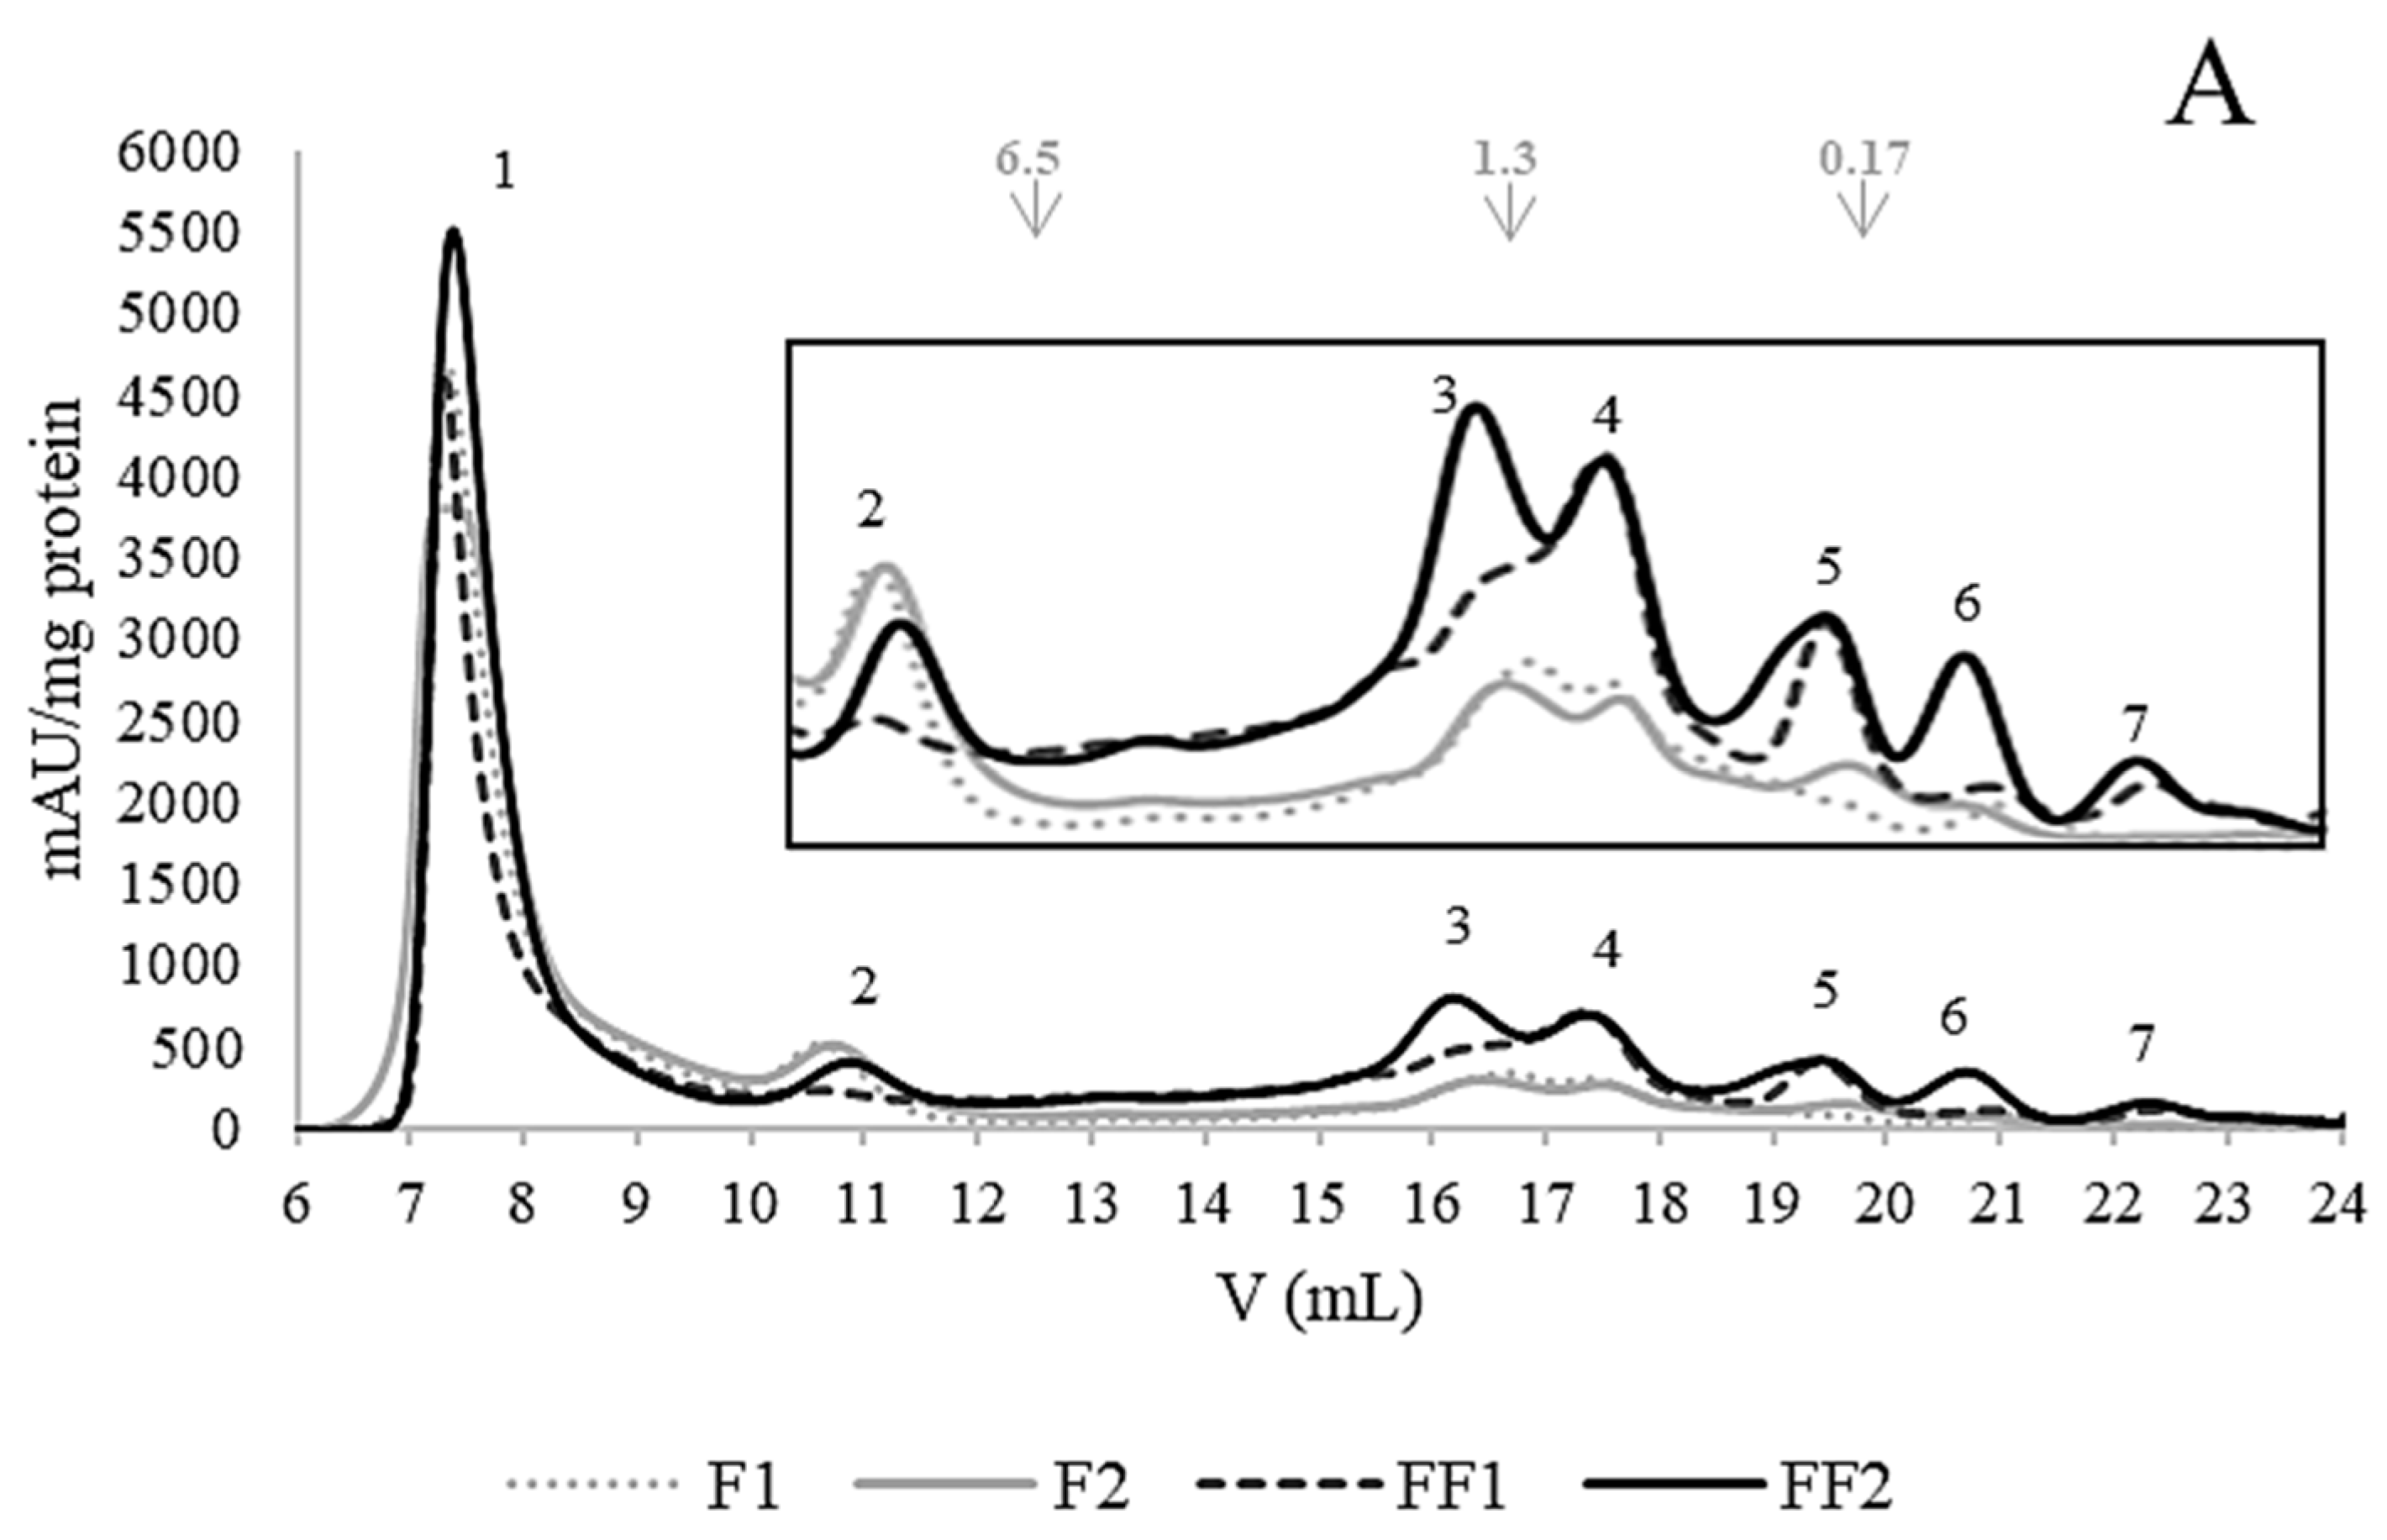
3.4. Changes in the Protein Fractions of Fermented Flours
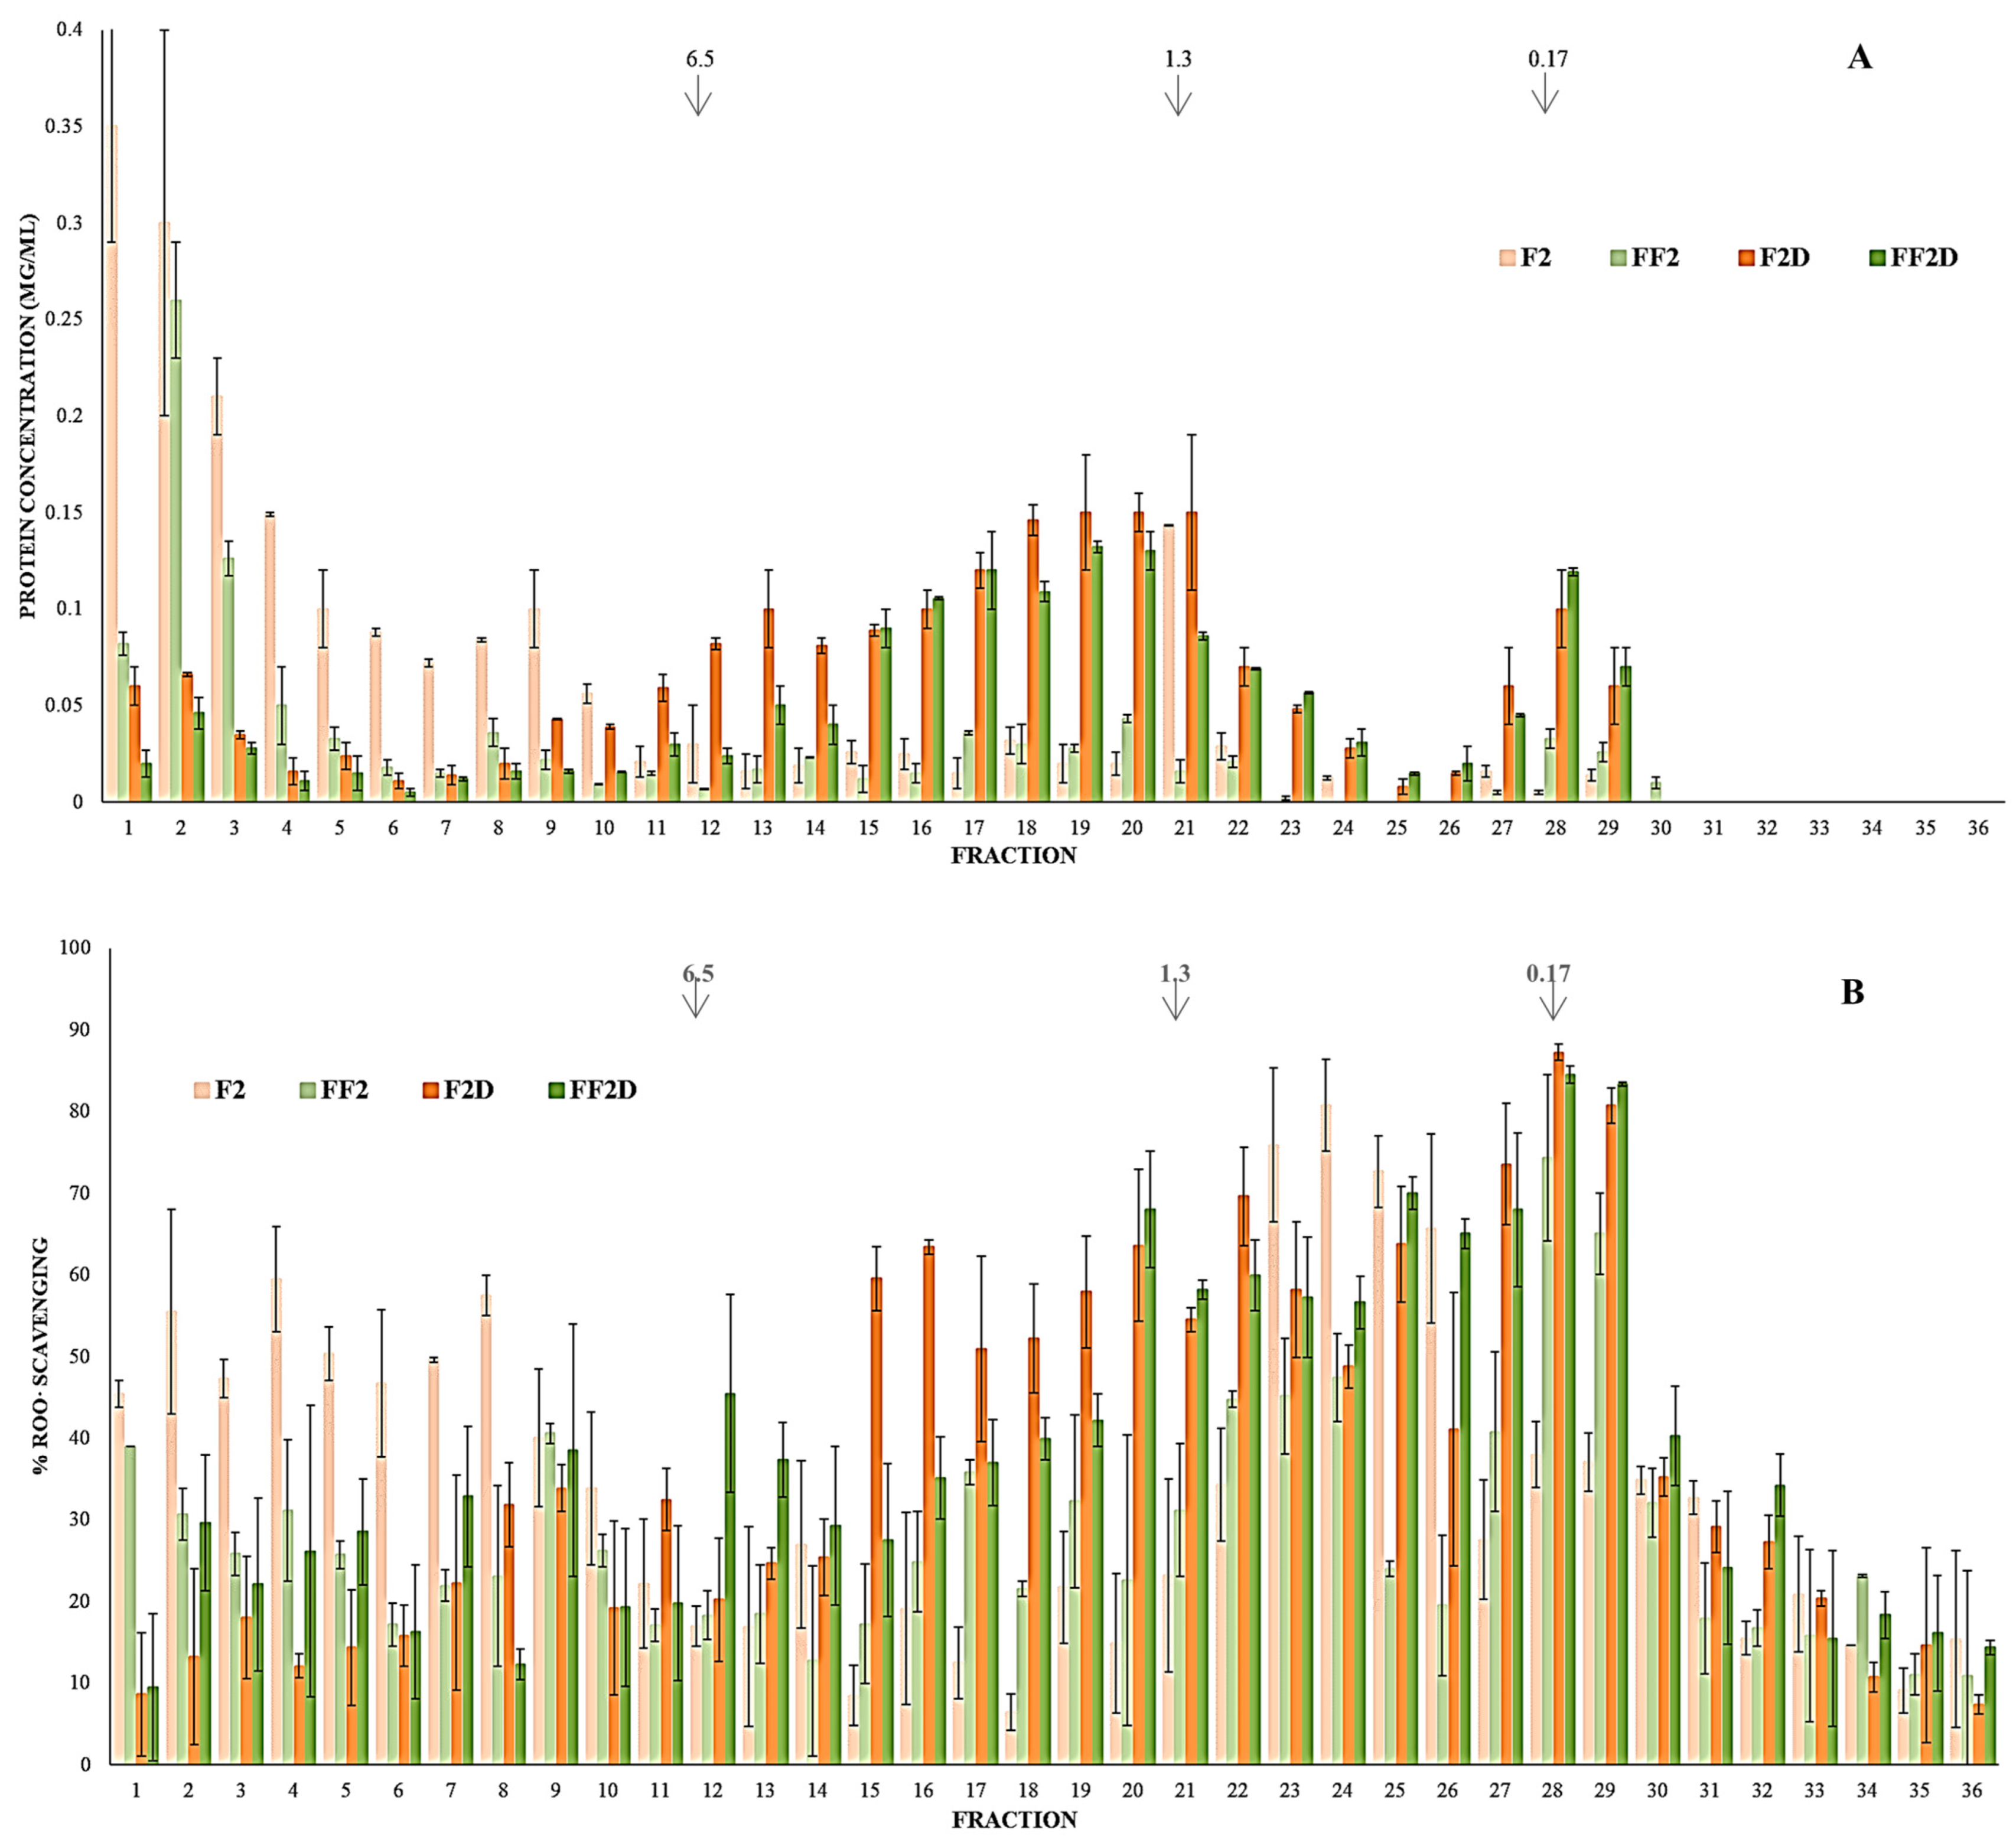
3.5. Effect of Fermentation on Protein Fraction Bioaccessibility (SGID) and Antioxidant Activity
3.6. Effect of Fermentation on PC Bioaccessibility (SGID) and Antioxidant Activity
4. Conclusions
Author Contributions
Funding
Data Availability Statement
Conflicts of Interest
References
- Cipollone, M.A.; Tironi, V. Yellow pea flour and protein isolate as potentially antioxidant ingredients. Legume Sci. 2020, 2, e59. [Google Scholar] [CrossRef]
- Vaz Patto, M.; Amarowicz, R.; Aryee, A.; Boye, J.; Chung, H.J.; Martín-Cabrejas, M.; Domoney, C. Achievements and challenges in improving the nutritional quality of food legumes. Crit. Rev. Plant Sci. 2015, 34, 105–143. [Google Scholar] [CrossRef]
- Gobbetti, M.; De Angelis, M.; Di Cagno, R.; Calasso, M.; Archetti, G.; Rizzello, C.G. Novel insights on the functional/nutritional features of the sourdough fermentation. Int. J. Food Microb. 2019, 302, 103–113. [Google Scholar] [CrossRef]
- Adebo, J.A.; Njobeh, P.B.; Gbashi, S.; Oyedeji, A.B.; Ogundele, O.M.; Oyeyinka, S.A.; Adebo, O.A. Fermentation of cereals and legumes: Impact on nutritional constituents and nutrient bioavailability. Fermentation 2022, 8, 63. [Google Scholar] [CrossRef]
- Carnevali, P.; Ciati, R.; Leporati, A.; Paese, M. Liquid sourdough fermentation: Industrial application perspectives. Food Microb. 2007, 24, 150–154. [Google Scholar] [CrossRef]
- Rizzello, C.G.; Lorusso, A.; Montemurro, M.; Gobbetti, M. Use of sourdough made with quinoa (Chenopodium quinoa) flour and autochthonous selected lactic acid bacteria for enhancing the nutritional, textural and sensory features of white bread. Int. J. Food Microb. 2016, 56, 1–13. [Google Scholar] [CrossRef]
- Gan, R.Y.; Li, H.B.; Gunaratne, A.; Sui, Z.Q.; Corke, H. Effects of fermented edible seeds and their products on human health: Bioactive components and bioactivities. Compreh. Rev. Food Sci. Food Saf. 2017, 16, 489–531. [Google Scholar] [CrossRef]
- Adebo, O.A.; Njobeh, P.B.; Adebiyi, J.A.; Gbashi, S.; Phoku, J.Z.; Kayitesi, E. Fermented pulse-based food products in developing nations as functional foods and ingredients. In Functional Food—Improve Health through Adequate Food; Hueda, M.C., Ed.; IntechOpen: Rijeka, Croatia, 2017; Chapter 5. [Google Scholar]
- Gueguen, J.; Barbot, J. Quantitative and qualitative variability of pea (Pisum sativum L.) protein composition. J. Sci. Food Agric. 1988, 42, 209–224. [Google Scholar] [CrossRef]
- Nkonge, C.; Balance, M. A sensitive colorimetric procedure for nitrogen determination in micro-Kjeldhal digests. J. Agric. Food Chem. 1982, 30, 416–420. [Google Scholar] [CrossRef]
- AOAC. Methods 24.002 and 24.009. In Official Methods of Analysis, 14th ed.; Association of Official Analytical Chemists International: Washington, DC, USA, 1984. [Google Scholar]
- AOAC. Method 920.39. In Official Methods of Analysis, 15th ed.; Association of Official Analytical Chemists International: Arlington, VA, USA, 1990. [Google Scholar]
- AOAC. Method 991.43. In Official Methods of Analysis, 16th ed.; Association of Official Analytical Chemists International: Gaithersburg, MD, USA, 1995. [Google Scholar]
- García Fillería, S.; Tironi, V. Intracellular antioxidant activity and intestinal absorption of amaranth peptides released using simulated gastrointestinal digestion with Caco-2 TC7 cells. Food Biosci. 2021, 41, 101086. [Google Scholar] [CrossRef]
- Minekus, M.; Alminger, M.; Alvito, P.; Balance, S.; Bohn, T.; Bourlieu, C.; Carrière, F.; Boutrou, R.; Corredig, M.; Dupont, D.; et al. A standardised static in vitro digestion method suitable for food—An international consensus. Food Funct. 2014, 5, 1113–1124. [Google Scholar] [CrossRef] [PubMed]
- Adler-Nissen, J. Determination of degree of hydrolysis of food proteins hydrolysates by trinitrobencensulfonic acid. J. Agric. Food Chem. 1979, 27, 1256–1262. [Google Scholar] [CrossRef] [PubMed]
- Orsini Delgado, M.C.; Tironi, V.; Añón, M.C. Antioxidant activity of amaranth proteins or their hydrolysates under simulated gastrointestinal digestion. LWT Food Sci. Technol. 2011, 44, 1752–1760. [Google Scholar] [CrossRef]
- Boye, J.I.; Zare, F.; Pletch, A. Pulse proteins: Processing, characterization, functional properties and applications in food and feed. Food Res. Int. 2010, 43, 414–431. [Google Scholar] [CrossRef]
- Laemmli, U. Cleavage of structural proteins during the assembly of the head of bacteriophage T4. Nature 1970, 227, 680–685. [Google Scholar] [CrossRef] [PubMed]
- Blum, H.; Beier, H.; Gross, H. Improved silver staining of plant proteins, RNA and DNA in polyacrylamide gels. Electrophoresis 1987, 8, 93–99. [Google Scholar] [CrossRef]
- Lowry, O.; Rosebrough, N.; Farr, A.; Randall, R. Protein measurement with the Folin phenol reagent. J. Biolog. Chem. 1951, 193, 265–275. [Google Scholar] [CrossRef]
- Singleton, V.L.; Rossi, J.A. Colorimetry of total phenolics whit phosphomolybdic-phosphotungstic acid reagents. Am. J. Enol. Viticult. 1965, 16, 144–158. [Google Scholar] [CrossRef]
- Ferreyra, S.; Bottini, R.; Fontana, A. Tandem absorbance and fluorescence detection following liquid chromatography for the profiling of multiclass phenolic compounds in different winemaking products. Food Chem. 2021, 338, 128030. [Google Scholar] [CrossRef]
- Orsini Delgado, M.C.; Galleano, M.; Añón, M.C.; Tironi, V. Amaranth peptides from gastrointestinal digestion: Antioxidant activity against physiological reactive species. Plant Foods Human Nut. 2015, 70, 27–34. [Google Scholar] [CrossRef]
- Tironi, V.A.; Añón, M.C. Amaranth proteins as a source of antioxidant peptides: Effect of proteolysis. Food Res. Int. 2010, 43, 315–322. [Google Scholar] [CrossRef]
- Sáez, G.D.; Hébert, E.M.; Saavedra, L.; Zárate, G. Molecular identification and technological characterization of lactic acid bacteria isolated from fermented kidney beans flours (Phaseolus vulgaris L. and P. coccineus) in northwestern Argentina. Food Res. Int. 2017, 102, 605–615. [Google Scholar] [CrossRef]
- Sáez, G.D.; Saavedra, L.; Hebert, E.M.; Zárate, G. Identification and biotechnological characterization of lactic acid bacteria isolated from chickpea sourdough in northwestern Argentina. LWT Food Sci. Technol. 2018, 93, 249–256. [Google Scholar] [CrossRef]
- Rizzello, C.G.; Coda, R.; Wang, Y.; Verni, M.; Kajala, I.; Katina, K.; Laitila, A. Characterization of indigenous Pediococcus pentosaceus, Leuconostoc kimchii, Weissella cibaria and Weissella confusa for Faba bean bioprocessing. Int. J. Food Microb. 2019, 302, 24–34. [Google Scholar] [CrossRef] [PubMed]
- Corsetti, A. Technology of sourdough fermentation and sourdough applications. In Handbook on Sourdough Biotechnology; Gobbetti, M., Gänzle, M., Eds.; Springer: New York, NY, USA, 2013; pp. 85–103. [Google Scholar]
- Martín-Cabrejas, M.A.; Ariza, N.; Esteban, R.; Mollá, E.; Waldron, K.; López-Andréu, F.J. Effect of germination on the carbohydrate composition of the dietary fiber of peas (Pisum sativum L.). J. Agric. Food Chem. 2003, 51, 1254–1259. [Google Scholar] [CrossRef] [PubMed]
- Onwurafor, E.U.; Onweluzo, J.C.; Ezeoke, A.M. Effect of fermentation methods on chemical and microbial properties of mung bean (Vigna radiata) flour. Niger. Food J. 2014, 32, 89–96. [Google Scholar] [CrossRef]
- Curiel, J.A.; Coda, R.; Centomani, I.; Summo, C.; Gobbetti, M.; Rizzello, C.G. Exploitation of the nutritional and functional characteristics of traditional Italian legumes: The potential of sourdough fermentation. Int. J. Food Microb. 2015, 196, 51–61. [Google Scholar] [CrossRef] [PubMed]
- Kaczmarska, K.; Chandra-Hioe, M.; Zabaras, D.; Frank, D.; Arcot, J. Effect of germination and fermentation on carbohydrate composition of Australian sweet lupin and soybean seeds and flours. J. Agric. Food Chem. 2017, 65, 10064–10073. [Google Scholar] [CrossRef] [PubMed]
- Ramakrishna, V.; Rao, P.R. Purification of acidic protease from the cotyledons of germinating Indian bean (Dolichos lablab L. var lignosus) seeds. Afr. J. Biotech. 2005, 4, 703–707. [Google Scholar]
- Gänzle, M.G.; Loponen, J.; Gobbetti, M. Proteolysis in sourdough fermentations: Mechanisms and potential for improved bread quality. Trends in Food Sci. Tech. 2008, 19, 513–521. [Google Scholar] [CrossRef]
- Akhtaruzzaman, N.H.M.; Rubel, M.; Ripa, J.; Atikur, R.; Tanjina, R. Isolation and characterization protease enzyme from leguminous seeds. Agric. Sci. Res. J. 2012, 2, 434–440. [Google Scholar]
- Ma, Z.; Boye, J.I.; Hu, X. In vitro digestibility, protein composition and techno-functional properties of Saskatchewan grown yellow field peas (Pisum sativum L.) as affected by processing. Food Res. Int. 2017, 92, 64–78. [Google Scholar] [CrossRef]
- Byanju, B.; Hojilla-Evangelista, M.P.; Lamsal, B.P. Fermentation performance and nutritional assessment of physically processed lentil and green pea flour. J. Sci. Food Agric. 2021, 101, 5792–5806. [Google Scholar] [CrossRef]
- Ou, B.; Hampsch-Woodil, M.; Prior, R. Development and validation of an improved oxygen radical absorbance capacity assay using fluorescein as the fluorescent probe. J. Agric. Food Chem. 2016, 49, 4619–4626. [Google Scholar] [CrossRef]
- Rizzello, C.G.; Tagliazucchi, D.; Babini, E.; Rutella, G.S.; Taneyo Saa, D.L.; Gianotti, A. Bioactive peptides from vegetable food matrices: Research trends and novel biotechnologies for synthesis and recovery. J. Funct. Foods 2016, 27, 549–569. [Google Scholar] [CrossRef]
- Ou, B.; Hampsch-Woodill, M.; Flanagan, J.; Deemer, E.K.; Prior, R.L.; Huang, D. Novel fluorometric assay for hydroxyl radical prevention capacity using fluorescein as the probe. J. Agric. Food Chem. 2002, 50, 2772–2777. [Google Scholar] [CrossRef]
- Verni, M.; Verardo, V.; Rizzello, C.G. How fermentation affects the antioxidant properties of cereals and legumes. Foods 2019, 8, 362. [Google Scholar] [CrossRef]
- Venegas-Ortega, M.G.; Flores-Gallegos, A.C.; Martinez-Hernandez, J.L.; Aguilar, C.N.; Nevarez-Moorillon, G.V. Production of bioactive peptides from lactic acid bacteria: A sustainable approach for healthier foods. Compreh. Rev. Food Sci. Food Saf. 2019, 18, 1039–1051. [Google Scholar] [CrossRef] [PubMed]
- Stanisavljević, N.S.; Vukotić, G.N.; Pastor, F.T.; Sužnjević, D.; Jovanović, Z.S.; Strahinić, I.D.; Fira, D.A.; Radović, S.S. Antioxidant activity of pea protein hydrolysates produced by batch fermentation with lactic acid bacteria. Arch. Biol. Sci. Belgrade 2015, 67, 1033–1042. [Google Scholar] [CrossRef]
- Gan, R.Y.; Shah, N.P.; Wang, M.F.; Lui, W.Y.; Corke, H. Fermentation alters antioxidant capacity and polyphenol distribution in selected edible legumes. Int. J. Food Sci. Technol. 2016, 51, 875–884. [Google Scholar] [CrossRef]
- Xiao, Y.; Zhang, Q.; Miao, J.; Rui, X.; Li, T.; Dong, M. Antioxidant activity and DNA damage protection of mung beans processed by solid state fermentation with Cordyceps militaris SN-18. Innov. Food Sci. Emerg. Tech. 2015, 31, 216–225. [Google Scholar] [CrossRef]
- Dueñas, M.; Fernández, D.; Hernandez, T.; Estrella, I.; Muñoz, R. Bioactive phenolic compounds of cowpeas (Vigna sinensis L). Modifications by fermentation with natural microflora and with Lactobacillus plantarum ATCC 14917. J. Sci. Food Agric. 2005, 85, 297–304. [Google Scholar] [CrossRef]
- Gaur, G.; Gänzle, M. Conversion of (poly)phenolic compounds in food fermentations by lactic acid bacteria: Novel insights into metabolic pathways and functional metabolites. Curr. Res. Food Sci. 2023, 6, 100448. [Google Scholar] [CrossRef] [PubMed]
- Ketnawa, S.; Ogawa, Y. Evaluation of protein digestibility of fermented soybeans and changes in biochemical characteristics of digested fractions. J. Funct. Foods 2019, 52, 640–647. [Google Scholar] [CrossRef]
- Oh, J.H.; Lee, C.Y.; Lee, Y.E.; Yoo, S.H.; Chung, J.O.; Rha, C.S.; Park, M.Y.; Hong, Y.D.; Shim, S.M. Profiling of in vitro bioaccessibility and intestinal uptake of flavonoids after consumption of commonly available green tea types. Molecules 2021, 26, 1518. [Google Scholar] [CrossRef]
- Bouayed, J.; Deuber, H.; Hoffmann, L.; Bohn, T. Bioaccessible and dialysable polyphenols in selected apple varieties following in vitro digestion vs. their native patterns. Food Chem. 2012, 131, 4–1466. [Google Scholar] [CrossRef]
- Sancho, R.A.S.; Pavan, V.; Pastore, G.M. Effect of in vitro digestion on bioactive compounds and antioxidant activity of common bean seed coats. Food Res. Int. 2015, 76, 74–78. [Google Scholar] [CrossRef]


| Fermentation | Proteolysis | Protein Solubility | ORAC | |
|---|---|---|---|---|
| Conditions | Final pH | HD% 1 | (g SP/100gTP) 2 | IC50 (mg SP/mL) |
| 24 h/30 °C | 5.1 ± 0.1 b | 16.8 ± 0.7 a | 52 ± 5 a | 0.071 ± 0.004 a |
| 48 h/30 °C | 3.6 ± 0.1 a | 17 ± 2 a | 54 ± 4 a | 0.093 ± 0.004 b |
| 24 h/37 °C | 4.7 ± 0.2 b | 13 ± 2 a | 54 ± 3 a | 0.087 ± 0.005 b |
| 48 h/37 °C | 3.9 ± 0.1 a | 13 ± 2 a | 57 ± 8 a | 0.066 ± 0.002 a |
| Sample | pH | Microbial Count (log CFU/g) | ||
|---|---|---|---|---|
| YGC | MRS | NA | ||
| F1 | 6.2 ± 0.1 c | nd | 4.2 ± 0.1 a | 4.2 ± 0.1 a |
| FF1 | 4.75 ± 0.03 b | nd | 9.1 ± 0.6 b | 8.9 ± 0.6 b |
| F2 | 6.29 ± 0.01 c | nd | 4.5 ± 0.3 a | 4.4 ± 0.2 a |
| FF2 | 4.43 ± 0.01 a | nd | 9.5 ± 0.3 b | 8.8 ± 0.8 b |
| Sample | Proteins 1 | Lipids 1 | Carbohydrates 1,* | Fiber 1 | Ash 1 | Moisture |
|---|---|---|---|---|---|---|
| F1 | 17.9 ± 0.3 a | 2.3 ± 0.3 a | 61.6 | 15.3 ± 0.8 a | 2.8 ± 0.5 a | 4.61 ± 0.06 ab |
| F2 | 24.2 ± 0.9 c | 2.3 ± 0.2 a | 55.4 | 15.2 ± 0.8 a | 2.8 ± 0.5 a | 4 ± 1 a |
| FF1 | 22.1 ± 0.3 bc | 2.1 ± 0.1 a | 55.4 | 17.2 ± 0.2 ab | 3.1 ± 0.1 a | 4.12 ± 0.04 a |
| FF2 | 21.9 ± 0.3 b | 2.3 ± 0.1 a | 53.1 | 18.8 ± 0.6 b | 3.8 ± 0.1 a | 5.73 ± 0.08 b |
| Sample | Proteolysis | Soluble Protein | Protein Solubility | ORAC IC50 | HORAC IC50 |
|---|---|---|---|---|---|
| HD% | (SP) (mg/mL) | (g SP/100gTP) | (mg SP/mL) | (mg SP/mL) | |
| F1 | 8.5 ± 0.6 a | 2.6 ± 0.1 | 75 ± 5 cd | 0.178 ± 0.019 d | 7.4 ± 0.5 b |
| FF1 | 17 ± 2 b | 2.3 ± 0.1 | 56 ± 4 ab | 0.071 ± 0.007 c | 7.7 ± 0.5 b |
| F1D | 45 ± 2 c | 4.1 ± 0.6 | 86 ± 10 cd | 0.049 ± 0.003 bC | 3.7 ± 0.2 a |
| FF1D | 64 ± 4 e | 3.8 ± 0.7 | 76 ± 10 cd | 0.024 ± 0.001 aB | 3.8 ± 0.3 a |
| F2 | 4 ± 1 a | 3.3 ± 0.1 | 71 ± 2 bc | 0.089 ± 0.001 c | 7.9 ± 0.9 b |
| FF2 | 20 ± 2 b | 2.1 ± 0.2 | 49 ± 3 a | 0.033 ± 0.007 ab | 7 ± 1 b |
| F2D | 44 ± 3 c | 3.5 ± 0.4 | 88 ± 8 d | 0.017 ± 0.001 aA | 3.6 ± 0.4 a |
| FF2D | 53 ± 4 d | 2.9 ± 0.2 | 79 ± 5 cd | 0.017 ± 0.001 aA | 3.6 ± 0.3 a |
| Sample | TPC | ORAC | ABTS |
|---|---|---|---|
| (µg GAE/mL) | IC50 (µg GAE/mL) | IC50 (µg GAE/mL) | |
| F2 | 33 ± 1 a | 1.2 ± 0.1 b | 23 ± 2 a |
| FF2 | 96 ± 2 b | 1.4 ± 0.3 b | 48 ± 10 b |
| F2D | 181 ± 4 c | 0.8 ± 0.1 a | 29 ± 4 a |
| FF2D | 193 ± 4 d | 0.8 ± 0.1 a | 22 ± 3 a |
| Compound | F | FF2 | FD | FF2D |
|---|---|---|---|---|
| OH-tyrosol | 1.7 ± 0.1 a | nd | 13.6 ± 0.1 c | 7.2 ± 0.1 b |
| Phenolic acids | ||||
| Ellagic acid | 0.28 ± 0.02 b | 0.44 ± 0.01 c | 0.22 ± 0.01 a | 0.24 ± 0.01 ab |
| Gallic acid | 0.78 ± 0 a | nd | nd | 0.82 ± 0 b |
| Syringic acid | nd | nd | nd | 4.13 ± 0.03 |
| Caffeic acid | 2.1 ± 0.5 ab | 8.9 ± 0.5 c | 0.7 ± 0.2 a | 2.9 ± 0.6 b |
| p-Coumaric acid | 1.53 ± 0.01 d | 0.22 ± 0 a | 1.11 ± 0.04 c | 0.46 ± 0.01 b |
| Ferulic acid | 0.45 ± 0.09 b | 0.19 ± 0.01 a | 0.80 ± 0.03 c | 0.46 ± 0.02 b |
| Rosmarinic acid | 5.2 ± 0.4 b | 6.4 ± 0.1 c | 3.30 ± 0.02 a | 4.69 ± 0.03 b |
| Total phenolic acids | 10 ± 1 | 16.1 ± 0.7 | 6.1 ± 0.2 | 13.7 ± 0.7 |
| Stilbenes | ||||
| Polydatin | 26.05 ± 0.04 c | 25.61 ± 0.01 c | 23.2 ± 0.3 b | 22.44 ± 0 a |
| trans-Resveratrol | 2.6 ± 0.1 a | 4.8 ± 0.1 b | 7.5 ± 0.1 d | 6.67 ± 0 c |
| Total stilbenes | 28.6 ± 0.1 | 30.39 ± 0.09 | 30.7 ± 0.3 | 29.11 ± 0 |
| Flavonoids | ||||
| Rutin | 5.2 ± 0.4 a | 13.2 ± 0.7 b | nd | nd |
| Quercetin-3-glucoside | 0.88 ± 0.01 a | 1.59 ± 0.01 b | nd | 0.96 ± 0.04 a |
| Kaempferol-3-glucoside | 2.3 ± 0.3 b | 6.5 ± 0.5 c | 0.8 ± 0.1 a | 1.1 ± 0.1 ab |
| Quercetin | nd | 3.01 ± 0.01 | nd | nd |
| Procyanidin B1 | 13 ± 6 a | 21 ± 8 a | nd | nd |
| (+)-Catechin | 1.05 ± 0.04 a | 1.25 ± 0.04 b | nd | nd |
| (−)-Epigallocatechin | 59.7 ± 0,2 | 82 ± 6 | 27 ± 4 | 0.06 ± 0.08 |
| (−)-Epicatechin | 0.55 ± 0.02 | nd | 27 ± 5 c | nd |
| (−)-Gallocatechin gallate | nd | nd | 6.3 ± 0.2 | nd |
| Naringenin | 0.32 ± 0.02 | nd | nd | nd |
| Hesperetin | 0.71 ± 0.08 a | 1.65 ± 0.07 b | nd | 1.71 ± 0.02 b |
| Total flavonoids | 84 ± 6 | 140 ± 12 | 40 ± 5 | 3.86 ± 0.05 |
| Total | 125 ± 6 | 187 ± 12 | 90 ± 5 | 47 ± 1 |
Disclaimer/Publisher’s Note: The statements, opinions and data contained in all publications are solely those of the individual author(s) and contributor(s) and not of MDPI and/or the editor(s). MDPI and/or the editor(s) disclaim responsibility for any injury to people or property resulting from any ideas, methods, instructions or products referred to in the content. |
© 2024 by the authors. Licensee MDPI, Basel, Switzerland. This article is an open access article distributed under the terms and conditions of the Creative Commons Attribution (CC BY) license (https://creativecommons.org/licenses/by/4.0/).
Share and Cite
Cipollone, M.A.; Abraham, A.G.; Fontana, A.; Tironi, V.A. Autochthonous Fermentation as a Means to Improve the Bioaccessibility and Antioxidant Activity of Proteins and Phenolic Compounds of Yellow Pea Flour. Foods 2024, 13, 659. https://doi.org/10.3390/foods13050659
Cipollone MA, Abraham AG, Fontana A, Tironi VA. Autochthonous Fermentation as a Means to Improve the Bioaccessibility and Antioxidant Activity of Proteins and Phenolic Compounds of Yellow Pea Flour. Foods. 2024; 13(5):659. https://doi.org/10.3390/foods13050659
Chicago/Turabian StyleCipollone, María Agustina, Analía G. Abraham, Ariel Fontana, and Valeria A. Tironi. 2024. "Autochthonous Fermentation as a Means to Improve the Bioaccessibility and Antioxidant Activity of Proteins and Phenolic Compounds of Yellow Pea Flour" Foods 13, no. 5: 659. https://doi.org/10.3390/foods13050659
APA StyleCipollone, M. A., Abraham, A. G., Fontana, A., & Tironi, V. A. (2024). Autochthonous Fermentation as a Means to Improve the Bioaccessibility and Antioxidant Activity of Proteins and Phenolic Compounds of Yellow Pea Flour. Foods, 13(5), 659. https://doi.org/10.3390/foods13050659