
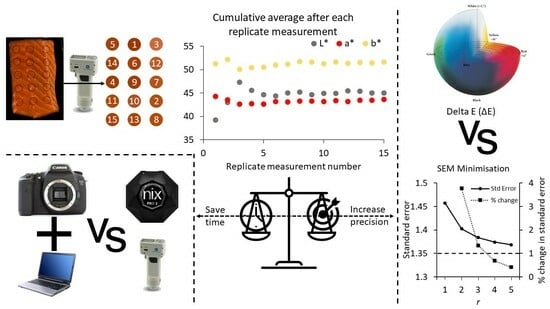
Machine Vision Requires Fewer Repeat Measurements than Colorimeters for Precise Seafood Colour Measurement


Abstract
1. Introduction
2. Materials and Methods
2.1. Sample Preparation
2.2. Treatments for Calculation of Required Number of Repeat Measurements
2.3. Treatments for Calculation of Heterogeneity
2.4. Cooking Conditions
2.5. Measuring Devices
2.6. Photo Processing
2.7. Statistical Analysis
2.7.1. Repeat Measurement Determination
2.7.2. Heterogeneity
3. Results
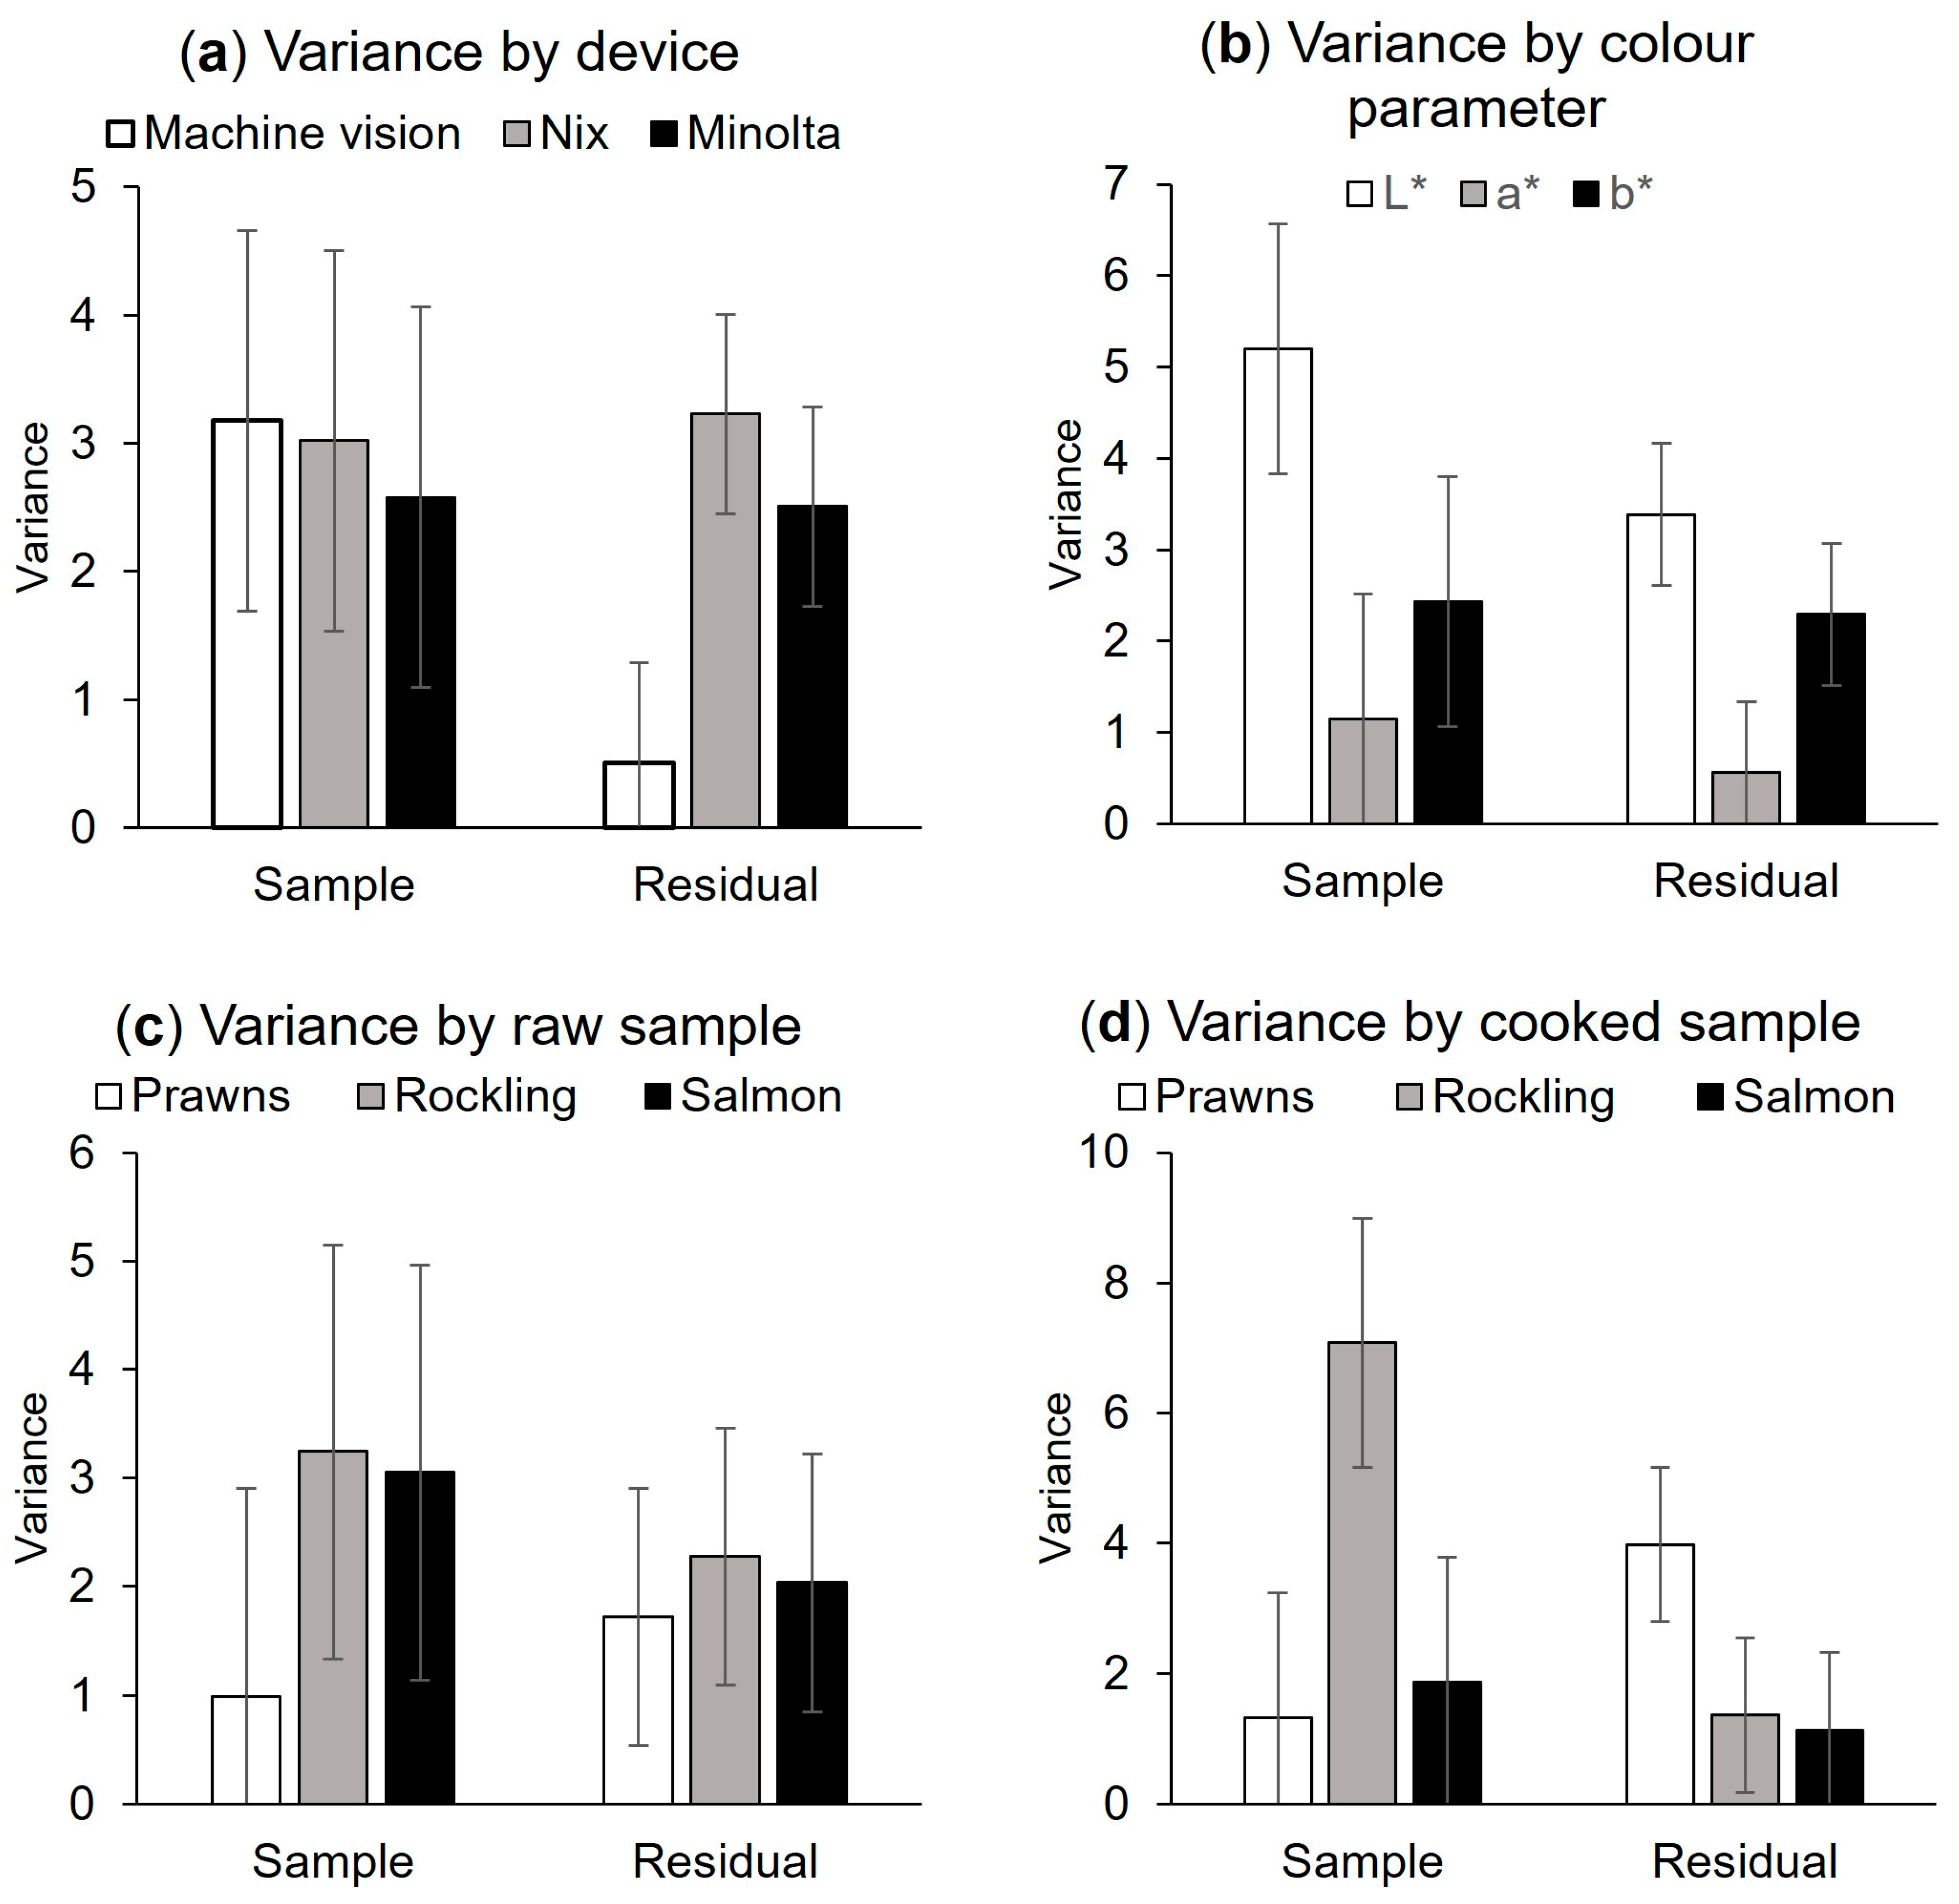
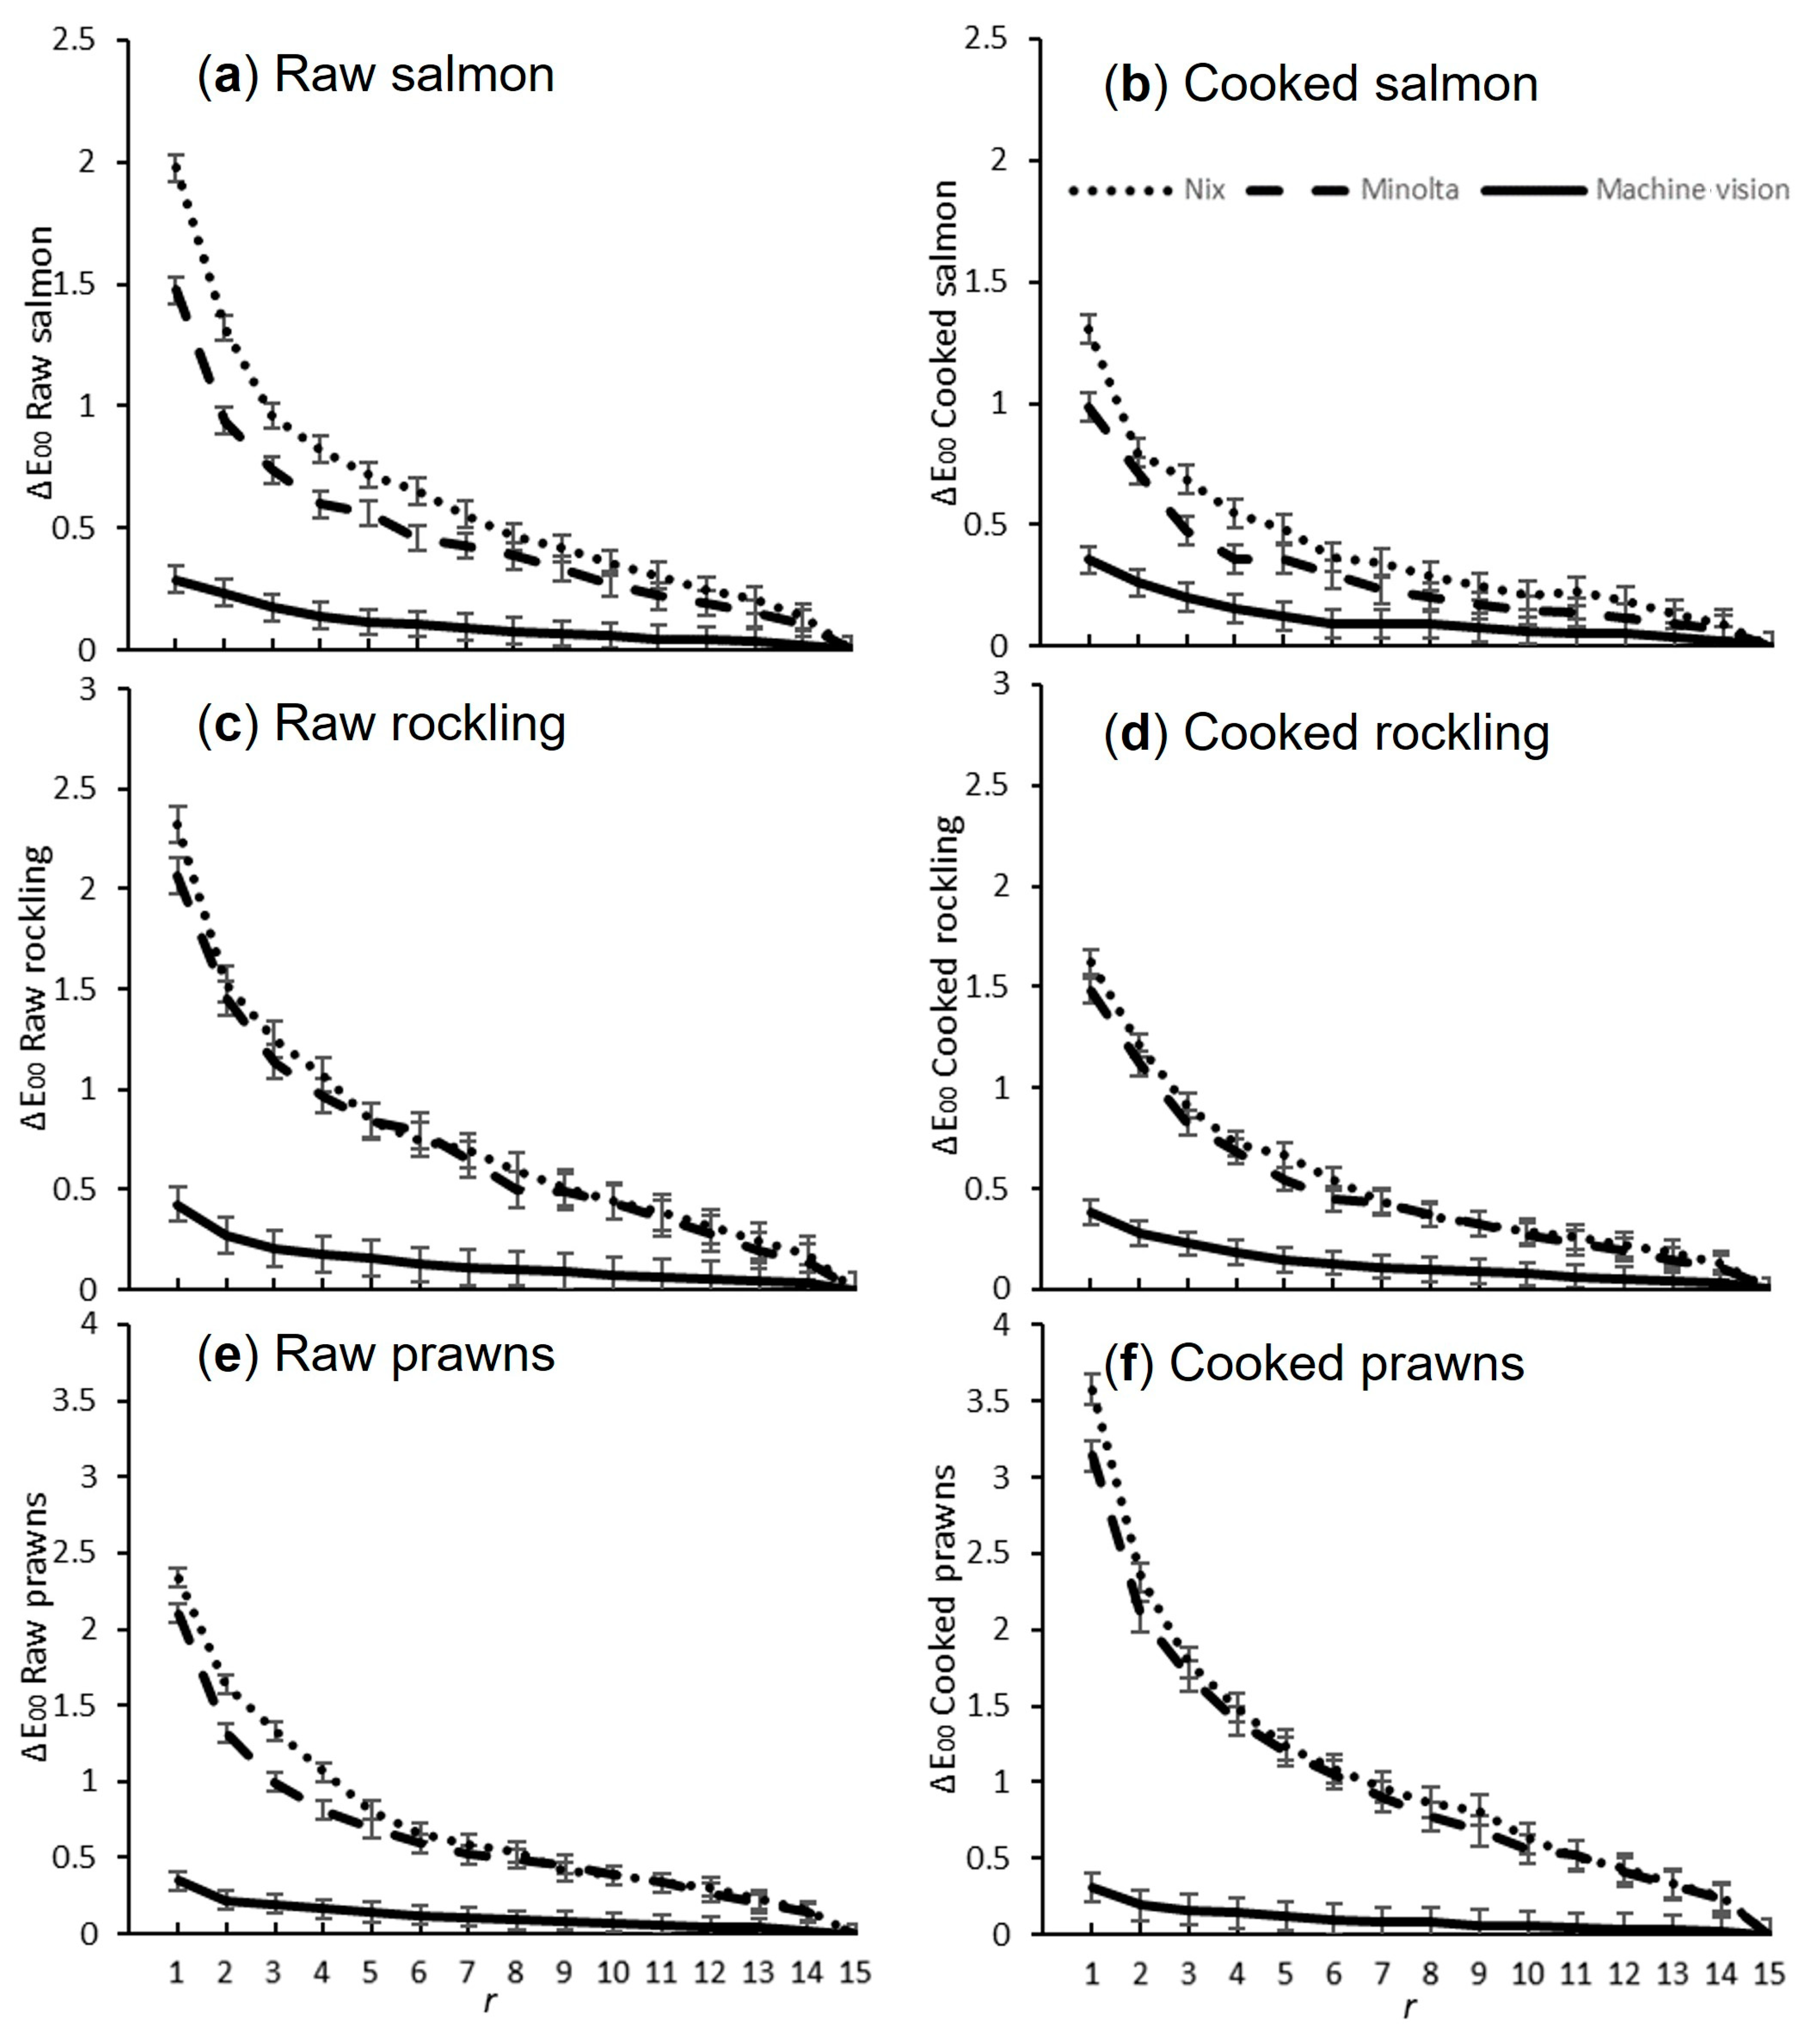
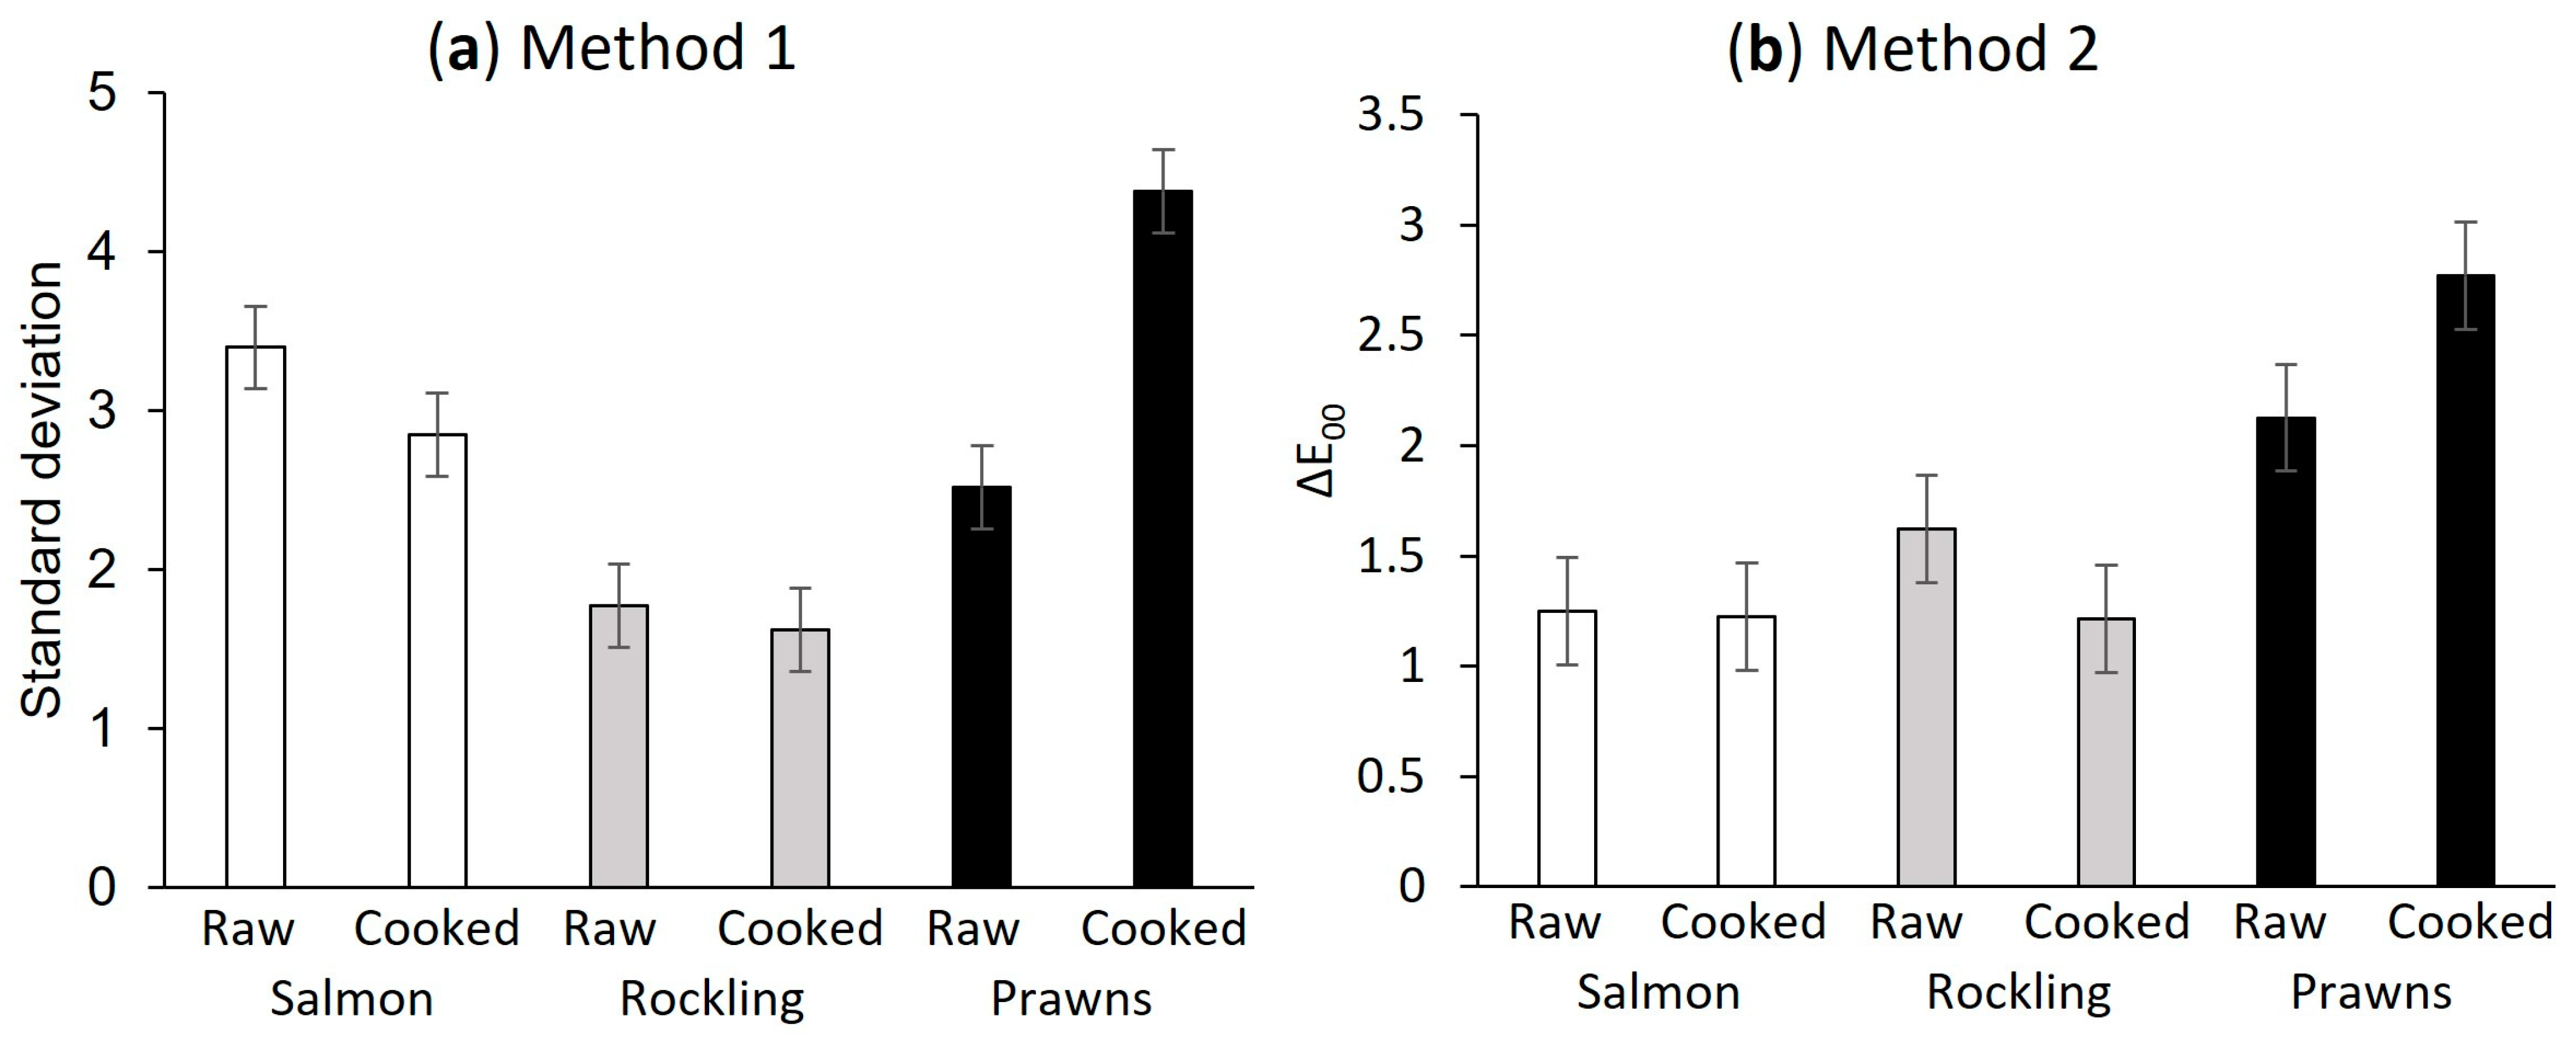
3.1. Method 1
3.2. Method 2
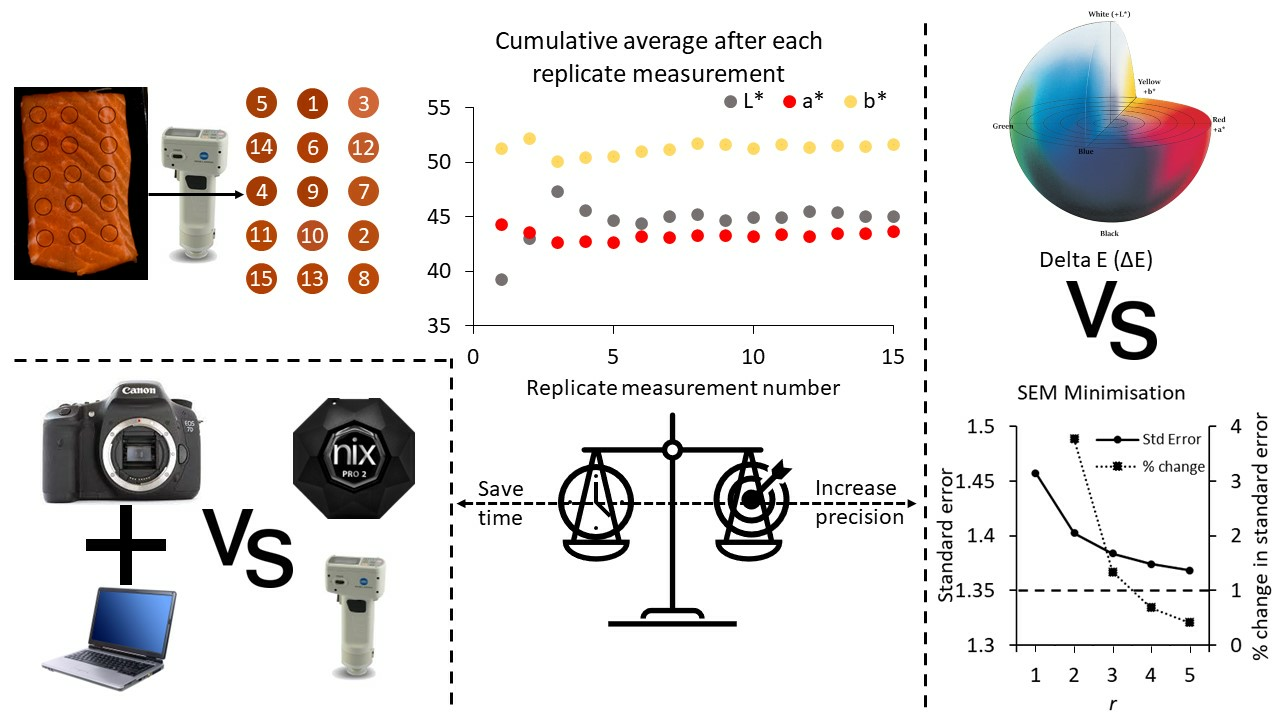
3.3. Heterogeneity Estimations
4. Discussion
Limitations
5. Conclusions
Supplementary Materials
Author Contributions
Funding
Institutional Review Board Statement
Informed Consent Statement
Data Availability Statement
Acknowledgments
Conflicts of Interest
References
- Martinsdóttir, E.; Luten, J.B.; Schelvis-Smit, A.A.M.; Hyldig, G. Developments of QIM—Past and future. In Quality of Fish from Catch to Consumer: Labelling, Monitoring and Traceability; Luten, J.B., Oehlenschläger, J., Olafsdottir, G., Eds.; Wageningen Academic Publishers: Wageningen, The Netherlands, 2003; pp. 265–272. [Google Scholar]
- Ünal Şengör, G.F.; Balaban, M.O.; Topaloğlu, B.; Ayvaz, Z.; Ceylan, Z.; Doğruyol, H. Color assessment by different techniques of gilthead seabream (Sparus aurata) during cold storage. Food Sci. Technol. 2019, 39, 696–703. [Google Scholar] [CrossRef]
- Peshanoff, L.; Jaensch, J. Consumer Research Australian Prawn Farmers Association; 2009/742; University of South Australia: Adelaide, Australia, 2009. [Google Scholar]
- Ariyani, F.; Kristiningrum, E.; Barokah, G.R.; Januar, H.I. The Effects of Carbon Monoxide Treatment on the Physical and Chemical Qualities of Tuna Steak during Iced Storage. Squalen Bull. Mar. Fish. Postharvest Biotechnol. 2020, 15, 73–79. [Google Scholar] [CrossRef]
- Alfnes, F.; Guttormsen, A.G.; Steine, G.; Kolstad, K. Consumers’ Willingness to Pay for the Color of Salmon: A Choice Experiment with Real Economic Incentives. Am. J. Agric. Econ. 2006, 88, 1050–1061. [Google Scholar] [CrossRef]
- Steine, G.; Alfnes, F.; Bencze-Rørå, M. The Effect of Color on Consumer WTP for Farmed Salmon. Mar. Resour. Econ. 2005, 20, 211–219. [Google Scholar] [CrossRef]
- Sigurgisladottir, S.; Parrish, C.C.; Lall, S.P.; Ackman, R.G. Effects of feeding natural tocopherols and astaxanthin on Atlantic salmon (Salmo salar) fillet quality. Food Res. Int. 1994, 27, 23–32. [Google Scholar] [CrossRef]
- Choubert, G.; Blanc, J.-M.; Courvalin, C. Muscle carotenoid content and colour of farmed rainbow trout fed astaxanthin or canthaxanthin as affected by cooking and smoke-curing procedures. Int. J. Food Sci. 1992, 27, 277–284. [Google Scholar] [CrossRef]
- Brookmire, L.; Mallikarjunan, P.; Jahncke, M.; Grisso, R. Optimum cooking conditions for shrimp and Atlantic salmon. J. Food Sci. 2013, 78, S303–S313. [Google Scholar] [CrossRef]
- Larsen, D.; Quek, S.-Y.; Eyres, L. Evaluating instrumental colour and texture of thermally treated New Zealand King Salmon (Oncorhynchus tshawytscha) and their relation to sensory properties. LWT-Food Sci. Technol. 2011, 44, 1814–1820. [Google Scholar] [CrossRef]
- American Meat Science Association. Meat Color Measurement Guideline; American Meat Science Association: Savoy, IL, USA, 2012; pp. 1–124. [Google Scholar]
- Zhou, S.; Ackman, R.G.; Morrison, C. Storage of lipids in the myosepta of Atlantic salmon (Salmo salar). Fish Physiol. Biochem. 1995, 14, 171–178. [Google Scholar]
- Stien, L.H.; Amundsen, A.H.; Mørkøre, T.; Økland, S.N.; Nortvedt, R. Instrumental colour analysis of Atlantic salmon (Salmar salar L.) muscle. In Seafood Research from Fish to Dish: Quality, Safety and Processing of Wild and Farmed Fish; Luten, J.B., Jacobsen, C., Bekaert, K., Saebo, A., Oehlenschläger, J., Eds.; Wageningen Academic Press: Wageningen, The Netherlands, 2006; pp. 525–539. [Google Scholar]
- McCallum, I.M.; Cheng, K.M.; March, B.E. Carotenoid Pigmentation in Two Strains of Chinook Salmon (Oncorhynchus tshawytscha) and Their Crosses. Aquaculture 1987, 67, 291–300. [Google Scholar] [CrossRef]
- Nickell, D.C.; Bromage, N.R. The effect of timing and duration of feeding astaxanthin on the development and variation of fillet colour and efficiency of pigmentation in rainbow trout (Oncorhynchus mykiss). Aquaculture 1998, 169, 233–246. [Google Scholar] [CrossRef]
- Nguyen, C.D.H.; Amoroso, G.; Ventura, T.; Elizur, A. Assessing the Pyloric Caeca and Distal Gut Microbiota Correlation with Flesh Color in Atlantic Salmon (Salmo salar L., 1758). Microorganisms 2020, 8, 1244. [Google Scholar] [CrossRef] [PubMed]
- Ertl, N.G.; Elizur, A.; Brooks, P.; Kuballa, A.V.; Anderson, T.A.; Knibb, W.R. Molecular characterisation of colour formation in the prawn Fenneropenaeus merguiensis. PLoS ONE 2013, 8, e56920. [Google Scholar] [CrossRef] [PubMed]
- Montgomery, W.A.; Sidhu, G.S.; Vale, G.L. The Australian Prawn Industry; CSIRO Food Preservation: Canberra, Australia, 1970; Volume 30, pp. 21–27. [Google Scholar]
- Ertl, N.G. Molecular and Genetic Approaches to the Study of Colour Variation in Fenneropenaeus merguiensis. Honours Thesis, University of the Sunshine Coast, Sippy Downs, Queensland, Australia, 2010. [Google Scholar]
- Zhang, Z.; Pham, H.; Tan, Y.; Zhou, H.; McClements, D.J. Investigation of Protein Denaturation and Textural Changes of Atlantic Salmon (Salmo salar) During Simulated Cooking. Food Biophys. 2021, 16, 512–519. [Google Scholar] [CrossRef]
- Ovissipour, M.; Rasco, B.; Tang, J.; Sablani, S. Kinetics of Protein Degradation and Physical Changes in Thermally Processed Atlantic Salmon (Salmo salar). Food Bioprocess Technol. 2017, 10, 1865–1882. [Google Scholar] [CrossRef]
- Quevedo, R.A.; Aguilera, J.M.; Pedreschi, F. Color of Salmon Fillets By Computer Vision and Sensory Panel. Food Bioprocess Technol. 2008, 3, 637–643. [Google Scholar] [CrossRef]
- DSM-Firmenich. Available online: https://www.dsm.com/anh/products-and-services/tools/salmofan.html#aquaculture (accessed on 5 February 2024).
- Yancey, J.W.S.; Kropf, D.H. Instrumental reflectance values of fresh pork are dependant on aperture size. Meat Sci. 2008, 79, 734–739. [Google Scholar] [CrossRef]
- Holman, B.W.B.; Ponnampalam, E.N.; van de Ven, R.J.; Kerr, M.G.; Hopkins, D.L. Lamb meat colour values (HunterLab CIE and reflectance) are influenced by aperture size (5 mm v. 25 mm). Meat Sci. 2015, 100, 202–208. [Google Scholar] [CrossRef]
- Holman, B.W.B.; Hopkins, D.L. Lamb colour stability measurements are subject to illuminant and viewing angle selection. In Proceedings of the 61st International Congress of Meat Science and Technology, Clermont-Ferrand, France, 23–28 August 2015. [Google Scholar]
- Macdougall, D.B. Colour of meat. In Quality Attributes and Their Measurement in Meat, Poultry and Fish Products; Pearson, A.M., Dutson, T.R., Eds.; Springer: New York, NY, USA, 1994; Volume 9, pp. 79–93. [Google Scholar]
- Tapp, W.N., 3rd; Yancey, J.W.; Apple, J.K. How is the instrumental color of meat measured? Meat Sci. 2011, 89, 1–5. [Google Scholar] [CrossRef]
- Brewer, M.S.; Novakofski, J.; Freise, K. Instrumental evaluation of pH effects on ability of pork chops to bloom. Meat Sci. 2006, 72, 596–602. [Google Scholar] [CrossRef] [PubMed]
- Brewer, M.S.; Zhu, L.G.; Bidner, B.; Meisinger, D.J.; McKeith, F.K. Measuring pork color: Effects of bloom time, muscle, pH and relationship to instrumental parameters. Meat Sci. 2001, 57, 169–176. [Google Scholar] [CrossRef] [PubMed]
- Holman, B.W.B.; Hopkins, D.L. A comparison of the Nix Colour Sensor Pro and HunterLab MiniScan colorimetric instruments when assessing aged beef colour stability over 72 h display. Meat Sci. 2019, 147, 162–165. [Google Scholar] [CrossRef] [PubMed]
- Stevenson, J.M.; Weatherall, I.L.; Littlejohn, R.P.; Seman, D.L. A comparison of two different instruments for measuring venison CIELAB values and colour assessment by a trained panel. N. Z. J. Agric. Res. 1991, 34, 207–211. [Google Scholar] [CrossRef]
- Stien, L.H.; Hirmas, E.; Bjørnevik, M.; Karlsen, Ø.; Nortvedt, R.; Røra, A.M.B.; Sunde, J.; Kiessling, A. The effects of stress and storage temperature on the colour and texture of pre-rigor filleted farmed cod (Gadus morhua L.). Aquac. Res. 2005, 36, 1197–1206. [Google Scholar] [CrossRef]
- Holman, B.W.B.; Diffey, S.M.; Logan, B.G.; Mortimer, S.I.; Hopkins, D.L. Nix Pro Color Sensor Comparison to HunterLab MiniScan for Measuring Lamb Meat Colour and Investigation of Repeat Measures, Illuminant and Standard Observer Effects. Food Anal. Methods 2021, 14, 697–705. [Google Scholar] [CrossRef]
- Barkley, K.E. Evaluation of Variability of Instruments Used in Pork Quality Assessments. Masters Thesis, University of Illinois Urbana-Champaign, Champaign, IL, USA, 2019. [Google Scholar]
- Holman, B.W.B.; Alvarenga, T.I.R.C.; van de Ven, R.J.; Hopkins, D.L. Influence of myofibril orientation on lamb colour measurement and colour stability. In Proceedings of the 60th International Congress of Meat Science and Technology, Punta Del Este, Uruguay, 17–22 August 2014; pp. 147–150. [Google Scholar]
- Oliveira, A.C.M.; Balaban, M.O. Comparison of a Colorimeter with a Machine Vision System in Measuring Color of Gulf of Mexico Sturgeon Fillets. Appl. Eng. Agric. 2006, 22, 583–587. [Google Scholar] [CrossRef]
- Gümüs, B.; Balaban, M.Ö.; Ünlüsayın, M. Machine Vision Applications to Aquatic Foods: A Review. Turk. J. Fish. Aquat. Sci. 2011, 11, 171–181. [Google Scholar] [CrossRef]
- Misimi, E.; Mathiassen, J.R.; Erikson, U. Computer vision-based sorting of Atlantic salmon (Salmo salar) fillets according to their color level. J. Food Sci. 2007, 72, S30–S35. [Google Scholar] [CrossRef]
- Altmann, B.A.; Gertheiss, J.; Tomasevic, I.; Engelkes, C.; Glaesener, T.; Meyer, J.; Schäfer, A.; Wiesen, R.; Mörlein, D. Human perception of color differences using computer vision system measurements of raw pork loin. Meat Sci. 2022, 188, 108766. [Google Scholar] [CrossRef]
- Tzu, F.-M.; Chou, J.-H. Non-uniformity Evaluation of Flat Panel Display by Automatic Optical Detection. In Proceedings of the 11th International Microsystems, Packaging, Assembly and Circuits Technology Conference (IMPACT), Taipei, Taiwan, 26–28 October 2016; pp. 168–171. [Google Scholar]
- Li, S.; Zamaratskaia, G.; Roos, S.; Båth, K.; Meijer, J.; Borch, E.; Johansson, M. Inter-relationships between the metrics of instrumental meat color and microbial growth during aerobic storage of beef at 4 °C. Acta Agric. Scand. A Anim. Sci. 2015, 65, 97–106. [Google Scholar] [CrossRef]
- Holman, B.W.B.; Collins, D.; Kilgannon, A.K.; Hopkins, D.L. The effect of technical replicate (repeats) on Nix Pro Color Sensor measurement precision for meat: A case-study on aged beef colour stability. Meat Sci. 2018, 135, 42–45. [Google Scholar] [CrossRef]
- Joshi, P. Colour measurement of foods by colour reflectance. In Colour in Food—Improving Quality; MacDougall, D.B., Ed.; Woodhead Publishing: Sawston, UK, 2002; pp. 80–114. [Google Scholar]
- AOAC. Official Method 976.16. Official Methods of Analysis of AOAC International, 22nd ed.; Association of Official Analytical Chemists: Gaithersburg, MD, USA, 1976. [Google Scholar]
- CIE. International Commission on Illumination, Colorimetry: Official Recommendations of the International Commission on Illumination; Publication CIE No. 15 (E-1.3.1); Bureau Central de la CIE: Paris, France, 1976. [Google Scholar]
- Adorama. Using a Gray Card: Two Minute Tips with David Bergman. 2018. Available online: https://www.youtube.com/watch?v=h_38Lh_nq70 (accessed on 30 June 2023).
- Francis, F.J.; Clydesdale, F.M. Food Colorimetry: Theory and Applications; AVI Publishing Co. Inc.: Westport, CT, USA, 1975; p. 477. [Google Scholar]
- Valous, N.A.; Mendoza, F.; Sun, D.-W.; Allen, P. Colour calibration of a laboratory computer vision system for quality evaluation of pre-sliced hams. Meat Sci. 2009, 81, 132–141. [Google Scholar] [CrossRef] [PubMed]
- Luo, M.R.; Cui, G.; Rigg, B. The Development of the CIE 2000 Colour-Difference Formula: CIEDE2000. Color Res. Appl. 2001, 26, 340–350. [Google Scholar] [CrossRef]
- Huang, M.; Liu, H.; Xu, Y.; Liao, N. Study on Acceptable Color Difference Using Printed Samples. In Proceedings of the 2nd International Congress on Image and Signal Processing, Tianjin, China, 17–19 October 2009; pp. 1–4. [Google Scholar]
- Garcia, E. DeltaE2000. 2022. Available online: https://rgbcmyk.com.ar/en/xla-2/ (accessed on 25 May 2022).
- Warner, R. Measurements of Water-holding Capacity and Color: Objective and Subjective. In Encyclopedia of Meat Sciences, 2nd ed.; Dikeman, M., Devine, C., Eds.; Academic Press: Cambridge, MA, USA, 2014; pp. 164–171. [Google Scholar] [CrossRef]
- Schelkopf, C.S.; Rice, E.A.; Swenson, J.K.; Hess, A.M.; Geornaras, I.; Belk, K.E.; Nair, M.N. Nix Pro Color Sensor provides comparable color measurements to HunterLab colorimeter for fresh beef. J. Food Sci. Technol. 2021, 58, 3661–3665. [Google Scholar] [CrossRef] [PubMed]
- Holman, B.W.; van de Ven, R.J.; Mao, Y.; Coombs, C.E.; Hopkins, D.L. Using instrumental (CIE and reflectance) measures to predict consumers’ acceptance of beef colour. Meat Sci. 2017, 127, 57–62. [Google Scholar] [CrossRef]
- Khliji, S.; van de Ven, R.; Lamb, T.A.; Lanza, M.; Hopkins, D.L. Relationship between consumer ranking of lamb colour and objective measures of colour. Meat Sci. 2010, 85, 224–229. [Google Scholar] [CrossRef] [PubMed]
- Choubert, G.; Blanc, J.-M.; Vallée, F. Colour measurement, using the CIELCH colour space, of muscle of rainbow trout, Oncorhynchus mykiss (Walbaum), fed astaxanthin: Effects of family, ploidy, sex, and location of reading. Aquac. Res. 1997, 28, 15–22. [Google Scholar] [CrossRef]
- Honikel, K.O. Reference methods for the assessment of physical characteristics of meat. Meat Sci. 1998, 49, 447–457. [Google Scholar] [CrossRef]
- Milovanovic, B.; Djekic, I.; Miocinovic, J.; Djordjevic, V.; Lorenzo, J.M.; Barba, F.J.; Mörlein, D.; Tomasevic, I. What Is the Color of Milk and Dairy Products and How Is It Measured? Foods 2020, 9, 1629. [Google Scholar] [CrossRef]


| N | Nix | Minolta | Machine Vision | |||||||
|---|---|---|---|---|---|---|---|---|---|---|
| L* | a* | b* | L* | a* | b* | L* | a* | b* | ||
| Raw prawns | 7 2 | 46.44 (2.48) | −1.72 (0.71) | −5.91 (2.71) | 45.54 (1.99) | −1.14 (0.66) | −4.93 (2.55) | 47.67 (6.88) | 1.10 (1.96) | 11.24 (5.73) |
| Cooked prawns | 7 | 66.96 (2.82) | −3.06 (1.56) | 3.92 (3.42) | 65.50 (2.66) | −2.48 (1.42) | 5.78 (3.39) | 55.95 (3.81) | 3.32 (2.07) | 19.98 (3.13) |
| Raw rockling | 8 | 53.37 (3.26) | −1.57 (1.00) | −5.23 (2.20) | 52.77 (2.89) | −1.06 (0.92) | −3.82 (2.18) | 53.10 (6.73) | 2.76 (2.99) | 6.92 (4.03) |
| Cooked rockling | 8 | 79.87 (5.21) | −2.92 (0.81) | 2.24 (2.07) | 80.05 (4.71) | −2.01 (0.77) | 3.00 (1.90) | 61.12 (3.07) | 0.80 (0.94) | 8.40 (1.45) |
| Raw salmon | 8 | 39.65 (3.27) | 13.45 (1.76) | 15.54 (2.23) | 41.10 (2.72) | 11.38 (1.44) | 15.14 (2.05) | 32.95 (2.75) | 32.02 (3.10) | 38.51 (4.08) |
| Cooked salmon | 8 | 78.33 (2.41) | 14.80 (1.37) | 19.33 (1.52) | 76.76 (1.66) | 15.00 (1.24) | 21.26 (1.65) | 54.19 (1.59) | 18.38 (1.42) | 22.42 (2.05) |
| Method 1 | Method 2 | |||||
|---|---|---|---|---|---|---|
| Sample | Device | L* | a* | b* | Highest | |
| Raw prawns | Nix | 22 | 8 | 9 | 22 | 9 |
| Minolta | 23 | 8 | 10 | 23 | 9 | |
| Machine vision | 3 | 2 | 2 | 3 | 1 | |
| Cooked prawns | Nix | 10 | 10 | 19 | 19 | 12 |
| Minolta | 10 | 10 | 15 | 15 | 11 | |
| Machine vision | 3 | 2 | 3 | 3 | 1 | |
| Raw rockling | Nix | 17 | 4 | 4 | 17 | 11 |
| Minolta | 15 | 5 | 4 | 15 | 11 | |
| Machine vision | 3 | 2 | 3 | 3 | 1 | |
| Cooked rockling | Nix | 3 | 5 | 3 | 5 | 8 |
| Minolta | 3 | 3 | 3 | 3 | 8 | |
| Machine vision | 1 | 3 | 3 | 3 | 1 | |
| Raw salmon | Nix | 6 | 8 | 7 | 8 | 9 |
| Minolta | 5 | 6 | 6 | 6 | 7 | |
| Machine vision | 3 | 7 | 5 | 7 | 1 | |
| Cooked salmon | Nix | 9 | 6 | 5 | 9 | 7 |
| Minolta | 10 | 6 | 4 | 10 | 5 | |
| Machine vision | 3 | 2 | 2 | 3 | 1 | |
Disclaimer/Publisher’s Note: The statements, opinions and data contained in all publications are solely those of the individual author(s) and contributor(s) and not of MDPI and/or the editor(s). MDPI and/or the editor(s) disclaim responsibility for any injury to people or property resulting from any ideas, methods, instructions or products referred to in the content. |
© 2024 by the authors. Licensee MDPI, Basel, Switzerland. This article is an open access article distributed under the terms and conditions of the Creative Commons Attribution (CC BY) license (https://creativecommons.org/licenses/by/4.0/).
Share and Cite
Watkins, K.; Hastie, M.; Ha, M.; Hepworth, G.; Warner, R. Machine Vision Requires Fewer Repeat Measurements than Colorimeters for Precise Seafood Colour Measurement. Foods 2024, 13, 1110. https://doi.org/10.3390/foods13071110
Watkins K, Hastie M, Ha M, Hepworth G, Warner R. Machine Vision Requires Fewer Repeat Measurements than Colorimeters for Precise Seafood Colour Measurement. Foods. 2024; 13(7):1110. https://doi.org/10.3390/foods13071110
Chicago/Turabian StyleWatkins, Kieren, Melindee Hastie, Minh Ha, Graham Hepworth, and Robyn Warner. 2024. "Machine Vision Requires Fewer Repeat Measurements than Colorimeters for Precise Seafood Colour Measurement" Foods 13, no. 7: 1110. https://doi.org/10.3390/foods13071110
APA StyleWatkins, K., Hastie, M., Ha, M., Hepworth, G., & Warner, R. (2024). Machine Vision Requires Fewer Repeat Measurements than Colorimeters for Precise Seafood Colour Measurement. Foods, 13(7), 1110. https://doi.org/10.3390/foods13071110