Article

Fungal Mycobiome of Mature Strawberry Fruits (Fragaria x ananassa Variety ‘Monterey’) Suggests a Potential Market Site Contamination with Harmful Yeasts

Biofood and Nutraceutics Research and Development Group, Faculty of Engineering in Agricultural and Environmental Sciences, Universidad Técnica del Norte, 100150 Ibarra, Ecuador
*
Author to whom correspondence should be addressed.
Foods 2024, 13(8), 1175; https://doi.org/10.3390/foods13081175
Submission received: 16 March 2024 / Revised: 7 April 2024 / Accepted: 10 April 2024 / Published: 12 April 2024
(This article belongs to the Special Issue Fungi, Spoilage, and Food Safety)

Abstract

:
An amplicon metagenomic approach based on the ITS2 region of fungal rDNA was used to investigate the diversity of fungi associated with mature strawberries collected from a volcanic orchard and open-air market stands. Based on the Kruskal–Wallis test, no statistically significant differences were observed in both non-phylogenetic and phylogenetic alpha diversity indices. According to beta diversity analyses, significant differences in fungal communities were found between groups (orchard vs. market). Taxonomic assignment of amplicon sequence variables (ASVs) revealed 7 phyla and 31 classes. The prevalent fungal phyla were Basidiomycota (29.59–84.58%), Ascomycota (15.33–70.40%), and Fungi-phy-Insertae-sedis (0.45–2.89%). The most predominant classes among the groups were Saccharomycetes in the market group, and Microbotryomycetes and Tremellomycetes in the orchard group. Based on the analysis of microbiome composition (ANCOM), we found that the most differentially fungal genera were Hanseniaspora, Kurtzmaniella, and Phyllozyma. Endophytic yeasts Curvibasidium cygneicollum were prevalent in both groups, while Candida railenensis was detected in fruits originating only from the market. In addition, Rhodotorula graminis (relative abundance varying from 1.7% to 21.18%) and Papiliotrema flavescens (relative abundance varying from 1.58% to 16.55%) were detected in all samples regardless of origin, while Debaryomyces prosopidis was detected in samples from the market only, their relative abundance varying with the sample (from 0.80% to 19.23%). Their role in fruit quality and safety has not been yet documented. Moreover, several clinically related yeasts, such as Meyerozyma guilliermondii and Candida parapsilosis, were detected in samples only from the market. Understanding the variety and makeup of the mycobiome in ripe fruits during the transition from the orchard to the market is crucial for fruit safety after harvest.

1. Introduction

The berries most consumed, strawberries (Fragaria x ananassa Duch.), are non-climatic and highly perishable fruits, vulnerable to phytopathogen infection and extremely sensitive to postharvest storage [1]. Strawberries have a very short postharvest self-life (about seven days at 4 °C and three days at room temperature) [2]. The loss of weight and firmness is the main problem, in addition to the change in its organoleptic characteristics [2]. Healthy strawberries have a diverse microbiota that includes molds potential plant pathogens, and human pathogens [3]. The airborne fungus causes the deterioration of fruits and loses marketability [4]. To reduce fungus infections, fungicides are applied; however, their overuse and improper application have several drawbacks, such as risks to human health, adverse effects on nontarget organisms, the environment, and the emergence of resistant genotypes [5]. Due to their widespread presence in the environment, fungi are crucial parts of both agricultural and natural ecosystems, where they are essential for the turnover of nutrients [6]. Fruit-associated fungi can influence the quality of products derived from horticultural systems and lead to either beneficial or spoiling qualities [7].
The microorganisms in fresh fruits have been studied mainly to detect pathogenic bacteria and their possible link to disease outbreaks in humans [8,9]. In addition, fruit damage is likely to occur during handling, uncontrollable harvesting techniques, storage, and transportation conditions, especially when there are large distances between production and market areas [10]. According to early reports, 65% of strawberry loss is related to the transportation from the field to the market [2]. The fungal mycobiome linked to various strawberry organs (leaves, flowers, immature, and mature fruits), which were grown on a farm with regular application of chemical pesticides, was previously disclosed [11]. According to this study, the two most prevalent genera were Botrytis and Cladosporium, accounting for 70–99% of the relative abundance of all sequences. Agriculture practices and continental location may also influence the global plant microbiome [12]. However, the microbiome associated with strawberries is variety-specific, influenced by management, and related to plant-soil feedback in the phyllosphere and rhizosphere [13]. Moreover, the microbiome of fruits influences the shelf-life [14]. According to early research, fungi belonging to the genera Botrytis, Penicillium, Phytophthora, Verticillium, Alternaria, Cladosporium, Aureobasidium, Cryptococcus, and Rhizopus are the most prevalent pathogens that affect strawberries [15]. Botrytis cinerea (gray mold) is considered one of the primary causes of post-harvest losses.
The strawberry growing farms in Northern Ecuador are located at an elevation of 2300 to 2500 m, with primarily volcanic soil. Daytime temperatures range from 18 to 25 degrees Celsius, while nighttime lows are between 8 and 13 degrees Celsius with a relative humidity of 60%. Additionally, farmers are not trained in the use of agrochemicals; this contributes to the empiricism of the region in managing strawberry production [16]. Recently, using 16S DNA metabarcoding analysis, we investigated the bacterial diversity in strawberry fruits from a farm producer and fruits purchased form the market and detected several pathogenic bacteria in the fruit exocarp [17]. However, information on the fungal makeup of strawberry fruits originating from orchards and open-air market sites is scarce. To our knowledge, no research has thoroughly compared the fungal and yeast communities linked to Fragaria x ananassa variety ‘Monterey’ fruits collected from a volcanic orchard and commercial stands at ready-to-eat maturity stage. We hypnotized that the fruits at the same maturity stage share similar mycobiome community. Therefore, using an ITS2-based metagenomic approach, we examined the general fungal and budding yeast communities in the exocarp of strawberries harvested from a volcanic orchard (ripe phase four) and different open-air market stands. The mycobiome provide a means of improving fruit safety and aids in the development of additional preventive measures against postharvest contamination.

2. Materials and Methods

2.1. Fruit Sampling and Processing

Strawberry (Fragaria x ananassa variety ‘Monterey’) fruits were collected from a local orchard and different commercial stands of Imbabura Province, Northern Ecuador (geographical coordinates 0°14′00″ N 78°16′00″ O). Fruits in the maturity stage (ready to eat, stage four) with no visible damage and uniform size were harvested from the orchard as follows: 15 fruits per row × 6 field rows × 3 repetitions (total of 270 fruits) during February–October 2023. Commercial fruits were purchased from 6 distinct open-air market stands: 15 fruits × 6 stands × 3 repetitions (total 270 fruits). After being transported to the lab, the fruits were placed in Ziplock bags with 150 mL of sterile peptone water (0.1%). The bags were then incubated for 1.30 h at 37 °C, being gently mixed manually every 30 min. Before DNA extraction, cells surrounding the skin of the fruit (exocarp) were collected by centrifugation at 8000× g for 5 min, recovered in 1× PBS, and stored at 4 °C. Genomic DNA was isolated using a commercial column-based ZymoBIOMICS DNA miniprep kit (# D4304, Ecogen Barcelona, Spain) [18].

2.2. Library Construction, Sequencing, Data Processing, and Analysis

Illumina Novaseq platform (paired-end 150-bp reads, Illumina, San Diego, CA, USA) was used for metagenomic sequencing [18]. The ITS2 region was amplified using universal fungal primers ITS 86F (5′-GTGAATCATCGAATCTTTGAA-3′) and ITS 4 (5′-TCCTCCGCTTATTGATATGC-3′) [19]. All polymerase chain reaction (PCR) reactions involved the KAPA HiFi HotStart ReadyMix (# 2GFHSRMKB, Sigma Aldrich, St. Louis, MI, USA). A washing step with magnetic beads was used to remove free primers and primer dimers from the amplicons. For sequencing, up to 96 libraries were pooled using all Nextera XT indices. The process of preparing the library, purification, and sequencing was carried out as described [18]. To ensure taxonomic classification, a quality and filtering procedure was applied to the FASTq files. The QIIME v.2 pipeline (Quantitative Insights into Microbial Ecology) [20] was used for the analysis of marker gene-based microbiome sequencing data. The ITS2 region was extracted after the sequences were denoised using the denoise wrapper [21]. Denoising and clustering were performed with DADA2 [22,23]. Chimeric sequences were identified and filtered using USEARCH 6.1 [24]. In addition, a taxonomy is assigned to the sequences. Furthermore, the query ASV sequences were compared with a reference database UNITE Fungal ITS Database v7.2 (https://doi.org/10.15156/BIO/587475, accessed on 14 February 2024). Sequences belonging to chloroplasts, mitochondria, and eukaryotes were removed.

2.3. Rarefaction Curves

Rarefaction curves were used to assess how species diversity varied according to the number of sequences (reads) examined in a sample [25].

2.4. Analysis of Diversity

Alpha and beta diversity metrics were analyzed as previously described [17]. Briefly, for alpha diversity, the metrics listed below were calculated: (a) Faith’s phylogenetic diversity, a qualitative measure of community richness that considers phylogenetic relationships between traits; (b) Evenness/Pielou uniformity, an index that measures diversity in addition to species richness; (c) Shannon’s diversity index, to estimate species diversity within groups [26]; (d) observed characteristics, a qualitative measure of community wealth. Box plot figures were used to display the results. The alpha diversity data were compared using either a one-way analysis of variance in rank or a nonparametric Kruskal–Wallis test to see if the samples came from the same distribution. Both phylogenetic (UniFrac distance) and non-phylogenetic (Bray–Curtis dissimilarity and Jaccard distance) techniques were applied to measure beta diversity [27]. The statistical significance of the observed differences was assessed using weighted and unweighted UniFrac distance matrices and 999 Monte Carlo permutations. The composition of the fungal community was correlated with the sample group using principal coordinates analysis (PCoA) using QIIME v.2 [20]. Scatter diagrams, either two- or three-dimensional, can be used to visualize the summary of beta diversity relationships. For all statistical procedures, a significance level of 0.05 was considered.

2.5. Statistical Significance Tests

The analysis of similarities (ANOSIM) was used to test the hypothesis that there is no difference between the two groups of samples. The R test was employed to determine whether there are differences between the groups under the null hypothesis [28]. Additionally, to infer absolute microbial abundances, the taxa with significantly differential abundances were identified using ANCOM analysis [29]. A centered log ratio (CLR) transformation was applied to account for the compositionality of the microbiome data. The output W statistic indicates how many CLR-transformed models exist for a particular taxon in which the taxon is differentially abundant with the variable of interest. As the W value increases, the probability of a taxa being differentially abundant increases. To ascertain the similarities between the groups at the genus level, hierarchical clustering was carried out using the unweighted pair group method (UPGMA with Euclidean distance). In addition, Venn diagrams were drawn to investigate the intersection of the fungal genera and species between groups (orchard vs. market). A bioinformatic platform (https://www.bioinformatics.com.cn/en, accessed on 14 February 2024) was used to conduct these analyses.

3. Results and Discussion

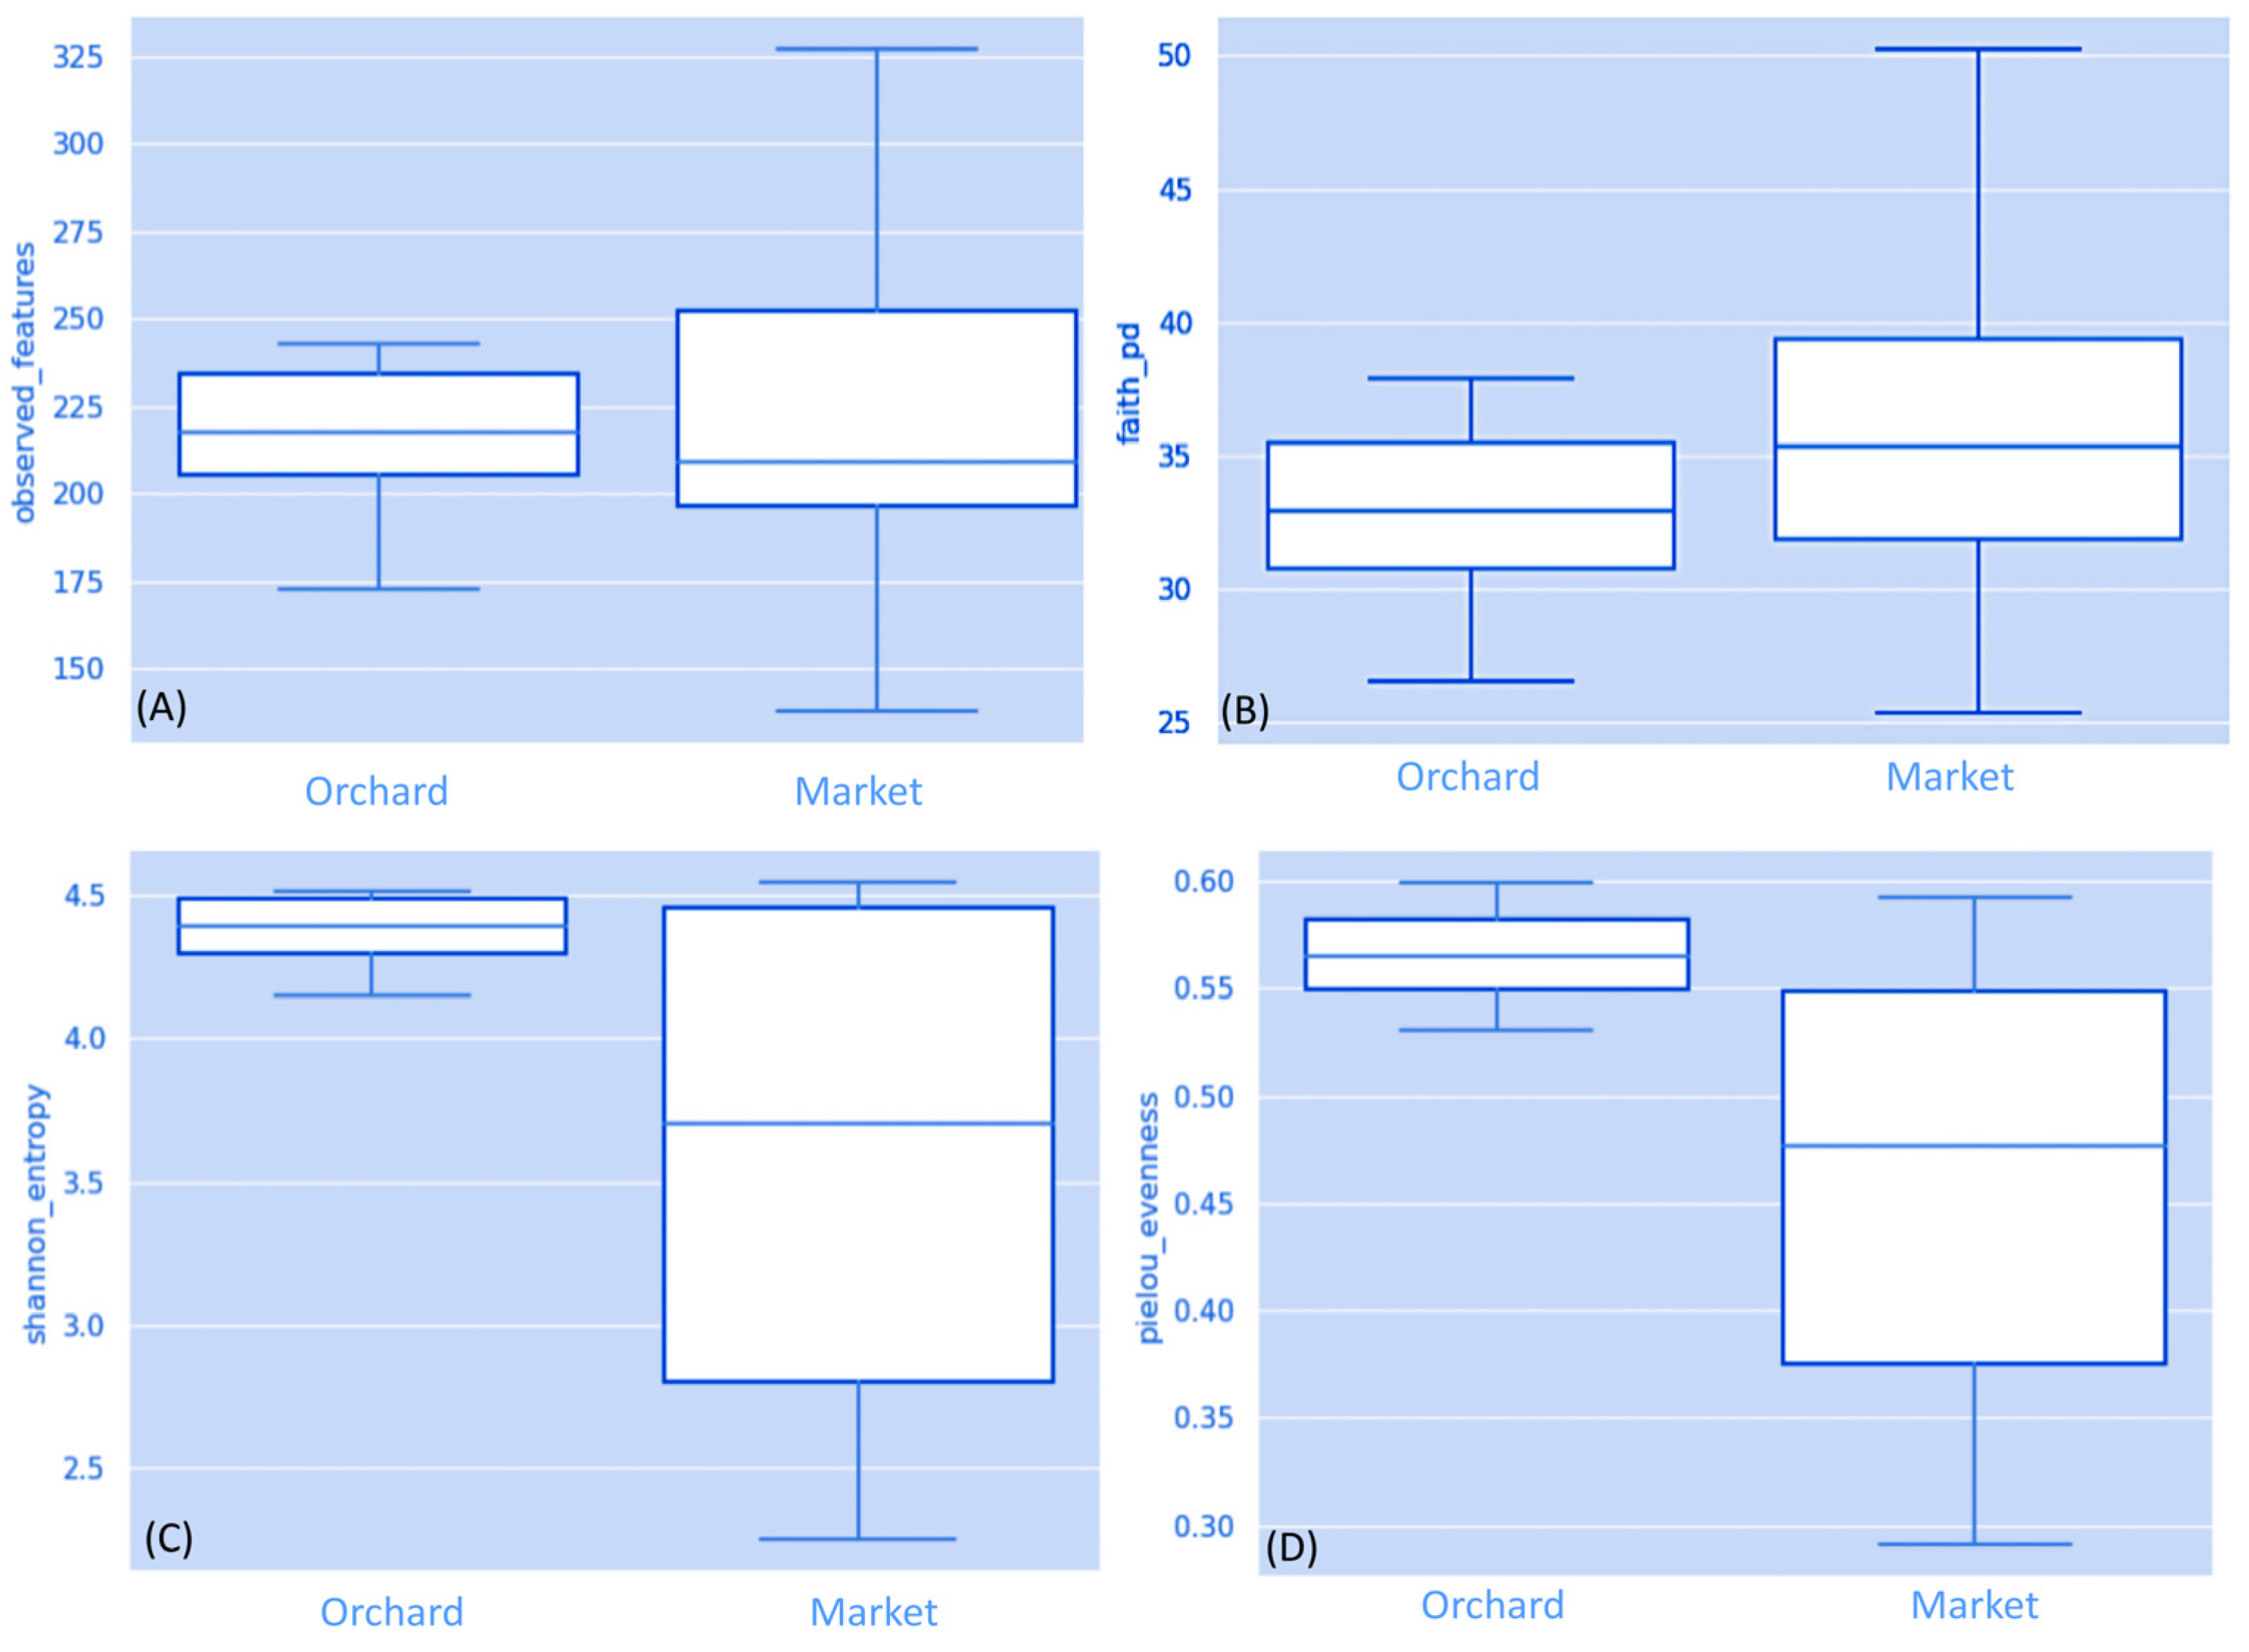
3.1. Fungal Communities in Ripe Strawberry Fruits: Alpha-Diversity Analysis

Amplicon sequencing was produced from 158,184 to 401,669 high-quality reads per sample (Table S1). Following filtration to eliminate non-target reads (such as mitochondria or chloroplasts), the sequences were attributed to ASVs (Table 1). According to the rarefaction analysis, most of the taxa included in the samples were adequately captured at a sequencing depth of 150,000 (Figure S1). The alpha diversity analysis indicated that strawberry fruits from the market and the orchard share similar fungi diversity (Table 1). Based on the Kruskal–Wallis test, no statistically significant differences were noted in the non-phylogenetic and phylogenetic alpha diversity indices, such as observed ASVs (H = 0.0064; p = 0.93), Faith’s PD (H = 0.4102; p = 0.52), and Shannon’s index (H = 0.6410; p = 0.42) (Figure 1A–D). However, based on Pielou’s evenness index, the samples from the market sites showed a more abundant fungi community than the samples from the orchard (H = 2.5641; p = 0.10). In previous research, we showed a significant difference in bacterial alpha diversity in strawberry samples collected from the market at the same ripe stage [17]. Furthermore, according to conventional bacteriological methods conducted in strawberry fruits purchased from the market and orchard at the same ripe stage, a high number of molds and yeasts were detected in the fruit samples from the market [30]. Previously, a metagenomic survey on fungal diversity conducted on different strawberry organs showed high fungal diversity in plant organs (leaves and flowers) rather than immature and mature fruits [11]. Furthermore, the fungal diversity in ripe and stored strawberry fruits was higher than in diseased fruits [31]. Based on 26S ribosomal DNA analysis in ripe greenhouse strawberries, it has been shown that microorganism concentration increased with mechanical damage to the fruit, and its firmness is negatively correlated with the increase of the microorganism in the skin of the fruit [2].

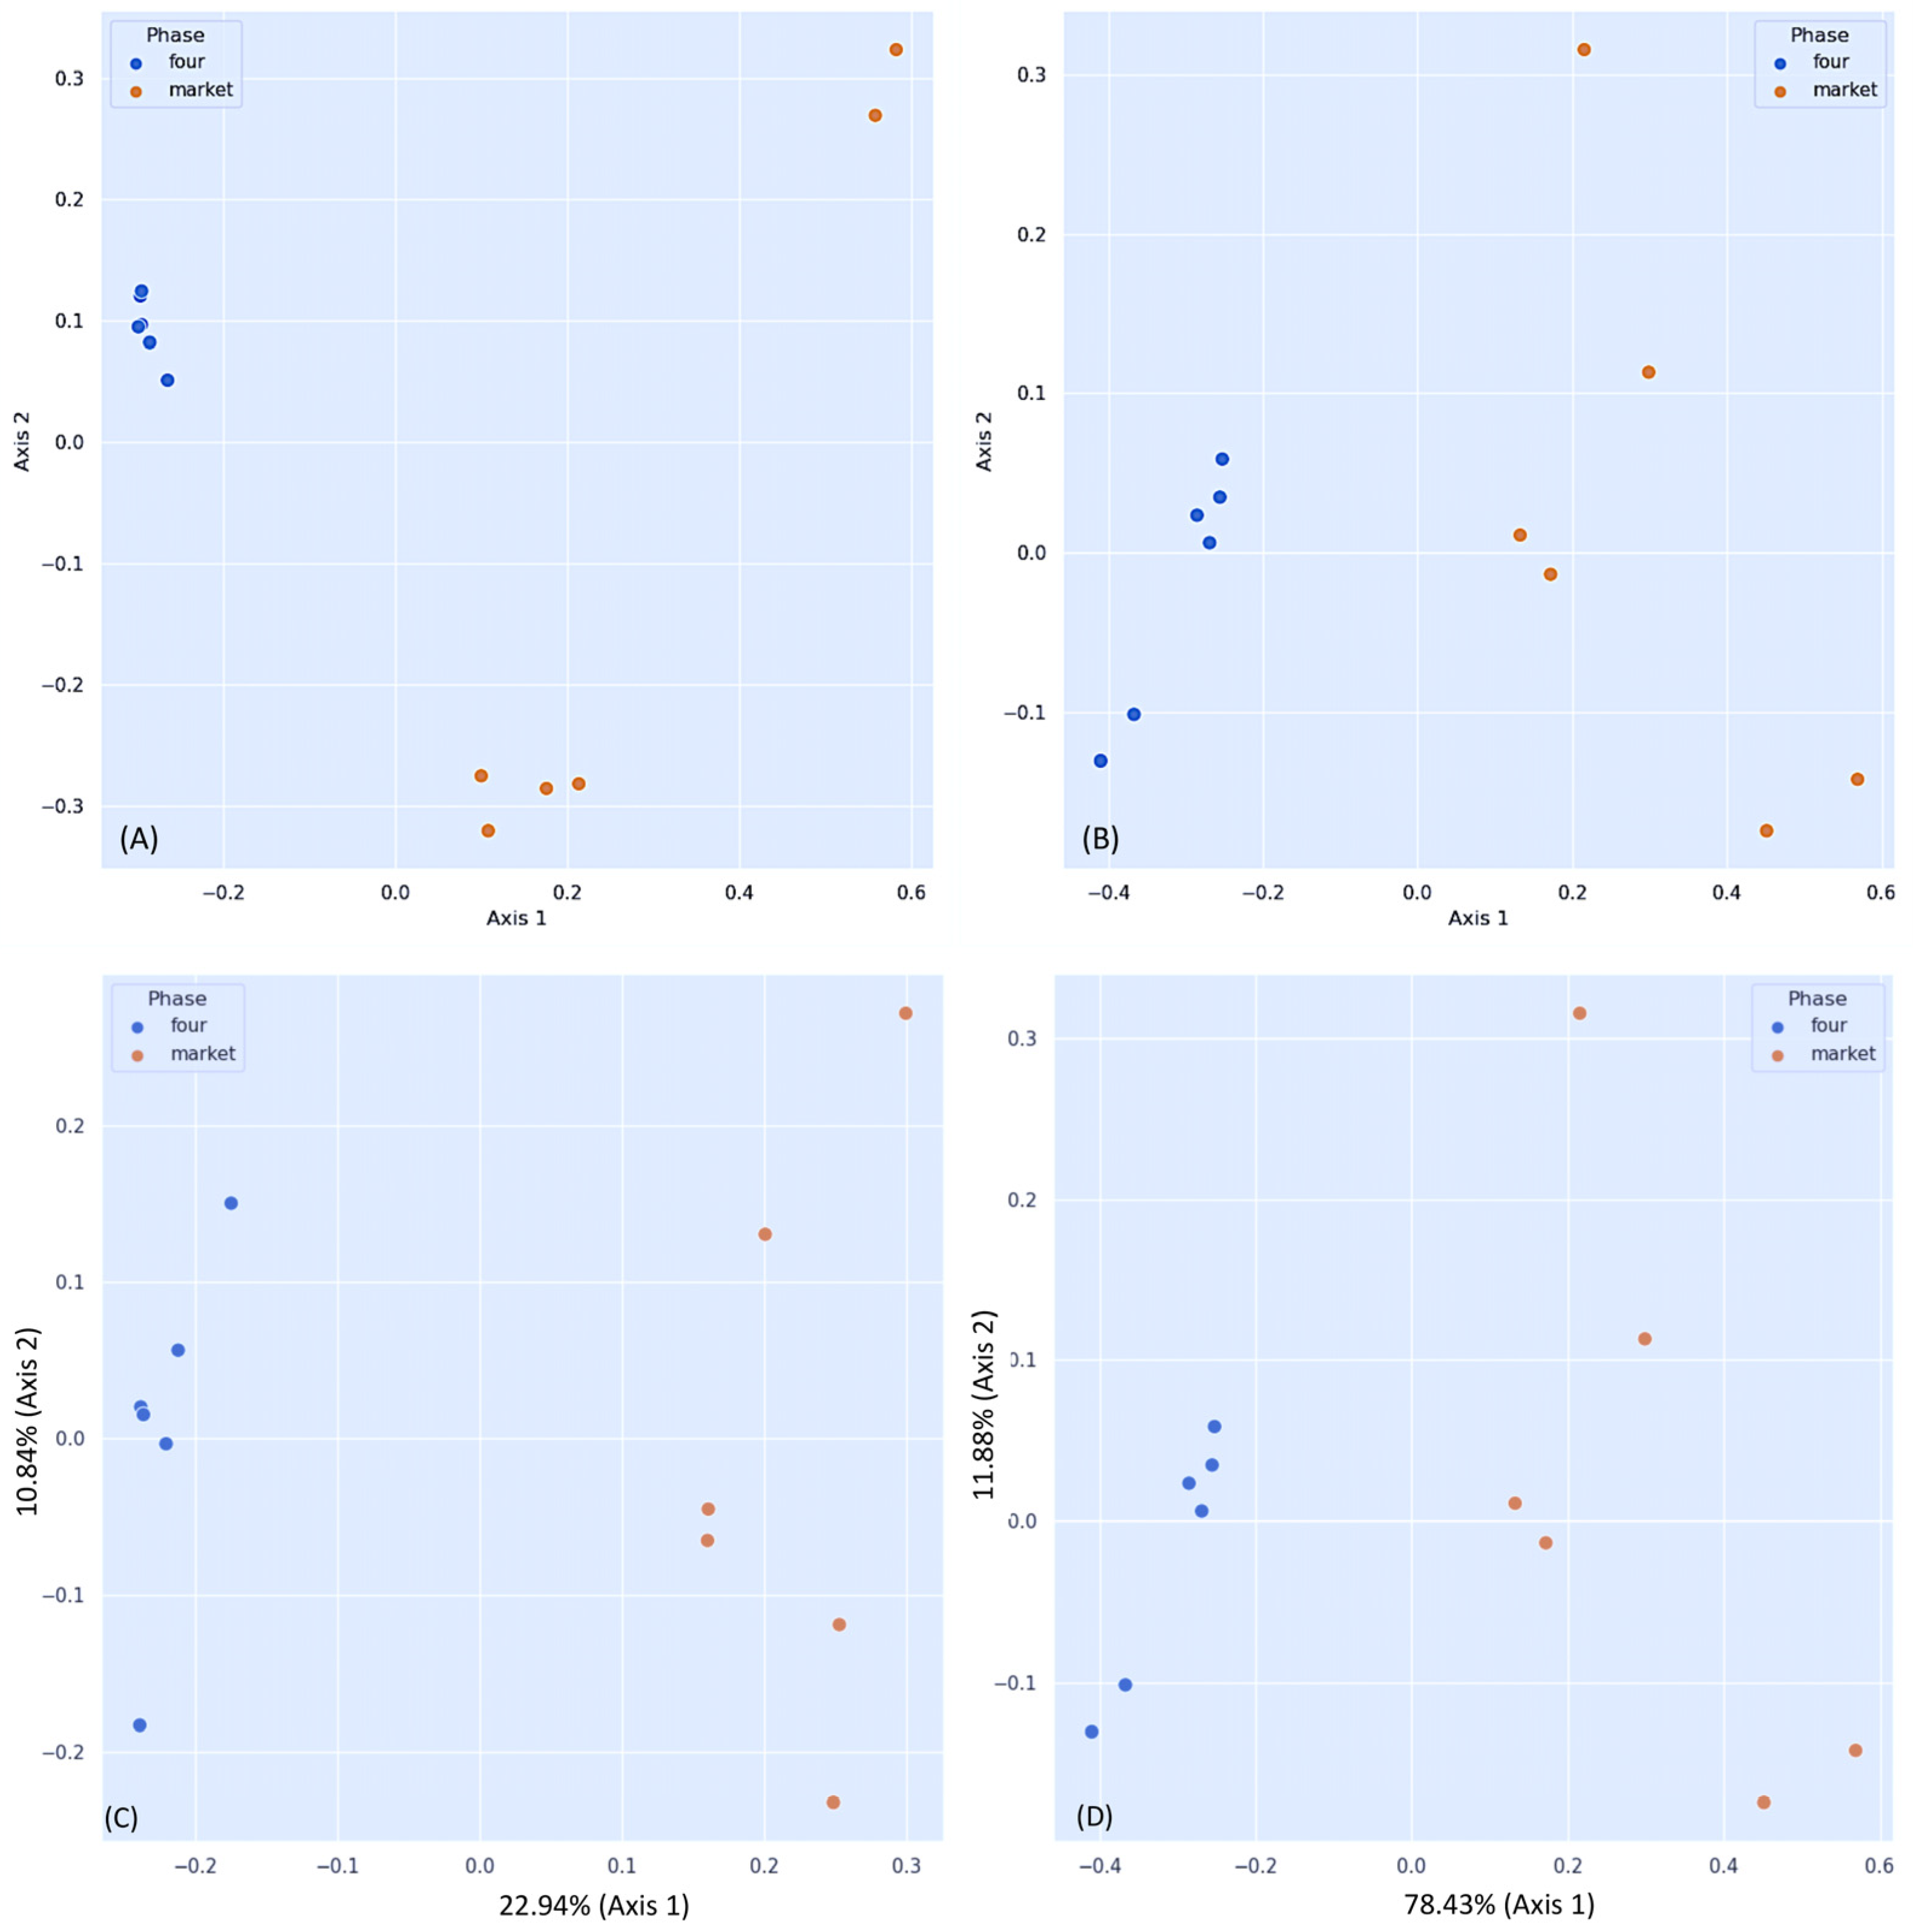
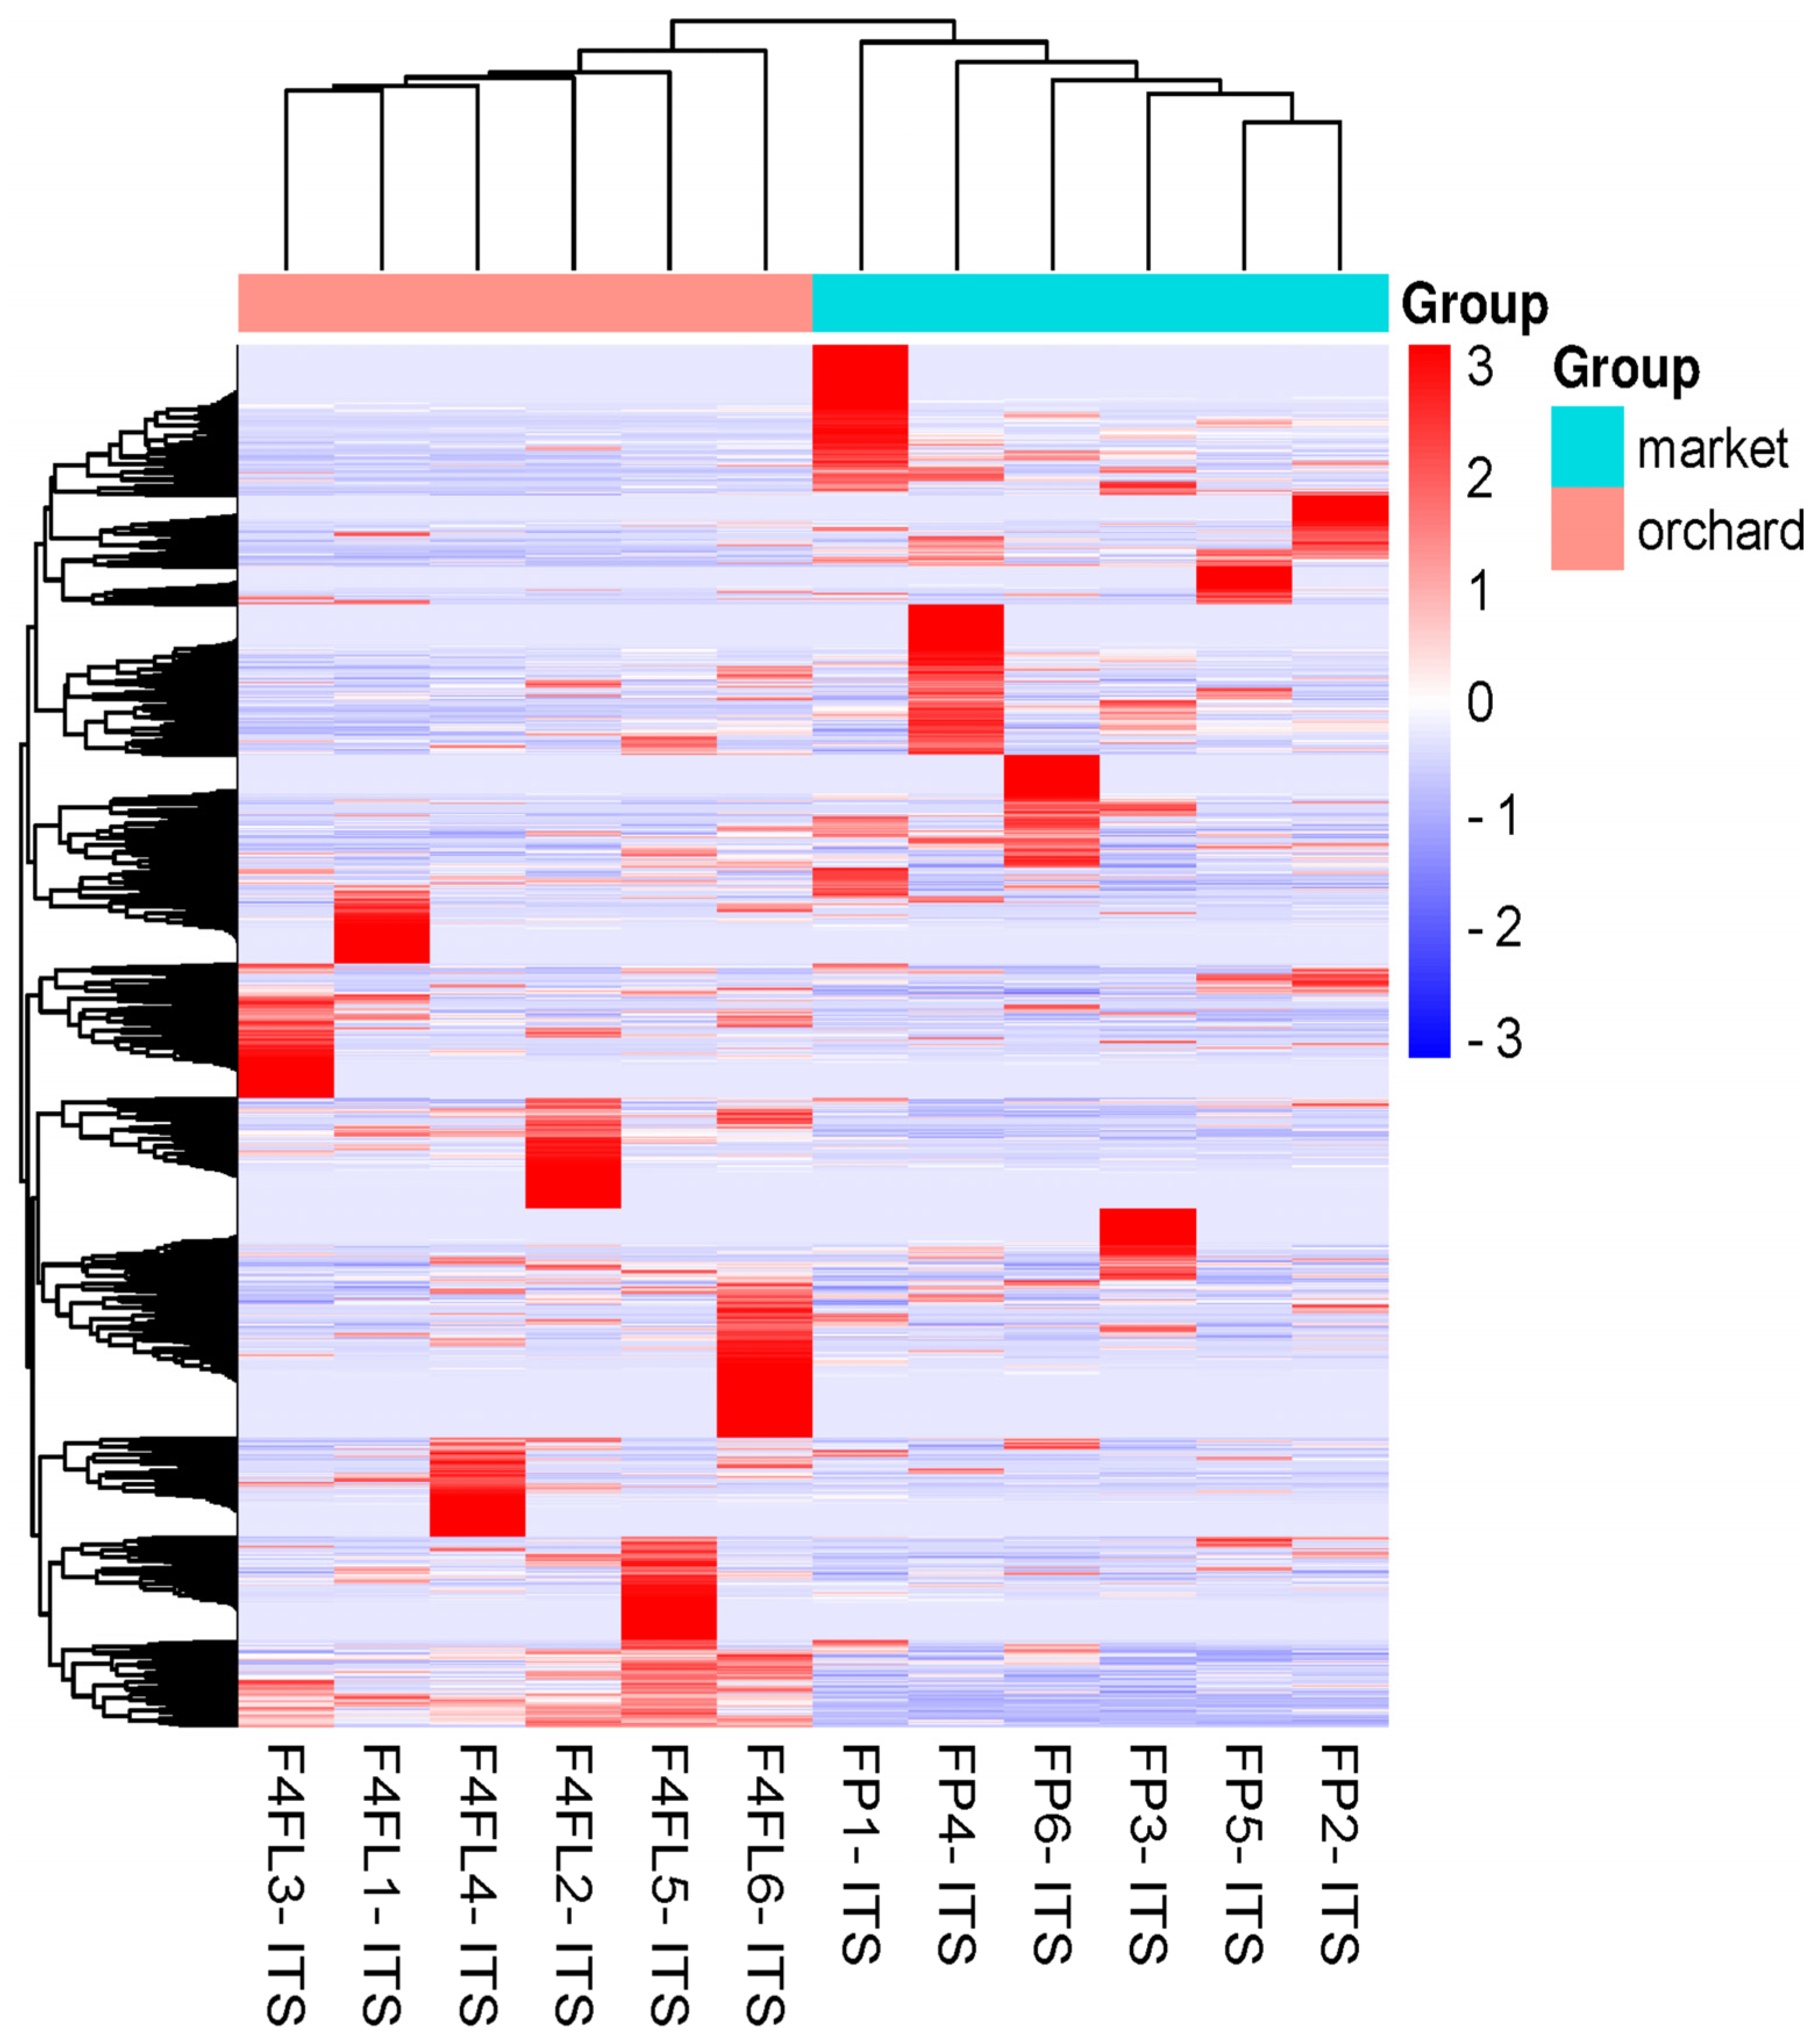
3.2. Differential Fungal Community of Ripe Strawberry Fruits: Beta-Diversity Analysis

According to the non-phylogenetic distance analyses Jaccard (PERMANOVA, pseudo-F = 3.119, p = 0.003) (Figure 2A) and Bray–Curtis (PERMANOVA, pseudo-F = 8.192, p = 0.006), we found significant differences between the groups (orchard vs. market) (Figure 2B). The diversity of the fungi between groups based on unweighted and weighted UniFrac metrics revealed significant differences (p = 0.03) between the orchard and the market (Table 2). When calculating the unweighted UniFrac distance as a phylogenetic index (PERMANOVA, pseudo-F = 3.994, p = 0.003), significant differences were found (Figure 2C). The market group samples formed a distinct cluster from the orchard samples, according to the PCoA map for the abundance of unweighted UniFrac distance. Furthermore, significant differences in beta diversity were detected when the weighted UniFrac distance was measured (PERMANOVA, pseudo-F = 22.2981, p = 0.003) (Figure 2D). Variable F1 (Axis 1) explained 78.43% of the total variance by loading the market samples, whereas variable F2 (Axis 2) explained 11.88% of the variance by loading the orchard samples. In addition, R values near 1.0 (0.99 and 0.93, respectively) suggest that there is a dissimilarity between groups based on ANOSIM and the unweighted and weighted UniFrac distance results. Similarly, the Bray–Curtis and Jaccard similarity results indicate dissimilarity between the groups (R values: 1.00 and 0.59, respectively). These results were in concordance with our previous DNA barcoding study on strawberry fruits, showing that the bacterial community of market group was divergent from the field group [17]. Like these findings, early metagenome surveys in strawberry showed a high beta-diversity of fungi in plant organs, but not in unripe and ripe fruits; the differences were related to the cultivar rather than the maturity stage [11,31]. It should be noted that the fruits used in this study were obtained from a conventional orchard (fungicidal treatments). However, there were significant differences in fungal diversity between the market and orchard groups, which means that upon harvest the fruits are more susceptible to contamination.

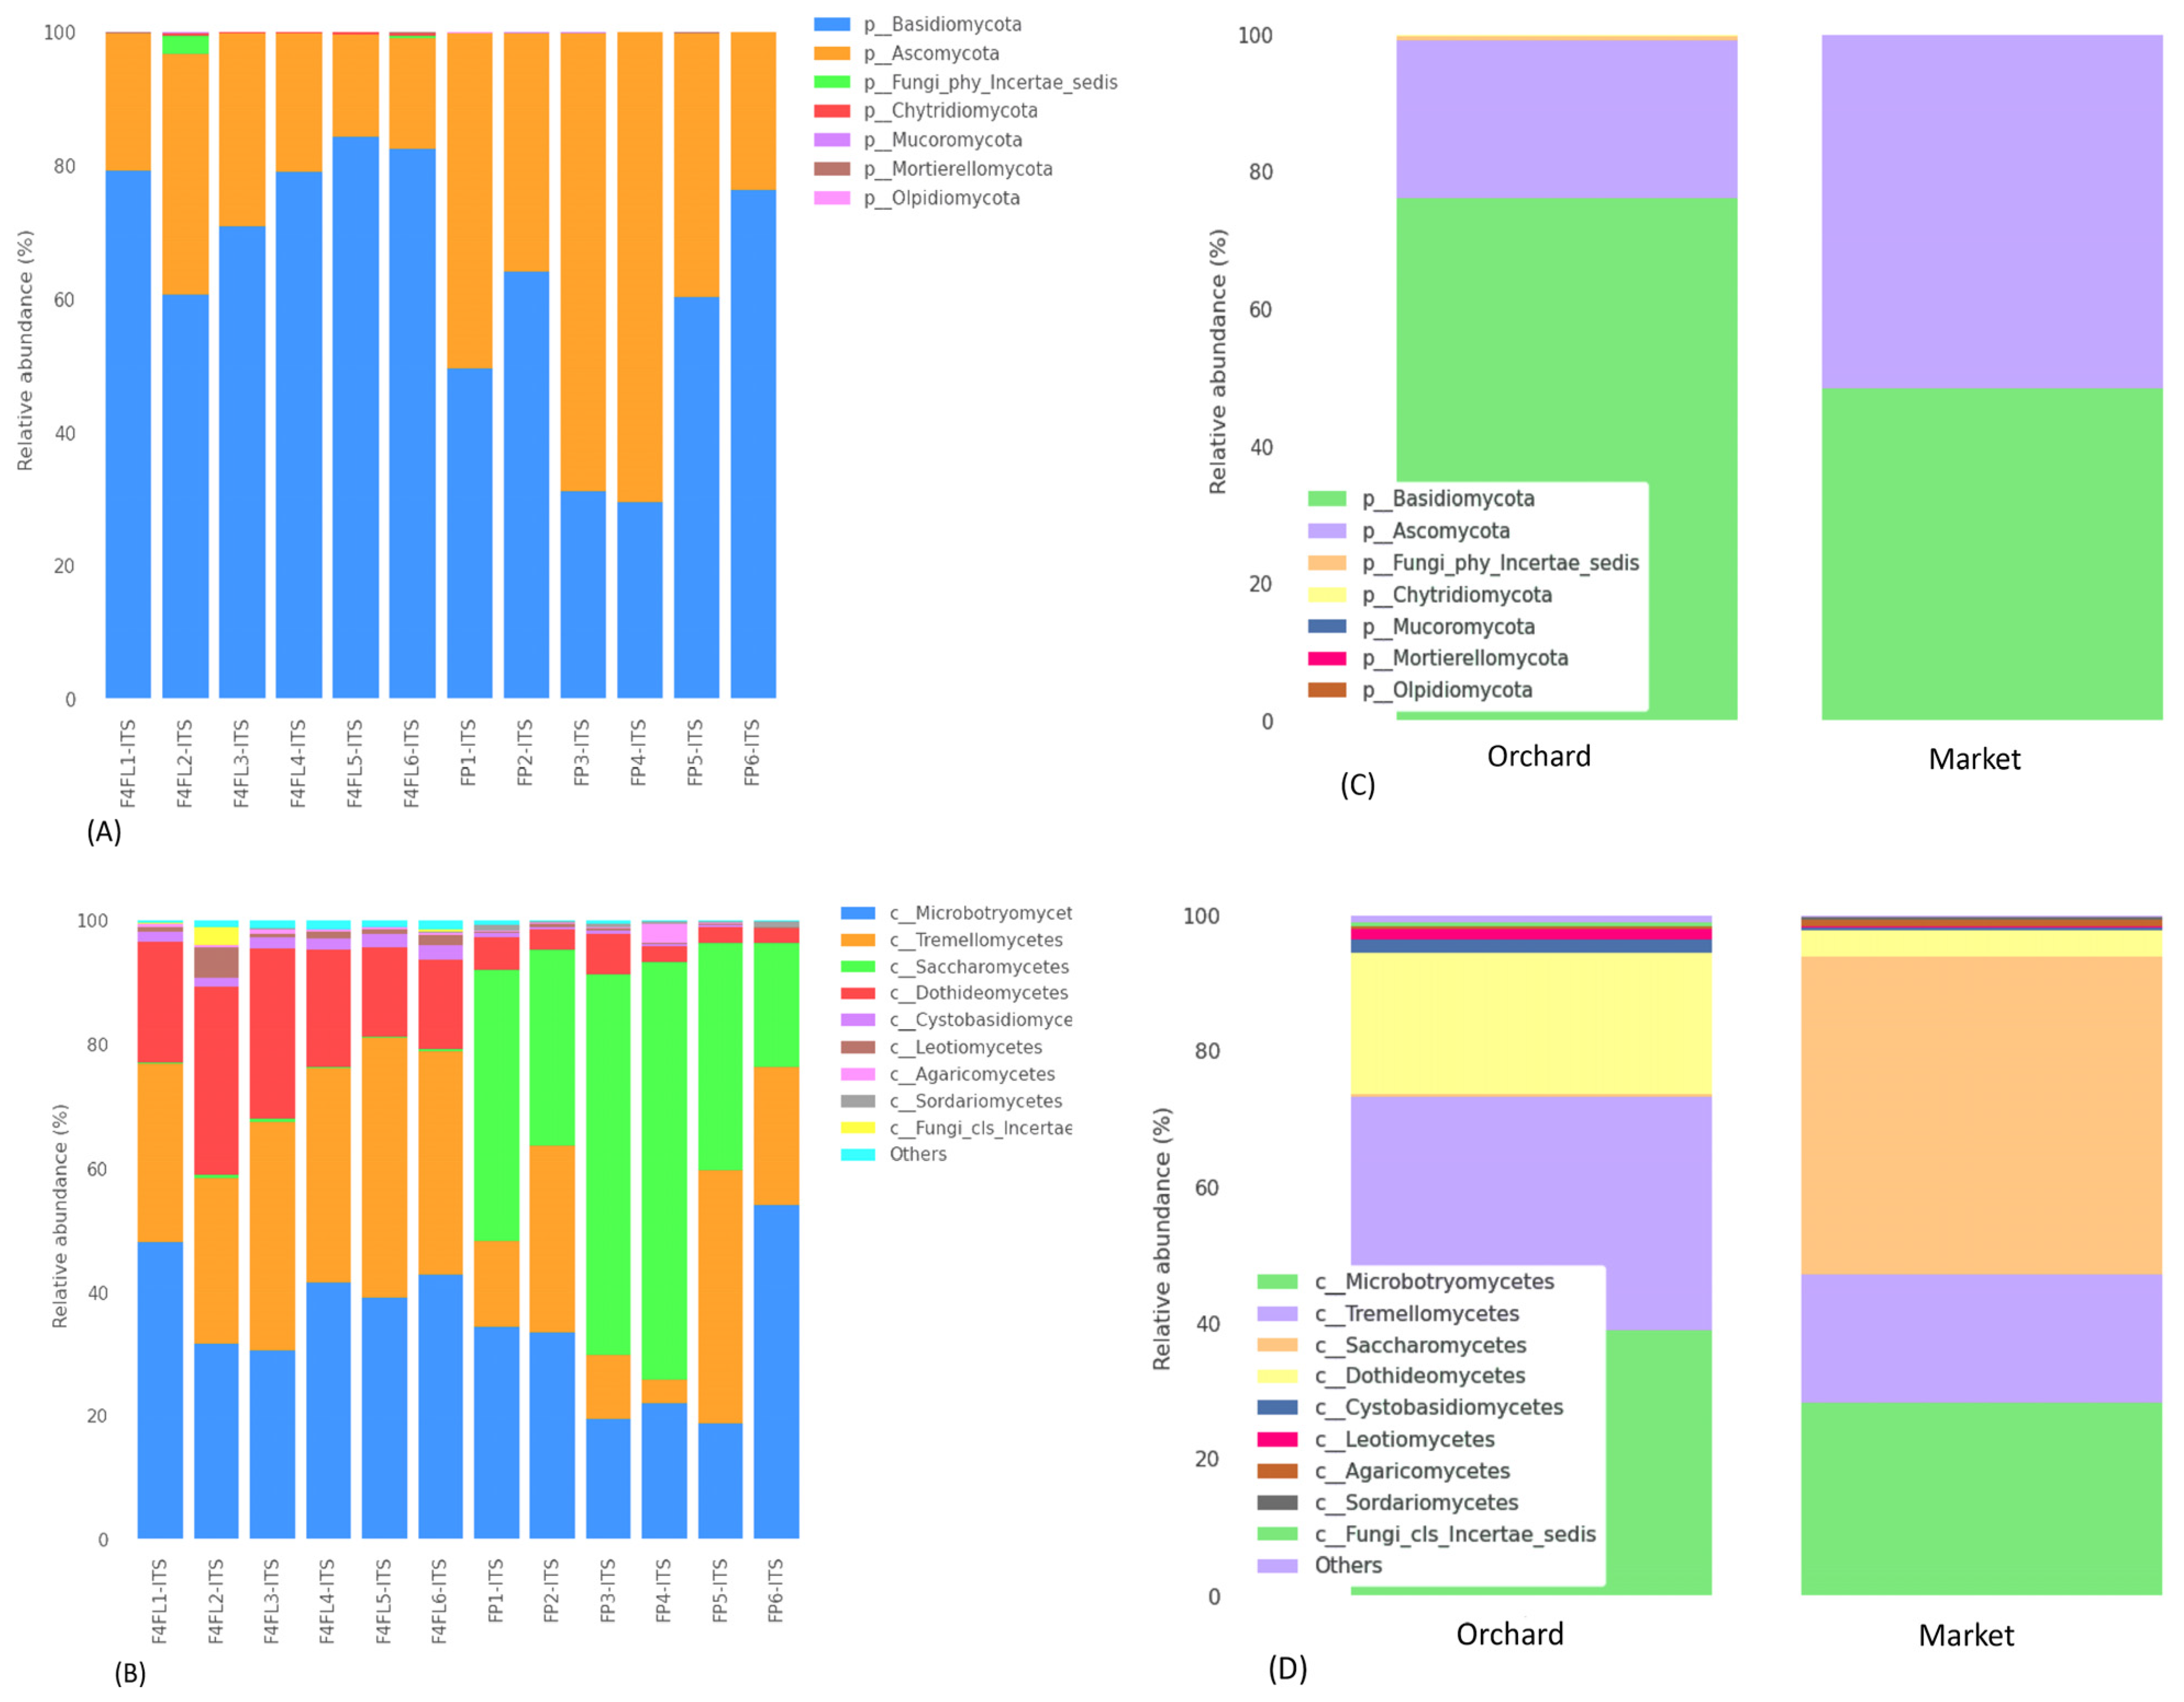
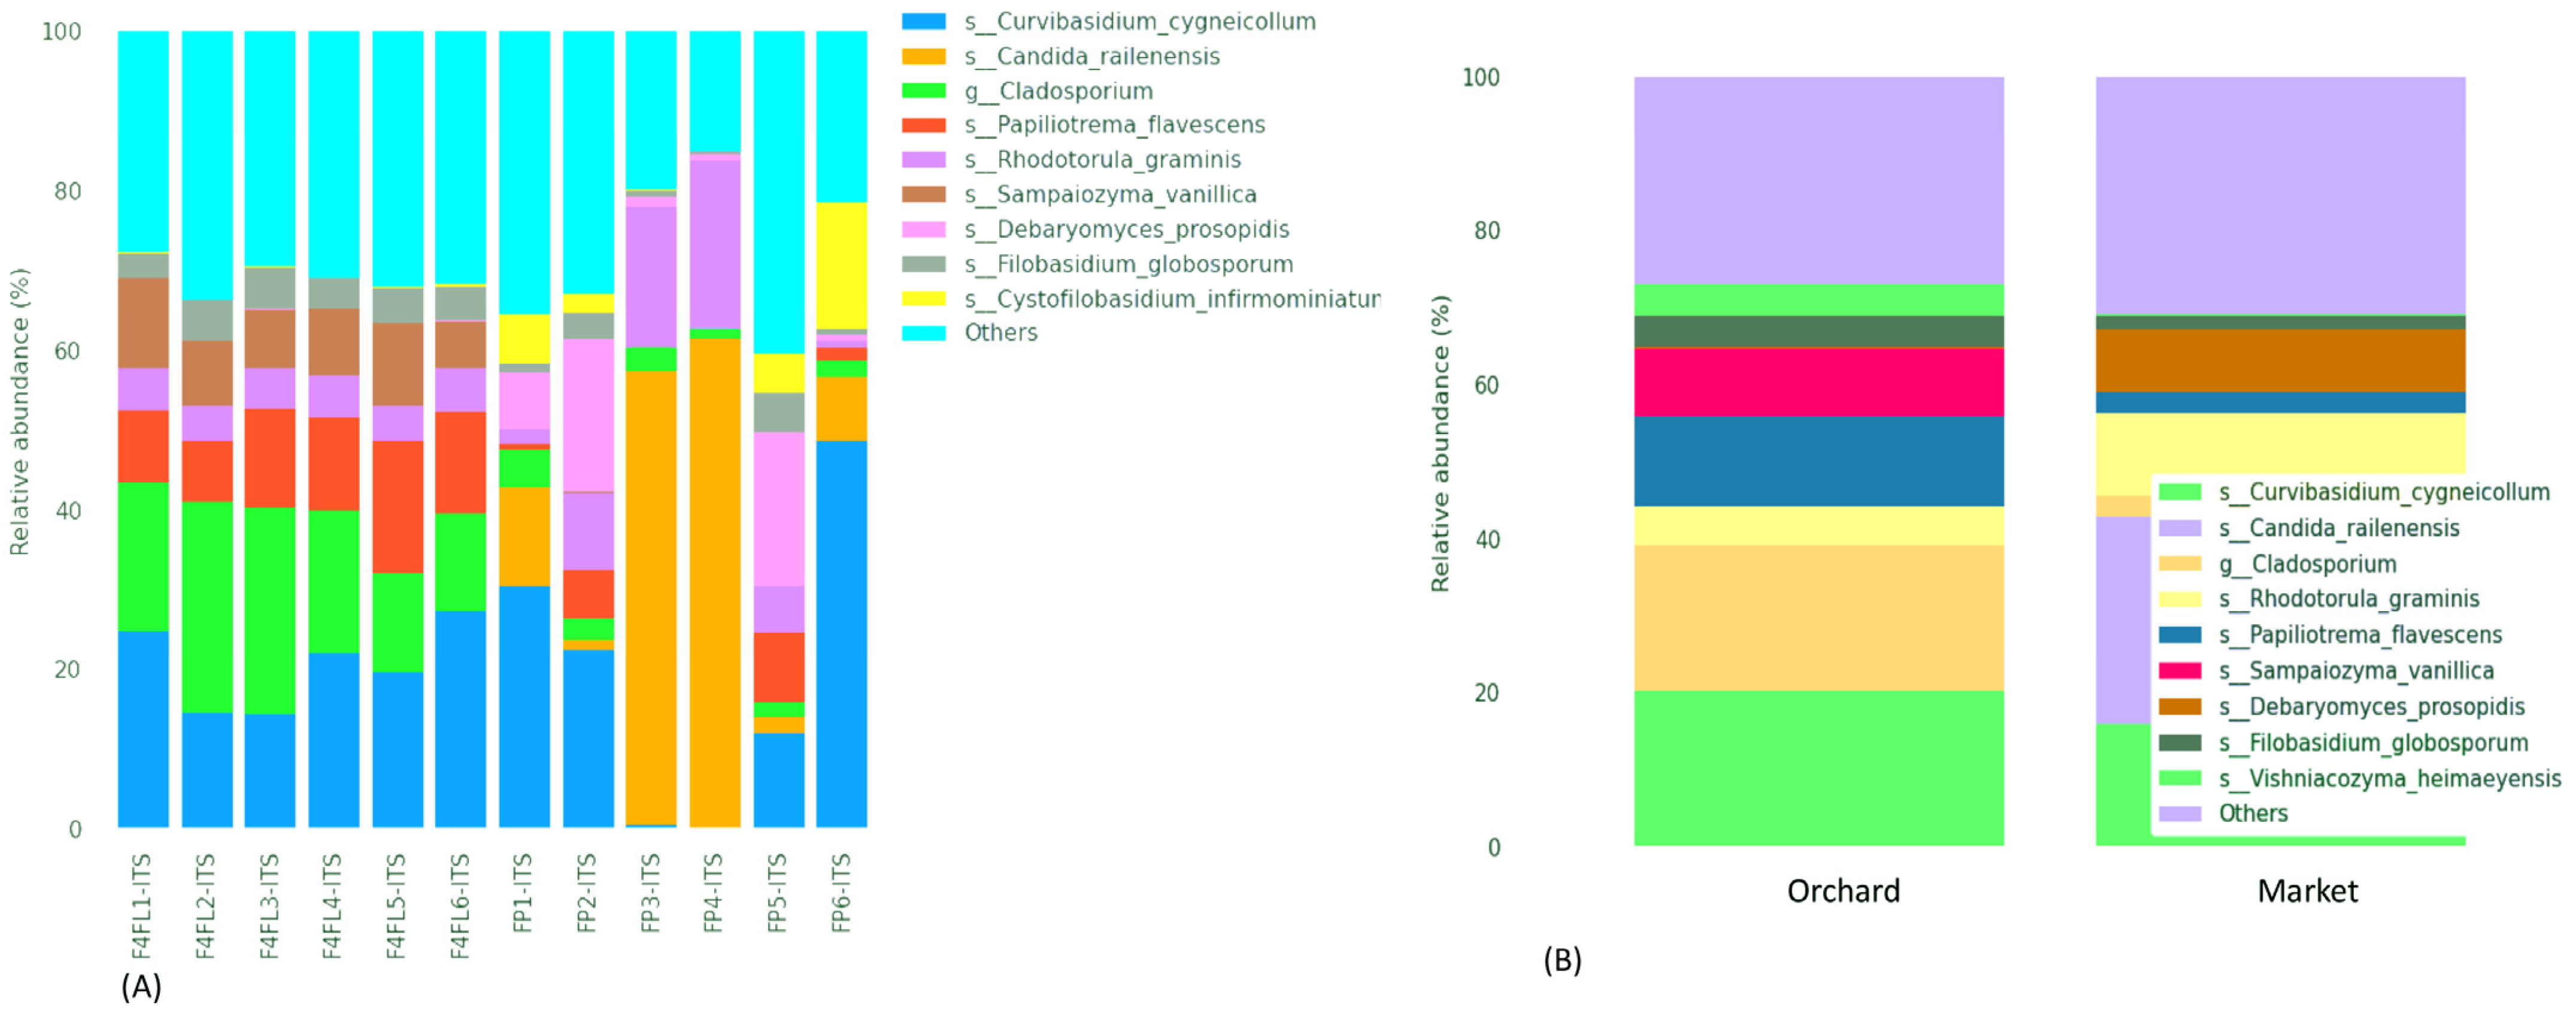
3.3. Taxonomic Assignment of Fungi

The taxonomic assignment of ASVs in fruits revealed 7 phyla and 31 classes. The fungal phyla were predominantly Basidiomycota (varies from 29.59 to 84.58%), Ascomycota (varies from 15.33 to 70.40%), Fungi-phy-Insertae-sedis (varies from 0.45 to 2.89%), as well as in lower abundance Chytridiomycota, Mucoromycota, Mortierellomycota and Olpidiomycota (Figure 3A). The most predominant classes were Microbotryomycetes, Tremellomycetes, and Dothideomycetes in the samples collected from the orchard, while Saccharomycetes and Microbotryomycetes were the most predominant in the market (Figure 3B). Between the groups, Basidiomycota was predominant in the orchard group, while Ascomycota was predominant in the market group (Figure 3C). Likewise, the most predominant classes among the groups were Saccharomycetes in the market group and Microbotryomycetes and Tremellomycetes in the orchard group (Figure 3D). In previous metagenomic analyses in different compartments of strawberry plants and ripe fruits, the fungal phyla were predominantly Ascomycota, Mortierellomycota, and Basidiomycota, and their prevalence was related to the cultivar and plant compartments [31]. Similarly, in the study of Jones et al. [33], Ascomycota followed by Basidiomycota and Zygomycota were the most abundant in strawberry fruits collected during the ripening stage from an orchard in the United Kingdom. However, no information was provided about the cultivar used. At the genus level, Curvibasidium, Cladosporium, and Papilliotrema were the most predominant in the orchard sample, while Candida, Rhodotorula, and Debaryomyces were the most prevalent in the market samples (Figure 4A,B). A recent study showed that endophytic yeasts such as Curvibasidium were detected in several fresh leafy vegetables and berry fruits [34]. Nonetheless, its role in the safety and quality of strawberry fruits was not investigated. Early research showed that Cladosporium spp. Are pathogens causing blossom blight in strawberries [35]. This pathogen causes green-gray sporulation on dead tissue and misshaped fruits [36]. A very recent study associated that some fungal species of the genera Papiliotrema, Vishniacozyma, and Filobasidium are responsible for the flavor formation of strawberries [37]. Microbiome surveys in strawberry plants and fruits showed that Botrytis and Cladosporium represented 70–99% of the relative abundance of all sequences [11]. The phyllosphere compartments contained the predominant fungal genera Mycosphaerella, unidentified Capnodiales, Alternaria, and unidentified Helotiales. The abundance of these genera varies depending on the strawberry cultivar. Botrytis was found in ripe fruits and had a similar distribution between the strawberry cultivars ‘Mara des Bois’ and ‘White annanas’ [31]. In the 26S ribosomal DNA study of Satitmunnaithum et al. [2] performed in ‘Tochiotome’ variety fruits obtained from a greenhouse field, the most abundant fungi were Altenaria spp., Aspergillius spp., Cryptococcus spp., and Ustilago spp. In another study, several fungal pathogens including Alternaria alternata (black leaf spot), Botrytis caroliniana (gray mold), and Plectosphaerella cucumerina (fruit root and collar rot) colonize healthy strawberry plants [38,39]. In the current investigation, the genus Botrytis and Altenaria were less prevalent (<0.2%) in the samples. Since the plants in previous studies were grown above 360 m and 877 m elevation [2,11], respectively, we speculate that the relative abundance of some species may be related to the growing conditions, above 2300 m elevation, where the soil is primarily volcanic and the storage conditions and to a lesser extent the variety. In addition, the difference in microbiome might be related to the differences on sampling seasonality. Furthermore, our metagenomic study indicates that there is no presence of B. cinerea, which is the causing agent of gray mold disease in almost all vegetable and fruit crops, including strawberry plants and post-harvest fruits [40]. We found B. caroliniana in all samples regardless of their origin. The lower abundance of these species could be explained by the fact that we selected intact fruits, with no visible spoilage at stage four. Based on ANCOM analysis, we found that the most differentially abundant fungal genera were Hanseniaspora, Kurtzmaniella, and Phyllozyma (Table 3). A volcano plot showing the ANCOM model W statistic is shown in Figure S2. Hanseniaspora uvarum (relative abundance of 0.33%) and Kurtzmaniella cleridarum (relative abundance of 0.23%) were the most common taxa in the samples from the market, while Phyllozyma copromiscola (relative abundance of 0.5%) was prevalent in the samples from the orchard. In both immature and ripe strawberries, taxa belonging to the Hanseniaspora, but not Kurtzmaniella, were previously found in lower abundance (0.1–0.13%) [31]. The Kurtzmaniella genus was described with a novel species K. cleridarum isolated from rotting wood, mushrooms, and fruits [41]. In a recent study, mature raspberry and strawberry fruits were shown to have a greater prevalence of Saccharomycetales, including H. uvarum, being among the fruits with the highest susceptibility to Drosophila suzukii [33]. Phyllozyma is a relatively new genus according to a recent taxonomy study [42]. Previous metagenomic surveys of strawberry plants and ripe fruits showed that the fungal microbiome varies with the strawberry cultivar and ripe stage [31]. However, the impact of Phyllozyma in fruit quality is not yet documented. Thus, we suggest that the mycobiome differences could be related to the cultivar, harvest season, geographic origin, and agriculture system.

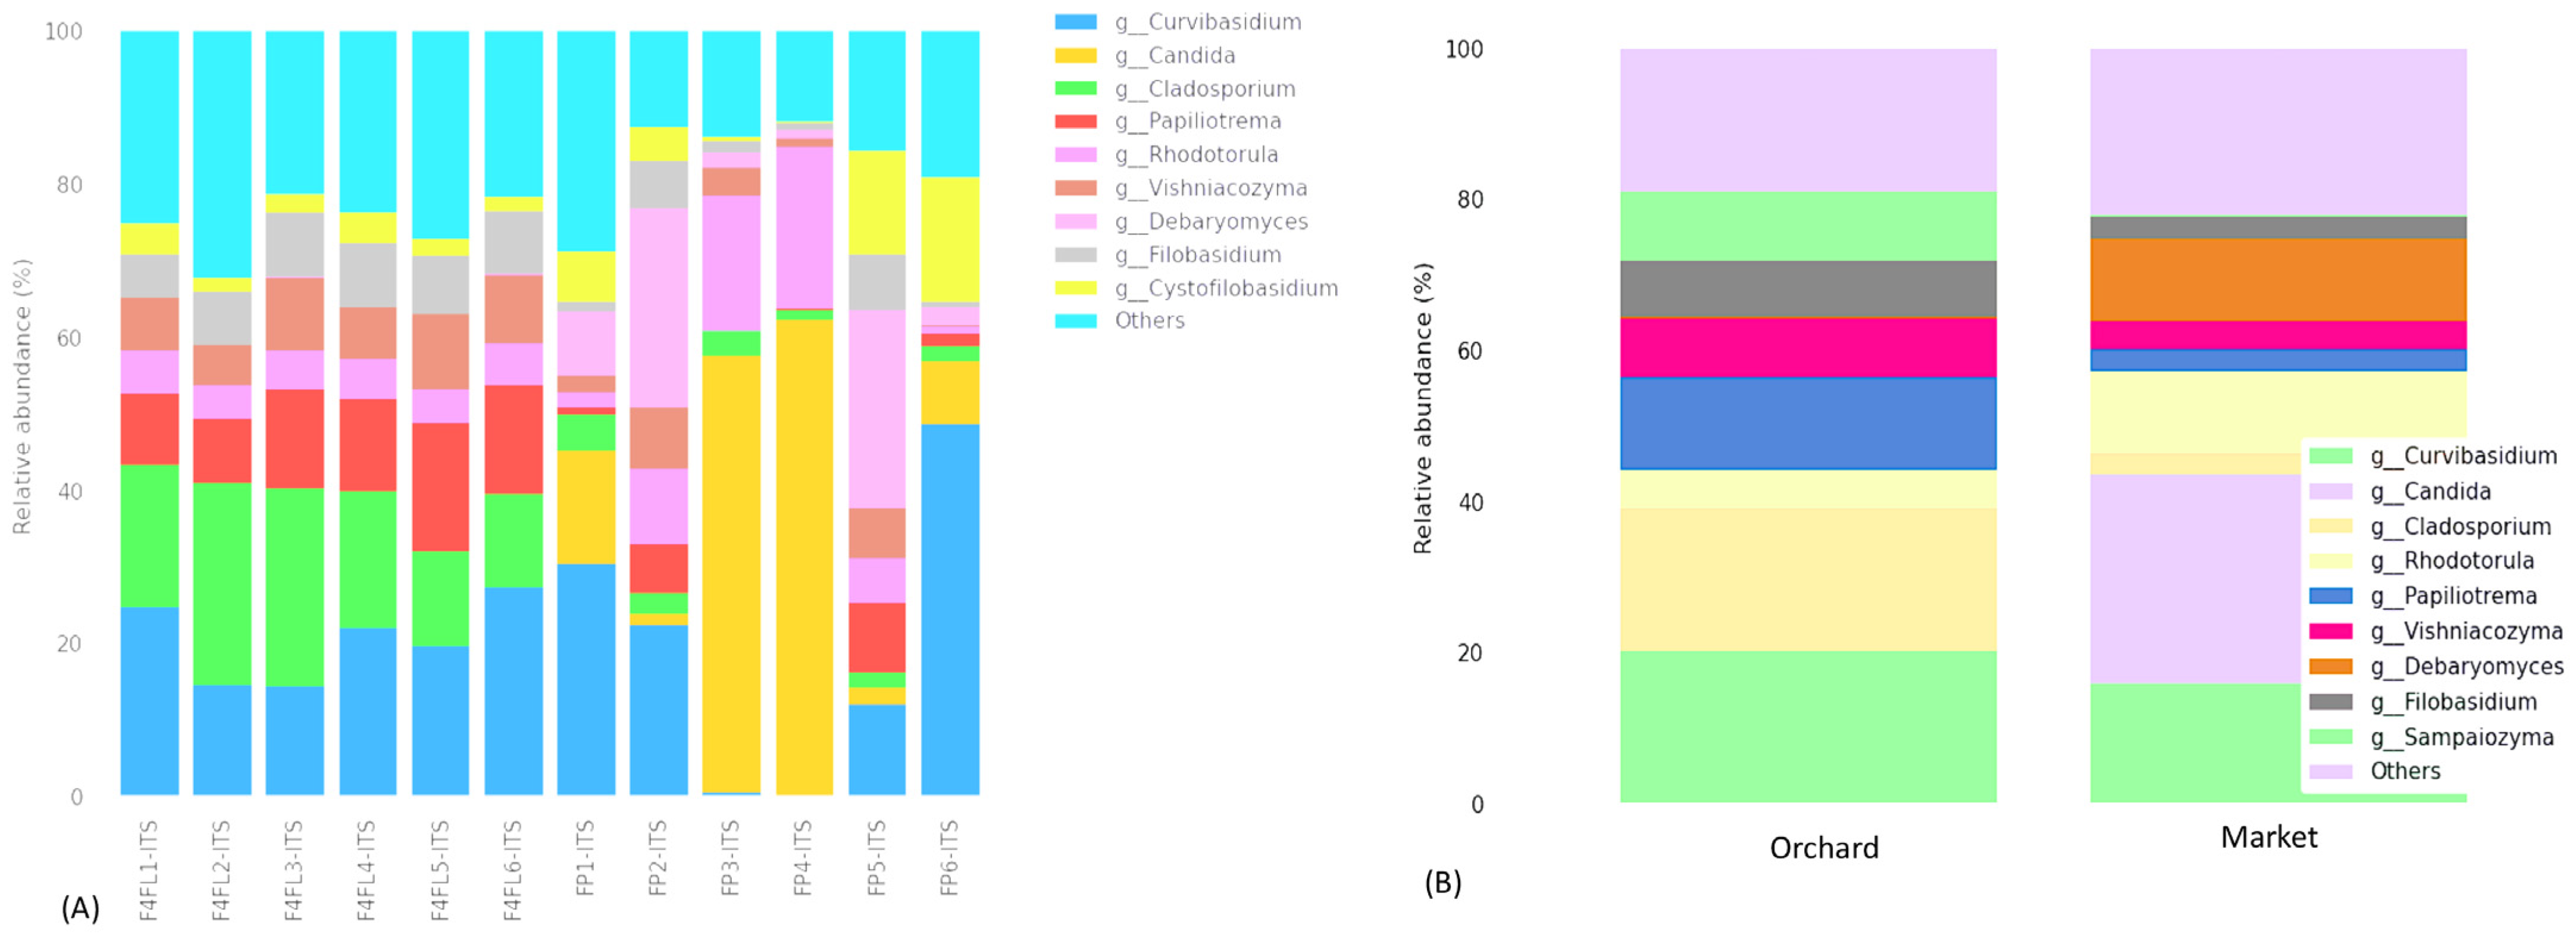
3.4. Taxonomic Assignment Suggests Both Beneficial and Harmful Yeasts in Strawberry Fruits

Fruits can be more storable and less susceptible to disease if their microbiomes are healthier and diverse. Early research indicates that during developmental stages, significant microbial fractions are transferred between different plant compartments [31]. Furthermore, as documented by Yan et al. [43], yeasts can colonize fruit surfaces for a prolonged duration; they can also inhibit the germination of pathogen spores and the length of the germ tube [44], induce a variety of defense-related enzyme activities that trigger host defense mechanisms, and assist in the biosynthesis of antimicrobial compounds [45]. Based on the abundance information of the main genera/species of all samples, a heatmap was drawn and the similarity and difference were shown (Figure 5). Similarly, the groups shared 91 (22.8%) genera and 128 (26.4%) species (Figure S3). Endophytic yeasts such as Curvibasidium cygneicollum were prevalent in strawberry samples regardless of the origin, except the market samples FP3-ITS and FP4-ITS (Figure 6A,B). C. cygneicollum was among the most common Basidiomycetes yeasts detected in stored fruits [46]. Interestingly, the predominant yeast species, such as Candida railenensis, was detected in fruits only from the market. Their relative abundance varies with the sample from 1.3% to 61.42%. C. railenensis was detected in grape berries and was the weakly ascomycetes associated with the fermentation to be used in the production of ice wine [47]. Likewise, Debaryomyces prosopidis was detected in samples from the market. From early analyses of fungal diversity in strawberries, these yeast species were not documented in ripe strawberry [11,31]. Thus, we suggest that might have something to do with the geographical origin, season, and the cultivar. Rhodotorula graminis (relative abundance varying from 1.7% to 21.18%) and Papiliotrema flavescens (relative abundance varying from 1.58% to 16.55%) were detected in all samples regardless of the origin, while Debaryomyces prosopidis was detected in samples from the market only, their relative abundance varying with the sample (0.80–19.23%) (Figure 6A,B). Previous studies indicate that R. graminis produces beta-carotene, torulene, and torularhodin to counteract ROS-induced cellular damage [48]. Additionally, Filobasidium globosporum was predominant in the samples from the orchard. Furthermore, although in lower abundance (0.9%) species of Colletotrichum were predicted in market-derived samples. Among them, C. acutatum, known as the leading cause of anthracnosis [49,50] in strawberries, was not detected in this study. Finally, a phylogenetic tree was built to reveal evolutionary relationships and biological diversity in a sequence data set (Figure S4).

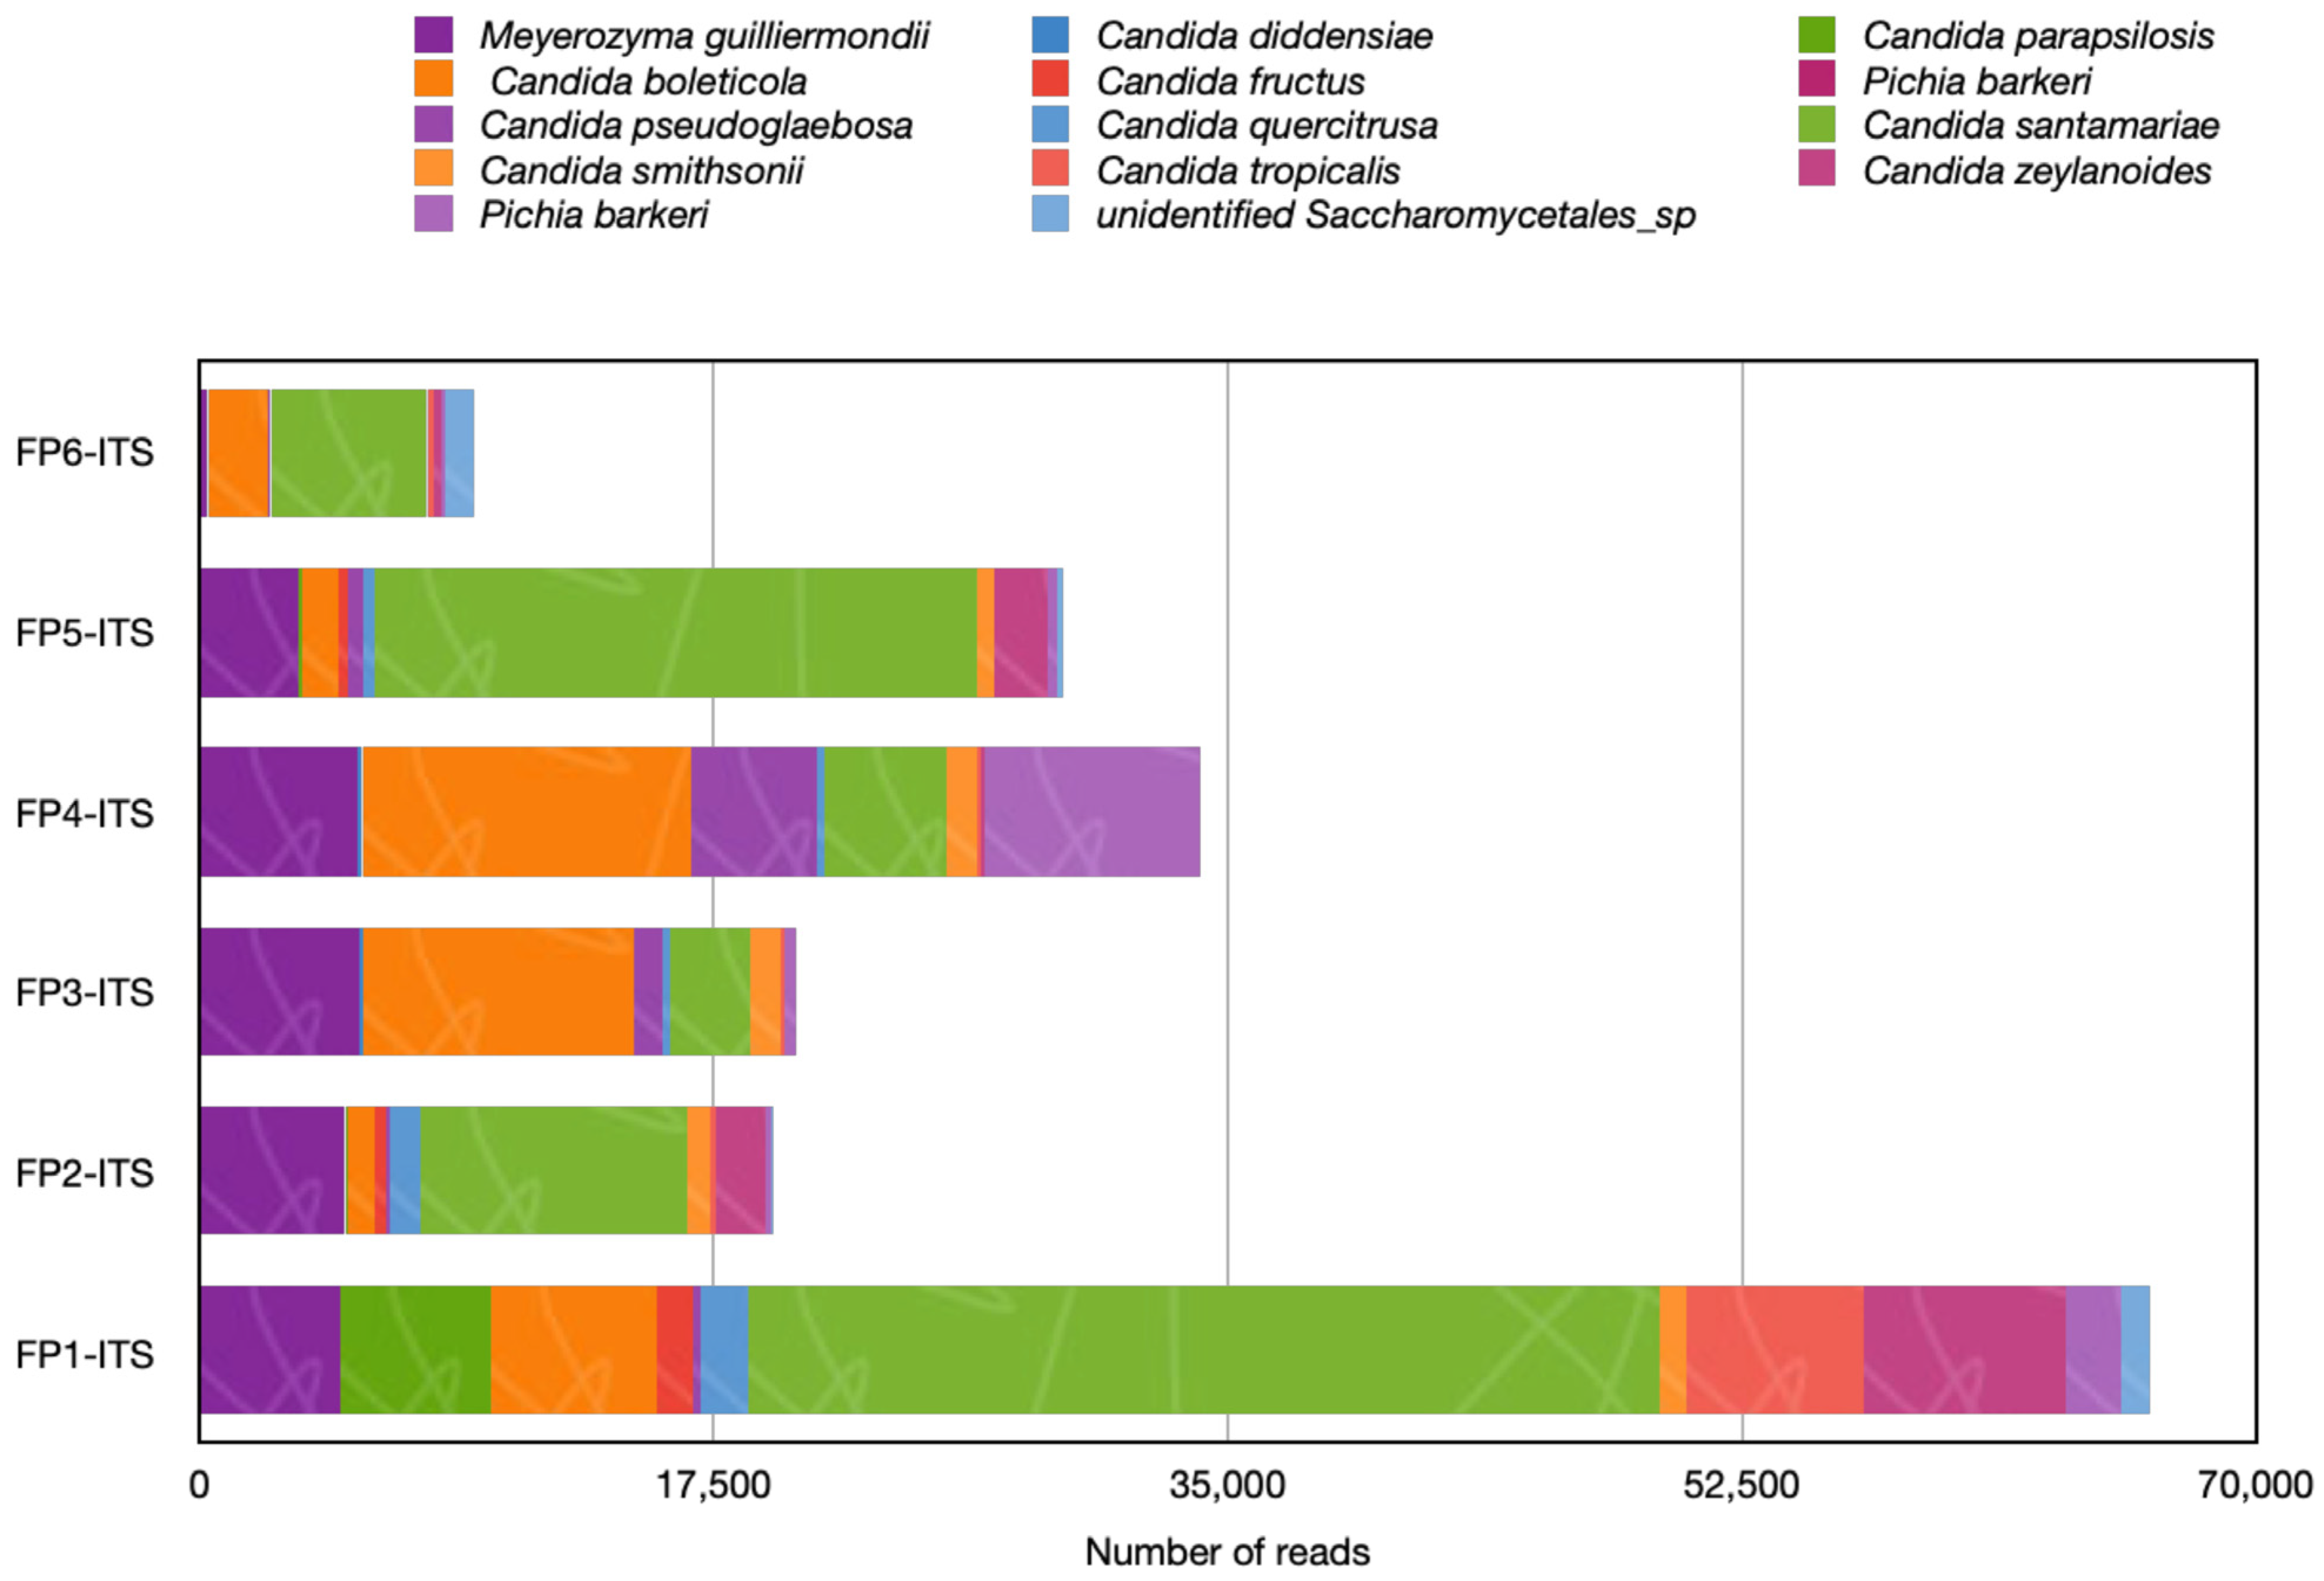
3.5. Clinically Related Yeasts Were Detected in Strawberries Fruits from Market

The widespread presence of yeasts in natura, including soil, plant substrates, the atmosphere, and geographic zones, as well as humans’ close association with specific yeast taxa, are the primary causes of the emergence of mycoses and allergic diseases [51]. There are nine genera of clinically significant yeasts that are regularly isolated from naturally occurring soil-plant substrates: Saccharomyces, Rhodotorula, Geotrichum, Meyerozyma, Pichia, Candida, Trichosporon, Mallasezia, and Cryptococcus [51]. The most common mycological conditions related to yeast are dermatitis, alveolitis, rhinitis, allergic bronchopulmonary mycosis, and bronchial asthma [52]. Cryptococcus albidus was previously detected in strawberry fruits stored at 15 °C with impact on the fruit quality [2]. Interestingly, in the current study, we detected Cryptococcus frias in both orchard and market fruits with a relative abundance of 0.5% in the market samples and 8.89% in the samples from the orchard. No studies mention the detection of these species in fruits. Early research associate C. frias with the glacial biomes of Patagonia [53]. Members of the Candida pathogenic clade, such as C. albicans, C. parapsilosis, C. tropicalis, and recently C. auris, were found in commensal environments including fruits [54]. C. albicans is known as an opportunistic yeast pathogen that causes infections in immunosuppressed patients, including skin infections in diabetic patients and thrush in infants [55]. In this metagenomic analysis, several clinically associated Candida yeasts, but not C. albicans and C. auris, were detected in the samples from the market (Figure 7). Among yeasts, the most common were Meyerozyma guilliermondii, C. parapsilosis, and C. santamariae, their abundance varied by sample stand. We suggested that the absence of these species in the orchard samples could indicate environmental contamination; however, more research is required to fully understand these concerns. The study by Abdelfattah and colleagues [11] did not report any species of Candida in strawberries. This may be connected to the fact that no fruit samples from the market were considered for the study. In addition, the geographical location and the plant variety might influence the fungal diversity. Nonetheless, C. parapsilosis was detected on the skin of fresh fruits and showed antibiotic resistance [56]. Whether these cultures have evolved to survive as endophytes remain unknown. It is crucial to recognize that the surfaces of fruits can harbor pathogenic yeasts, particularly drug-resistant strains that could potentially spread to humans [54]. Previously, M. guilliermondii and C. parapsilosis were detected in commercial fruits and vegetables in Russia [46]. All fruit samples have been shown to contain a high number of yeasts, although no indicator of these microorganisms is specified in the hygienic requirements legislation for the safety of fruit products [47]. However, our findings did highlight the need for further microbiological crop control, as well as the creation of new criteria to determine the presence of yeast that are clinically relevant in fresh products.

4. Conclusions

Taken together, this is the first study comparing the diversity and structure of fungal communities associated with strawberries obtained from a volcanic orchard and commercial market. The fungal communities vary amongst the groups, as in the market group, along with several beneficial taxa that might improve the fruit quality, an increase in potentially pathogenic taxa was observed. Based on the microbiome composition analysis, Hanseniaspora, Kurtzmaniella, and Phyllozyma were the most differentially abundant fungal genera. Curvibasidium cygneicollum, an endophytic yeast, was found in both groups, while Candida railenensis and Debaryomyces prosopidis were found only in fruits obtained from the market; their relative abundance varies with the sample. Additionally, an unexpected presence of multiple clinically related yeasts, including Meyerozyma guilliermondii and Candida parapsilosis, were detected in the market samples. More research should examine the relationship between the mycobiome and bacteriome in ready-to-eat fruits in the context of safety and quality. Further work implies the need to develop strategies to identify the presence of clinically significant yeasts in fresh products before sale, in addition to measurements to increase the safety.

Supplementary Materials

The following supporting information can be downloaded at: https://www.mdpi.com/article/10.3390/foods13081175/s1, Figure S1: Illustration of rarefaction curves. Figure S2: A volcano plot showing the ANCOM model W statistic in strawberries. Figure S3: Venn diagram showing the number and percentage of shared fungi (A) genus and (B) species level. Figure S4: Phylogenetic tree derived from ITS2 sequence data showing the position of the most abundant fungal taxon. Table S1. DADA2 statistics of input and filtered reads.

Author Contributions

G.N.T.: Conceptualization, methodology. G.N.T., P.R. and D.M.: formal research. P.R. and D.M.: in vitro analysis. G.N.T.: software analysis. G.N.T.: writing—original draft preparation. G.N.T.: writing—review and editing. G.N.T.: project administration. G.N.T.: funding acquisition. All authors have read and agreed to the published version of the manuscript.

Funding

This research was funded by the Universidad Técnica del Norte, grant number 7874/2023 and The APC was funded by the Universidad Técnica del Norte.

Data Availability Statement

Raw sequence data were deposited in the National Collection of Biotechnology Information under Bioproject ID PRJNA1085588 on 11 March 2024. (https://www.ncbi.nlm.nih.gov/sra/PRJNA1085888, accessed on 14 February 2024).

Acknowledgments

The authors kindly acknowledge our interim students Cifuentes, V. and Flores, C. for helping with the experiments.

Conflicts of Interest

The authors declare no conflicts of interest.

References

  1. Kahramanoğlu, İ.; Panfilova, O.; Kesimci, T.G.; Bozhüyük, A.U.; Gürbüz, R.; Alptekin, H. Control of postharvest gray mold at strawberry fruits caused by botrytis cinerea and improving fruit storability through Origanum onites L. and Ziziphora clinopodioides L. volatile essential oils. Agronomy 2022, 12, 389. [Google Scholar] [CrossRef]
  2. Satitmunnaithum, J.; Kitazawa, H.; Arofatullah, N.A.; Widiastuti, A.; Kharisma, A.D.; Yamane, K.; Tanabata, S.; Sato, T. Microbial population size and strawberry fruit firmness after drop shock-induced mechanical damage. Postharvest Biol. Technol. 2022, 192, 112008. [Google Scholar] [CrossRef]
  3. Jensen, B.; Knudsen, I.M.B.; Andersen, B.; Nielsen, K.F.; Thrane, U.; Jensen, D.F.; Larsen, J. Characterization of microbial communities and fungal metabolites on field grown strawberries from organic and conventional production. Int. J. Food Microbiol. 2013, 160, 313–322. [Google Scholar] [CrossRef] [PubMed]
  4. Zain, M.E. Impact of mycotoxins on humans and animals. J. Saudi Chem. Soc. 2011, 15, 129–144. [Google Scholar] [CrossRef]
  5. Koch, S.; Epp, A.; Lohmann, M.; Böl, G.F. Pesticide residues in food: Attitudes, beliefs, and misconceptions among conventional and organic consumers. J. Food Prot. 2017, 80, 2083–2089. [Google Scholar] [CrossRef] [PubMed]
  6. Ruxton, G.D.; Wilkinson, D.M.; Schaefer, H.M.; Sherratt, T.N. Why fruit rots: Theoretical support for Janzen’s theory of microbe–macrobe competition. Proc. R. Soc. B Biol. Sci. 2014, 281, 20133320. [Google Scholar] [CrossRef] [PubMed]
  7. Knight, S.; Klaere, S.; Fedrizzi, B.; Goddard, M.R. Regional microbial signatures positively correlate with differential wine phenotypes: Evidence for a microbial aspect to terroir. Sci. Rep. 2015, 5, 14233. [Google Scholar] [CrossRef] [PubMed]
  8. Wassermann, B.; Müller, H.; Berg, G. An apple a day: Which bacteria do we eat with organic and conventional apples? Front. Microbiol. 2019, 10, 1629. [Google Scholar] [CrossRef] [PubMed]
  9. Vermote, L.; Verce, M.; Mozzi, F.; De Vuyst, L.; Weckx, S. microbiomes associated with the surfaces of northern argentinian fruits show a wide species diversity. Front. Microbiol. 2022, 13, 872281. [Google Scholar] [CrossRef] [PubMed]
  10. Sasaki, Y.; Orikasa, T.; Nakamura, N.; Hayashi, K.; Yasaka, Y.; Makino, N.; Shobatake, K.; Koide, S.; Shiina, T. Dataset for life cycle assessment of strawberry-package supply chain with considering food loss during transportation. Data Brief 2021, 39, 107473. [Google Scholar] [CrossRef]
  11. Abdelfattah, A.; Wisniewski, M.; Li Destri Nicosia, M.G.; Cacciola, S.O.; Schena, L. Metagenomic analysis of fungal diversity on strawberry plants and the effect of management practices on the fungal community structure of aerial organs. PLoS ONE 2016, 11, e0160470. [Google Scholar] [CrossRef] [PubMed]
  12. Abdelfattah, A.; Freilich, S.; Bartuv, R.; Zhimo, V.Y.; Kumar, A.; Biasi, A.; Salim, S.; Feygenberg, O.; Burchard, E.; Dardick, C.; et al. Global analysis of the apple fruit microbiome: Are all apples the same? Environ. Microbiol. 2021, 23, 6038–6055. [Google Scholar] [CrossRef] [PubMed]
  13. De Tender, C.; Haegeman, A.; Vandecasteele, B.; Clement, L.; Cremelie, P.; Dawyndt, P.; Maes, M.; Debode, J. Dynamics in the strawberry rhizosphere microbiome in response to biochar and Botrytis cinerea Leaf Infection. Front. Microbiol. 2016, 7, 2062. [Google Scholar] [CrossRef] [PubMed]
  14. Kusstatscher, P.; Cernava, T.; Abdelfattah, A.; Gokul, J.; Korsten, L.; Berg, G. Microbiome approaches provide the key to biologically control postharvest pathogens and storability of fruits and vegetables. FEMS Microbiol Ecol. 2020, 96, fiaa119. [Google Scholar] [CrossRef] [PubMed]
  15. Tournas, V.H.; Katsoudas, E. Mould and yeast flora in fresh berries, grapes and citrus fruits. Int. J. Food Microbiol. 2005, 105, 11–17. [Google Scholar] [CrossRef] [PubMed]
  16. Asociación de Municipalidades, Ecuador. 2021. Available online: https://ame.gob.ec/2021/05/14/tisaleo-principal-productor-de-mora-y-fresa/ (accessed on 8 December 2023).
  17. Tenea, G.N.; Reyes, P. Bacterial community changes in strawberry fruits (Fragaria × ananassa variety “Monterey”) from farm field to retail market sites an indicator of postharvest contamination. Front. Microbiol. 2024, 15, 1348316. [Google Scholar] [CrossRef] [PubMed]
  18. Angamarca, E.; Castillejo, P.; Tenea, G.N. Microbiota and its antibiotic resistance profile in avocado Guatemalan fruits (Persea nubigena var. guatemalensis) sold at retail markets of Ibarra city, northern Ecuador. Front. Microbiol. 2023, 14, 1228079. [Google Scholar] [CrossRef]
  19. Toju, H.; Tanabe, A.S.; Yamamoto, S.; Sato, H. High-coverage ITS primers for the DNA-based identification of ascomycetes and basidiomycetes in environmental samples. PLoS ONE 2012, 7, e40863. [Google Scholar] [CrossRef] [PubMed]
  20. Bolyen, E.; Rideout, J.R.; Dillon, M.R.; Bokulich, N.A.; Abnet, C.C.; Al-Ghalith, G.A.; Alexander, H.; Alm, E.J.; Arumugam, M.; Asnicar, F.; et al. Reproducible, interactive, scalable and extensible microbiome data science using QIIME 2. Nat. Biotechnol. 2019, 37, 852–857. [Google Scholar] [CrossRef]
  21. Reeder, J.; Knight, R. Rapidly denoising pyrosequencing amplicon reads by exploiting rank-abundance distributions. Nat. Methods 2010, 7, 668–669. [Google Scholar] [CrossRef]
  22. Callahan, B.J.; McMurdie, P.J.; Rosen, M.J.; Han, A.W.; Johnson, A.J.A.; Holmes, S.P. DADA2: High-resolution sample inference from Illumina amplicon data. Nat. Methods 2020, 13, 581–583. [Google Scholar] [CrossRef] [PubMed]
  23. Alishum, A. DADA2 formatted 16S rRNA gene sequences for both bacteria & archaea (Version 4.2) [Data set]. Zenodo 2021. [Google Scholar] [CrossRef]
  24. Edgar, R.C. Search and clustering orders of magnitude faster than BLAST. Bioinformatics 2010, 26, 2460–2461. [Google Scholar] [CrossRef]
  25. Kandlikar, G.S.; Gold, Z.J.; Cowen, M.C.; Meyer, R.S.; Freise, A.C.; Kraft, N.J.B.; Moberg-Parker, J.; Sprague, J.; Kushner, D.J.; Curd, E.E. Ranacapa: An R package and shiny web app to explore environmental DNA data with exploratory statistics and interactive visualizations. F1000Research 2018, 7, 1734. [Google Scholar] [CrossRef]
  26. Krebs, C.J. Species diversity measures. In Ecological Methodology; University of British Columbia: Vancouver, BC, Canada, 2014; pp. 532–593. [Google Scholar]
  27. Lozupone, C.; Hamady, M.; Kelley, S.T.; Knight, R. Quantitative and qualitative β diversity measures lead to different insights into factors that structure microbial communities. Appl. Environ. Microbiol. 2007, 73, 1576–1585. [Google Scholar] [CrossRef] [PubMed]
  28. Yinglin, X.; Jun, S.; Ding-Geng, C. Statistical Analysis of Microbiome Data with R; Springer Nature: Singapore, 2018; pp. 191–241. [Google Scholar] [CrossRef]
  29. Mandal, S.; Van Treuren, W.; White, R.A.; Eggesbø, M.; Knight, R.; Peddada, S.D. Analysis of composition of microbiomes: A novel method for studying microbial composition. Microb. Ecol. Health Dis. 2015, 26, 27663. [Google Scholar] [CrossRef]
  30. Tenea, G.N.; Reyes, P.; Molina, D.; Ortega, C. Pathogenic microorganisms linked to fresh fruits and juices purchased at low-cost markets in Ecuador, potential carriers of antibiotic resistance. Antibiotics 2023, 12, 236. [Google Scholar] [CrossRef]
  31. Olimi, E.; Kusstatscher, P.; Wicaksono, W.A.; Abdelfattah, A.; Cernava, T.; Berg, G. Insights into the microbiome assembly during different growth stages and storage of strawberry plants. Environ. Microbiome 2022, 17, 21. [Google Scholar] [CrossRef] [PubMed]
  32. Lattin, J.M.; Carroll, J.D.; Green, P.E. Analyzing Multivariate Data; Thomson Brooks/Cole: Pacific Grove, CA, USA, 2003. [Google Scholar]
  33. Jones, R.; Fountain, M.T.; Andreani, N.A.; Günther, C.S.; Goddard, M.R. The relative abundances of yeasts attractive to Drosophila suzukii differ between fruit types and are greatest on raspberries. Sci. Rep. 2022, 12, 10382. [Google Scholar] [CrossRef]
  34. Artimová, R.; Játiová, M.; Baumgartnerová, J.; Lipková, N.; Petrová, J.; Maková, J.; Javoreková, S.; Hleba, L.; Medová, J.; Medo, J. Microbial communities on samples of commercially available fresh-consumed leafy vegetables and small berries. Horticulturae 2023, 9, 150. [Google Scholar] [CrossRef]
  35. Nam, M.H.; Park, M.S.; Kim, H.S.; Kim, T.I.; Kim, H.G. Cladosporium cladosporioides and C. tenuissimum cause blossom blight in strawberry in Korea. Mycobiology 2015, 43, 354–359. [Google Scholar] [CrossRef] [PubMed]
  36. Ayoubi, N.; Soleimani, M.J.; Zare, R. Cladosporium species, a new challenge in strawberry production in Iran. Phytopathol. Mediterr. 2017, 56, 486–493. Available online: http://www.jstor.org/stable/44809359 (accessed on 9 April 2024).
  37. Xu, H.; Quan, Q.; Chang, X.; Ge, S.; Xu, S.; Wang, R.; Xu, Y.; Luo, Z.; Shan, Y.; Ding, S. Maintaining the balance of fungal community through active packaging film makes strawberry fruit pose pleasant flavor during storage. Postharvest Biol. Technol. 2024, 211, 112815. [Google Scholar] [CrossRef]
  38. Sangiorgio, D.; Cellini, A.; Donati, I.; Ferrari, E.; Tanunchai, B.; Mohamed Wahdan, S.F.; Sadubsarn, D.; Farneti, B.; Checcucci, A.; Buscot, F.; et al. Taxonomical and functional composition of strawberry microbiome is genotype-dependent. J. Adv. Res. 2022, 42, 189–204. [Google Scholar] [CrossRef]
  39. Fernández-Ortuño, D.; Li, X.P.; Wang, F.; Schnabel, G. First report of gray mold of strawberry caused by Botrytis caroliniana in North Carolina. Plant Dis. 2012, 96, 914. [Google Scholar] [CrossRef] [PubMed]
  40. Yang, P.; Zhao, Z.; Virag, A.; Becker, T.; Zhao, L.; Liu, W.; Xia, Y. Botrytis cinerea in vivo Inoculation Assays for Early-, Middle- and Late-stage Strawberries. Bio-Protocol 2023, 13, e4859. [Google Scholar] [CrossRef]
  41. Lachance, M.A.; Starmer, W.T. Kurtzmaniella gen. nov. and description of the heterothallic, haplontic yeast species Kurtzmaniella cleridarum sp. nov.; the teleomorph of Candida cleridarum. Int. J. Syst. Evol. Microbiol. 2008, 58 Pt 2, 520–524. [Google Scholar] [CrossRef]
  42. Li, A.H.; Yuan, F.X.; Groenewald, M.; Bensch, K.; Yurkov, A.M.; Li, K.; Han, P.J.; Guo, L.D.; Aime, M.C.; Sampaio, J.P.; et al. Diversity and phylogeny of basidiomycetous yeasts from plant leaves and soil: Proposal of two new orders, three new families, eight new genera and one hundred and seven new species. Stud. Mycol. 2020, 96, 17–140. [Google Scholar] [CrossRef]
  43. Yan, Y.; Zhang, X.; Zheng, X.; Apaliya, M.T.; Yang, Q.; Zhao, L.; Gu, X.; Zhang, H. Control of postharvest blue mold decay in pears by Meyerozyma guilliermondii and it’s effects on the protein expression profile of pears. Postharvest Biol. Technol. 2018, 136, 124–131. [Google Scholar] [CrossRef]
  44. Zhang, Q.; Zhao, L.; Li, Z.; Li, C.; Li, B.; Gu, X.; Zhang, X.; Zhang, H. Screening and identification of an antagonistic yeast controlling postharvest blue mold decay of pears and the possible mechanisms involved. Biol. Control 2019, 133, 26–33. [Google Scholar] [CrossRef]
  45. Apaliya, M.T.; Zhang, H.; Yang, Q.; Zheng, X.; Zhao, L.; Kwaw, E.; Mahunu, G.K. Hanseniaspora uvarum enhanced with trehalose induced defense-related enzyme activities and relative genes expression levels against Aspergillus tubingensis in table grapes. Postharvest Biol. Technol. 2017, 132, 162–170. [Google Scholar] [CrossRef]
  46. Kachalkin, A.V.; Glushakova, A.M.; Venzhik, A.S. Presence of clinically significant endophytic yeasts in agricultural crops: Monitoring and ecological safety assessment. IOP Conf. Ser. Earth Environ. Sci. 2021, 723, 042005. [Google Scholar] [CrossRef]
  47. Li, J.; Hong, M. Impact of Candida railenensis during fermentation on the aromatic profile of Vidal blanc icewine. Front. Microbiol. 2023, 14, 1192006. [Google Scholar] [CrossRef] [PubMed]
  48. Breierová, E.; Čertík, M.; Márová, I.; Vadkertiová, R. The Effect of Zn(II) Ions and Reactive Oxygen on the Uptake of Zinc and Production of Carotenoids by Selected Red Yeasts. Chem. Biodivers. 2018, 15, e1800069. [Google Scholar] [CrossRef] [PubMed]
  49. Baroncelli, R.; Zapparata, A.; Sarrocco, S.; Sukno, S.A.; Lane, C.R.; Thon, M.R.; Vannacci, G.; Holub, E.; Sreenivasaprasad, S. Molecular diversity of anthracnose pathogen populations associated with UK strawberry production suggests multiple introductions of three different Colletotrichum species. PLoS ONE 2015, 10, e0129140. [Google Scholar] [CrossRef] [PubMed]
  50. Ji, Y.; Li, X.; Gao, Q.-H.; Geng, C.; Duan, K. Colletotrichum species pathogenic to strawberry: Discovery history, global diversity, prevalence in China, and the host range of top two species. Phytopathol. Res. 2022, 4, 42. [Google Scholar] [CrossRef]
  51. de Hoog, G.S.; Guarro, J.; Gené, J.; Ahmed, S.; Al-Hatmi, A.M.S.; Figueras, M.J.; Vitale, R.G. Atlas of Clinical Fungi, 4th ed.; Foundation Atlas of Clinical Fungi: Hilversum, The Netherlands, 2020. [Google Scholar]
  52. Xing, H.; Wang, J.; Sun, Y.; Wang, H. Recent advances in the allergic cross-reactivity between fungi and foods. J. Immunol. Res. 2022, 2022, 7583400. [Google Scholar] [CrossRef] [PubMed]
  53. de Garcia, V.; Zalar, P.; Brizzio, S.; Gunde-Cimerman, N.; van Broock, M. Cryptococcus species (Tremellales) from glacial biomes in the southern (Patagonia) and northern (Svalbard) hemispheres. FEMS Microbiol. Ecol. 2012, 82, 523–539. [Google Scholar] [CrossRef]
  54. Yadav, V.; Heitman, J. On fruits and fungi: A risk of antifungal usage in food storage and distribution in driving drug resistance in Candida auris. mBio 2022, 13, e00739-22. [Google Scholar] [CrossRef] [PubMed]
  55. Kohler, J.R.; Hube, B.; Puccia, R.; Casadevall, A.; Perfect, J.R. Fungi that infect humans. Microbiol. Spectr. 2017, 5, 10–1128. [Google Scholar] [CrossRef]
  56. Lo, H.J.; Tsai, S.H.; Chu, W.L.; Chen, Y.Z.; Zhou, Z.L.; Chen, H.F.; Lee, C.F.; Yang, Y.L. Fruits as the vehicle of drug resistant pathogenic yeasts. J. Infect. 2017, 75, 254–262. [Google Scholar] [CrossRef] [PubMed]
Figure 1. Alpha diversity among groups. Boxplots visualizing results of the nonparametric Kruskal–Wallis to compare the Observed features (A); Faith’s PD (B); Shannon diversity index (C); Pielou’s evenness (D). Legend: four: fruits collected from the orchard phase four; market: fruits purchased from the market stands.
Foods 13 01175 g001
Figure 2. Principal Coordinate Analysis (PCoA) plots of fungal beta diversity. (A) Bray–Curtis dissimilarity indices; (B) Jaccard distance; (C) unweighted UniFrac distance, (D) weighted UniFrac distance. Statistics were calculated using pairwise PERMANOVA with 999 permutations.
Foods 13 01175 g002
Figure 3. Relative abundance (%) of different fungal phyla and classes detected in strawberry fruits across the samples (A,B) and among the groups (C,D). Legend: F4L1-ITS: F4L6-ITS: fruits collected from the orchard; FP1-ITS:FP6-ITS: fruits purchased from the market. The “Other” category in this sum of all classifications with less than 0.50% abundance.
Foods 13 01175 g003
Figure 4. Relative abundance (%) of different fungal genera identified in strawberry fruits across the samples (A), and among the groups (B). Legend: F4L1-ITS: F4L6-ITS: fruits collected from the orchard; FP1-ITS:FP6-ITS: fruits purchased from the market. The “Other” category in this sum of all classifications with less than 0.50% abundance.
Foods 13 01175 g004
Figure 5. Heatmap and hierarchical clustering of the most abundant fungi at the genus level. X-axis contains the microbial genus that have been identified in the samples; on the Y axis are the different samples and experimental conditions that are being compared (groups); blue intense color: high abundance, pink color: low abundance.
Foods 13 01175 g005
Figure 6. Relative abundance (%) of fungi species identified in strawberry fruits across the samples (A) and among the groups (B). Legend: F4L1-ITS: F4L6-ITS: fruits collected from the orchard; FP1-ITS:FP6-ITS: fruits purchased from the market. The “Other” category in this sum of all classifications with less than 0.50% abundance.
Foods 13 01175 g006
Figure 7. Clinical related yeasts species detected in samples purchased from the market (expressed as number of reads). Legend: FP1-ITS: FP6-ITS: fruits purchased from the market.
Foods 13 01175 g007
Table 1. Shannon species diversity in strawberry fruits.
Sample OriginSample IDNumber Reads Passing Quality Filtering% Reads Classified to GenusShannon Species
Diversity
Number of Species
Identified
OrchardF4FL1-ITS402,16688.15%2.47582
F4FL2-ITS413,20583.63%2.47563
F4FL3-ITS362,68585.13%2.38567
F4FL4-ITS374,31586.46%2.56598
F4FL5-ITS473,02082.99%2.61628
F4FL6-ITS330,73284.94%2.60783
MarketFP1-ITS536,56396.52%3.05848
FP2-ITS457,48792.27%2.78699
FP3-ITS479,79897.05%2.54644
FP4-ITS546,06396.72%2.26737
FP5-ITS395,65889.55%2.85587
FP6-ITS241,36992.60%2.45684
Table 2. Beta-diversity metrics in strawberry fruits. The significance was determined through 999 Monte Carlo permutations; the values were considered significant when p < 0.05.
MetricsPseudo-F *p-Valueq-Value
Bray–Curtis dissimilarity8.192457310.0060.006
Jaccard distance3.119911420.0030.003
Unweighted_unifrac distance3.944758510.0030.003
Weighted_unifrac distance22.29817830.0040.004
* Pseudo-F value [32].
Table 3. Abundance (%) features by group.
TaxonWReject Null Hypothesis% of Abundance
02550751000255075100
OrchardMarket
Phyllozyma spp.369TRUE264533.25671732.25105711111
Kurtzmaniella spp.367TRUE11111219261.7511282154.757074
Hanseniaspora spp.348TRUE11111119134387.5652.252136
Disclaimer/Publisher’s Note: The statements, opinions and data contained in all publications are solely those of the individual author(s) and contributor(s) and not of MDPI and/or the editor(s). MDPI and/or the editor(s) disclaim responsibility for any injury to people or property resulting from any ideas, methods, instructions or products referred to in the content.

