
Identification of Key Parameters Inducing Microbial Modulation during Backslopped Kombucha Fermentation

 ,
,
Abstract
:1. Introduction
2. Experimental Procedures
2.1. Culture Generation
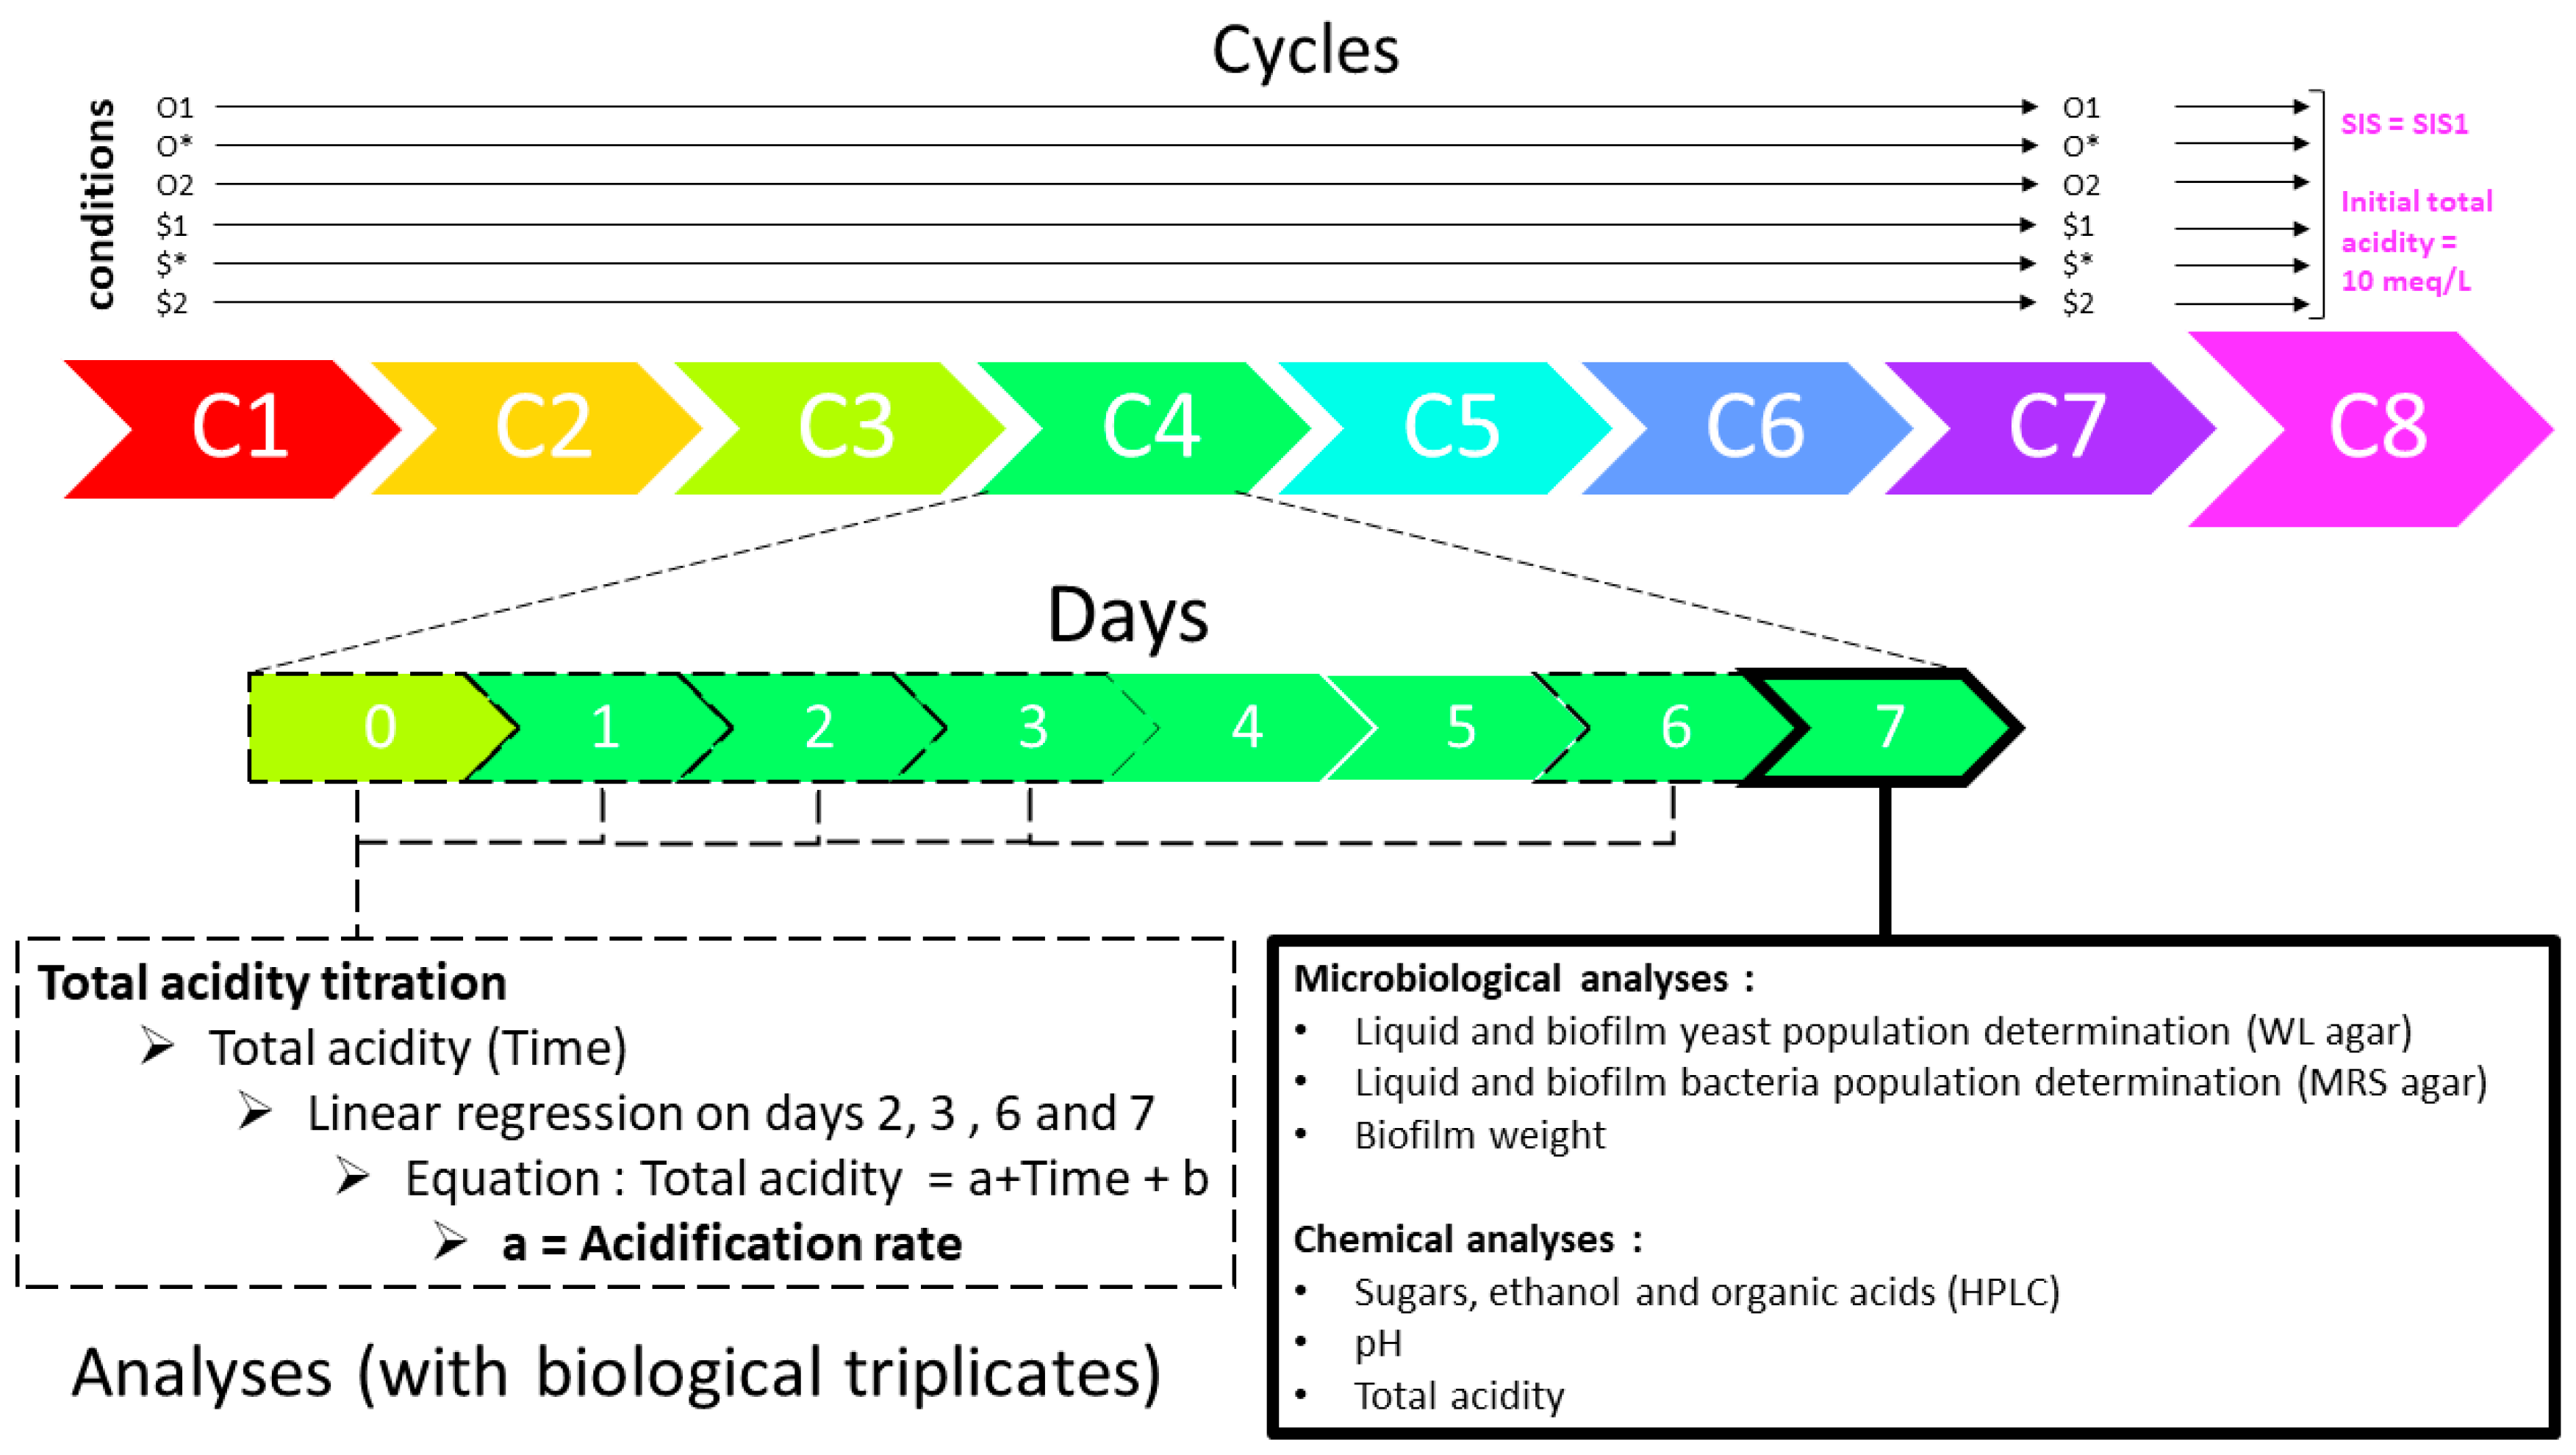
2.2. Condition-Based Culture Backslopping Lineages
2.3. Analyses
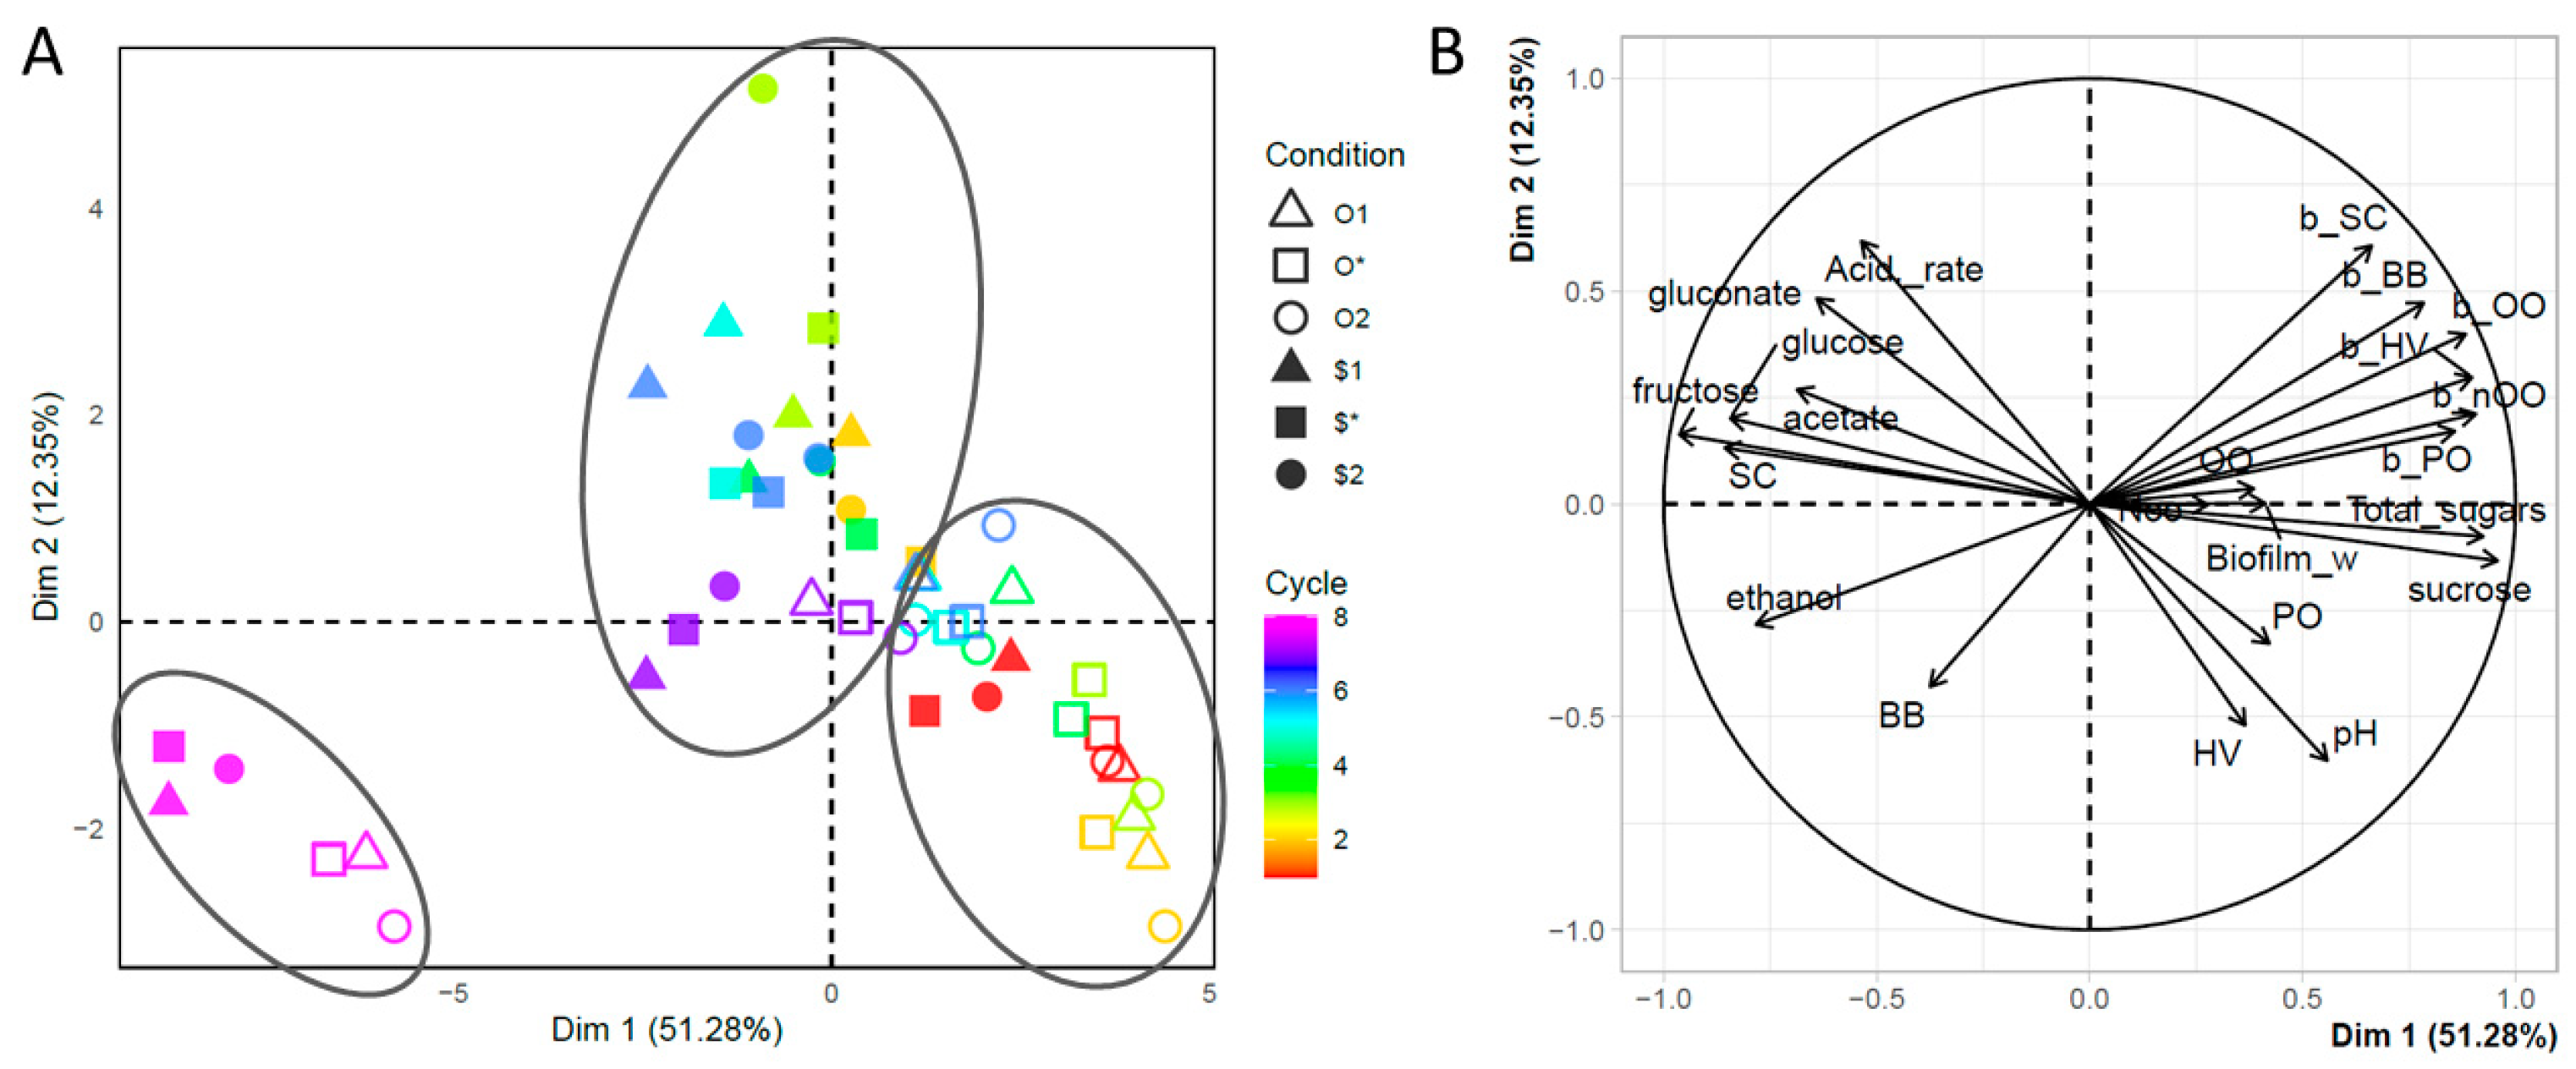
2.4. Data Treatment
3. Results and Discussion
4. Conclusions
Author Contributions
Funding
Institutional Review Board Statement
Informed Consent Statement
Data Availability Statement
Conflicts of Interest
Appendix A

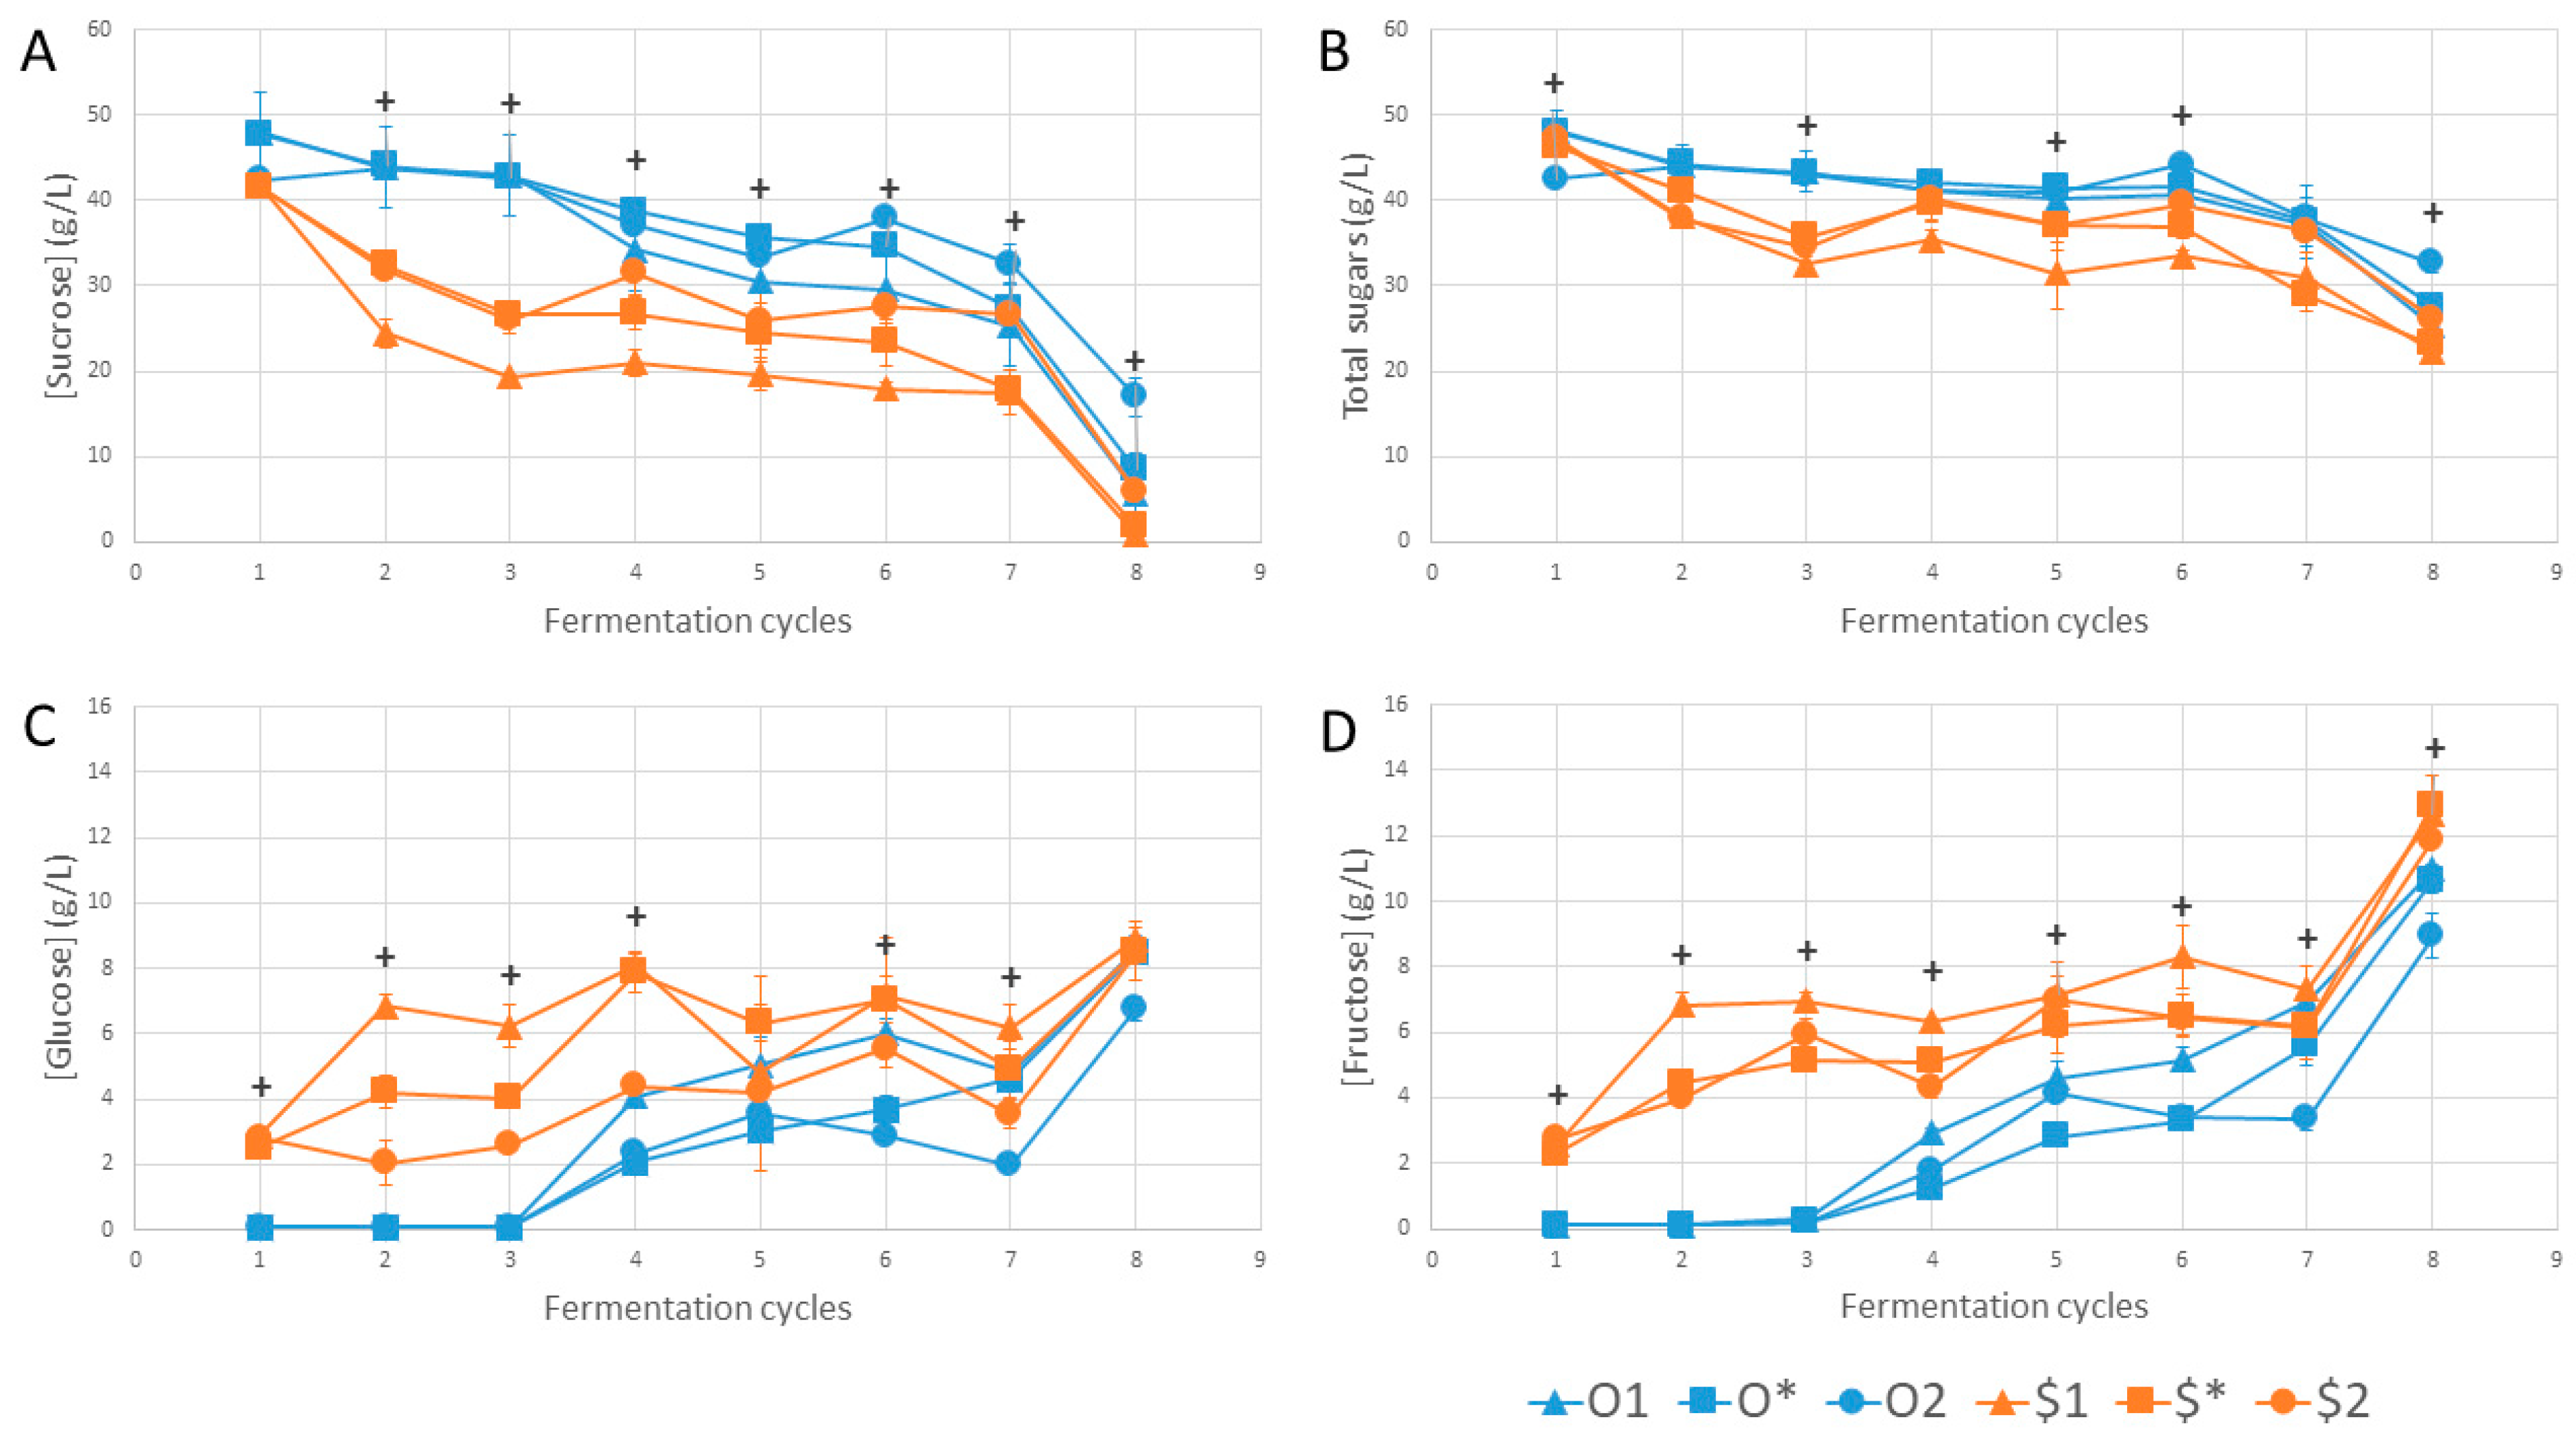
| Sucrose | Cycle 1 | Cycle 2 | Cycle 3 | Cycle 4 | Cycle 5 | Cycle 6 | Cycle 7 | Cycle 8 |
|---|---|---|---|---|---|---|---|---|
| O1 | a | ab | b | abc | ab | abc | ab | ab |
| O* | a | b | ab | c | b | bc | ab | ab |
| O2 | a | ab | ab | bc | ab | c | b | b |
| $1 | a | a | a | a | a | a | a | a |
| $* | a | ab | ab | ab | a | ab | a | a |
| $2 | a | ab | ab | abc | ab | abc | ab | ab |
| p-value | 0.016 | 0.011 | 0.010 | 0.006 | 0.010 | 0.007 | 0.017 | 0.010 |
| Fructose | ||||||||
| O1 | ab | b | ab | abc | ab | ab | a | a |
| O* | b | b | b | c | b | b | ab | a |
| O2 | ab | b | b | bc | ab | b | b | b |
| $1 | ab | a | a | a | a | a | ab | a |
| $* | ab | ab | ab | ab | ab | ab | ab | a |
| $2 | a | ab | ab | abc | a | ab | ab | b |
| p-value | 0.008 | 0.005 | 0.007 | 0.006 | 0.012 | 0.010 | 0.036 | 0.011 |
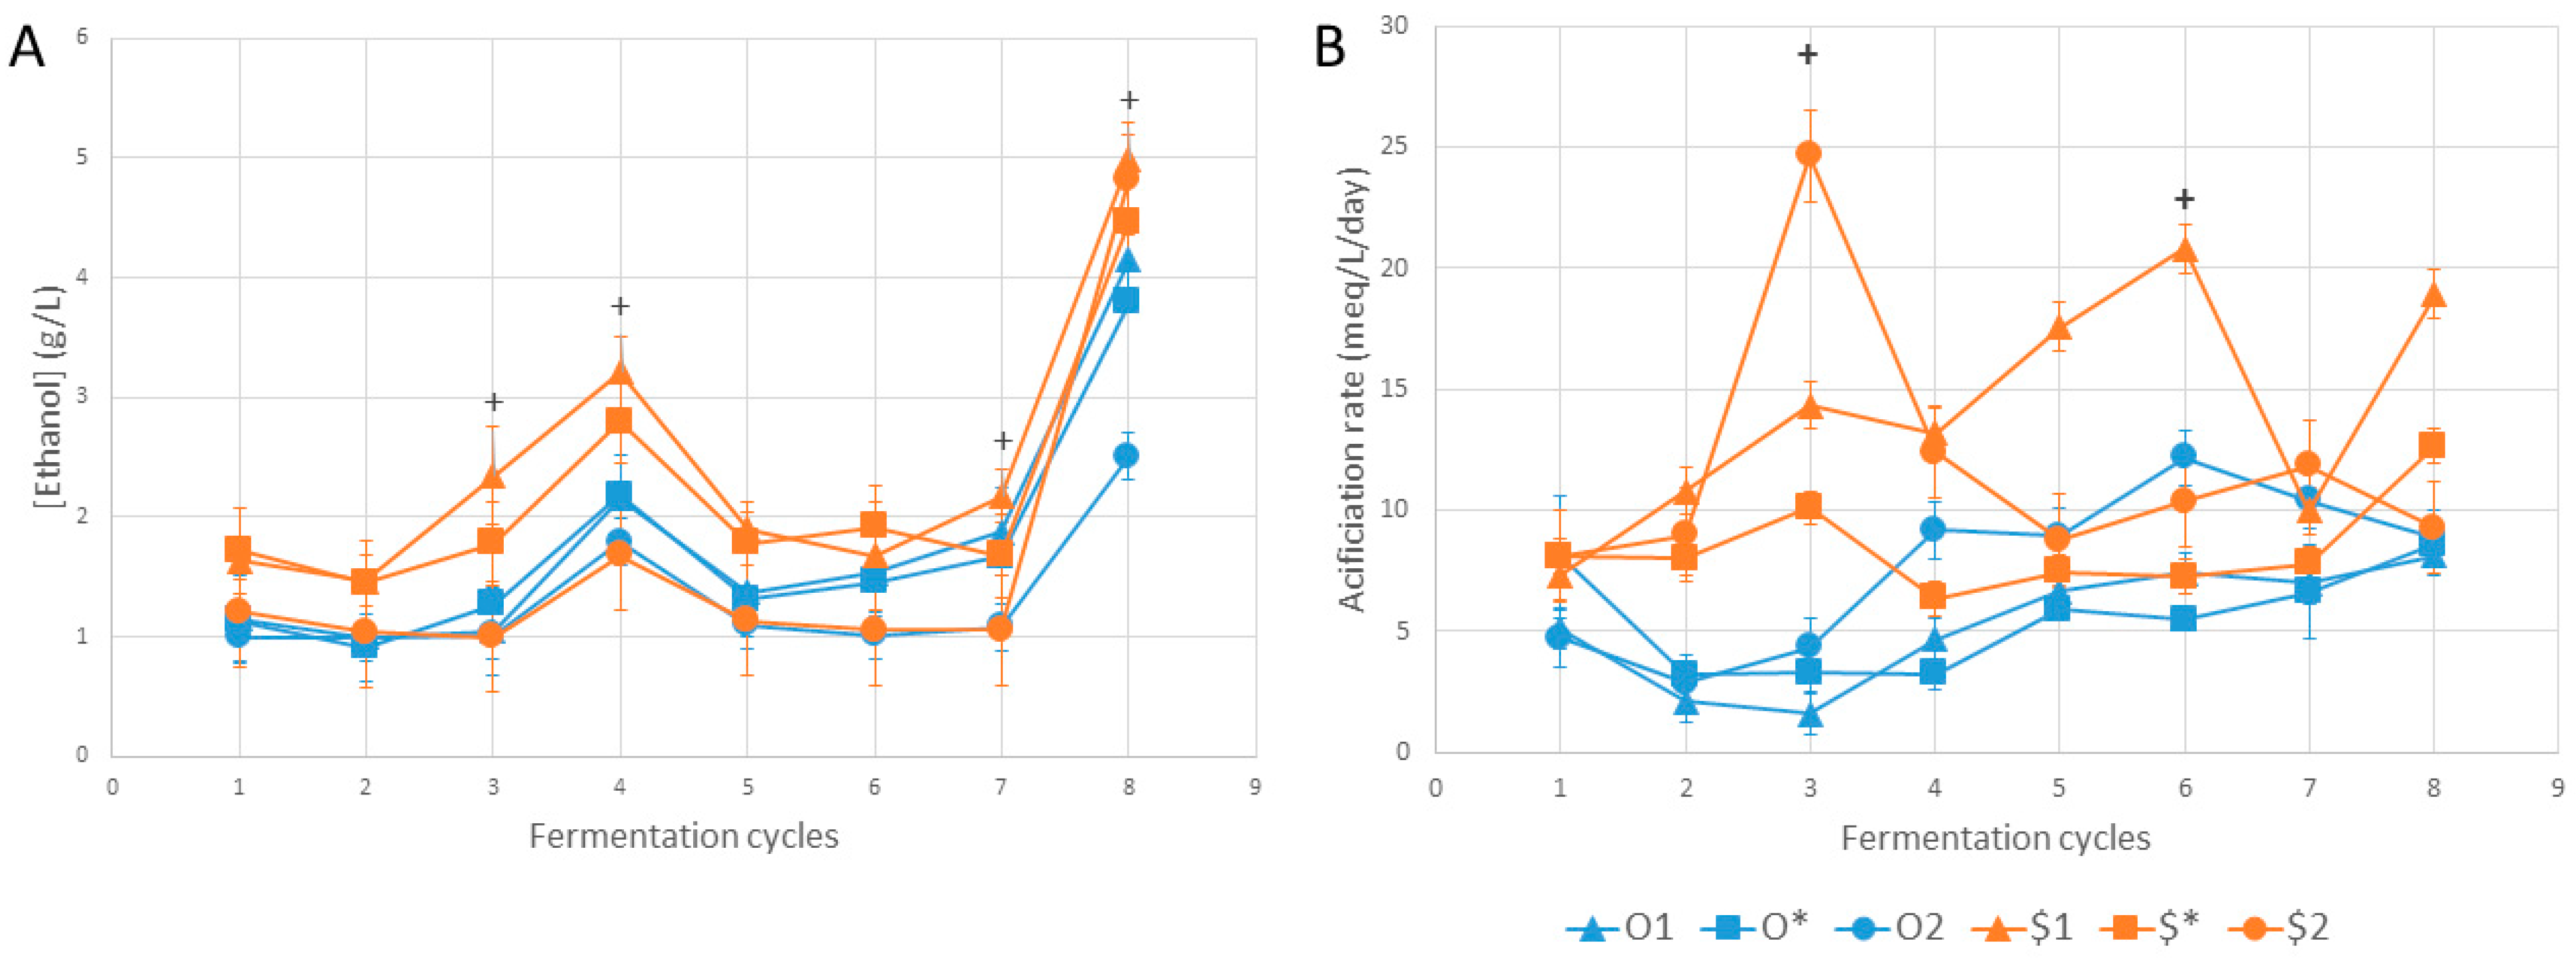
| Ethanol | ||||||||
| O1 | a | a | ab | abc | a | a | ab | ab |
| O* | a | a | ab | abc | a | a | ab | ab |
| O2 | a | a | b | bc | a | a | b | b |
| $1 | a | a | a | a | a | a | a | a |
| $* | a | a | ab | ab | a | a | ab | ab |
| $2 | a | a | b | c | a | a | ab | a |
| 0.054 | 0.036 | 0.008 | 0.008 | 0.027 | 0.069 | 0.019 | 0.009 | |
| Total sugars | ||||||||
| O1 | c | a | b | a | ab | ab | a | ab |
| O* | ac | a | ab | a | b | ab | a | ab |
| O2 | b | a | ab | a | ab | b | a | b |
| $1 | abc | a | a | a | a | a | a | a |
| $* | ab | a | ab | a | ab | ab | a | a |
| $2 | abc | a | ab | a | ab | ab | a | ab |
| p-value | 0.007 | 0.014 | 0.010 | 0.097 | 0.011 | 0.010 | 0.074 | 0.015 |
| S. cerevisae | ||||||||
| O1 | a | ab | b | ab | a | a | ab | a |
| O* | a | b | b | b | a | a | ab | ab |
| O2 | a | ab | ab | ab | a | a | b | b |
| $1 | a | a | a | a | a | a | ab | a |
| $* | a | ab | ab | ab | a | a | a | ab |
| $2 | a | ab | ab | ab | a | a | ab | b |
| p-value | 0.192 | 0.008 | 0.007 | 0.018 | 0.032 | 0.049 | 0.029 | 0.018 |
| H. valbyensis | ||||||||
| O1 | b | b | b | ab | ab | ab | abc | a |
| O* | ab | ab | ab | ab | ab | ab | abc | a |
| O2 | ab | b | b | b | a | b | c | a |
| $1 | a | ab | ab | a | b | a | ab | a |
| $* | ab | a | a | a | ab | a | a | a |
| $2 | ab | ab | ab | ab | ab | ab | bc | a |
| p-value | 0.012 | 0.010 | 0.013 | 0.007 | 0.008 | 0.012 | 0.007 | 0.015 |
| Acidification Rate | 1 | 2 | 3 | 4 | 5 | 6 | 7 | 8 |
| O1 | a | a | b | a | a | ab | a | a |
| O* | a | a | ab | a | a | b | a | a |
| O2 | a | a | ab | a | a | ab | a | a |
| $1 | a | a | ab | a | a | a | a | a |
| $* | a | a | ab | a | a | ab | a | a |
| $2 | a | a | a | a | a | ab | a | a |
| p-value | 0.032 | 0.016 | 0.008 | 0.011 | 0.070 | 0.021 | 0.038 | 0.147 |
References
- Arranz-Otaegui, A.; Gonzalez Carretero, L.; Ramsey, M.N.; Fuller, D.Q.; Richter, T. Archaeobotanical Evidence Reveals the Origins of Bread 14,400 Years Ago in Northeastern Jordan. Proc. Natl. Acad. Sci. USA 2018, 115, 7925–7930. [Google Scholar] [CrossRef] [PubMed]
- Marco, M.L.; Sanders, M.E.; Gänzle, M.; Arrieta, M.C.; Cotter, P.D.; De Vuyst, L.; Hill, C.; Holzapfel, W.; Lebeer, S.; Merenstein, D.; et al. The International Scientific Association for Probiotics and Prebiotics (ISAPP) Consensus Statement on Fermented Foods. Nat. Rev. Gastroenterol. Hepatol. 2021, 18, 196–208. [Google Scholar] [CrossRef] [PubMed]
- Materia, V.C.; Linnemann, A.R.; Smid, E.J.; Schoustra, S.E. Contribution of Traditional Fermented Foods to Food Systems Transformation: Value Addition and Inclusive Entrepreneurship. Food Secur. 2021, 13, 1163–1177. [Google Scholar] [CrossRef]
- Mukherjee, A.; Gómez-Sala, B.; O’Connor, E.M.; Kenny, J.G.; Cotter, P.D. Global Regulatory Frameworks for Fermented Foods: A Review. Front. Nutr. 2022, 9, 902642. [Google Scholar] [CrossRef] [PubMed]
- Batista, P.; Penas, M.R.; Pintado, M.; Oliveira-Silva, P. Kombucha: Perceptions and Future Prospects. Foods 2022, 11, 1977. [Google Scholar] [CrossRef] [PubMed]
- Kim, J.; Adhikari, K. Current Trends in Kombucha: Marketing Perspectives and the Need for Improved Sensory Research. Beverages 2020, 6, 15. [Google Scholar] [CrossRef]
- Debailly, R.; Lavelle, C.; Schultz, É. Conserver un aliment vivant: Entretien et circulation d’un ferment: Le cas du kéfir. Tech. Cult. 2018, 69, 180–183. [Google Scholar] [CrossRef]
- Bell, V.; Ferrão, J.; Pimentel, L.; Pintado, M.; Fernandes, T. One Health, Fermented Foods, and Gut Microbiota. Foods 2018, 7, 195. [Google Scholar] [CrossRef] [PubMed]
- Bourrie, B.C.T.; Forgie, A.J.; Ju, T.; Richard, C.; Cotter, P.D.; Willing, B.P. Consumption of the Cell-Free or Heat-Treated Fractions of a Pitched Kefir Confers Some but Not All Positive Impacts of the Corresponding Whole Kefir. Front. Microbiol. 2022, 13, 1056526. [Google Scholar] [CrossRef]
- Hill, C.; Tancredi, D.J.; Cifelli, C.J.; Slavin, J.L.; Gahche, J.; Marco, M.L.; Hutkins, R.; Fulgoni, V.L.; Merenstein, D.; Sanders, M.E. Positive Health Outcomes Associated with Live Microbe Intake from Foods, Including Fermented Foods, Assessed Using the NHANES Database. J. Nutr. 2023, 153, 1143–1149. [Google Scholar] [CrossRef]
- Mendelson, C.; Sparkes, S.; Merenstein, D.J.; Christensen, C.; Sharma, V.; Desale, S.; Auchtung, J.M.; Kok, C.R.; Hallen-Adams, H.E.; Hutkins, R. Kombucha Tea as an Anti-Hyperglycemic Agent in Humans with Diabetes—A Randomized Controlled Pilot Investigation. Front. Nutr. 2023, 10, 1190248. [Google Scholar] [CrossRef] [PubMed]
- Aldrete-Tapia, J.A.; Miranda-Castilleja, D.E.; Arvizu-Medrano, S.M.; Martínez-Peniche, R.Á.; Soto-Muñoz, L.; Hernández-Iturriaga, M. Pursuing the Perfect Performer of Fermented Beverages: GMMs vs. Microbial Consortium. In Frontiers and New Trends in the Science of Fermented Food and, Beverages; Solís-Oviedo, R., de la Cruz Pech-Canul, Á., Eds.; IntechOpen: London, UK, 2018. [Google Scholar]
- Bader, J.; Brigham, C.; Stahl, U.; Popović, M.K. Development of Controlled Cocultivations for Reproducible Results in Fermentation Processes in Food Biotechnology. In Advances in Biotechnology for Food Industry; Elsevier: Amsterdam, The Netherlands, 2018; pp. 135–165. ISBN 978-0-12-811443-8. [Google Scholar]
- Huang, X.; Xin, Y.; Lu, T. A Systematic, Complexity-Reduction Approach to Dissect the Kombucha Tea Microbiome. eLife 2022, 11, e76401. [Google Scholar] [CrossRef] [PubMed]
- Savary, O.; Mounier, J.; Thierry, A.; Poirier, E.; Jourdren, J.; Maillard, M.-B.; Penland, M.; Decamps, C.; Coton, E.; Coton, M. Tailor-Made Microbial Consortium for Kombucha Fermentation: Microbiota-Induced Biochemical Changes and Biofilm Formation. Food Res. Int. 2021, 147, 110549. [Google Scholar] [CrossRef] [PubMed]
- Baek, H.-W.; Bae, J.-H.; Lee, Y.-G.; Kim, S.-A.; Min, W.; Shim, S.; Han, N.S.; Seo, J.-H. Dynamic Interactions of Lactic Acid Bacteria in Korean Sourdough during Back-slopping Process. J. Appl. Microbiol. 2021, 131, 2325–2335. [Google Scholar] [CrossRef] [PubMed]
- González-Alonso, V.; Pradal, I.; Wardhana, Y.R.; Cnockaert, M.; Wieme, A.D.; Vandamme, P.; De Vuyst, L. Microbial Ecology and Metabolite Dynamics of Backslopped Triticale Sourdough Productions and the Impact of Scale. Int. J. Food Microbiol. 2024, 408, 110445. [Google Scholar] [CrossRef]
- Özel, B.; Şimşek, Ö.; Settanni, L.; Erten, H. The Influence of Backslopping on Lactic Acid Bacteria Diversity in Tarhana Fermentation. Int. J. Food Microbiol. 2020, 335, 108886. [Google Scholar] [CrossRef] [PubMed]
- Van Kerrebroeck, S.; Bastos, F.C.C.; Harth, H.; De Vuyst, L. A Low pH Does Not Determine the Community Dynamics of Spontaneously Developed Backslopped Liquid Wheat Sourdoughs but Does Influence Their Metabolite Kinetics. Int. J. Food Microbiol. 2016, 239, 54–64. [Google Scholar] [CrossRef] [PubMed]
- Vrancken, G.; Rimaux, T.; Weckx, S.; Leroy, F.; De Vuyst, L. Influence of Temperature and Backslopping Time on the Microbiota of a Type I Propagated Laboratory Wheat Sourdough Fermentation. Appl. Environ. Microbiol. 2011, 77, 2716–2726. [Google Scholar] [CrossRef]
- Decadt, H.; Weckx, S.; De Vuyst, L. The Rotation of Primary Starter Culture Mixtures Results in Batch-to-Batch Variations during Gouda Cheese Production. Front. Microbiol. 2023, 14, 1128394. [Google Scholar] [CrossRef]
- Garofalo, C.; Ferrocino, I.; Reale, A.; Sabbatini, R.; Milanović, V.; Alkić-Subašić, M.; Boscaino, F.; Aquilanti, L.; Pasquini, M.; Trombetta, M.F.; et al. Study of Kefir Drinks Produced by Backslopping Method Using Kefir Grains from Bosnia and Herzegovina: Microbial Dynamics and Volatilome Profile. Food Res. Int. 2020, 137, 109369. [Google Scholar] [CrossRef]
- Leale, A.; Auxier, B.; Smid, E.J.; Schoustra, S. Influence of Metabolic Guilds on a Temporal Scale in an Experimental Fermented Food Derived Microbial Community. FEMS Microbiol. Ecol. 2023, 99, fiad112. [Google Scholar] [CrossRef] [PubMed]
- Mas, P.; Tran, T.; Verdier, F.; Martin, A.; Alexandre, H.; Grandvalet, C.; Tourdot-Maréchal, R. Evolution in Composition of Kombucha Consortia over Three Consecutive Years in Production Context. Foods 2022, 11, 614. [Google Scholar] [CrossRef] [PubMed]
- Alekseeva, A.Y.; Groenenboom, A.E.; Smid, E.J.; Schoustra, S.E. Eco-Evolutionary Dynamics in Microbial Communities from Spontaneous Fermented Foods. Int. J. Environ. Res. Public. Health 2021, 18, 10093. [Google Scholar] [CrossRef] [PubMed]
- Conacher, C.; Luyt, N.; Naidoo-Blassoples, R.; Rossouw, D.; Setati, M.; Bauer, F. The Ecology of Wine Fermentation: A Model for the Study of Complex Microbial Ecosystems. Appl. Microbiol. Biotechnol. 2021, 105, 3027–3043. [Google Scholar] [CrossRef] [PubMed]
- May, A.; Narayanan, S.; Alcock, J.; Varsani, A.; Maley, C.; Aktipis, A. Kombucha: A Novel Model System for Cooperation and Conflict in a Complex Multi-Species Microbial Ecosystem. PeerJ 2019, 7, e7565. [Google Scholar] [CrossRef] [PubMed]
- Wolfe, B.E.; Dutton, R.J. Fermented Foods as Experimentally Tractable Microbial Ecosystems. Cell 2015, 161, 49–55. [Google Scholar] [CrossRef] [PubMed]
- Tran, T.; Grandvalet, C.; Verdier, F.; Martin, A.; Alexandre, H.; Tourdot-Maréchal, R. Microbiological and Technological Parameters Impacting the Chemical Composition and Sensory Quality of Kombucha. Compr. Rev. Food Sci. Food Saf. 2020, 19, 2050–2070. [Google Scholar] [CrossRef] [PubMed]
- Tran, T.; Grandvalet, C.; Verdier, F.; Martin, A.; Alexandre, H.; Tourdot-Maréchal, R. Microbial Dynamics between Yeasts and Acetic Acid Bacteria in Kombucha: Impacts on the Chemical Composition of the Beverage. Foods 2020, 9, 963. [Google Scholar] [CrossRef] [PubMed]
- Marques, W.L.; Raghavendran, V.; Stambuk, B.U.; Gombert, A.K. Sucrose and Saccharomyces Cerevisiae: A Relationship Most Sweet. FEMS Yeast Res. 2016, 16, fov107. [Google Scholar] [CrossRef]
- Lynch, K.M.; Zannini, E.; Wilkinson, S.; Daenen, L.; Arendt, E.K. Physiology of Acetic Acid Bacteria and Their Role in Vinegar and Fermented Beverages. Compr. Rev. Food Sci. Food Saf. 2019, 18, 587–623. [Google Scholar] [CrossRef]
- Cardoso, R.R.; Neto, R.O.; Dos Santos D’Almeida, C.T.; do Nascimento, T.P.; Pressete, C.G.; Azevedo, L.; Martino, H.S.D.; Cameron, L.C.; Ferreira, M.S.L.; Barros, F.A.R. de Kombuchas from Green and Black Teas Have Different Phenolic Profile, Which Impacts Their Antioxidant Capacities, Antibacterial and Antiproliferative Activities. Food Res. Int. 2020, 128, 108782. [Google Scholar] [CrossRef] [PubMed]
- Ferremi Leali, N.; Binati, R.L.; Martelli, F.; Gatto, V.; Luzzini, G.; Salini, A.; Slaghenaufi, D.; Fusco, S.; Ugliano, M.; Torriani, S.; et al. Reconstruction of Simplified Microbial Consortia to Modulate Sensory Quality of Kombucha Tea. Foods 2022, 11, 3045. [Google Scholar] [CrossRef] [PubMed]
- Tran, T.; Romanet, R.; Roullier, C.; Verdier, F.; Martin, A.; Schmitt, P.; Alexandre, H.; Grandvalet, C.; Tourdot, R. Non-Targeted Metabolomic Analysis of the Kombucha Production Process. Metabolites 2022, 12, 160. [Google Scholar] [CrossRef] [PubMed]
- Tran, T.; Billet, K.; Torres-Cobos, B.; Vichi, S.; Verdier, F.; Martin, A.; Alexandre, H.; Tourdot, R. Use of a Minimal Microbial Consortium to Determine the Origin of Kombucha Flavor. Front. Microbiol. 2022, 13, 836617. [Google Scholar] [CrossRef] [PubMed]
- Coton, M.; Pawtowski, A.; Taminiau, B.; Burgaud, G.; Deniel, F.; Coulloumme-Labarthe, L.; Fall, A.; Daube, G.; Coton, E. Unraveling Microbial Ecology of Industrial-Scale Kombucha Fermentations by Metabarcoding and Culture-Based Methods. FEMS Microbiol. Ecol. 2017, 93, fix048. [Google Scholar] [CrossRef] [PubMed]
- Tran, T.; Grandvalet, C.; Winckler, P.; Verdier, F.; Martin, A.; Alexandre, H.; Tourdot-Maréchal, R. Shedding Light on the Formation and Structure of Kombucha Biofilm Using Two-Photon Fluorescence Microscopy. Front. Microbiol. 2021, 12, 13. [Google Scholar] [CrossRef] [PubMed]
- Tran, T.; Verdier, F.; Martin, A.; Alexandre, H.; Grandvalet, C.; Tourdot-Maréchal, R. Oxygen Management during Kombucha Production: Roles of the Matrix, Microbial Activity, and Process Parameters. Food Microbiol. 2022, 105, 104024. [Google Scholar] [CrossRef] [PubMed]
- Cvetković, D.; Markov, S.; Djurić, M.; Savić, D.; Velićanski, A. Specific Interfacial Area as a Key Variable in Scaling-up Kombucha Fermentation. J. Food Eng. 2008, 85, 387–392. [Google Scholar] [CrossRef]
- Pallmann, C.L.; Brown, J.A.; Olineka, T.L.; Cocolin, L.; Mills, D.A.; Bisson, L.F. Use of WL Medium to Profile Native Flora Fermentations. Am. J. Enol. Vitic. 2001, 52, 198–203. [Google Scholar] [CrossRef]
- Dicks, L.M.T.; Dellaglio, F.; Collins, M.D. Proposal to Reclassify Leuconostoc oenos as Oenococcus oeni [Corrig.] Gen. Nov., Comb. Nov. Int. J. Syst. Bacteriol. 1995, 45, 395–397. [Google Scholar] [CrossRef]
- OIV. Méthode OIV-MA-AS313-01: Acidité Totale; Recueil International des Méthodes d’Analyse-OIV: Paris, France, 2009. [Google Scholar]
- Lee, S.; Lee, D.K. What Is the Proper Way to Apply the Multiple Comparison Test? Korean J. Anesthesiol. 2018, 71, 353–360. [Google Scholar] [CrossRef] [PubMed]
- R Core Team. R: A Language and Environment for Statistical Computing; R Core Team: Vienna, Austria, 2023. [Google Scholar]
- Kassambara, A.; Mundt, F. Factoextra: Extract and Visualize the Results of Multivariate Data Analyses. R Package Version. 2020. Available online: https://cran.r-project.org/package=factoextra (accessed on 10 April 2024).
- Husson, F.; Josse, J.; Le, S.; Mazet, J. FactoMineR: Multivariate Exploratory Data Analysis and Data Mining. 2024. Available online: https://cran.r-project.org/package=FactoMineR (accessed on 10 April 2024).
- Ogle, D.H.; Doll, J.C.; Powell Wheeler, A.; Dinno, A. FSA: Simple Fisheries Stock Assessment Methods. In R Package Version; CRAN: Vienna, Austria, 2023. [Google Scholar]
- Karkaria, B.D.; Manhart, A.; Fedorec, A.J.H.; Barnes, C.P. Chaos in Synthetic Microbial Communities. PLoS Comput. Biol. 2022, 18, e1010548. [Google Scholar] [CrossRef]
- Wright, E.S.; Gupta, R.; Vetsigian, K.H. Multi-Stable Bacterial Communities Exhibit Extreme Sensitivity to Initial Conditions. FEMS Microbiol. Ecol. 2021, 97, fiab073. [Google Scholar] [CrossRef] [PubMed]
- Feng, K.; Zhang, Z.; Cai, W.; Liu, W.; Xu, M.; Yin, H.; Wang, A.; He, Z.; Deng, Y. Biodiversity and Species Competition Regulate the Resilience of Microbial Biofilm Community. Mol. Ecol. 2017, 26, 6170–6182. [Google Scholar] [CrossRef] [PubMed]
- Maoz, A.; Mayr, R.; Scherer, S. Temporal Stability and Biodiversity of Two Complex Antilisterial Cheese-Ripening Microbial Consortia. Appl. Environ. Microbiol. 2003, 69, 4012–4018. [Google Scholar] [CrossRef] [PubMed]
- Ratzke, C.; Barrere, J.; Gore, J. Strength of Species Interactions Determines Biodiversity and Stability in Microbial Communities. Nat. Ecol. Evol. 2020, 4, 376–383. [Google Scholar] [CrossRef] [PubMed]
- Ravi, A.; Halstead, F.D.; Bamford, A.; Casey, A.; Thomson, N.M.; Van Schaik, W.; Snelson, C.; Goulden, R.; Foster-Nyarko, E.; Savva, G.M.; et al. Loss of Microbial Diversity and Pathogen Domination of the Gut Microbiota in Critically Ill Patients. Microb. Genom. 2019, 5, e000293. [Google Scholar] [CrossRef] [PubMed]
- Villarreal, P.; Quintrel, P.A.; Olivares-Muñoz, S.; Ruiz, J.J.; Nespolo, R.F.; Cubillos, F.A. Identification of New Ethanol-tolerant Yeast Strains with Fermentation Potential from Central Patagonia. Yeast 2022, 39, 128–140. [Google Scholar] [CrossRef] [PubMed]
- Regulation (Eu). No 1169/2011 of the European Parliament and of the Council. Off. J. Eur. Union 2011, 304, 18–63. [Google Scholar]
- Oshiro, M.; Momoda, R.; Tanaka, M.; Zendo, T.; Nakayama, J. Dense Tracking of the Dynamics of the Microbial Community and Chemicals Constituents in Spontaneous Wheat Sourdough during Two Months of Backslopping. J. Biosci. Bioeng. 2019, 128, 170–176. [Google Scholar] [CrossRef]
- Walker, G.; Stewart, G. Saccharomyces cerevisiae in the Production of Fermented Beverages. Beverages 2016, 2, 30. [Google Scholar] [CrossRef]
- Harrison, K.; Curtin, C. Microbial Composition of SCOBY Starter Cultures Used by Commercial Kombucha Brewers in North America. Microorganisms 2021, 9, 1060. [Google Scholar] [CrossRef] [PubMed]
- Persson, S.; Welkenhuysen, N.; Shashkova, S.; Cvijovic, M. Fine-Tuning of Energy Levels Regulates SUC2 via a SNF1-Dependent Feedback Loop. Front. Physiol. 2020, 11, 954. [Google Scholar] [CrossRef] [PubMed]
- Silveira, M.C.F.; Oliveira, E.M.M.; Carvajal, E.; Bon, E.P.S. Nitrogen Regulation of Saccharomyces cerevisiae Invertase. Appl. Biochem. Biotechnol. 2000, 84, 1–18. [Google Scholar]


| Culture | Microbial Composition | Bottle Type | SIS | Inoculation | Code |
|---|---|---|---|---|---|
| Original | Brettanomyces bruxellensis, Hanseniaspora valbyensis, Saccharomyces cerevisiae, Pichia occidentalis, Zygotorulaspora florentina, Oenococcus oeni, Monitored as non-O. oeni: Acetobacter indonesiensis, Liquorilactobacillus mali, Liquorilactobacillus satsumensis | Boston | SIS1 | 12% (v/v) | O1 |
| Boston | SIS1 | *: volume for fixed initial total acidity of 10 meq/L | O* | ||
| Schott® | SIS2 | 12% (v/v) | O2 | ||
| Synthetic | Brettanomyces bruxellensis, Hanseniaspora valbyensis, Saccharomyces cerevisiae, Pichia occidentalis, Oenococcus oeni, Monitored as non-O. oeni: Acetobacter indonesiensis | Boston | SIS1 | 12% (v/v) | $1 |
| Boston | SIS1 | *: volume for fixed initial total acidity of 10 meq/L | $* | ||
| Schott® | SIS2 | 12% (v/v) | $2 |
| Condition | Sucrose (g/L) | Glucose (g/L) | Fructose (g/L) | Total Sugars (g/L) | Ethanol (g/L) | Gluconate (g/L) | Acetate (g/L) | Acidification Rate (meq/L/day) | B. bruxellensis (log(CFU)/mL) | H. valbyensis (log(CFU)/mL) | S. cerevisiae (log(CFU)/mL) | P. occidentalis (log(CFU)/mL) | O. oeni (log(CFU)/mL) | Non-O. oeni (log(CFU)/mL) |
|---|---|---|---|---|---|---|---|---|---|---|---|---|---|---|
| O1 | 5.7 ab | 8.6 | 11.0 ab | 25.3 ab | 4.2 ab | 1.4 | 0.2 | 8.1 | 6.8 | 6.4 a | 5.8 a | 4.0 | 5.1 | 5.7 |
| O* | 8.4 ab | 8.5 | 10.6 ab | 27.5 ab | 3.8 ab | 3.3 | 0.2 | 8.6 | 6.7 | 6.3 a | 5.6 ab | 4.0 | 5.6 | 5.6 |
| O2 | 17.0 b | 6.8 | 8.9 b | 32.7 b | 2.5 b | 2.4 | 0.2 | 8.9 | 6.8 | 6.6 a | 5.4 b | 4.0 | 5.3 | 5.7 |
| $1 | 0.8 a | 8.9 | 12.7 a | 22.4 a | 5.0 a | 2.4 | 0.3 | 18.9 | 6.7 | 5.3 a | 5.9 a | 4.0 | 5.2 | 5.4 |
| $* | 1.7 a | 8.5 | 12.9 a | 23.2 a | 4.5 ab | 4.4 | 0.3 | 12.7 | 6.7 | 4.9 a | 5.7 ab | 4.0 | 5.1 | 5.5 |
| $2 | 5.8 ab | 8.4 | 11.9 ab | 26.1 ab | 4.8 a | 3.8 | 0.3 | 9.3 | 6.6 | 5.3 a | 5.7 b | 4.0 | 5.4 | 5.5 |
| p-value | 0.01002 | 0.1904 | 0.01072 | 0.01471 | 0.008749 | 0.17 | 0.514 | 0.1465 | 0.4569 | 0.0149 | 0.01779 | Not calculable | 0.2489 | 0.4012 |
| Condition | Biofilm Weight (mg) | B. bruxellensis (log(CFU)/g Fresh Biofilm) | H. valbyensis (log(CFU)/g Fresh Biofilm) | S. cerevisiae (log(CFU)/g Fresh Biofilm) | P. occidentalis (log(CFU)/g Fresh Biofilm) | O. oeni (log(CFU)/g Fresh Biofilm) | Non-O. oeni Bacteria (log(CFU)/g Fresh Biofilm) |
|---|---|---|---|---|---|---|---|
| O1 | 1.9 | 7.2 | 5.7 | 6.0 | 2.5 a | 7.0 | 8.1 |
| O* | 31.4 | 6.4 | 5.2 | 5.0 | 3.5 a | 5.8 | 7.3 |
| O2 | 41.2 | 6.3 | 5.2 | 4.7 | 3.1 a | 5.4 | 6.9 |
| $1 | 94.0 | 5.3 | 4.3 | 4.7 | 2.8 a | 5.3 | 7.7 |
| $* | 29.3 | 6.0 | 4.6 | 4.8 | 2.7 a | 5.5 | 7.1 |
| $2 | 23.0 | 6.3 | 5.2 | 5.5 | 2.6 a | 5.6 | 7.0 |
| p-value | 0.1109 | 0.101 | 0.06201 | 0.06567 | 0.03653 | 0.2255 | 0.5052 |
Disclaimer/Publisher’s Note: The statements, opinions and data contained in all publications are solely those of the individual author(s) and contributor(s) and not of MDPI and/or the editor(s). MDPI and/or the editor(s) disclaim responsibility for any injury to people or property resulting from any ideas, methods, instructions or products referred to in the content. |
© 2024 by the authors. Licensee MDPI, Basel, Switzerland. This article is an open access article distributed under the terms and conditions of the Creative Commons Attribution (CC BY) license (https://creativecommons.org/licenses/by/4.0/).
Share and Cite
Daval, C.; Tran, T.; Verdier, F.; Martin, A.; Alexandre, H.; Grandvalet, C.; Tourdot-Maréchal, R. Identification of Key Parameters Inducing Microbial Modulation during Backslopped Kombucha Fermentation. Foods 2024, 13, 1181. https://doi.org/10.3390/foods13081181
Daval C, Tran T, Verdier F, Martin A, Alexandre H, Grandvalet C, Tourdot-Maréchal R. Identification of Key Parameters Inducing Microbial Modulation during Backslopped Kombucha Fermentation. Foods. 2024; 13(8):1181. https://doi.org/10.3390/foods13081181
Chicago/Turabian StyleDaval, Claire, Thierry Tran, François Verdier, Antoine Martin, Hervé Alexandre, Cosette Grandvalet, and Raphaëlle Tourdot-Maréchal. 2024. "Identification of Key Parameters Inducing Microbial Modulation during Backslopped Kombucha Fermentation" Foods 13, no. 8: 1181. https://doi.org/10.3390/foods13081181