

Development of a Measurement System Using Infrared Spectroscopy-Attenuated Total Reflectance, Principal Component Analysis and Artificial Intelligence for the Safe Quantification of the Nucleating Agent Sorbitol in Food Packaging


Abstract
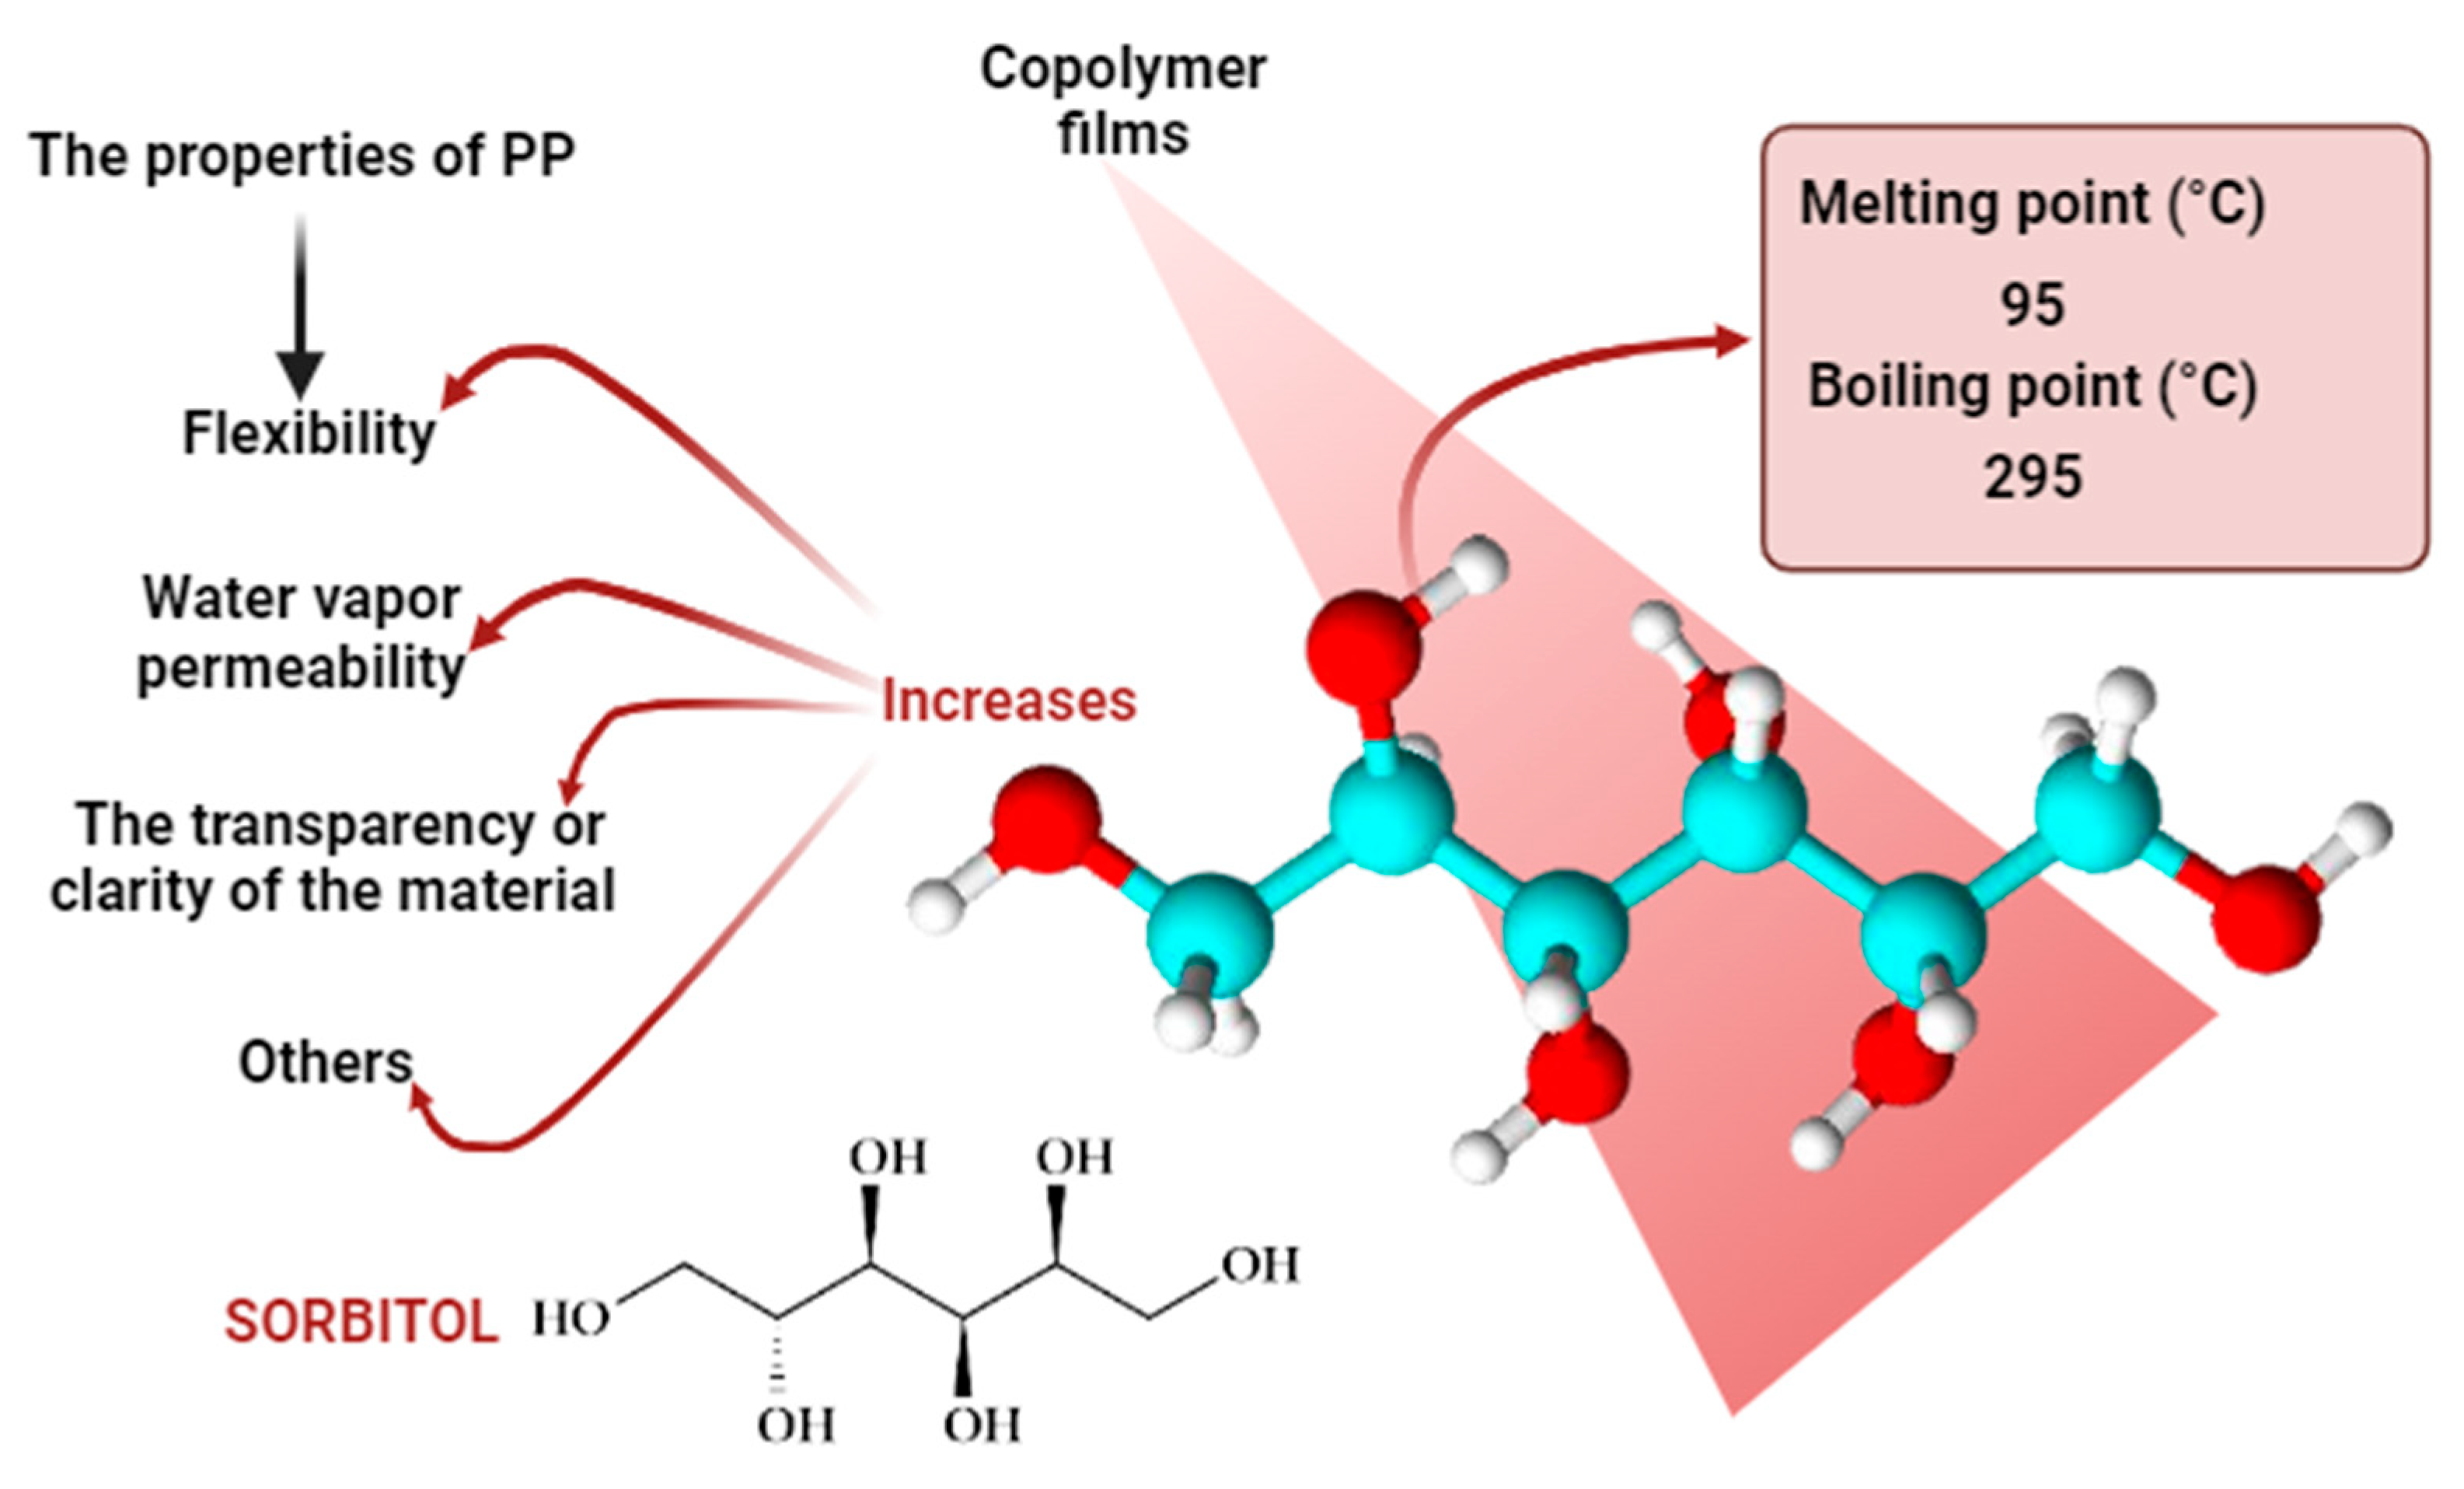
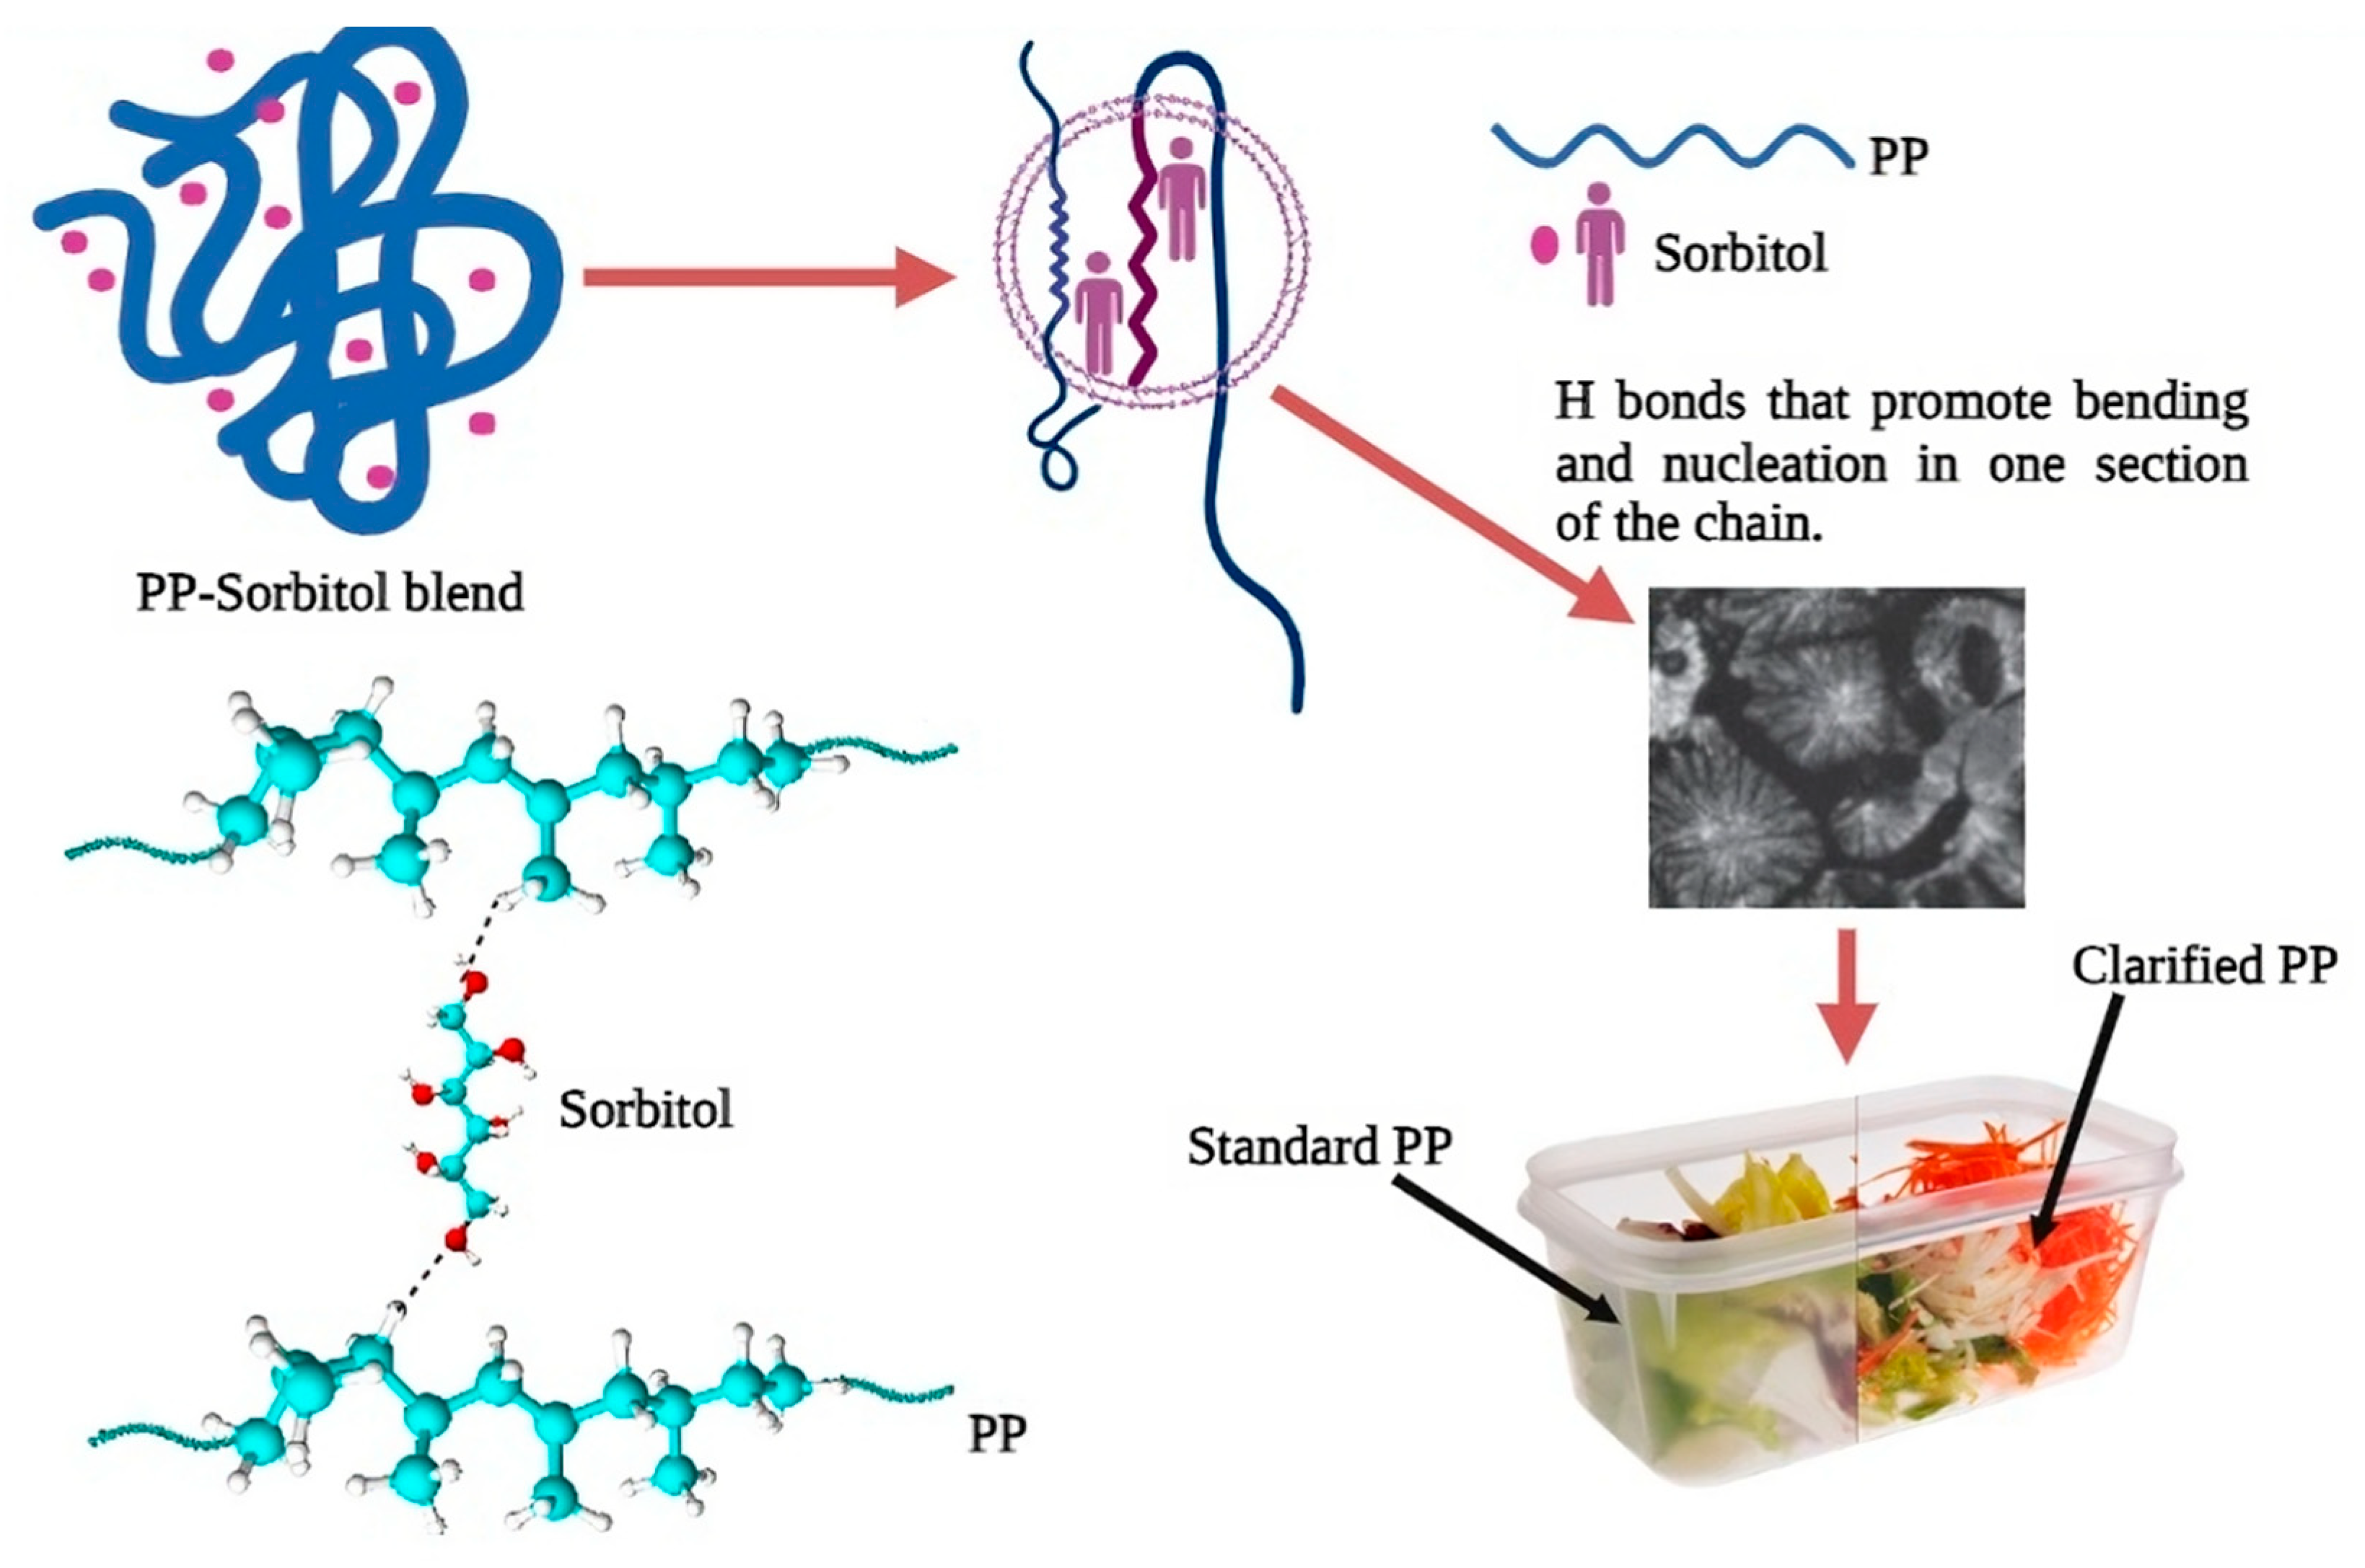
1. Introduction
2. Materials and Methods
2.1. Materials
2.2. Preparation of Copolymers Samples with Varying Concentrations of Sorbitol
Extraction of Sorbitol from Copolymer Samples
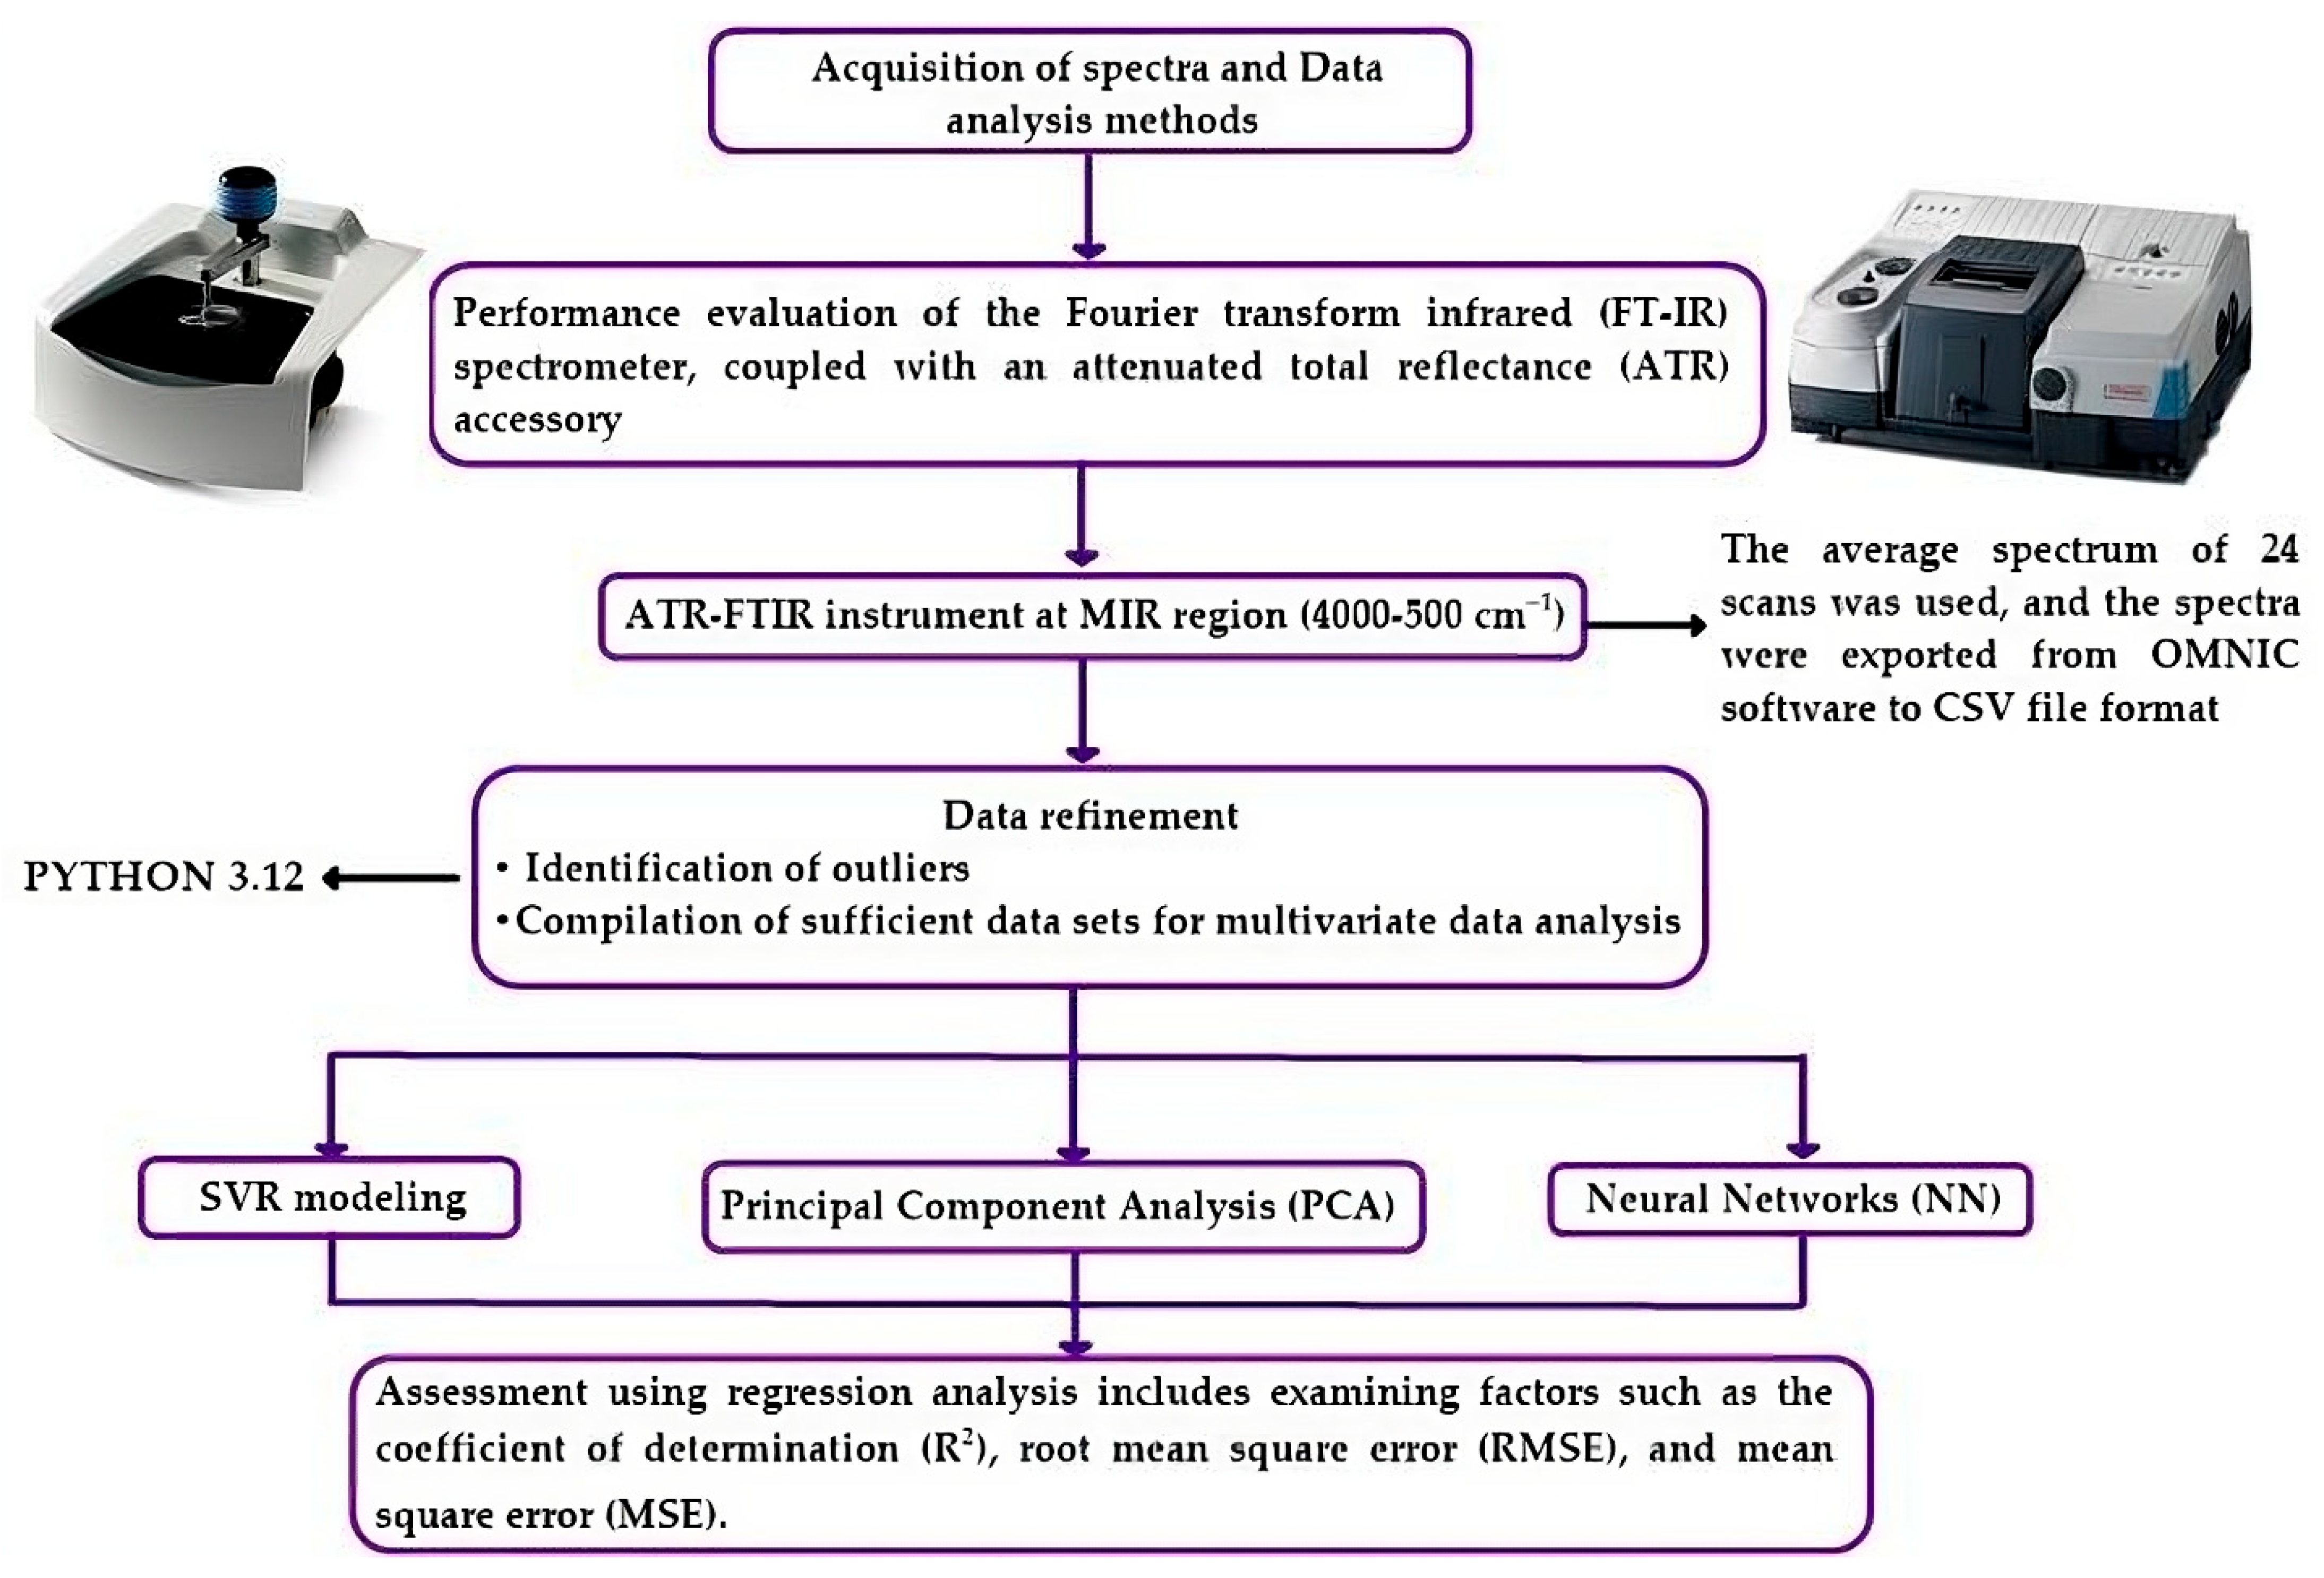
2.3. Acquisition of Spectra
Smoothing of Spectra
2.4. Data Analysis Methods
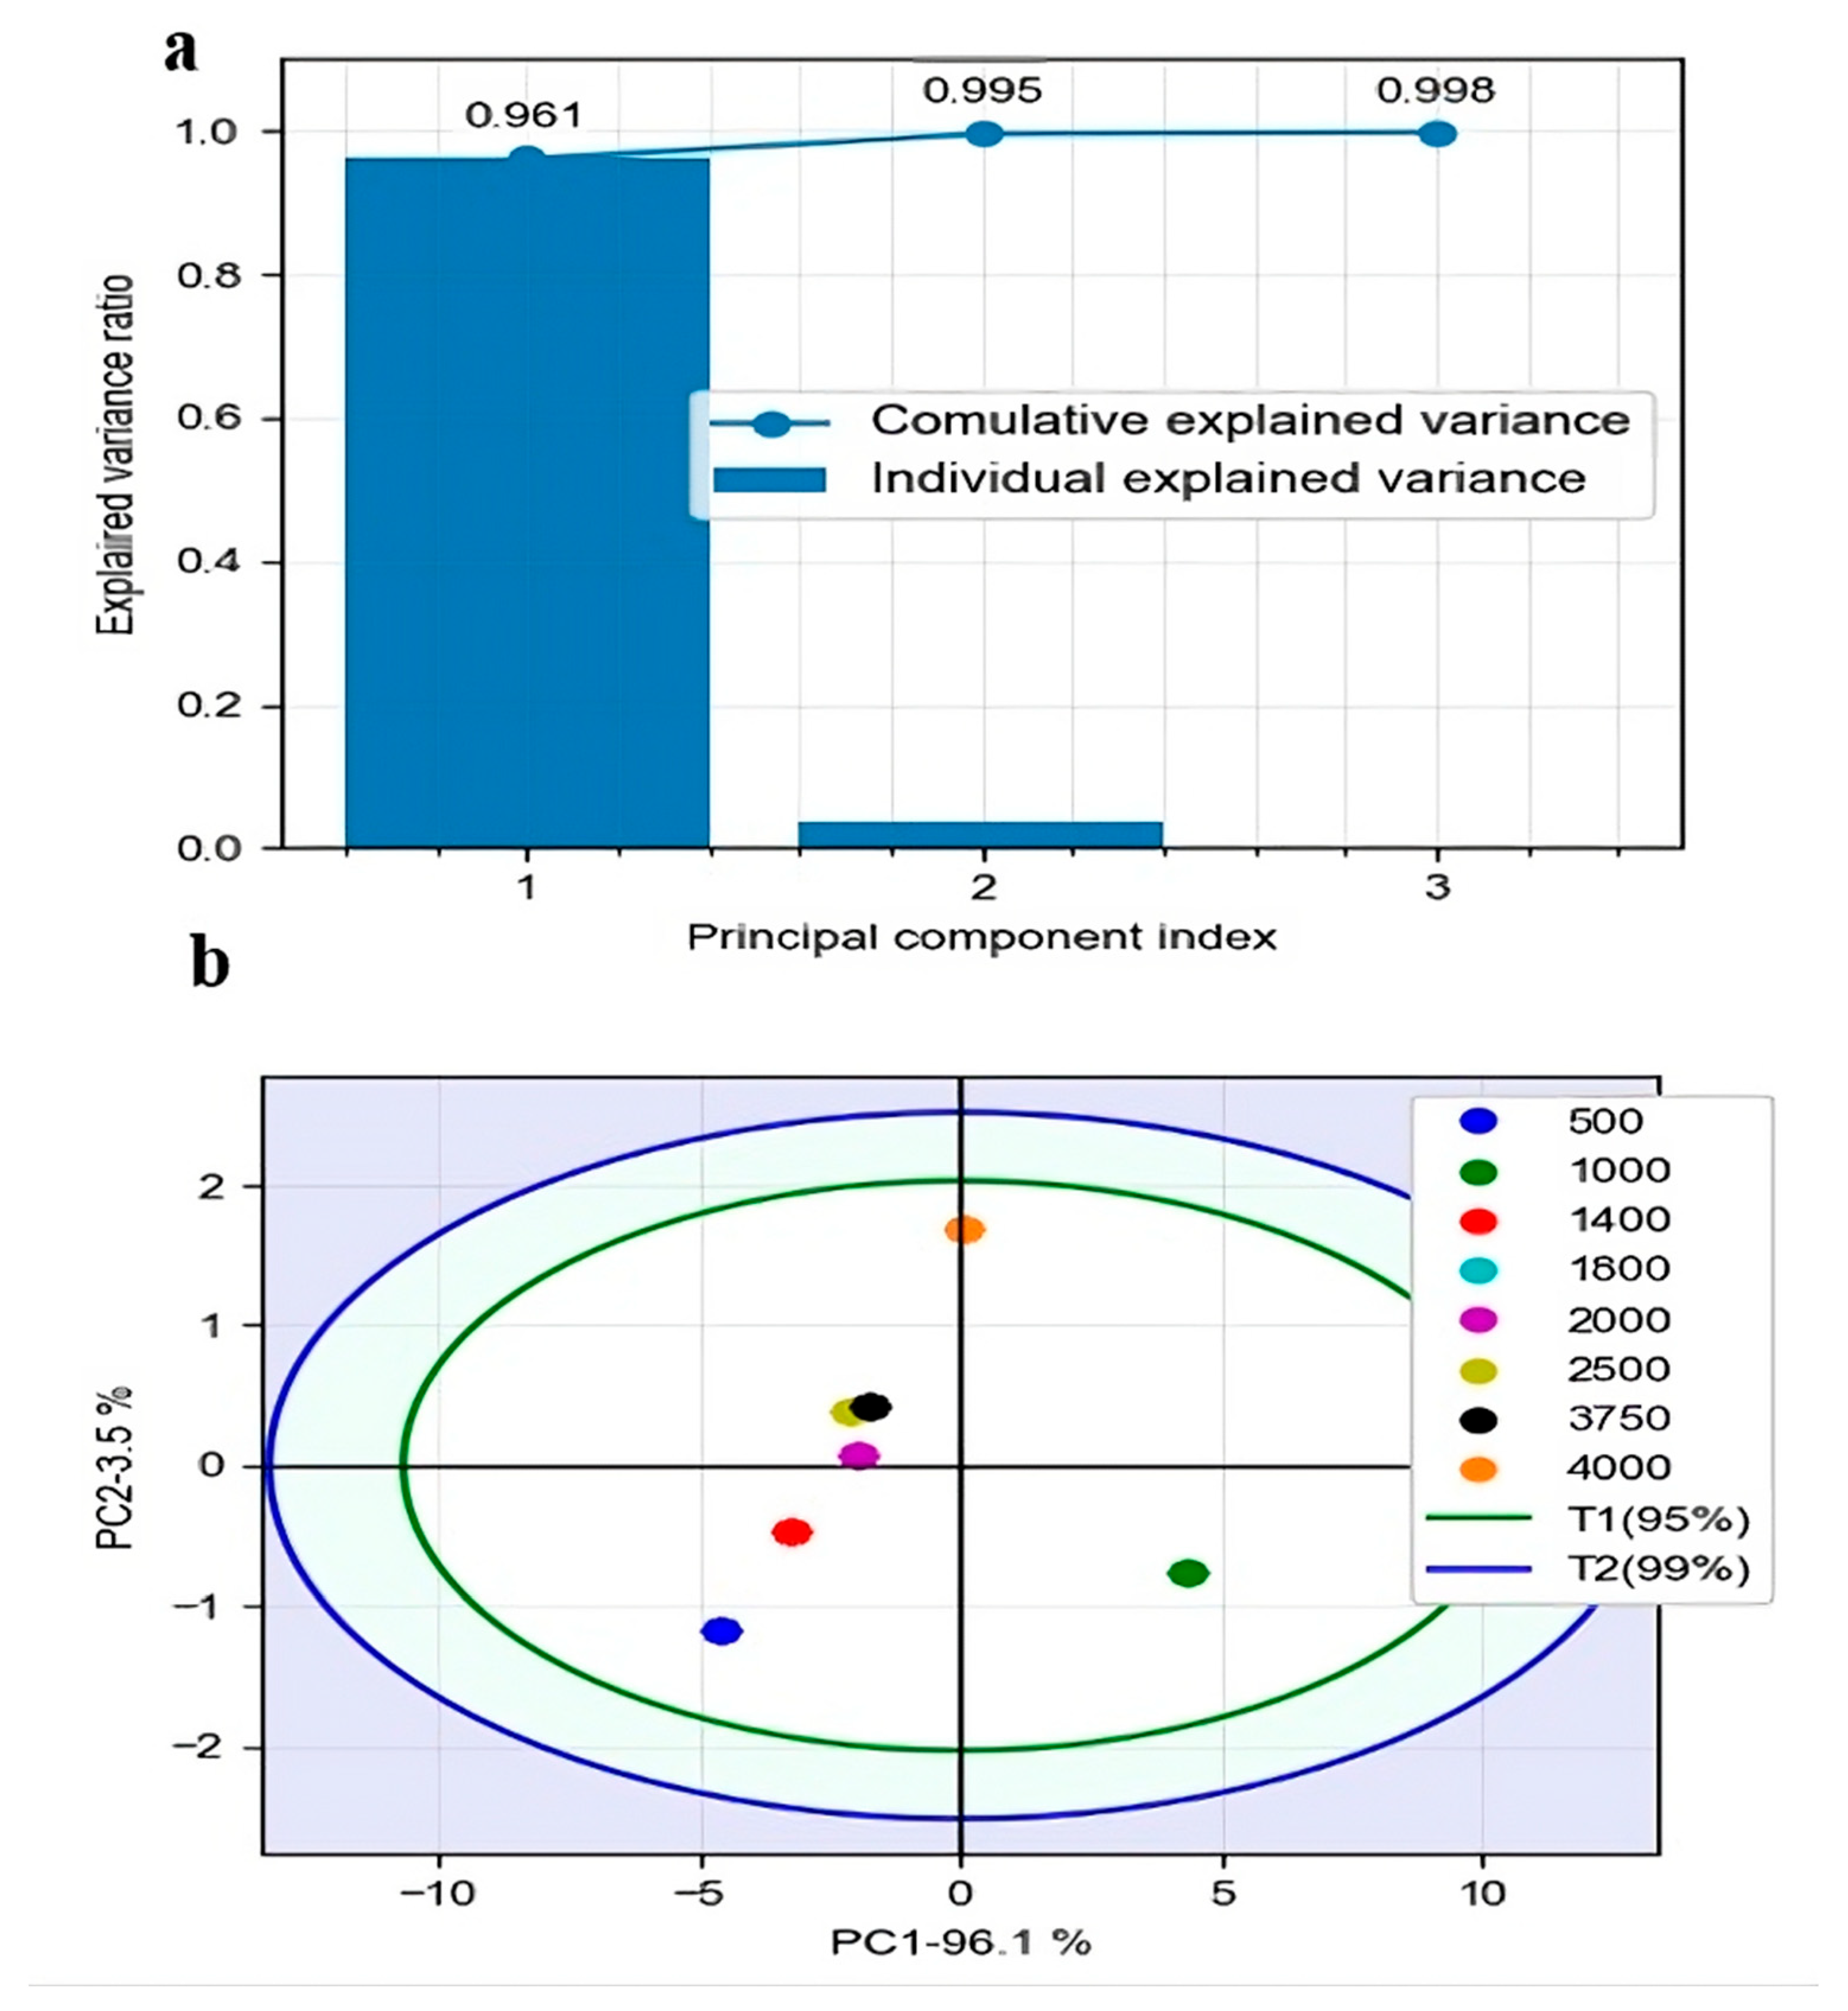
2.4.1. Principal Component Analysis
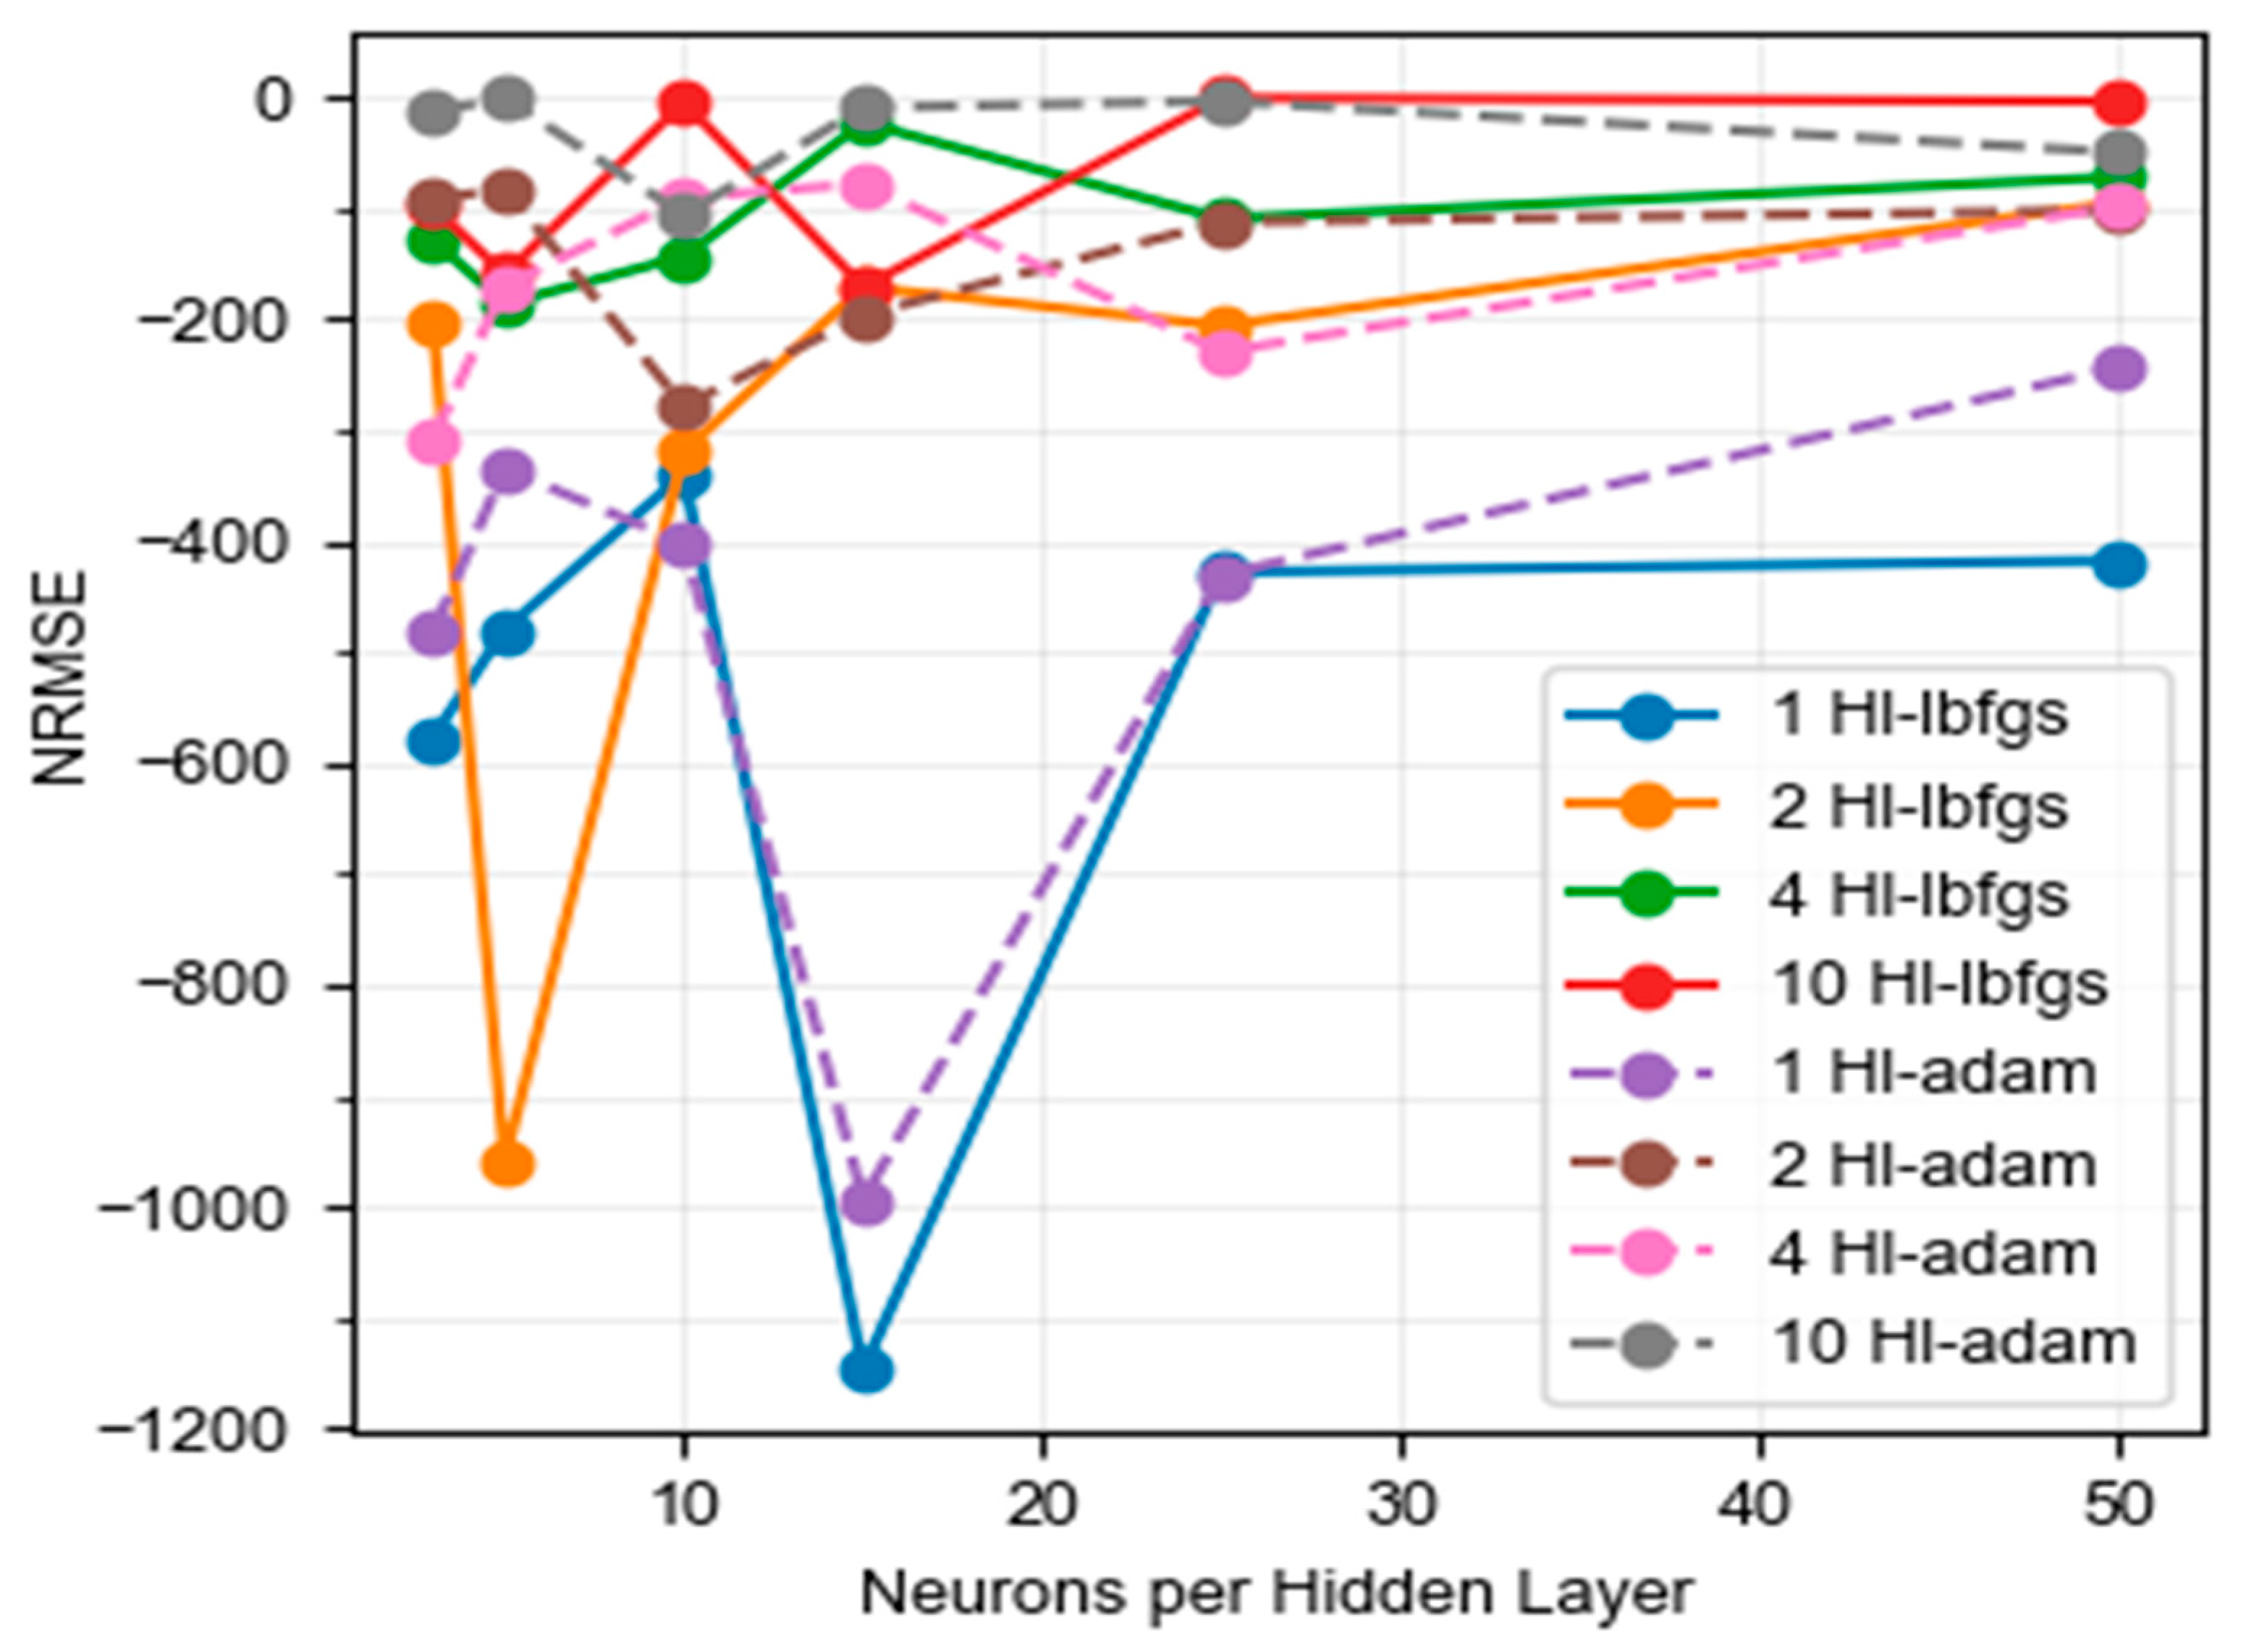
2.4.2. Definition of the Model with Neural Networks (NN)
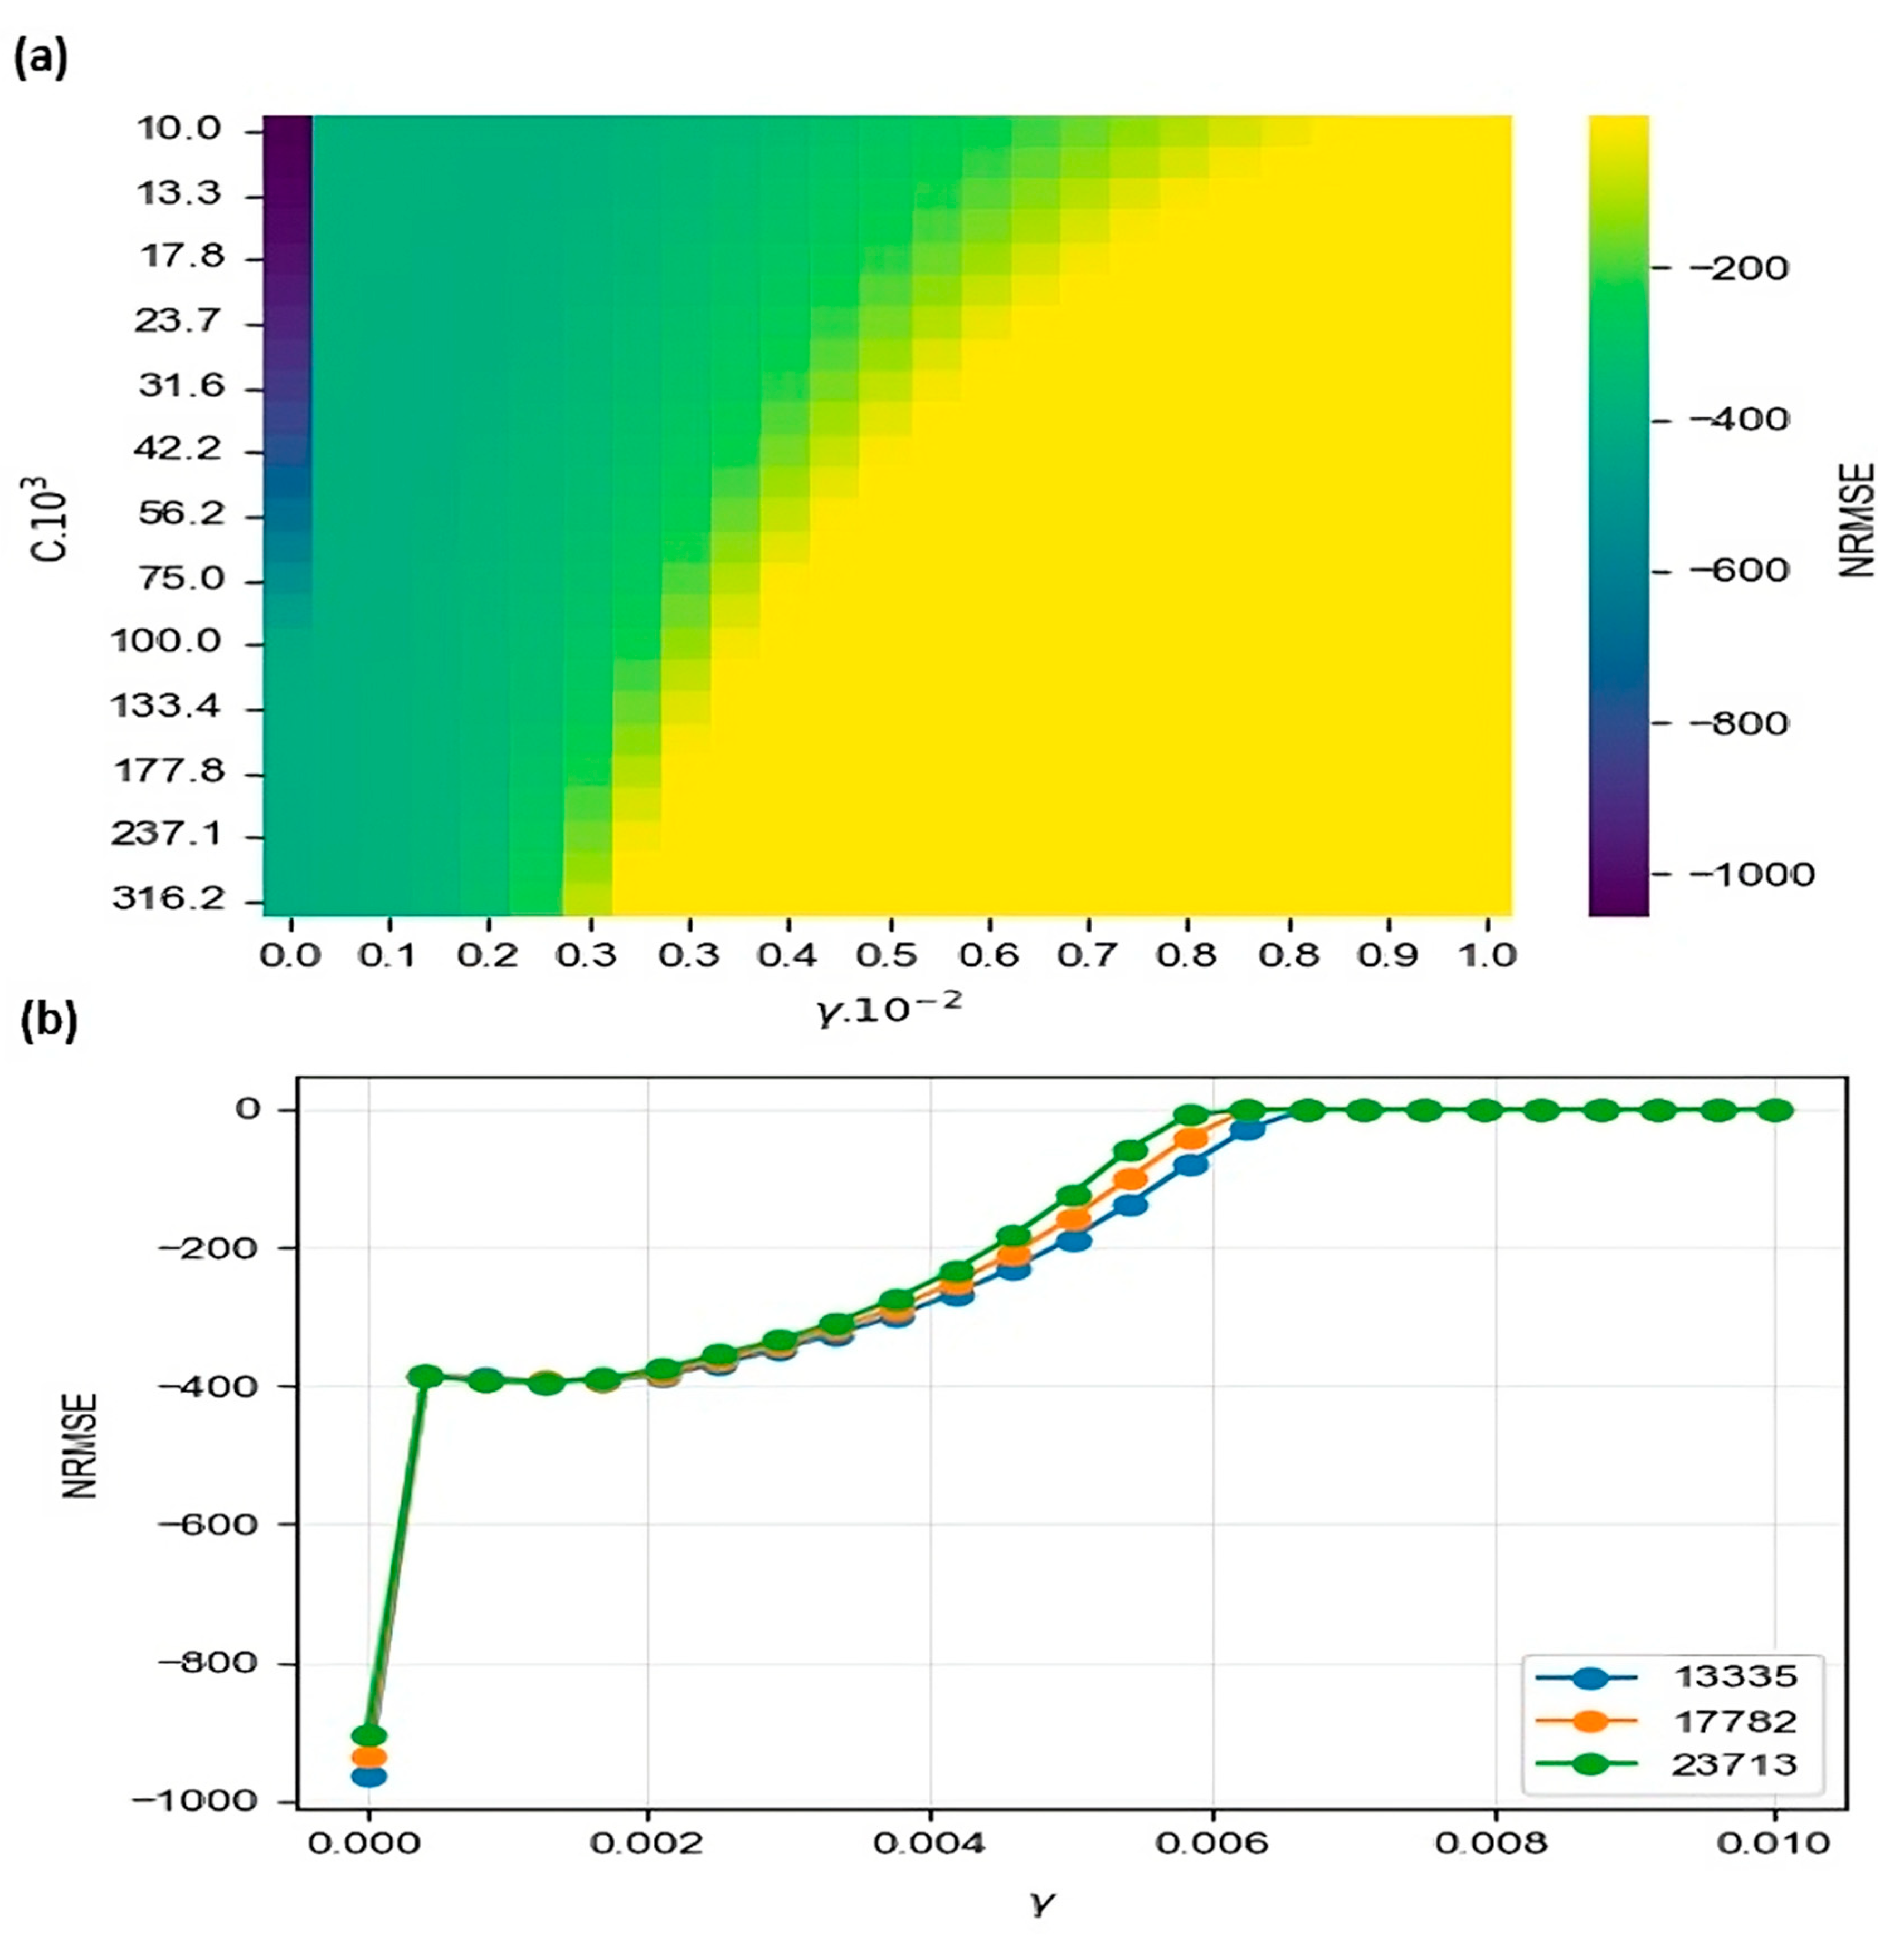
2.4.3. SVR Modeling
3. Results
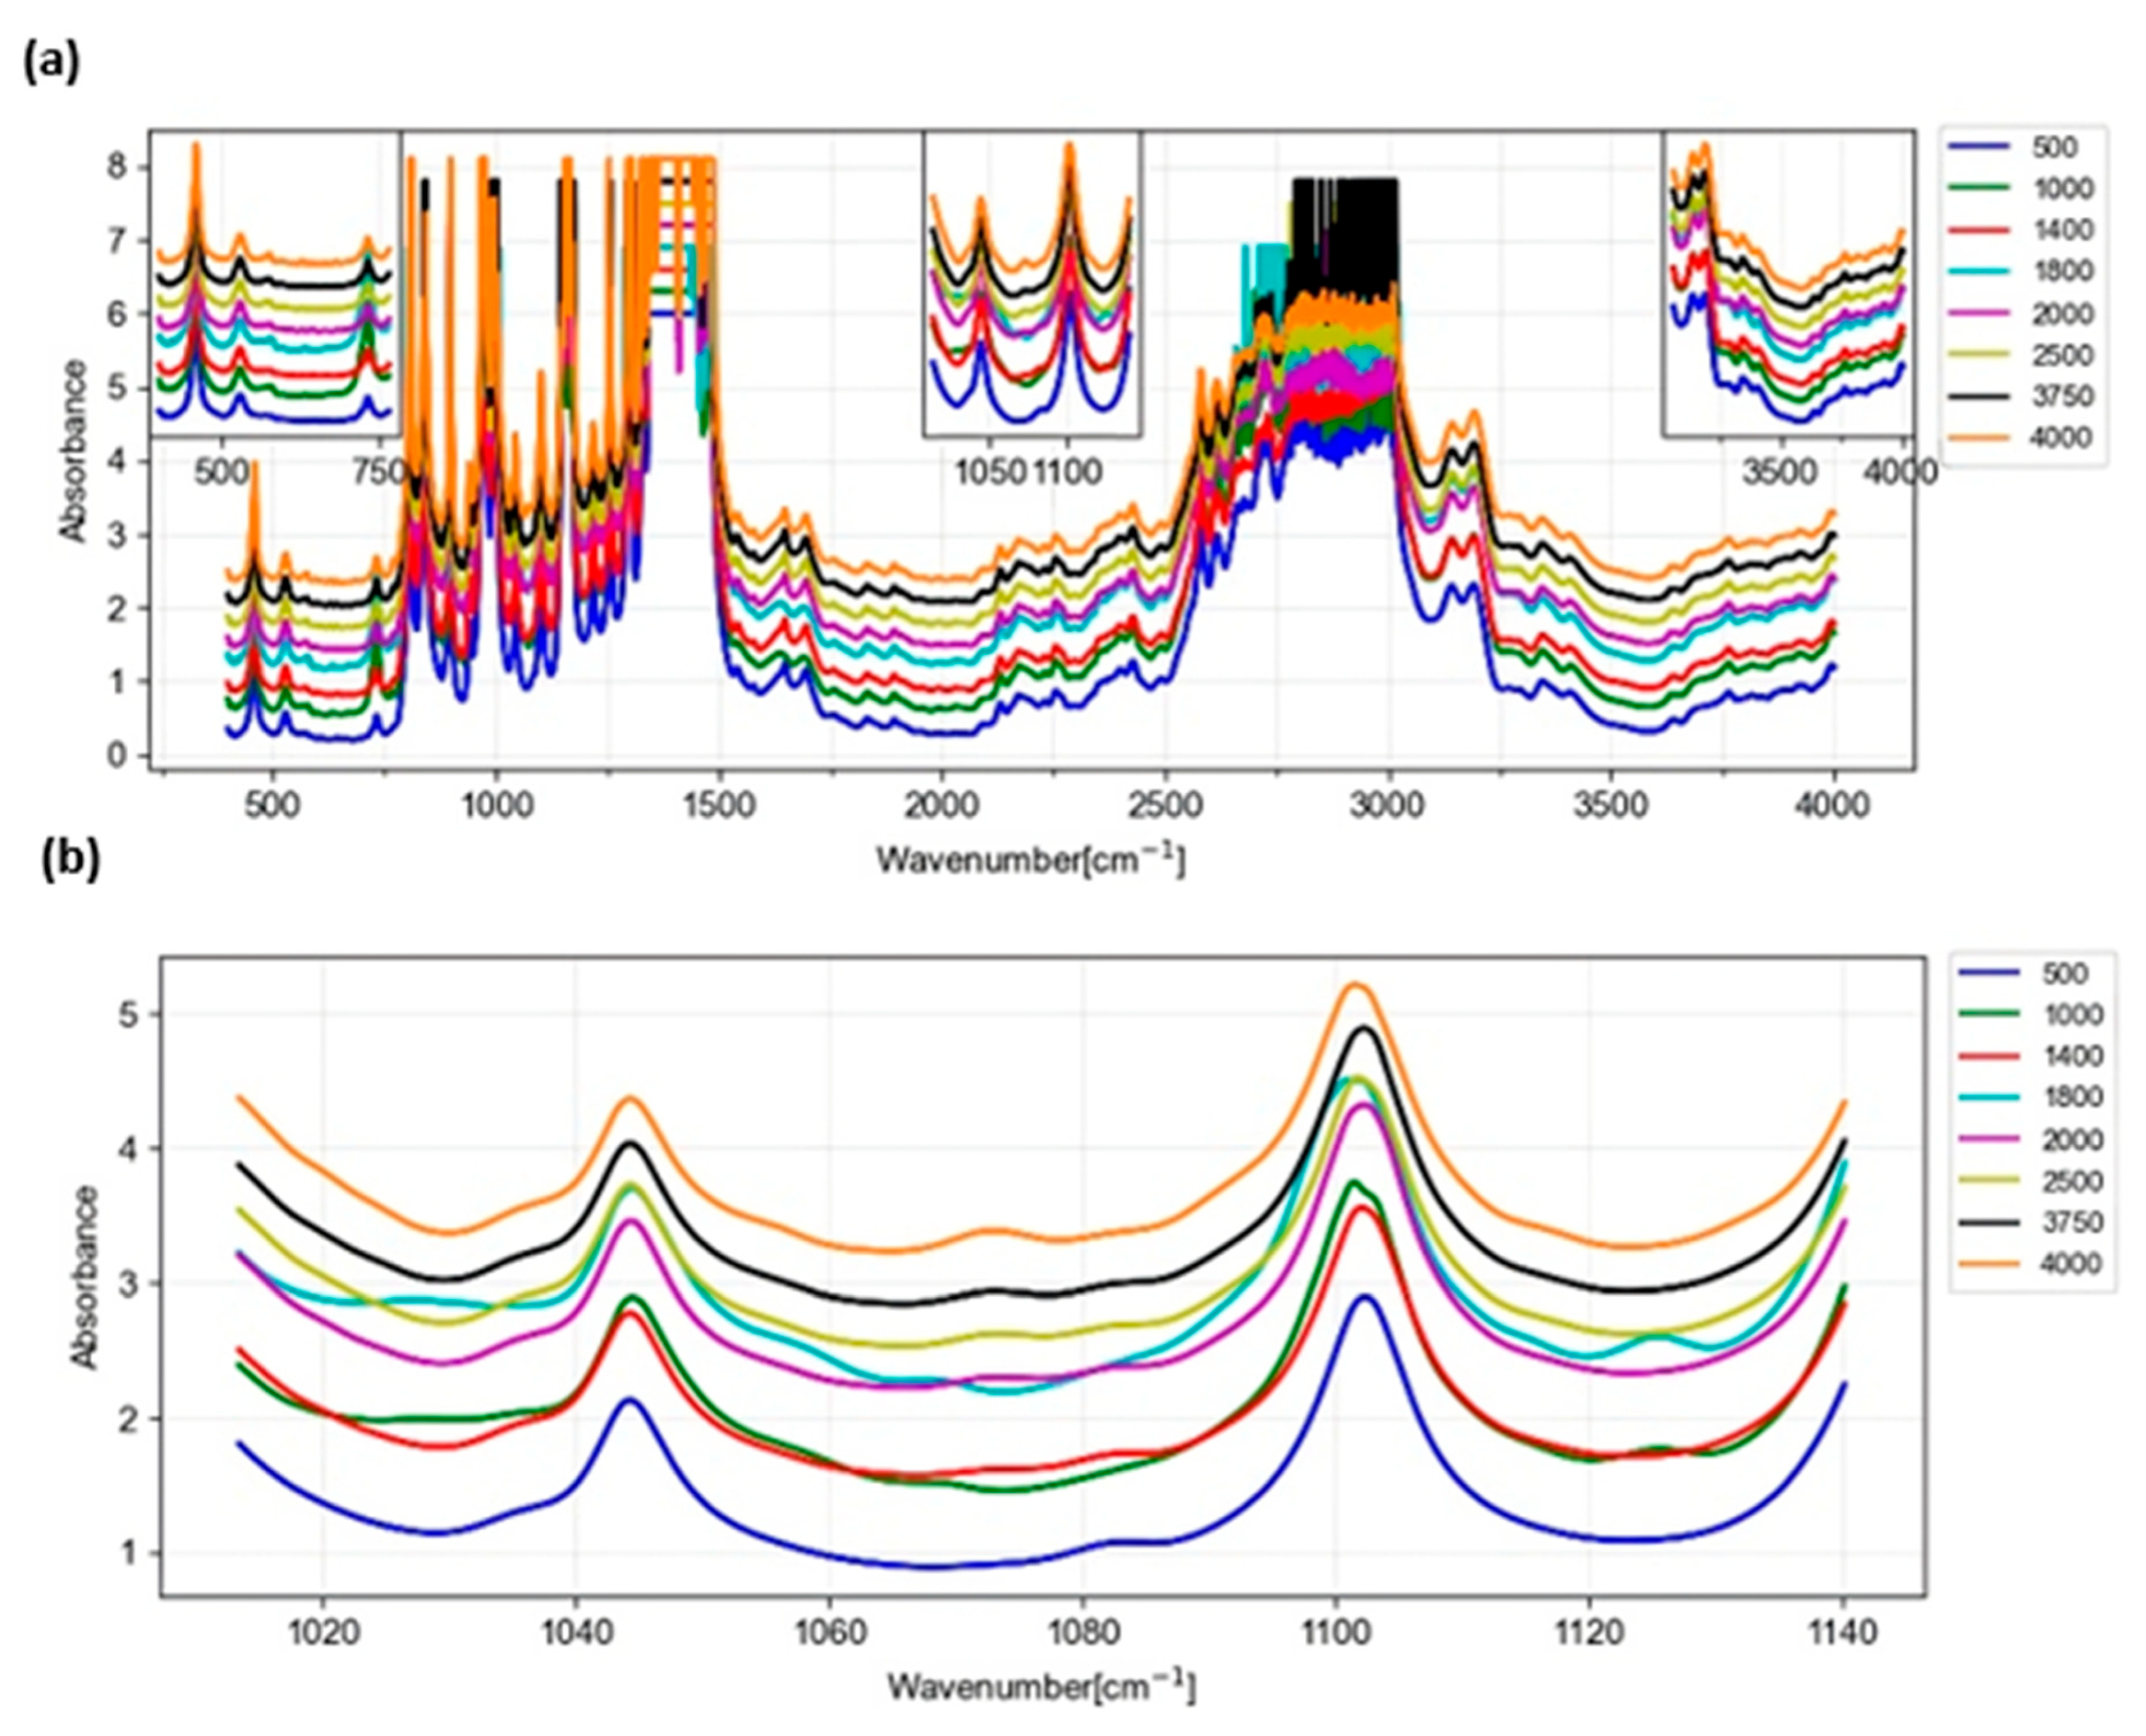
3.1. Spectra Measured by FTIR
3.2. Review of FTIR Data
3.3. Quality of the RMSE Prediction Models
3.4. Support Vector Machine (SVR)
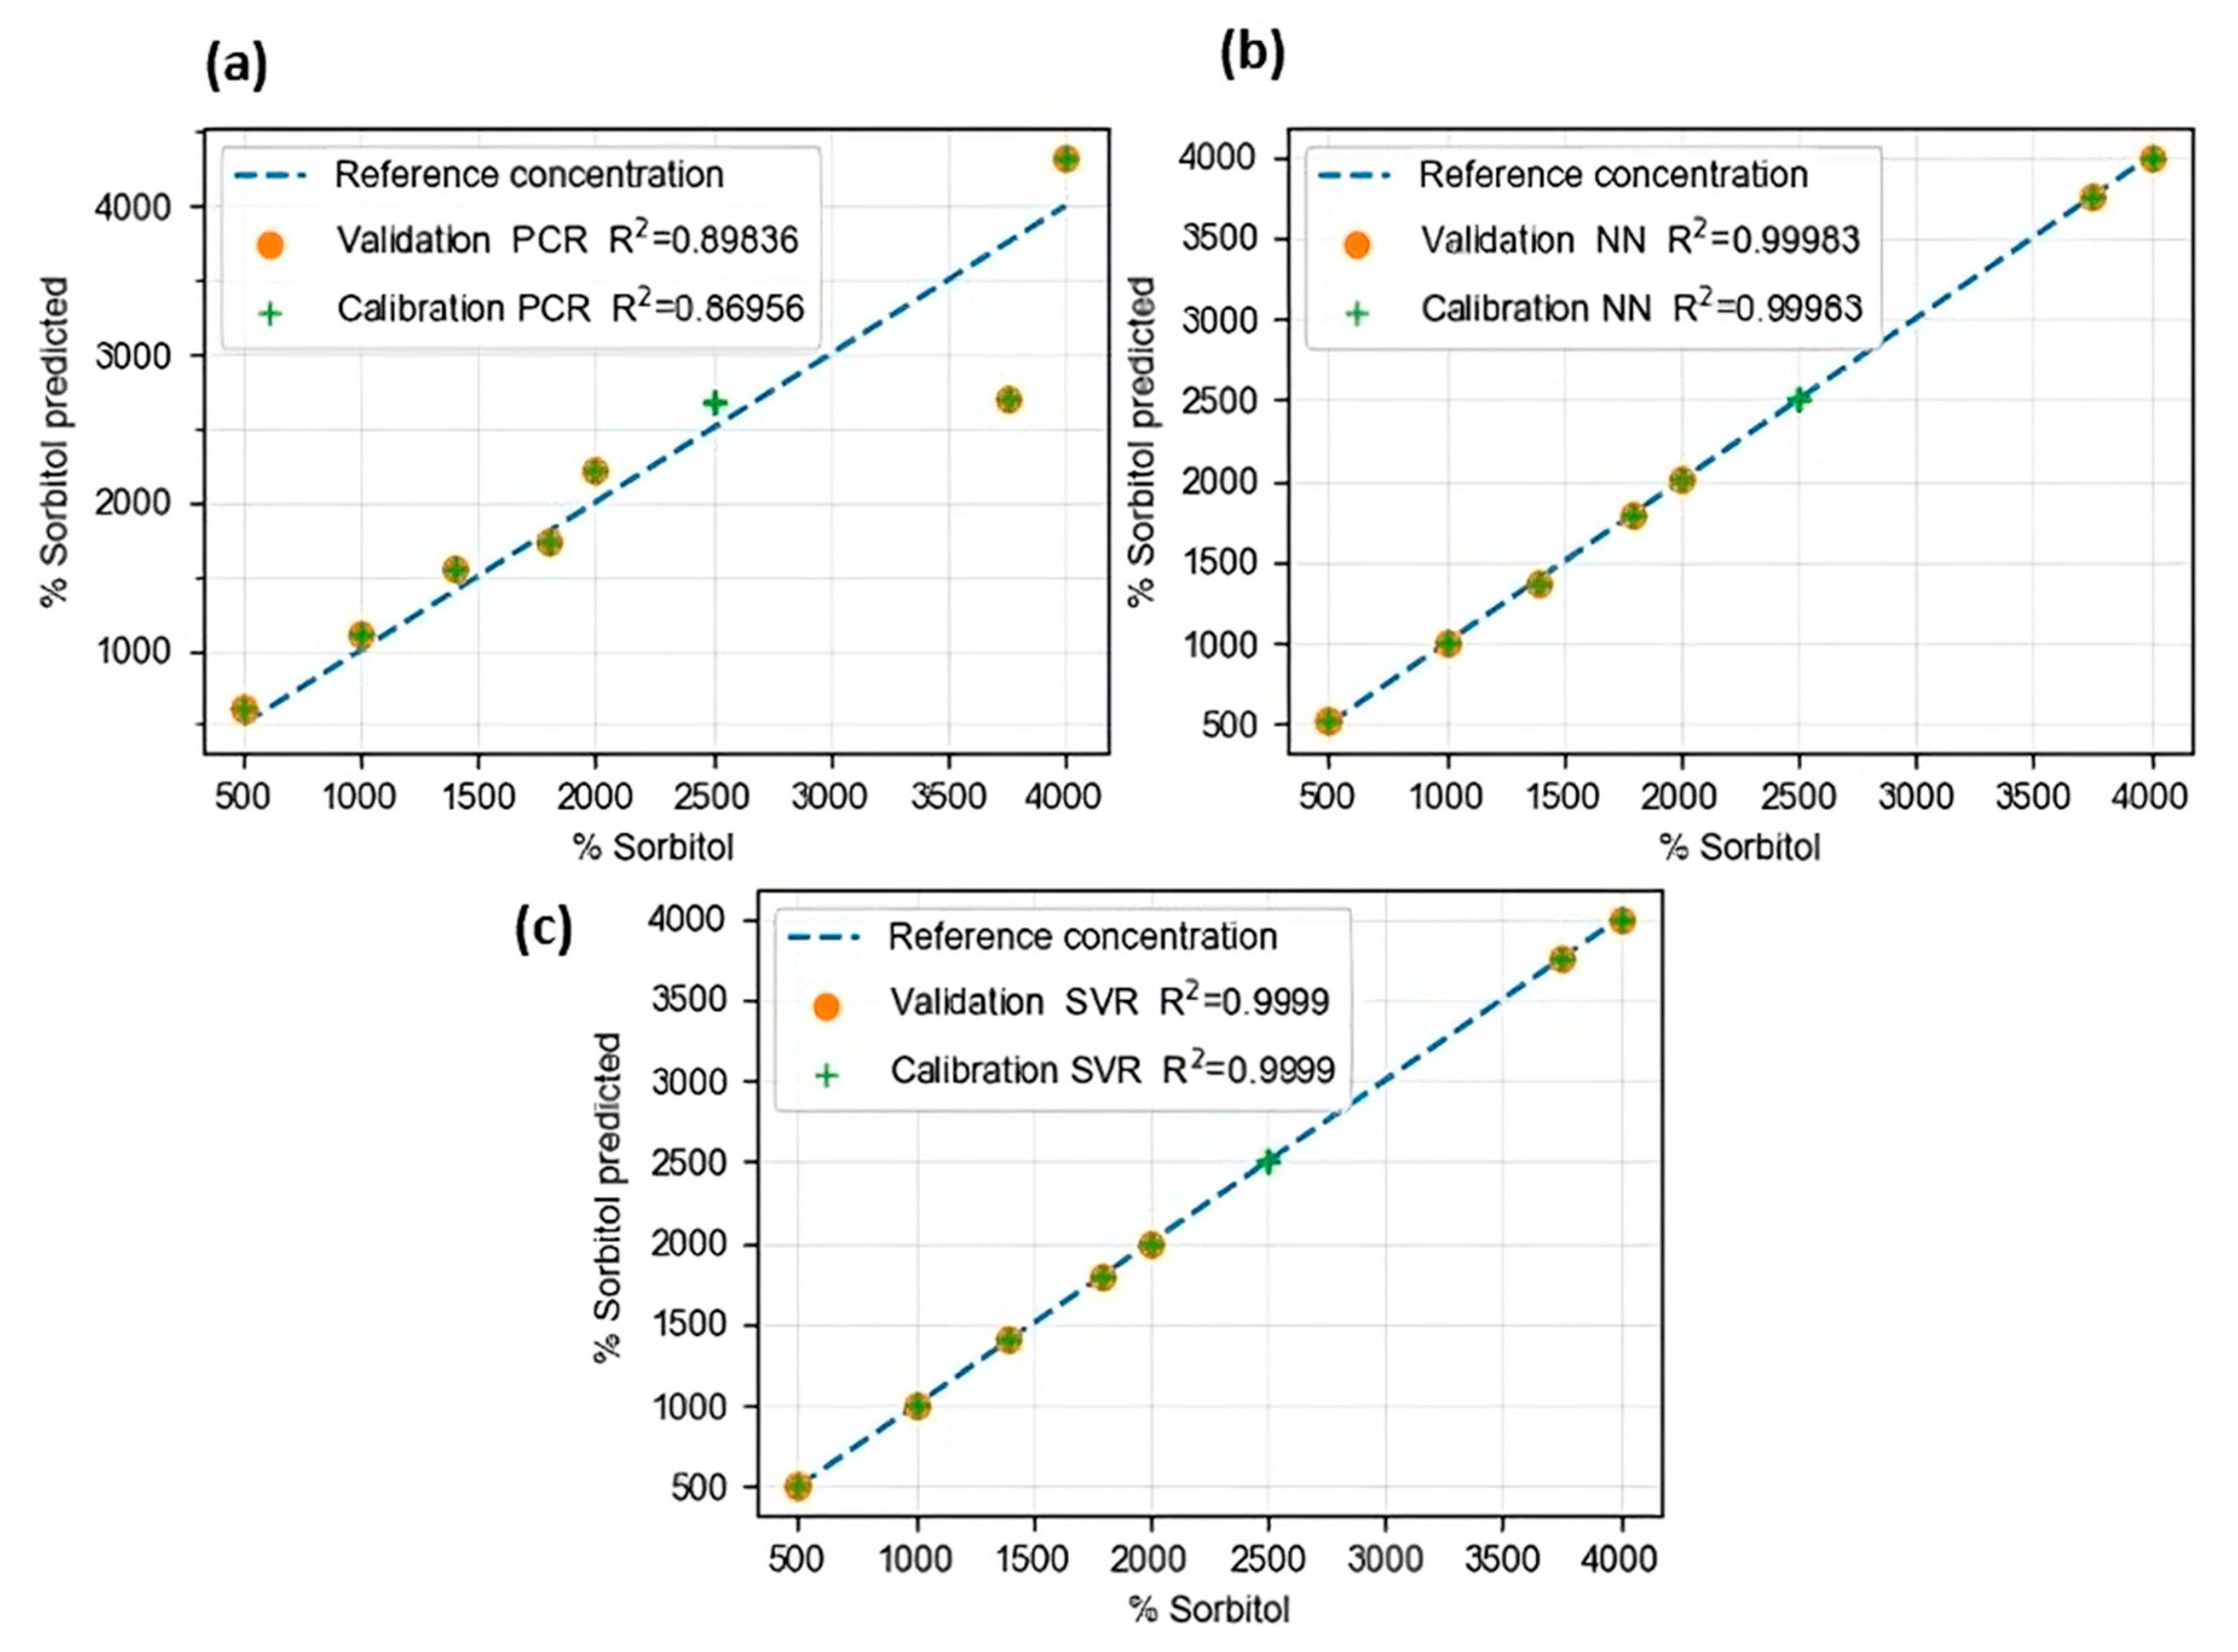
3.5. Prediction Models
4. Discussion
5. Conclusions
Author Contributions
Funding
Data Availability Statement
Conflicts of Interest
References
- Plastics-the Facts 2019 An Analysis of European Plastics Production, Demand and Waste Data. Available online: https://plasticseurope.org/wp-content/uploads/2021/10/2019-Plastics-the-facts.pdf (accessed on 24 November 2023).
- Hernández-Fernández, J.; Lopez-Martinez, J.; Barceló, D. Development and validation of a methodology for quantifying parts-per-billion levels of arsine and phosphine in nitrogen, hydrogen and liquefied petroleum gas using a variable pressure sampler coupled to gas chromatography-mass spectrometry. J. Chromatogr. A 2021, 1637, 461833. [Google Scholar] [CrossRef]
- Hernández-Fernández, J.; Castro-Suarez, J.R.; Toloza, C.A.T. Iron Oxide Powder as Responsible for the Generation of Industrial Polypropylene Waste and as a Co-Catalyst for the Pyrolysis of Non-Additive Resins. Int. J. Mol. Sci. 2022, 23, 11708. [Google Scholar] [CrossRef]
- Kabir, E.; Kaur, R.; Lee, J.; Kim, K.H.; Kwon, E.E. Prospects of biopolymer technology as an alternative option for non-degradable plastics and sustainable management of plastic wastes. J. Clean. Prod. 2020, 258, 120536. [Google Scholar] [CrossRef]
- Rendón-Villalobos, R.; Ortíz-Sánchez, A.; Tovar-Sánchez, E.; Flores-Huicochea, E. The role of biopolymers in obtaining environmentally friendly materials. Compos. Renew. Sustain. Mater. 2016, 151. [Google Scholar]
- Chacon, H.; Cano, H.; Fernández, J.H.; Guerra, Y.; Puello-Polo, E.; Ríos-Rojas, J.F.; Ruiz, Y. Effect of Addition of Polyurea as an Aggregate in Mortars: Analysis of Microstructure and Strength. Polymers 2022, 14, 1753. [Google Scholar] [CrossRef] [PubMed]
- Davis, G.; Song, J.H. Biodegradable packaging based on raw materials from crops and their impact on waste management. Ind. Crops Prod. 2006, 23, 147–161. [Google Scholar] [CrossRef]
- Raheem, D. Application of plastics and paper as food packaging materials—An overview. Emir. J. Food Agric. 2013, 25, 177–188. [Google Scholar] [CrossRef]
- Shaaban, H.A.; Farouk, A. Preservation and Packaging Food Recent Methods and Techniques: A Review. Biomed. J. Sci. Tech. Res. 2022, 46, 37680–37695. [Google Scholar] [CrossRef]
- Pavon, C.; Aldas, M.; Hernández-Fernández, J.; López-Martínez, J. Comparative characterization of gum rosins for their use as sustainable additives in polymeric matrices. J. Appl. Polym. Sci. 2022, 139, 51734. [Google Scholar] [CrossRef]
- Urzendowski, I.R.; Pechak, D.G.; Pechak, D.G. Characterization of Food Packaging Materials by Microscopic, Spectrophotometric, Thermal and Dynamic Mechanical Analysis. Food Struct. 1992, 11, 301–314. [Google Scholar]
- Hernández-Fernández, J.; Vivas-Reyes, R.; Toloza, C.A.T. Experimental Study of the Impact of Trace Amounts of Acetylene and Methylacetylene on the Synthesis, Mechanical and Thermal Properties of Polypropylene. Int. J. Mol. Sci. 2022, 23, 12148. [Google Scholar] [CrossRef] [PubMed]
- Kristiansen, P.M. Nucleation and clarification of semi-crystalline polymers. 2004. Available online: https://www.research-collection.ethz.ch/bitstream/handle/20.500.11850/148326/eth-27485-01.pdf (accessed on 24 November 2023).
- Eliaerts, J.; Dardenne, P.; Meert, N.; Van Durme, F.; Samyn, N.; Janssens, K.; De Wael, K. Rapid classification and quantification of cocaine in seized powders with ATR-FTIR and chemometrics. Drug Test Anal. 2017, 9, 1480–1489. [Google Scholar] [CrossRef] [PubMed]
- Hernández-Fernández, J.; Cano, H.; Aldas, M. Impact of Traces of Hydrogen Sulfide on the Efficiency of Ziegler–Natta Catalyst on the Final Properties of Polypropylene. Polymers 2022, 14, 3910. [Google Scholar] [CrossRef] [PubMed]
- Nucleating and Clarifying Agents for Polyolefins—Hoffmann—2001—Macromolecular Symposia—Wiley Online Library. Available online: https://onlinelibrary.wiley.com/doi/10.1002/1521-3900(200112)176:1%3C83::AID-MASY83%3E3.0.CO;2-N (accessed on 17 November 2023).
- Gahleitner, M.; Grein, C.; Kheirandish, S.; Wolfschwenger, J. Nucleation of polypropylene homo- and copolymers. Int. Polym. Process. 2011, 26, 2–20. [Google Scholar] [CrossRef]
- Menyhárd, A.; Bredács, M.; Simon, G.; Horváth, Z. Determination of nucleus density in semicrystalline polymers from nonisothermal crystallization curves. Macromolecules 2015, 48, 2561–2569. [Google Scholar] [CrossRef]
- Zhuravlev, E.; Wurm, A.; Pötschke, P.; Androsch, R.; Schmelzer, J.W.P.; Schick, C. Kinetics of nucleation and crystallization of poly(ε-caprolactone)—Multiwalled carbon nanotube composites. Eur. Polym. J. 2014, 52, 1–11. [Google Scholar] [CrossRef]
- Schawe, J.E.K.; Budde, F.; Alig, I. Non-isothermal crystallization of polypropylene with sorbitol-type nucleating agents at cooling rates used in processing. Polym. Int. 2019, 68, 240–247. [Google Scholar] [CrossRef]
- Fillon, B.; Lotz, B.; Thierry, A.; Wittmann, J.C. Self-nucleation and enhanced nucleation of polymers. Definition of a convenient calorimetric ‘efficiency scale’ and evaluation of nucleating additives in isotactic polypropylene (α phase). J. Polym. Sci. B Polym. Phys. 1993, 31, 1395–1405. [Google Scholar] [CrossRef]
- Smith, T.L.; Masilamani, D.; Bui, L.K.; Khanna, Y.P.; Bray, R.G.; Hammond, W.B.; Binder-Castelli, S. The Mechanism of Action of Sugar Acetals as Nucleating Agents for Polypropylene. Macromolecules 1994, 27, 3147–3155. [Google Scholar] [CrossRef]
- Nagarajan, K.; Myerson, A.S. Molecular Dynamics of Nucleation and Crystallization of Polymers. Cryst. Growth Des. 2001, 1, 131–142. [Google Scholar] [CrossRef]
- Marco, C.; Ellis, G.; Gómez, M.A.; Arribas, J.M. Comparative study of the nucleation activity of third-generation sorbitol-based nucleating agents for isotactic polypropylene. J. Appl. Polym. Sci. 2002, 84, 2440–2450. [Google Scholar] [CrossRef]
- Kristiansen, M.; Werner, M.; Tervoort, T.; Smith, P.; Blomenhofer, M.; Schmidt, H.W. The Binary System Isotactic Polypropylene/Bis(3,4-dimethylbenzylidene)sorbitol: Phase Behavior, Nucleation, and Optical Properties. Macromolecules 2003, 36, 5150–5156. [Google Scholar] [CrossRef]
- Marco, C.; Ellis, G.; Gómez, M.A.; Arribas, J.M. Analysis of the isothermal crystallization of isotactic polypropylene nucleated with sorbitol derivatives. J. Appl. Polym. Sci. 2003, 88, 2261–2274. [Google Scholar] [CrossRef]
- Microstructural Characterization of Plasticized Starch-Based Films—García—2000—Starch—Stärke—Wiley Online Library. Available online: https://onlinelibrary.wiley.com/doi/abs/10.1002/1521-379X%28200006%2952%3A4%3C118%3A%3AAID-STAR118%3E3.0.CO%3B2-0 (accessed on 17 November 2023).
- Tian, H.; Liu, D.; Yao, Y.; Ma, S.; Zhang, X.; Xiang, A. Effect of Sorbitol Plasticizer on the Structure and Properties of Melt Processed Polyvinyl Alcohol Films. J. Food Sci. 2017, 82, 2926–2932. [Google Scholar] [CrossRef] [PubMed]
- Wang, J.; Dou, Q.; Wu, S.; Chen, X. Influence of the amount of salts of rosin acid on the nonisothermal crystallization, morphology, and properties of isotactic polypropylene. Polym. Eng. Sci. 2007, 47, 889–897. [Google Scholar] [CrossRef]
- Huo, H.; Jiang, S.; An, L.; Feng, J. Influence of Shear on Crystallization Behavior of the β Phase in Isotactic Polypropylene with β-Nucleating Agent. Macromolecules 2004, 37, 2478–2483. [Google Scholar] [CrossRef]
- Ullmann’s Polymers and Plastics: Products and Processes. Available online: https://books.google.com/books/about/Ullmann_s_Polymers_and_Plastics_4_Volume.html?hl=es&id=MuLNwQEACAAJ (accessed on 17 November 2023).
- Tsochatzis, E.D.; Theodoridis, G.; Gika, H.G. Development and validation of a uhplc-qtof ms method for the determination of sorbitol-based nuclear clarifying agents in food simulants after migration from food contact materials. Appl. Sci. 2021, 11, 3789. [Google Scholar] [CrossRef]
- Lenhart, A.; Chey, W.D. A Systematic Review of the Effects of Polyols on Gastrointestinal Health and Irritable Bowel Syndrome. Adv. Nutr. 2017, 8, 587–596. [Google Scholar] [CrossRef]
- Sternbauer, L.; Dieplinger, J.; Buchberger, W.; Marosits, E. Determination of nucleating agents in plastic materials by GC/MS after microwave-assisted extraction with in situ microwave-assisted derivatization. Talanta 2014, 128, 63–68. [Google Scholar] [CrossRef]
- McDonald, J.G.; Cummins, C.L.; Barkley, R.M.; Thompson, B.M.; Lincoln, H.A. Identification and quantitation of sorbitol-based nuclear clarifying agents extracted from common laboratory and consumer plasticware made of polypropylene. Anal. Chem. 2008, 80, 5532–5541. [Google Scholar] [CrossRef]
- Grembecka, M.; Lebiedzińska, A.; Szefer, P. Simultaneous separation and determination of erythritol, xylitol, sorbitol, mannitol, maltitol, fructose, glucose, sucrose and maltose in food products by high performance liquid chromatography coupled to charged aerosol detector. Microchem. J. 2014, 117, 77–82. [Google Scholar] [CrossRef]
- Tsochatzis, E.D.; Lopes, J.A.; Kappenstein, O.; Tietz, T.; Hoekstra, E.J. Quantification of PET cyclic and linear oligomers in teabags by a validated LC-MS method—In silico toxicity assessment and consumer’s exposure. Food Chem. 2020, 317, 2020. [Google Scholar] [CrossRef] [PubMed]
- Nerin, C.; Alfaro, P.; Aznar, M.; Domeño, C. The challenge of identifying non-intentionally added substances from food packaging materials: A review. Anal. Chim. Acta 2013, 775, 14–24. [Google Scholar] [CrossRef]
- Pitsch, J.; Weghuber, J. Hydrophilic Interaction Chromatography Coupled with Charged Aerosol Detection for Simultaneous Quantitation of Carbohydrates, Polyols and Ions in Food and Beverages. Molecules 2019, 24, 4333. [Google Scholar] [CrossRef] [PubMed]
- Köster, D.; Wolbert, J.B.; Schulte, M.S.; Jochmann, M.A.; Schmidt, T.C. Origin of Xylitol in Chewing Gum: A Compound-Specific Isotope Technique for the Differentiation of Corn- and Wood-Based Xylitol by LC-IRMS. J. Agric. Food Chem. 2018, 66, 2015–2020. [Google Scholar] [CrossRef] [PubMed]
- Hadjikinova, R.; Petkova, N.; Hadjikinov, D.; Denev, P.; Hrusavov, D. Development and Validation of HPLC-RID method for Determination of Sugars and Polyols. J. Pharm. Sci. Res. 2017, 9, 1263. [Google Scholar]
- Molnár-Perl, I. Simultaneous quantitation of acids and sugars by chromatography: Gas or high-performance liquid chromatography? J. Chromatogr. A 1999, 845, 181–195. [Google Scholar] [CrossRef]
- Medeiros, P.M.; Simoneit, B.R.T. Analysis of sugars in environmental samples by gas chromatography–mass spectrometry. J. Chromatogr. A 2007, 1141, 271–278. [Google Scholar] [CrossRef]
- De Castro, E.D.S.G.; Cassella, R.J. Direct determination of sorbitol and sodium glutamate by attenuated total reflectance Fourier transform infrared spectroscopy (ATR-FTIR) in the thermostabilizer employed in the production of yellow-fever vaccine. Talanta 2016, 152, 33–38. [Google Scholar] [CrossRef]
- Cassella, A.R.; Cassella, R.J.; Garrigues, S.; Santelli, R.E.; De Campos, R.C.; De la Guardia, M. Flow injection-FTIR determination of dithiocarbamatepesticides. Analyst 2000, 125, 1829–1833. [Google Scholar] [CrossRef]
- Armenta, S.; Quintás, G.; Moros, J.; Garrigues, S.; De La Guardia, M. Fourier transform infrared spectrometric strategies for the determination of Buprofezin in pesticide formulations. Anal. Chim. Acta 2002, 468, 81–90. [Google Scholar] [CrossRef]
- Quintás, G.; Armenta, S.; Morales-Noé, A.; Garrigues, S.; De La Guardia, M. Simultaneous determination of Folpet and Metalaxyl in pesticide formulations by flow injection Fourier transform infrared spectrometry. Anal. Chim. Acta 2003, 480, 11–21. [Google Scholar] [CrossRef]
- Khanmohammadi, M.; Armenta, S.; Garrigues, S.; de la Guardia, M. Mid- and near-infrared determination of metribuzin in agrochemicals. Vib. Spectrosc. 2008, 46, 82–88. [Google Scholar] [CrossRef]
- Moros, J.; Armenta, S.; Garrigues, S.; de la Guardia, M. Quality control of Metamitron in agrochemicals using Fourier transform infrared spectroscopy in the middle and near range. Anal. Chim. Acta 2006, 565, 255–260. [Google Scholar] [CrossRef]
- Garrigues, J.M.; Akssira, M.; Rambla, F.J.; Garrigues, S.; De La Guardia, M. Direct ATR-FTIR determination of sucrose in beet root. Talanta 2000, 51, 247–255. [Google Scholar] [CrossRef]
- Ruíz, A.; Cañada, M.J.A.; Lendl, B. A rapid method for peroxide value determination in edible oils based on flow analysis with Fourier transform infrared spectroscopic detection. Analyst 2001, 126, 242–246. [Google Scholar] [CrossRef]
- Ohnsmann, J.; Quintás, G.; Garrigues, S.; De la Guardia, M. Determination of caffeine in tea samples by Fourier transform infrared spectrometry. Anal. Bioanal. Chem. 2002, 374, 561–565. [Google Scholar] [CrossRef] [PubMed]
- Otte, X.; Eurard, B.; Oelattre, L.; Thunus, L. Development and validation of a new Fourier transform infrared spectrometric method for the quantification of urea in creams and ointments. Anal. Chim. Acta 2002, 451, 323–328. [Google Scholar] [CrossRef]
- Salvador, A.; Peña, M.C.; De la Guardia, M. Stopped-flow Fourier-transform infra-red spectrometric speciation of glycolic and lactic acids in cosmetic formulations. Analyst 2001, 126, 1428–1431. [Google Scholar] [CrossRef]
- Robaina, N.F.; de Paula, C.E.R.; Brum, D.M.; de la Guardia, M.; Garrigues, S.; Cassella, R.J. Novel approach for the determination of azithromycin in pharmaceutical formulations by Fourier transform infrared spectroscopy in film-through transmission mode. Microchem. J. 2013, 110, 301–307. [Google Scholar] [CrossRef]
- Garrigues, S.; Gallignani, M.; de la Guardia, M. FIA—FT—IR determination of ibuprofen in pharmaceuticals. Talanta 1993, 40, 89–93. [Google Scholar] [CrossRef] [PubMed]
- Sánchez-Dasi, M.J.; Garrigues, S.; Cervera, M.L.; De La Guardia, M. On-line solvent recycling: A tool for the development of clean analytical chemistry in flow injection Fourier transform infrared spectrometry. Determination of ketoprofen. Anal. Chim. Acta 1998, 361, 253–260. [Google Scholar] [CrossRef]
- Bouhsain, Z.; Garrigues, S.; De La Guardia, M. Flow injection–Fourier transform infrared spectrometric determination of paracetamol in pharmaceuticals. Analyst 1996, 121, 635–639. [Google Scholar] [CrossRef]
- Moros, J.; Garrigues, S.; de la Guardia, M. Quality control Fourier transform infrared determination of diazepam in pharmaceuticals. J. Pharm. Biomed. Anal. 2007, 43, 1277–1282. [Google Scholar] [CrossRef] [PubMed]
- Griffiths, P.R.; De Haseth, J.A. Oicentennial. In Fourier Transform Infrared Spectrometry, 2nd ed.; John Wiley & Sons, Inc.: Hoboken, NJ, USA, 2007. [Google Scholar]
- Cheng, J.H.; Sun, D.W. Rapid and non-invasive detection of fish microbial spoilage by visible and near infrared hyperspectral imaging and multivariate analysis. LWT—Food Sci. Technol. 2015, 62, 1060–1068. [Google Scholar] [CrossRef]
- Vasconcelos, H.; Saraiva, C.; de Almeida, J.M.M.M. Evaluation of the Spoilage of Raw Chicken Breast Fillets Using Fourier Transform Infrared Spectroscopy in Tandem with Chemometrics. Food Bioproc. Tech. 2014, 7, 2330–2341. [Google Scholar] [CrossRef]
- Moreira, M.J.P.; Silva, A.C.; de Almeida, J.M.M.M.; Saraiva, C. Characterization of deterioration of fallow deer and goat meat using microbial and mid infrared spectroscopy in tandem with chemometrics. Food Packag. Shelf Life 2018, 15, 169–180. [Google Scholar] [CrossRef]
- Lohumi, S.; Lee, S.; Lee, H.; Cho, B.K. A review of vibrational spectroscopic techniques for the detection of food authenticity and adulteration. Trends Food Sci. Technol. 2015, 46, 85–98. [Google Scholar] [CrossRef]
- Kamruzzaman, M.; Makino, Y.; Oshita, S. Non-invasive analytical technology for the detection of contamination, adulteration, and authenticity of meat, poultry, and fish: A review. Anal. Chim. Acta 2015, 853, 19–29. [Google Scholar] [CrossRef]
- Kim, D.; Hwang, J. Preparation and Characterization of Sodium Caseinate-Coated Papers Based on Glycerol and Sorbitol Contents for Packaging Application. Foods 2023, 12, 940. [Google Scholar] [CrossRef]
- Paudel, S.; Regmi, S.; Janaswamy, S. Effect of glycerol and sorbitol on cellulose-based biodegradable films. Food Packag. Shelf Life 2023, 37, 101090. [Google Scholar] [CrossRef]
- Yoplac, I.; Hidalgo, A.; Vargas, L. Characterization, microstructure, and spectroscopic study of optimized sodium caseinate-sorbitol active biofilms with citral microencapsulate. Polym. Bull. 2022, 80, 5447–5468. [Google Scholar] [CrossRef]
- Pandey, V.K.; Srivastava, S.; Dash, K.K.; Singh, R.; Mukarram, S.A.; Kovács, B.; Harsányi, E. Machine Learning Algorithms and Fundamentals as Emerging Safety Tools in Preservation of Fruits and Vegetables: A Review. Processes 2023, 11, 1720. [Google Scholar] [CrossRef]
- Hernández-Fernández, J.; Guerra, Y.; Espinosa, E. Development and Application of a Principal Component Analysis Model to Quantify the Green Ethylene Content in Virgin Impact Copolymer Resins During Their Synthesis on an Industrial Scale. J. Polym. Environ. 1234, 30, 4800–4808. [Google Scholar] [CrossRef]
- Morita, S. Chemometrics and related fields in python. Anal. Sci. 2020, 36, 107–112. [Google Scholar] [CrossRef] [PubMed]
- Cited, L.; Bates, H.; Hiittenrauch, J.; Pitter, R. Smoothing and Differentiation of Data by Simplified Least Squares Procedures. Am. Pharm. Assoc. Sci. Ed. 1951, 40, 1832. [Google Scholar]
- Candolfi, A.; De Maesschalck, R.; Jouan-Rimbaud, D.; Hailey, P.A.; Massart, D.L. The influence of data pre-processing in the pattern recognition of excipients near-infrared spectra. J. Pharm. Biomed. Anal. 1999, 21, 115–132. [Google Scholar] [CrossRef] [PubMed]
- Kumar, N.; Panchariya, P.C.; Patel, S.S.; Kiranmayee, A.H.; Ranjan, R. Application of Various Pre-Processing Techniques on Infrared (IR) Spectroscopy Data for Classification of Different Ghee Samples. In Proceedings of the 2018 Fourth International Conference on Computing Communication Control and Automation (ICCUBEA), Pune, India, 16–18 August 2018. [Google Scholar] [CrossRef]
- Quinquenet, S.; Ollivon, M.; Grabielle-Madelmont, C.; Serpelloni, M. Polimorphism of hydrated sorbitol. Thermochim. Acta 1988, 125, 125–140. [Google Scholar] [CrossRef]
- Larkin, P.J. Infrared and Raman Spectroscopy: Principles and Spectral Interpretation; Elsevier: Amsterdam, The Netherlands, 2017. [Google Scholar]
- Lu, H.S.; Xu, H.R.; Ying, Y.B.; Fu, X.P.; Yu, H.Y.; Tian, H.Q. Application Fourier transform near infrared spectrometer in rapid estimation of soluble solids content of intact citrus fruits. J. Zhejiang Univ. Sci. B 2006, 7, 794–799. [Google Scholar] [CrossRef]
- Kharbach, M.; Mansouri, M.A.; Taabouz, M.; Yu, H. Current Application of Advancing Spectroscopy Techniques in Food Analysis: Data Handling with Chemometric Approaches. Foods 2023, 12, 2753. [Google Scholar] [CrossRef]
- Rijavec, T.; Ribar, D.; Markelj, J.; Strlič, M.; Cigić, I.K. Machine learning-assisted non-destructive plasticizer identification and quantification in historical PVC objects based on IR spectroscopy. Sci. Rep. 2022, 12, 1–11. [Google Scholar] [CrossRef] [PubMed]
- Siegler, B.C. Food Engineering. Available online: https://www.researchgate.net/publication/281732691_Potential_uses_of_fourier_transform_infrared_spectroscopy_FTIR_in_food_processing_and_engineering (accessed on 17 November 2023).
- Pandiselvam, R.; Prithviraj, V.; Manikantan, M.R.; Kothakota, A.; Rusu, A.V.; Trif, M.; Mousavi Khaneghah, A. Recent advancements in NIR spectroscopy for assessing the quality and safety of horticultural products: A comprehensive review. Front. Nutr. 2022, 9, 973457. [Google Scholar] [CrossRef]
- Neo, E.R.K.; Yeo, Z.; Low, J.S.C.; Goodship, V.; Debattista, K. A review on chemometric techniques with infrared, Raman and laser-induced breakdown spectroscopy for sorting plastic waste in the recycling industry. Resour. Conserv. Recycl. 2022, 180, 106217. [Google Scholar] [CrossRef]
- Rodriguez-Saona, L.E.; Allendorf, M.E. Use of FTIR for rapid authentication and detection of adulteration of food. Annu. Rev. Food Sci. Technol. 2011, 2, 467–483. [Google Scholar] [CrossRef] [PubMed]
- Barczewski, M.; Dobrzyńska-Mizera, M.; Dudziec, B.; Sterzyński, T. Influence of a sorbitol-based nucleating agent modified with silsesquioxanes on the non-isothermal crystallization of isotactic polypropylene. J. Appl. Polym. Sci. 2014, 131. [Google Scholar] [CrossRef]
- Dobrzyńska-Mizera, M.; Dutkiewicz, M.; Sterzyński, T.; Di Lorenzo, M.L. Polypropylene-based composites containing sorbitol-based nucleating agent and siloxane-silsesquioxane resin. J. Appl. Polym. Sci. 2016, 133. [Google Scholar] [CrossRef]
- Katsuno, S.; Yoshinaga, M.; Kitade, S.; Sanada, Y.; Akiba, I.; Sakurai, K.; Masunaga, H. Crystallization kinetics of polypropylene containing a sorbitol nucleating agent. Polymer 2012, 45, 87–93. [Google Scholar] [CrossRef]
- Nagarajan, K.; Levon, K.; Myerson, A.S. Nucleating agents in polypropylene. J. Therm. Anal. Calorim. 2000, 59, 497–508. [Google Scholar] [CrossRef]
- Lopes, J.A.; Tsochatzis, E.D.; Robouch, P.; Hoekstra, E. Influence of pre-heating of food contact polypropylene cups on its physical structure and on the migration of additives. Food Packag. Shelf Life 2019, 20, 100305. [Google Scholar] [CrossRef]


| Method | Hyperparameters | Values |
|---|---|---|
| NN | Neurons | [3; 5; 10; 15; 25; 50] |
| Hidden Layers | [1; 2; 4; 10] | |
| Solver | [lbfgs; adam] | |
| SVR | C | [4; …; 5.5] |
| Γ | [0; 0.07; …; 1] × 10−2 |
| Algorithm | Calibration | Prediction | ||
|---|---|---|---|---|
| R2 | RMSE | R2 | RMSE | |
| PCR | 0.8695 | 407.80 | 0.8983 | 403.64 |
| NN | 0.9998 | 14.63 | 0.9998 | 16.40 |
| SVR | 0.9999 | 0.100 | 0.9999 | 0.100 |
Disclaimer/Publisher’s Note: The statements, opinions and data contained in all publications are solely those of the individual author(s) and contributor(s) and not of MDPI and/or the editor(s). MDPI and/or the editor(s) disclaim responsibility for any injury to people or property resulting from any ideas, methods, instructions or products referred to in the content. |
© 2024 by the authors. Licensee MDPI, Basel, Switzerland. This article is an open access article distributed under the terms and conditions of the Creative Commons Attribution (CC BY) license (https://creativecommons.org/licenses/by/4.0/).
Share and Cite
Hernández-Fernández, J.; Martinez-Trespalacios, J.; Marquez, E. Development of a Measurement System Using Infrared Spectroscopy-Attenuated Total Reflectance, Principal Component Analysis and Artificial Intelligence for the Safe Quantification of the Nucleating Agent Sorbitol in Food Packaging. Foods 2024, 13, 1200. https://doi.org/10.3390/foods13081200
Hernández-Fernández J, Martinez-Trespalacios J, Marquez E. Development of a Measurement System Using Infrared Spectroscopy-Attenuated Total Reflectance, Principal Component Analysis and Artificial Intelligence for the Safe Quantification of the Nucleating Agent Sorbitol in Food Packaging. Foods. 2024; 13(8):1200. https://doi.org/10.3390/foods13081200
Chicago/Turabian StyleHernández-Fernández, Joaquín, Jose Martinez-Trespalacios, and Edgar Marquez. 2024. "Development of a Measurement System Using Infrared Spectroscopy-Attenuated Total Reflectance, Principal Component Analysis and Artificial Intelligence for the Safe Quantification of the Nucleating Agent Sorbitol in Food Packaging" Foods 13, no. 8: 1200. https://doi.org/10.3390/foods13081200
APA StyleHernández-Fernández, J., Martinez-Trespalacios, J., & Marquez, E. (2024). Development of a Measurement System Using Infrared Spectroscopy-Attenuated Total Reflectance, Principal Component Analysis and Artificial Intelligence for the Safe Quantification of the Nucleating Agent Sorbitol in Food Packaging. Foods, 13(8), 1200. https://doi.org/10.3390/foods13081200