Article

Vis/NIR Spectroscopy and Vis/NIR Hyperspectral Imaging for Non-Destructive Monitoring of Apricot Fruit Internal Quality with Machine Learning

1
CREA—Research Centre for Food and Nutrition, Via Ardeatina 546, 00178 Rome, Italy
2
CREA—Research Centre for Olive, Fruit and Citrus Crops, Via di Fioranello 52, 00134 Rome, Italy
*
Authors to whom correspondence should be addressed.
Foods 2025, 14(2), 196; https://doi.org/10.3390/foods14020196
Submission received: 20 November 2024 / Revised: 20 December 2024 / Accepted: 6 January 2025 / Published: 10 January 2025

Abstract

:
The fruit supply chain requires simple, non-destructive, and fast tools for quality evaluation both in the field and during the post-harvest phase. In this study, a portable visible and near-infrared (Vis/NIR) spectrophotometer and a portable Vis/NIR hyperspectral imaging (HSI) device were tested to highlight genetic differences among apricot cultivars, and to develop multi-cultivar and multi-year models for the most important marketable attributes (total soluble solids, TSS; titratable acidity, TA; dry matter, DM). To do this, the fruits of seventeen cultivars from a single experimental orchard harvested at the commercial maturity stage were considered. Spectral data emphasized genetic similarities and differences among the cultivars, capturing changes in the pigment content and macro components of the apricot samples. In recent years, machine learning techniques, such as artificial neural networks (ANNs), have been successfully applied to more efficiently extract valuable information from spectral data and to accurately predict quality traits. In this study, prediction models were developed based on a multilayer perceptron artificial neural network (ANN-MLP) combined with the Levenberg–Marquardt learning algorithm. Regarding the Vis/NIR spectrophotometer dataset, good predictive performances were achieved for TSS (R2 = 0.855) and DM (R2 = 0.857), while the performance for TA was unsatisfactory (R2 = 0.681). In contrast, the optimal predictive ability was found for models of the HSI dataset (TSS: R2 = 0.904; DM: R2 = 0.918, TA: R2 = 0.811), as confirmed by external validation. Moreover, the ANN allowed us to identify the most predictive input spectral regions for each model. The results showed the potential of Vis/NIR spectroscopy as an alternative to traditional destructive methods to monitor the qualitative traits of apricot fruits, reducing the time and costs of analyses.

1. Introduction

Apricot (Prunus armeniaca L.) is one of the most widely cultivated fruit trees. According to the FAOSTAT data platform, the global cultivated area was more than 579 thousand ha and the whole production was 3.9 million tonnes in 2022, reflecting their economic and nutritional importance [1]. Italy is the world’s fourth-largest producer with an annual production of 230 thousand tonnes (5.9% of the global production), following Turkey (20.4%), Uzbekistan (11.5%), and Iran (7.8%).
Apricots are widely praised by consumers due to their organoleptic and nutritional characteristics, especially for their sweetness and juiciness [2,3]. The fruits can be intended for fresh consumption or for the processing industry for use in cakes, jams, juices, ice cream, candies, and jellies. Fruit quality at purchasing is evaluated by consumers through visual inspection methods and focuses on external parameters such as color, size, shape, and the absence of defects. However, internal quality, such as total soluble solids (TSS) content, titratable acidity (TA), and dry matter (DM), is important for both fresh consumption and industrial processing applications. The traditional methods used to assess these attributes are destructive and time-consuming, often leading to increased costs and product wastage. Therefore, in recent years, there was an increasing trend towards the development of non-destructive systems based on digital sensors and spectroscopic techniques, which exploit the interactions between electromagnetic radiation and matter. These instruments can be used by growers and producers to detect fruit internal quality traits, including for apricots [4,5,6,7,8]. Among all tools on the market, portable visible and near-infrared (Vis/NIR) spectrophotometers guarantee numerous advantages to the end-users: a quick and easy quality inspection; high repeatability; no damage to the fruit surface; a cost-effective and pollution-free approach; and the simple use of software for processing spectral data [9]. The hyperspectral imaging (HSI) technique is often used in food quality monitoring [10]. With respect to IR spectroscopy, HSI links to computer vision technology and spectroscopy, obtaining a so-called hyperspectral cube, in which two dimensions represent the spatial distribution of the sample and the third its spectral content [11]. In this way, a hyperspectral image can describe the physical features and chemical constituents of a sample [11,12,13]. However, the use of these devices requires the calibration and validation of predictive models through sophisticated data analysis techniques. The selection of an optimal data modeling method for predicting quality parameters is a fundamental step toward accurate monitoring based on Vis/NIR spectroscopy. Partial least-squares regression (PLS) is a method widely used when models are built using highly correlated spectral data. PLS models consider linear relationships among spectral data and quality traits. This could affect the models’ performance dealing with nonlinear relationships. In recent years, models involving artificial intelligence techniques, such as artificial neural networks (ANNs), are increasingly being used to predict fruit quality parameters due to the ability to model complex, often nonlinear and prior unknown relationships between input and output variables [11,14,15,16,17,18]. Usual regression methods require core information of the corresponding chemical system and knowledge of the presence of functional groups. Moreover, the ANN technique has no limitations on input variables and requires no knowledge on the relationship among the input variables. The ANN can also be used for unstable, noisy, imprecise, and incomplete data [17]. Finally, to build robust models that can be applied in apricot fruit monitoring and during the post-harvest stage, it is necessary to consider the quality characteristics of a large number of apricot cultivars and to use different years as input data.
Our study aimed to evaluate the performances of a portable visible and near-infrared (Vis/NIR, 310–1100 nm) spectrophotometer and a portable Vis/NIR hyperspectral imaging device (HSI, 400–1000 nm) in the prediction of the main apricot quality traits. Specifically, the objectives of this study were (i) to highlight similarities and differences among seventeen apricot cultivars from a single experimental orchard; (ii) to develop calibration multi-cultivar and multi-year models from Vis-NIR spectral data using ANN algorithms to estimate key internal quality attributes (total soluble solids content, TSS; titratable acidity, TA; and dry matter, DM); (iii) to evaluate the prediction accuracy and the generalizability of the developed models using external datasets; and (iv) to identify the most predictive input spectral bands for each model. To the best of our knowledge, no studies with such a large dataset, based on fruit from 17 cultivars and two years, and with a comparison of the predictive ability of models (developed using the machine learning technique) from the two devices have been published for apricots.

2. Materials and Methods

2.1. Plant Material and Experimental Design

Seventeen apricot cultivars, named Aurora, Bella d’Imola, Bora, Bulida, Cafona I, Krupna Skopjanka, Marietta Milady, Muscat, Nella, Ninfa, NJA42, Portici, Precoce Toscana, Rubista, S. Castrense, Tardiva di Bordaneil, and Thyrinthos, widely grown in Italy, were considered in this study. Geographical origin, ripening time and parental lines of genotypes analyzed, according to the varietal lists are reported in Table 1 [[19,20]; https://plantgest.imagelinenetwork.com (accessed on 10 November 2024)]. The apricots came from the Italian National Fruit Germplasm Collection of CREA—Research Centre for Olive, Fruit and Citrus Crops of Rome, Italy (latitude: 41°47′16.4″ N, longitude: 12°34′11.3″ E, altitude: 86 m a.s.l.). For each cultivar and each year, thirty fruits were harvested from different plants at the commercial maturity stage, for two crop years (2023 and 2024). All plants had the same planting age. In order to obtain samples of homogeneous ripeness for each cultivar and between cultivars, the maturity level was assessed using a portable Vis instrument, namely, a DA-meter (TR Turoni, Forlì, Italy), as described by Amoriello et al. [7]. This instrument can help to determine the optimum harvest maturity, strongly related to a variety’s characteristics that affect fruit internal quality [21,22]. After each harvest, apricot samples were transported to the laboratory. Six fruits without mechanical damage or visible defects for each year and for each cultivar were randomly selected from the starting material. All samples were cleaned with MilliQ water (Millipore, Bedford, MA, USA), blotted with a paper towel, and prepared for the following analyses. Then, each apricot was individually subjected to non-destructive and destructive measurements.
A second dataset with measurements of four additional apricot cultivars (Biotipo A, Ottavianese, Pellecchiella, and Perla) was used to assess the performance of the developed models and validate them.

2.2. Spectral Data Acquisition with a Portable Vis/NIR Spectrophotometer

Spectra were collected twice on the two opposite sides of the apricot samples using a handheld Vis/NIR spectrophotometer (F-750 Produce Quality Meter, Felix Instruments, Camas, WA, USA) [23]. The spectral range of the instrument was between 310 and 1100 nm, and the data resolution was 3 nm. Spectral data were acquired and converted to second derivative form, through AppBuilter v2.2.6™ software (Felix Instrument, 1554 NE 3rd Ave Camas, WA 98607, USA). For each apricot, the average spectrum for each side was recorded by averaging 2 scans per side. Therefore, 408 spectra, related to the 408 apricot data (204 sample × 2 replicates) were collected (17 cultivars × 2 years × 6 samples × 2 replicates). The two replicates are defined as follows: one replicate (one side) is the average value of two scans and the second replicate (the opposite side) is the average value of two scans.

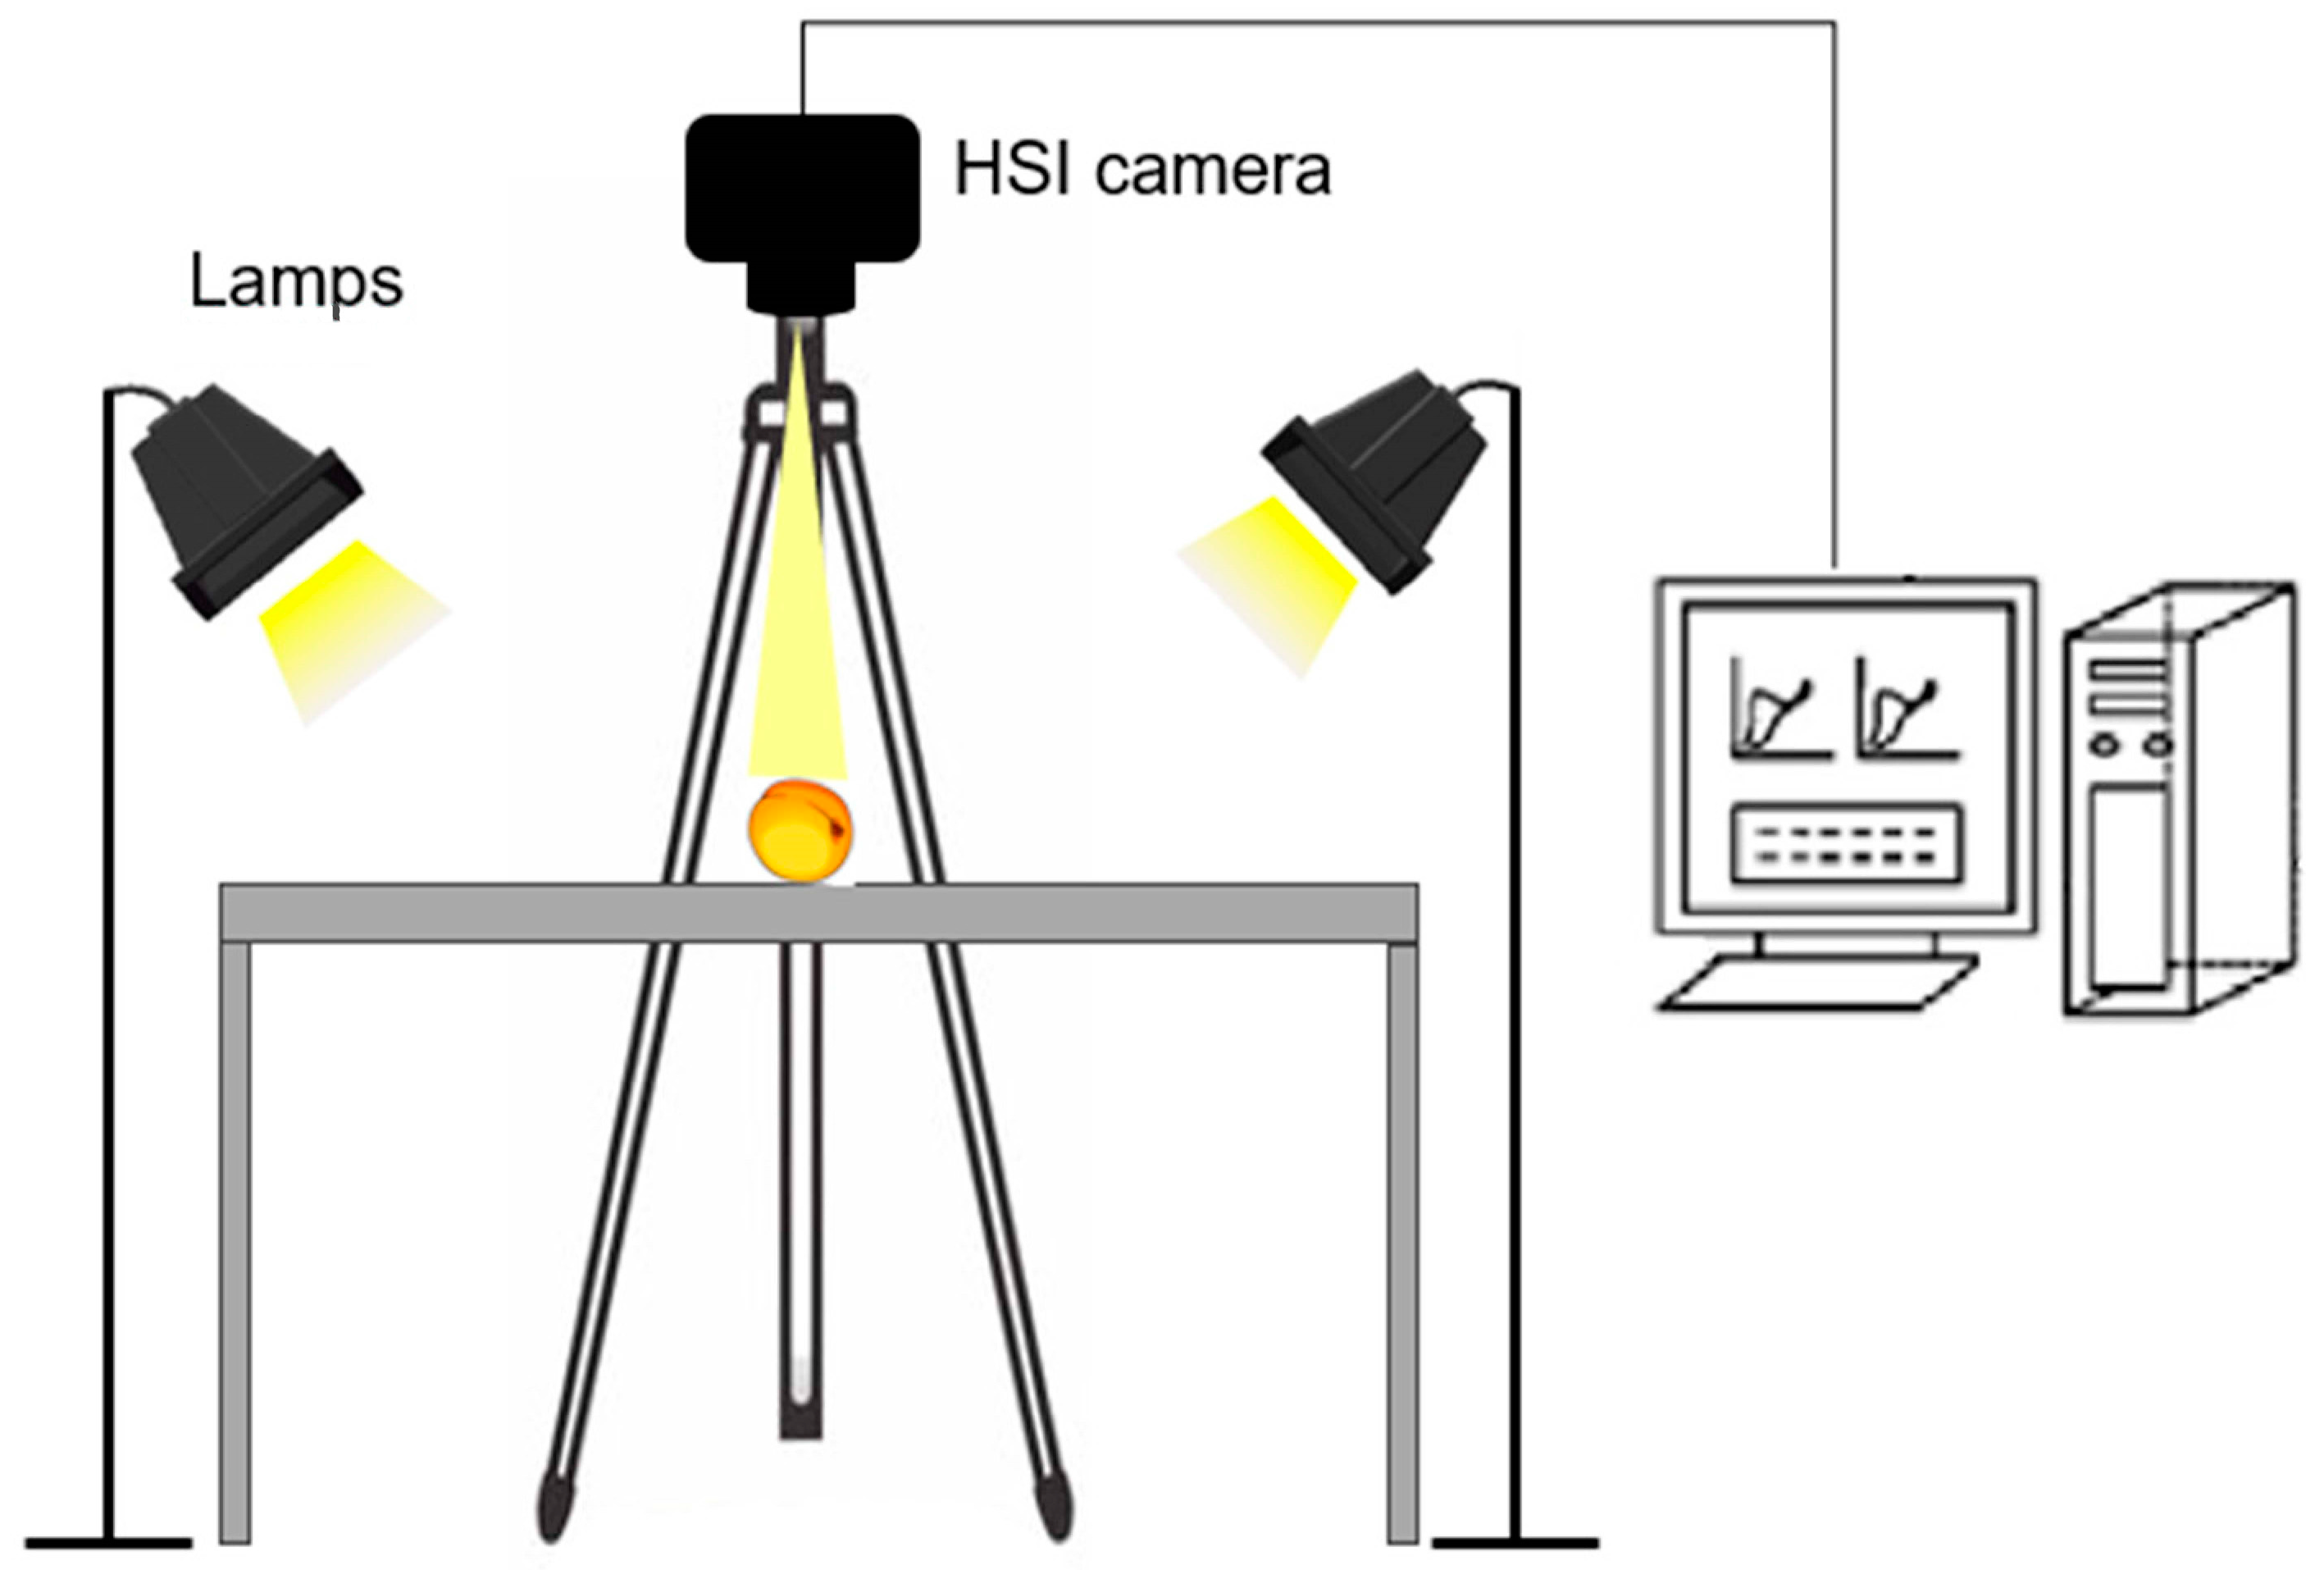
2.3. Spectral Data Acquisition with a Portable HSI Device

A portable Specim IQ hyperspectral camera with push-broom technology (Specim, Spectral Imaging Ltd., Oulu, Finland) was used to acquire hyperspectral images. The system (Figure 1) consisted of a spectrometer, a CMOS surface detector, a lens (Specimens FX10, Specim, Spectral Imaging Ltd., Oulu, Finland) with a detection range of 400–1000 nm and 224 wavelength points, and a computer with imaging acquisition software (Lumo-Scanner, Specim, Spectral Imaging Ltd., Oulu, Finland), as reported by Amoriello et al. [11]. The characteristics of the acquisition are as follows: a spatial resolution of 512 × 512 pixels, a spectral resolution of 7 nm resulting in 204 spectral bands across the wavelength range, and an integration time of 45.0 ms. A white diffuse reflectance target was used to achieve a white reference image to operate in simultaneous modality. The IQ studio software version 2019.05.29.2 (Specim, Spectral Imaging Ltd., Oulu, Finland) was used to gain the HSI images.
All HSI images were calibrated with white and dark reference images before processing, according to Amoriello et al. [11].
The images were processed using Evince software (version 2.7.12, Prediktera AB, Umeå, Sweden). A principal component analysis (PCA) algorithm was applied to portion out the images and to remove the background, as described by Amoriello et al. [24]. Then, the smoothing of the reflectance spectra was carried out with a baseline correction and the application of the first-order Savitzky–Golay filter for noise reduction. A standard normal variate (SNV) correction was used to reduce the light scattering. The mean spectrum was obtained as the average of the spectra related to all pixels of each sample, considering the overall HSI image.

2.4. Fruit Quality Traits

The skin color data were acquired on the external opposite sides of the fruit using a tristimulus colorimeter (Chroma Meter CR-200; Minolta, Milan, Italy) and expressed in the CIELab color space (L*, a*, b*) [25]. The sample dimensions (longitudinal diameter, lateral diameter, equatorial diameter), expressed in mm, were determined using a digital caliper (±0.05 mm accuracy). Fruit firmness (FF), expressed in Newton (N), was measured with a penetrometer (Fruit Pressure Tester FT011, TR snc, Forlì, Italy), using an 8 mm tip. The total soluble solids content (TSS), expressed in g 100 g−1 of FW, was determined with a digital refractometer (Refractometer 30PX, Mettler Toledo, Im Langacher, Greifensee Switzerland). Titratable acidity (TA), expressed in mEq L−1, was evaluated using an automatic titration system (785 DPM Titrino, Metrohm Ltd., Herisau, Switzerland). Dry matter (DM) was assessed by drying the fresh samples at 105 ± 1 °C until a constant weight was reached using an air-forced oven (Tecnocalor 2000, Tecnovetro srl, Monza, Italy), and the results were expressed as g 100 g−1 of fresh weight (FW). All determinations were performed in triplicate.

2.5. Chemometric Methods

2.5.1. Data Analysis

In order to evaluate differences in all measured properties among the cultivars, and to compare the means of the measured traits among cultivars and identify statistically significant differences, the Tukey test was performed at a significance level of 5% using SPSS statistical software (version 22, SPSS, Chicago, IL, USA).

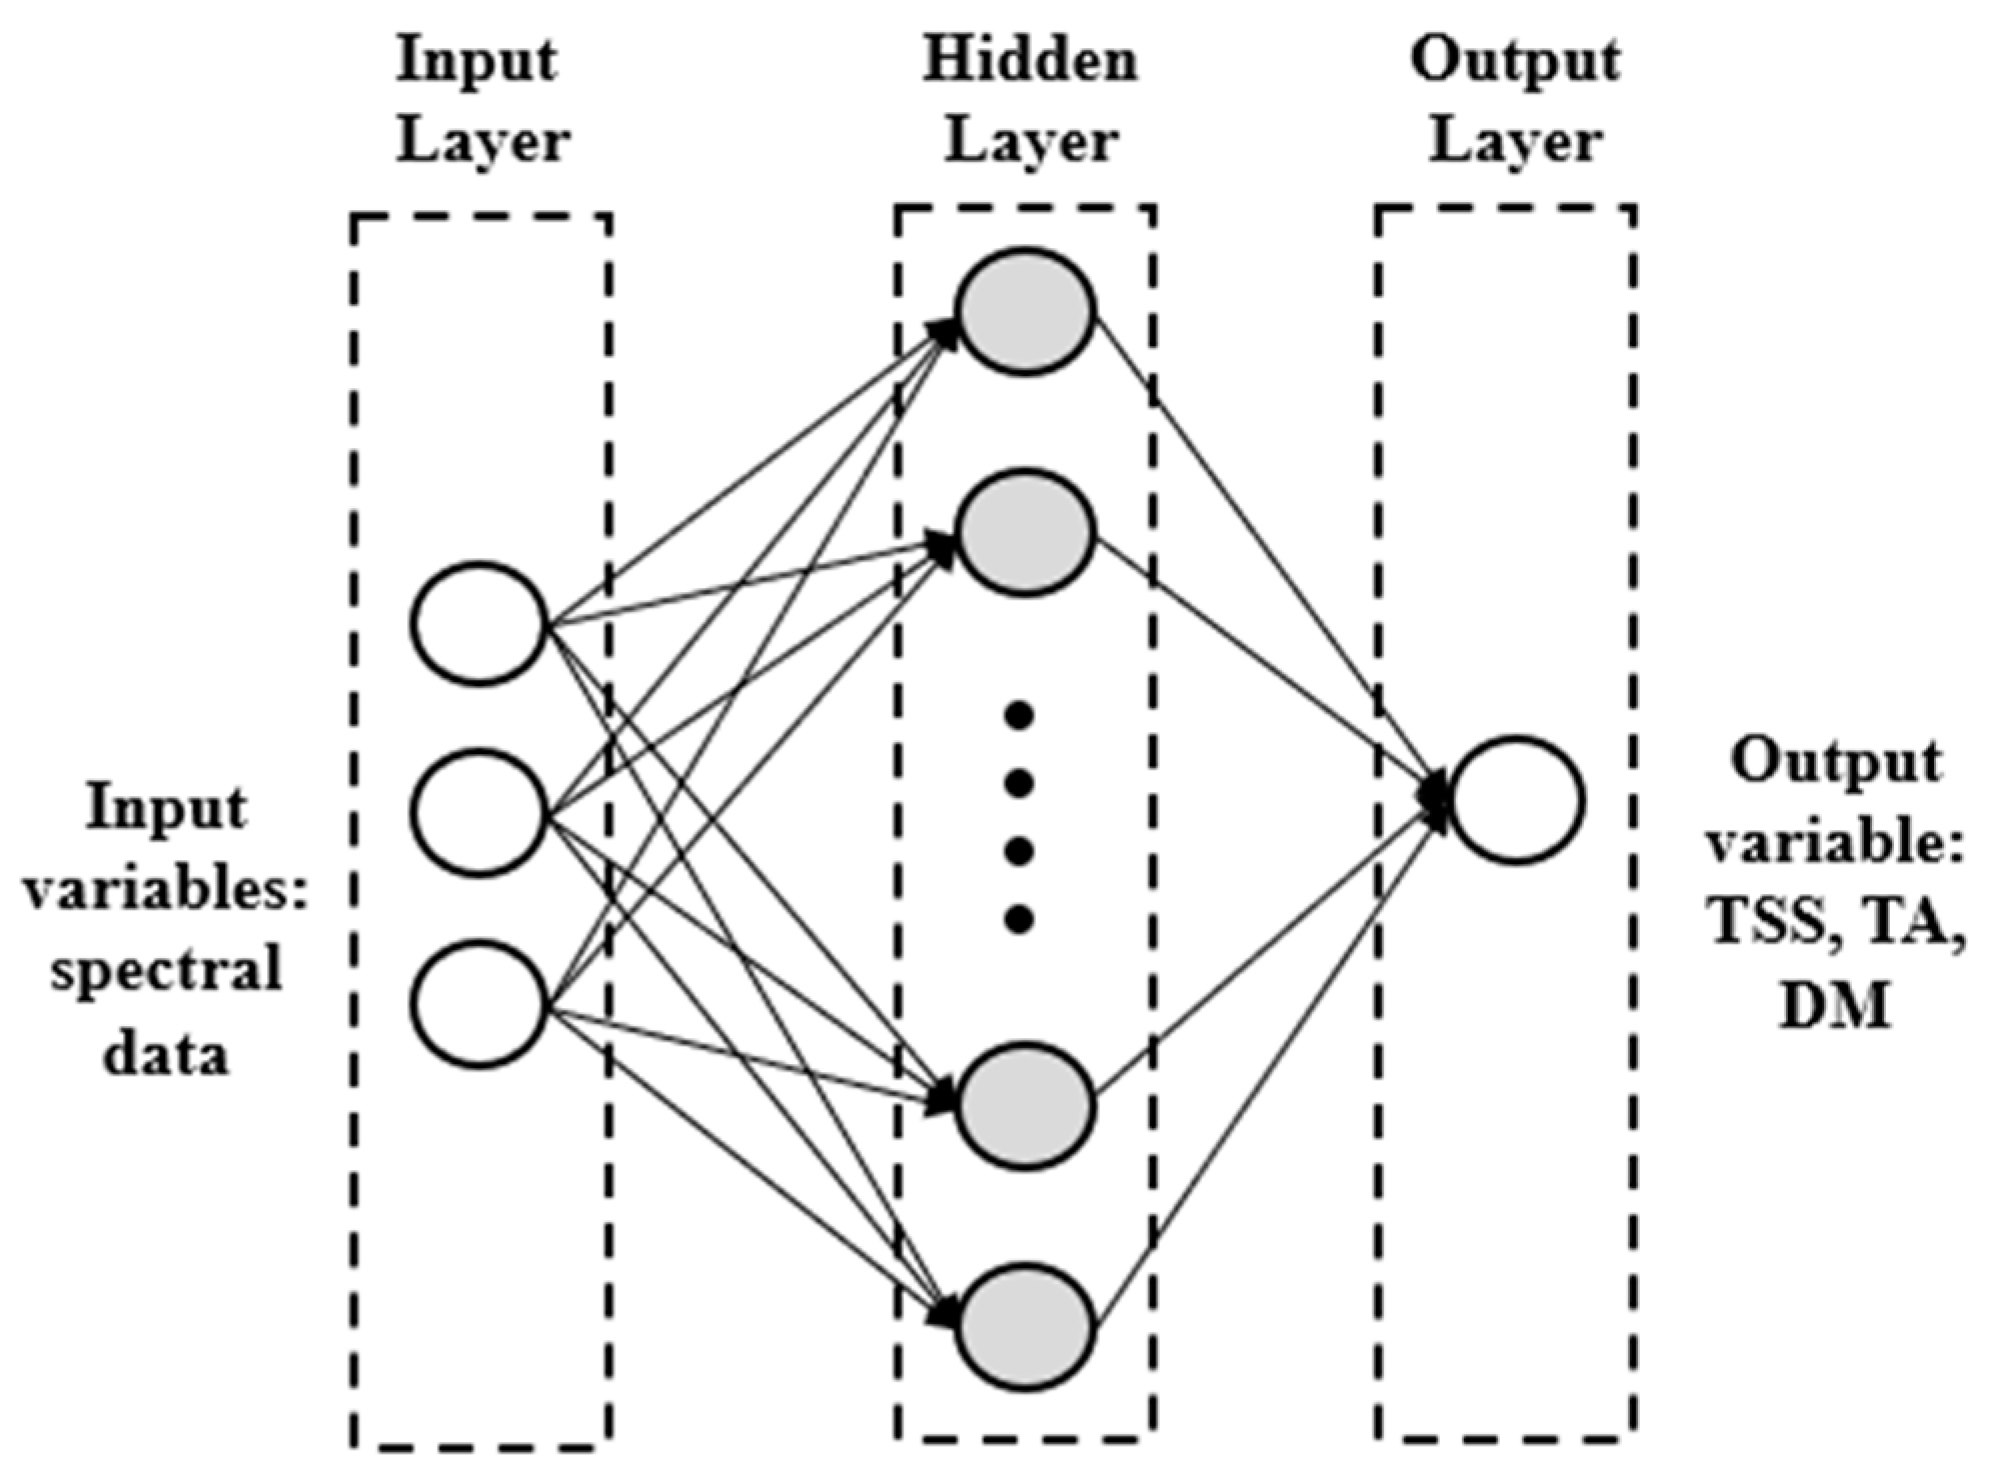
2.5.2. Artificial Neural Network Models

A multilayer perceptron artificial neural network (ANN-MLP) combined with the Levenberg–Marquardt learning algorithm was employed to build models for predictions of three quality traits (TSS, TA, and DM). The neural network includes three main layers: an input layer; an output layer, i.e., the three quality attributes; and a hidden layer, as shown in Figure 2. The input layer contained 260 spectral data for the Vis/NIR dataset (from 320 to 1100 nm each 3 nm) and 202 spectral data for the HSI dataset (from 398 to 1004 nm each 3 nm).
In this study, the identity function, logistic sigmoid function, hyperbolic tangent function, and exponential function, as described by Amoriello et al. [25], were the activation functions applied in the hidden or output layers. Different topologies with different neurons in the hidden layer (from 1 to 50) were tested, and the training process of the network was run 100,000 times with random initial values of weights and biases. The best topology for the three quality parameters (TSS, TA, DM) was evaluated using prediction performance metrics: the coefficient of correlation between the observed and predicted values (r), the coefficient of determination (R2), the mean absolute error (MAE), and the root mean squared error (RMSE), as reported by Amoriello et al. [25].
The entirety of the two datasets, with data from all cultivars over the two years, was randomly split into three sub-datasets: 70% of the data (training set) for training, 15% (validation set) for validation, and the remaining 15% (test set) for testing of the models. Therefore, we used 288 data for the training set, 60 data for the test set, and 60 data for the validation set.
To identify the contribution of each input variable to the model, sensitivity analysis, based on the partial derivatives method and calculated for each variable and observation, was used. A global sensitivity is determined as the sum of the derivatives of the output of the k-th neuron in the output layer regarding the i-th input variable divided by the number of samples. The more important the variable is in building the model, the greater the global sensitivity is than 1.
To evaluate the models’ performances and their generalizability, two external datasets, one for the HIS device and one for the Vis/NIR spectrophotometer, were considered. The best topologies for each model and for the two devices were applied to the two external validation datasets. The external datasets consisted of 48 quality and spectral data from four different cultivars, namely, Biotipo A, Ottavianese, Pellecchiella, and Perla, collected during the harvests of 2023 and 2024. Specifically, 6 apricot samples × 2 replicates for each of the 4 cultivars were considered.
The models and sensitivity analyses were conducted using TIBCO® Statistica statistical package software (version 13.5, TIBCO software Inc., Palo Alto, CA, USA).

3. Results

3.1. General Aspects of Apricot Fruit

A summary of the descriptive statistics (mean ± standard deviation) of the pomological characteristics of 17 apricot genotypes is shown in Table 2. The results indicated a significant variation among cultivars. The early–medium season cultivar Bora showed the highest weight and dimensions (weight: 70 ± 11 g; longitudinal diameter: 50 ± 4 mm; lateral diameter: 48 ± 3 mm; equatorial diameter: 47 ± 3 mm), whereas the medium–late season cultivar Muscat exhibited the lowest (weight: 30 ± 4 g; longitudinal diameter: 38 ± 2 mm; lateral diameter: 36 ± 3 mm; equatorial diameter: 34 ± 3 mm). All 17 cultivar samples showed superior quality, falling into the “Extra” class (longitudinal diameter must be ≥35 mm), according to Commission Regulation (EC) No 851/2000, which outlines the marketing standard for apricots [26].
The mean values of CIELab coordinates (L*, a*, b*) for each cultivar were used to describe the general coloring appearance of apricots (Table 3). All cultivars showed differences in fruit skin. Note that the Rubista cultivar has significantly different color coordinates from the others, with lower L* and b* values and higher a* values. The distinctive characteristics of 17 genotypes were in agreement with Ruitz et al. [27].
The physical (FF) and chemical (TSS, TA, DM) traits of apricots distinguished by cultivars are shown in Table 4. Regarding FF, significant differences (p < 0.05) were observed among the genotypes. Bora showed, on average, a greater flesh firmness (47 ± 36 N), while the lowest mean value was recorded for Krupna Skopjanka (8 ± 4 N). Furthermore, a considerable variability in firmness was observed for the Bora e NJA42 samples, indicating a different degree of ripening of the fruits. Among the genotypes, Muscat exhibited the highest TSS content (19.6 ± 2.1 g 100 g−1 FW), and Thyrinthos the lowest (11.2 ± 2.1 g 100 g−1 FW). All cultivars (Ninfa, Nella, Bora, Thyrinthos and Tardiva di Bordaneil) had an average level greater than or equal to 11.2 g 100 g−1 FW, considered the threshold value for marketing standard for apricot fruit. High variability between cultivars was also observed for titratable acidity.
The highest TA content was found for Rubista (417 ± 43 mEq 100 L−1) and the lowest for Portici (130 ± 30 mEq 100 L−1). Finally, there were significant differences in DM between the cultivars, although not related to the fruit ripening time. The variety with the highest mean dry matter level was Muscat (19.3 ± 2.5 g 100 g−1 FW), while the lowest was observed in Ninfa (9.4 ± 1.9 g 100 g−1 FW).

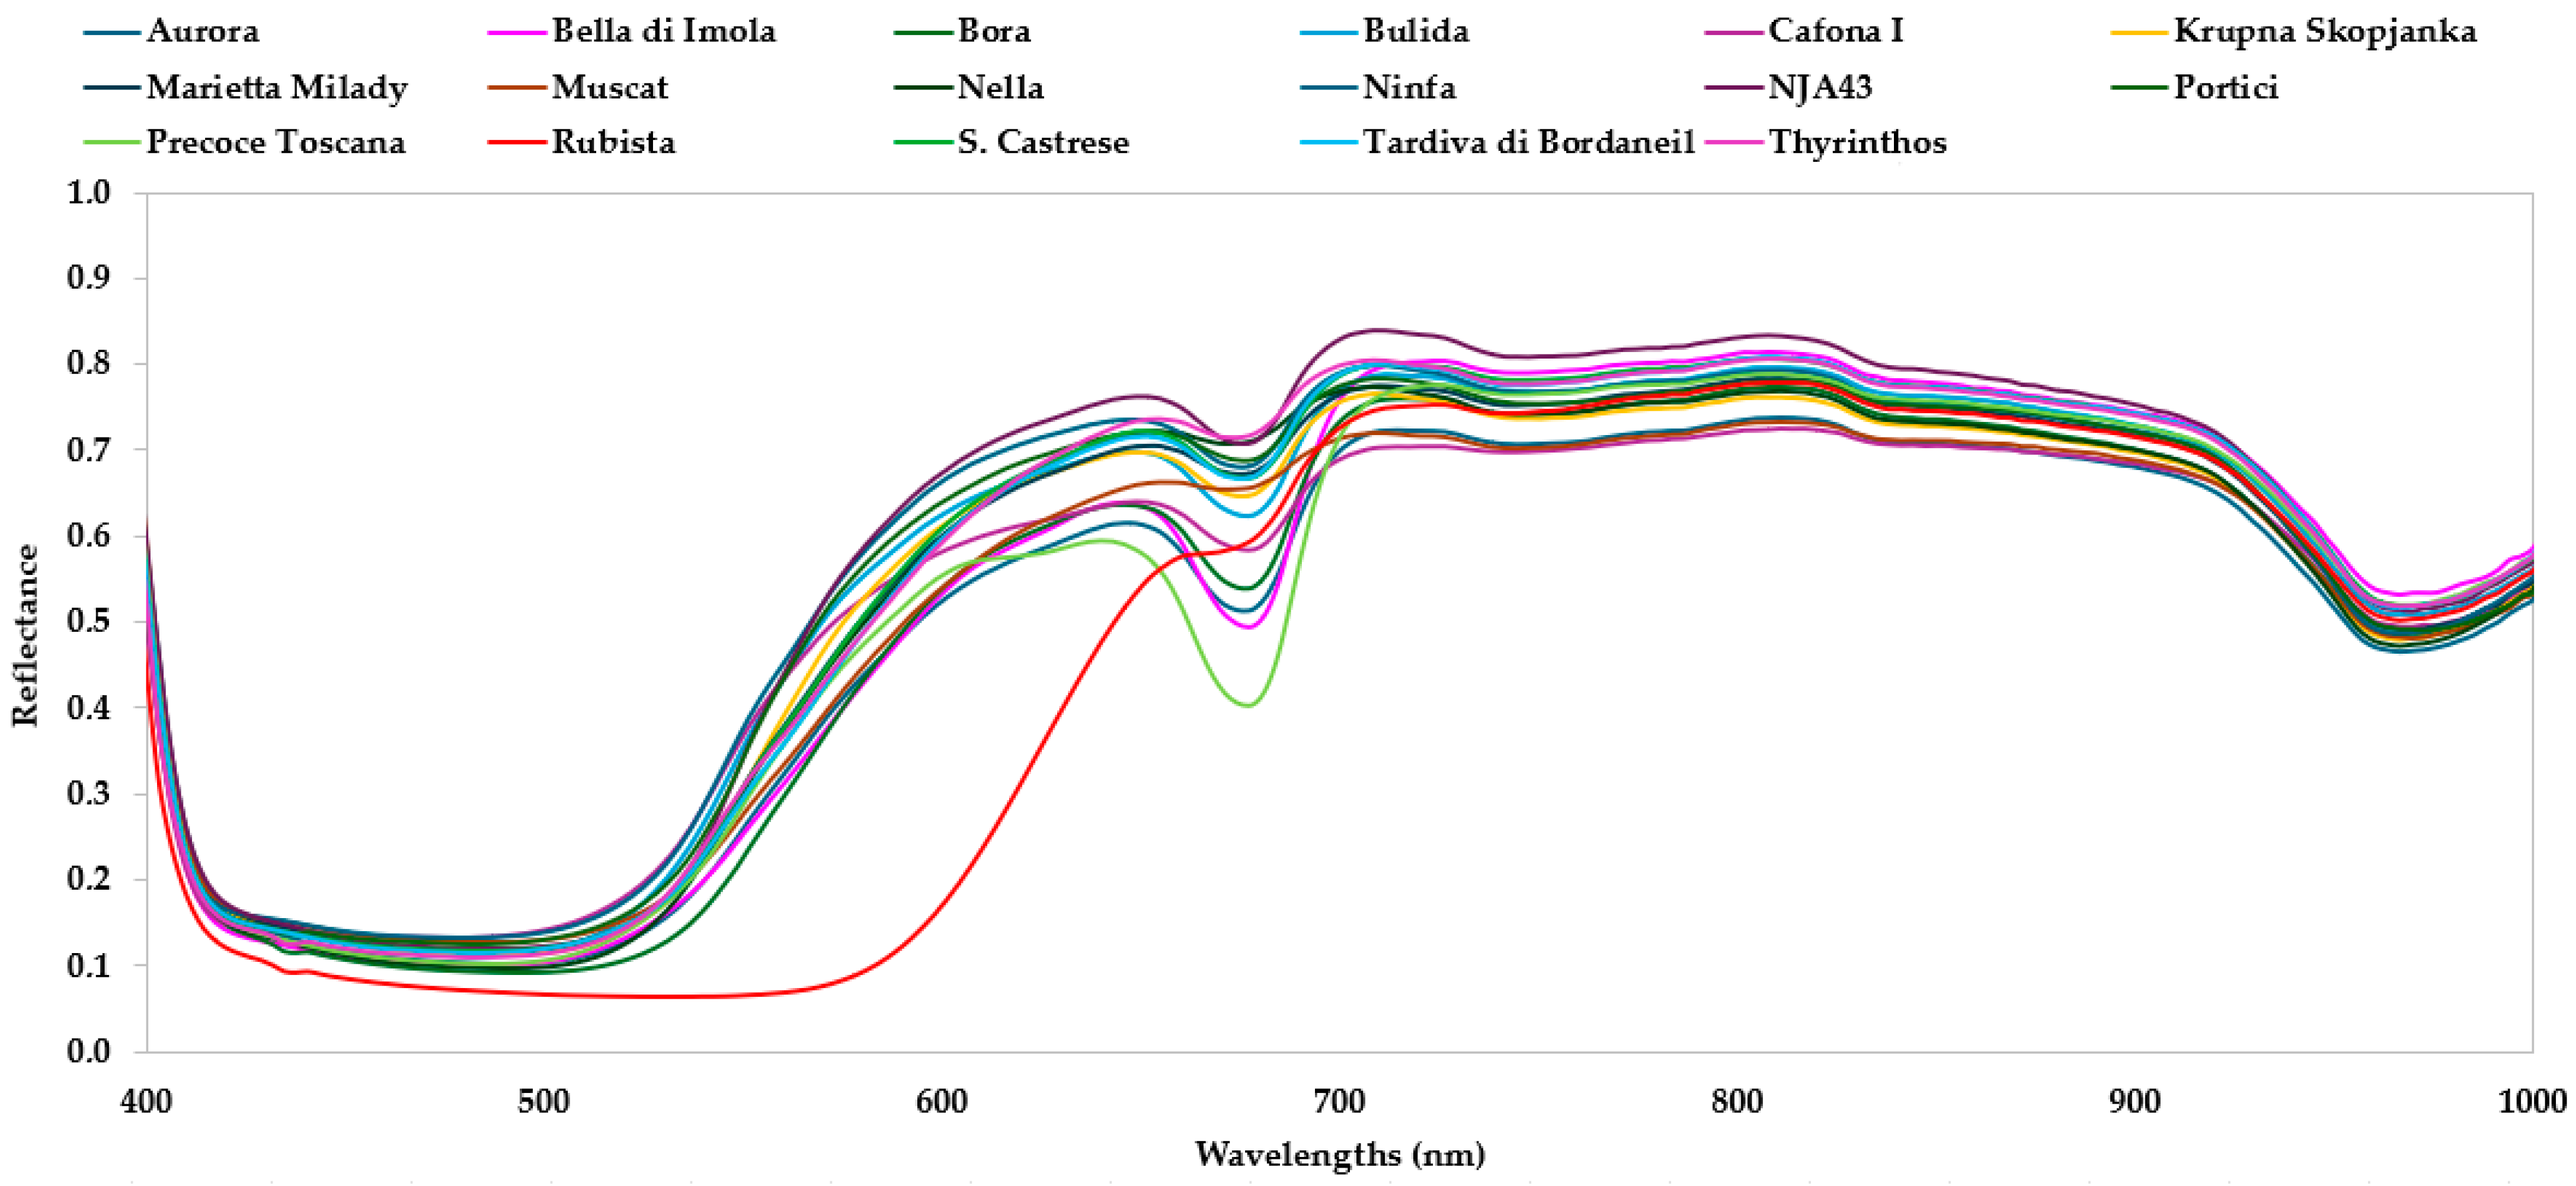
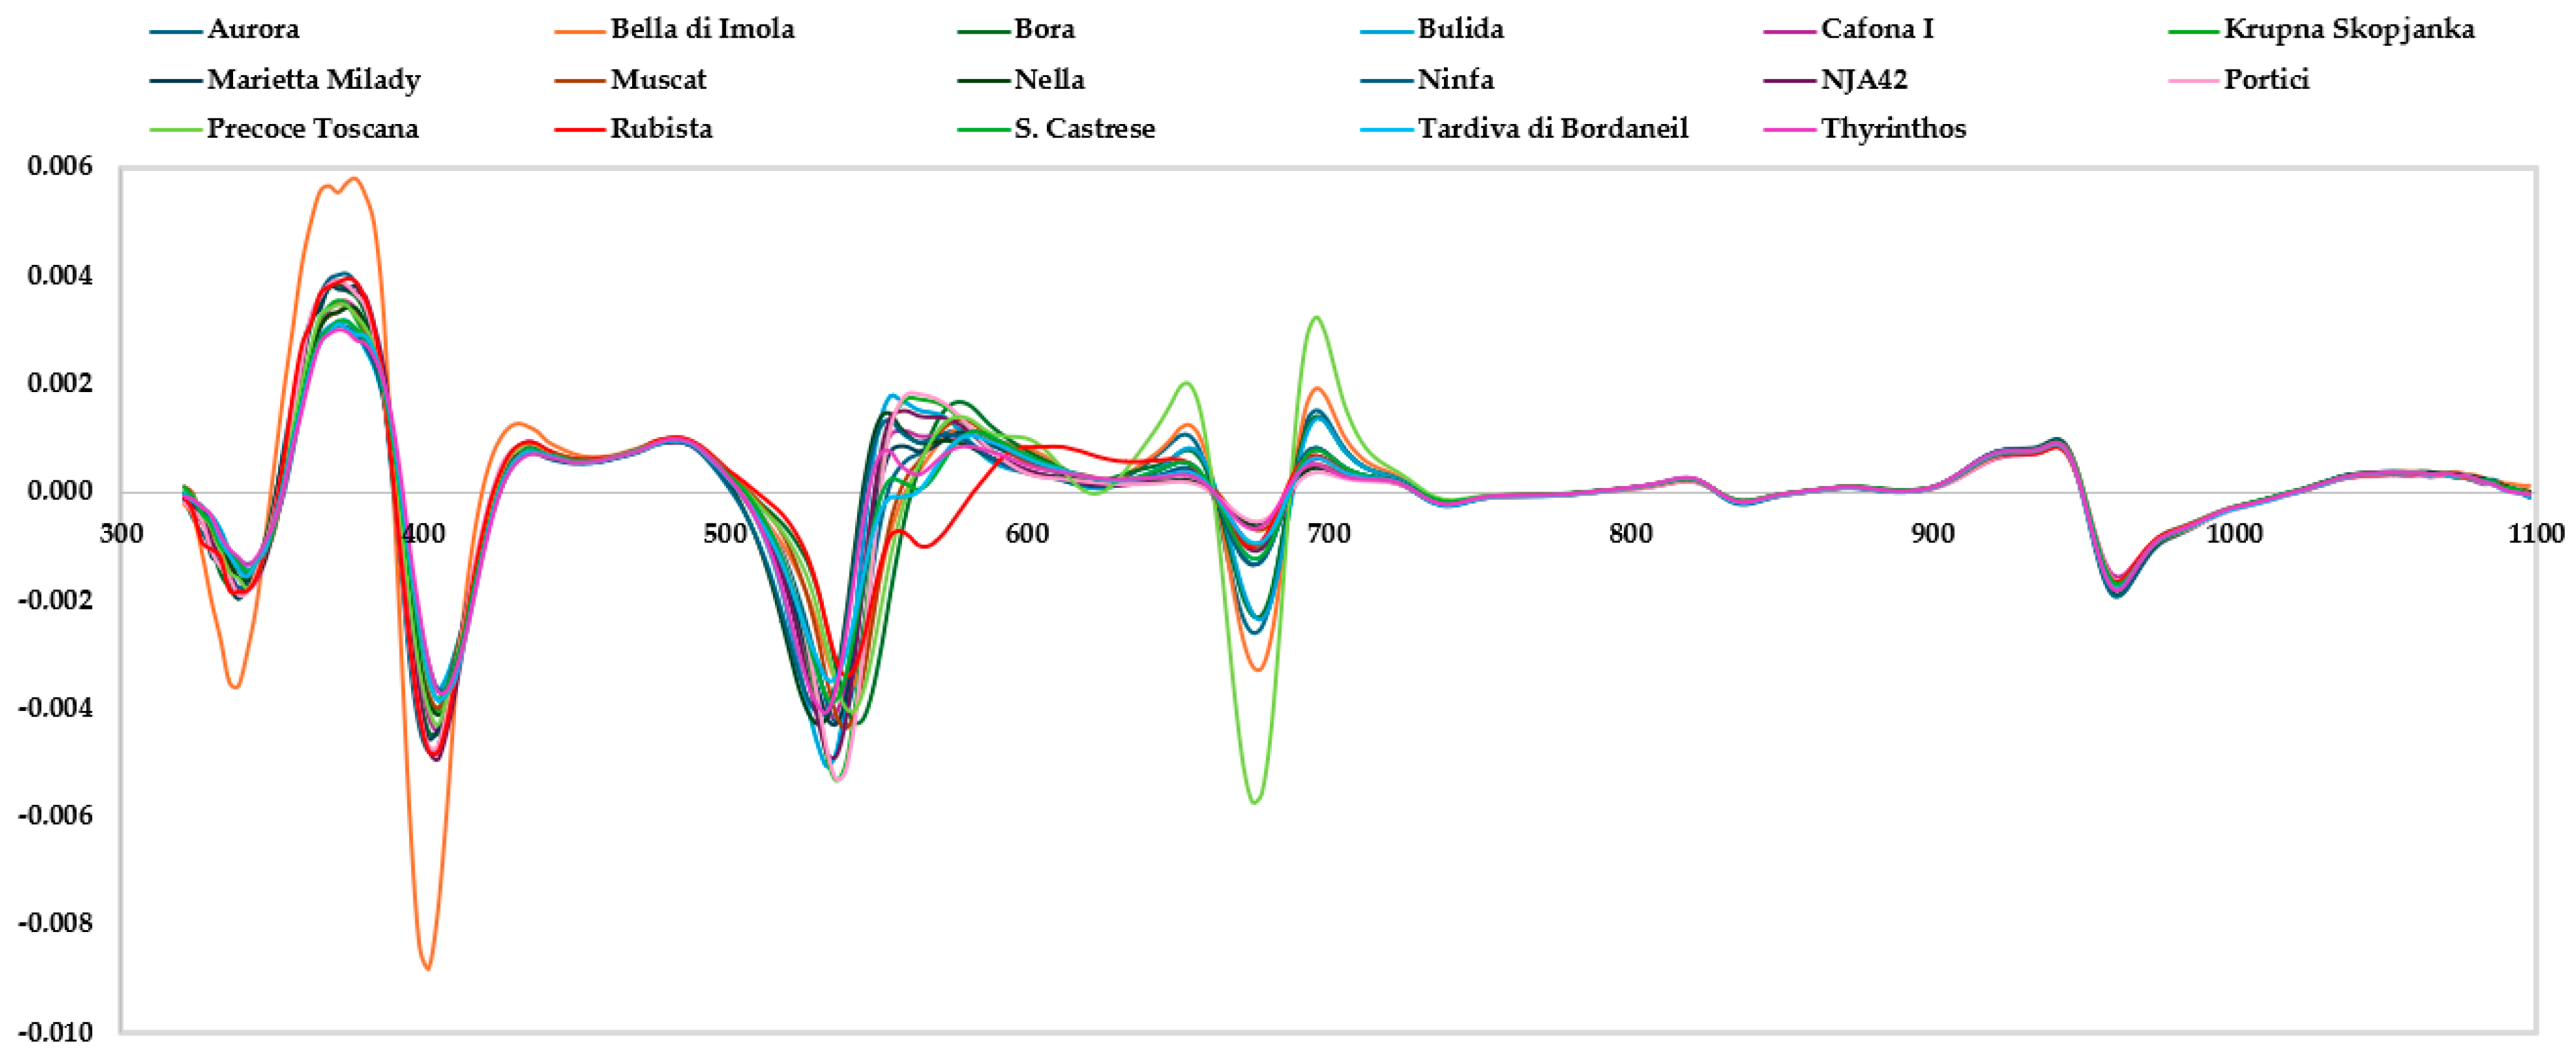
3.2. Spectrum Analysis

The mean reflectance spectra acquired by the HSI device and the mean second derivative absorbance spectra acquired by the Vis/NIR spectrophotometer in the spectral regions (between 400 and 1100 nm for HSI and between 310 and 1100 nm for Vis/NIR spectrophotometer) of 17 apricot genotypes are shown in Figure 3 and Figure 4, respectively. In general, the spectral region between 310 and 1100 nm is described by overtone bands and multiple combinations of fundamental vibrations of -CH, -NH, and -OH groups related to the main structures of organic molecules [11,28,29]. The raw HSI spectra highlighted five main regions around 550–650 nm, 650–720 nm, 720–750 nm, 800–850 nm, and 920–1000 nm. Differently, the Vis/NIR spectrophotometer’s second derivative spectra showed 16 broad peaks around 340 nm, 370 nm, 400 nm, 432 mm, 490 mm, 540 nm, 550 nm, 570 nm, 630 nm, 680 nm, 700 nm, 821 nm, 840 mm, 920, 940 nm, and 960 nm. The spectral region between 340 and 500 nm is characterized by the visible absorption peaks of pigments, such as carotenes and xanthophylls [30]. In particular, β carotenoids in fruits have a color varying from yellow to orange-red, with a maximum absorption peak at 464 nm. Xanthophylls, lutein, and violaxanthins show absorbance peaks at approximately 435 nm and strong absorption between 350 and 500 nm [30]. Many authors associated the region between 530 and 580 nm to anthocyanins or to sugar–protein complexes [30,31,32]. The region at approximately 680 nm is related to the absorption of chlorophyll [7,30]. The peaks at around 760 nm and 970 can be assigned to the overtones of the OH groups related to water [4,33]. The spectral regions at approximately 830 nm, and between 950 and 1000 nm, are characteristic of the second overtone of the O–H and N–H groups, of the combination bands of the O–H bonds, and of the third overtone of the C– bonds [6,34].

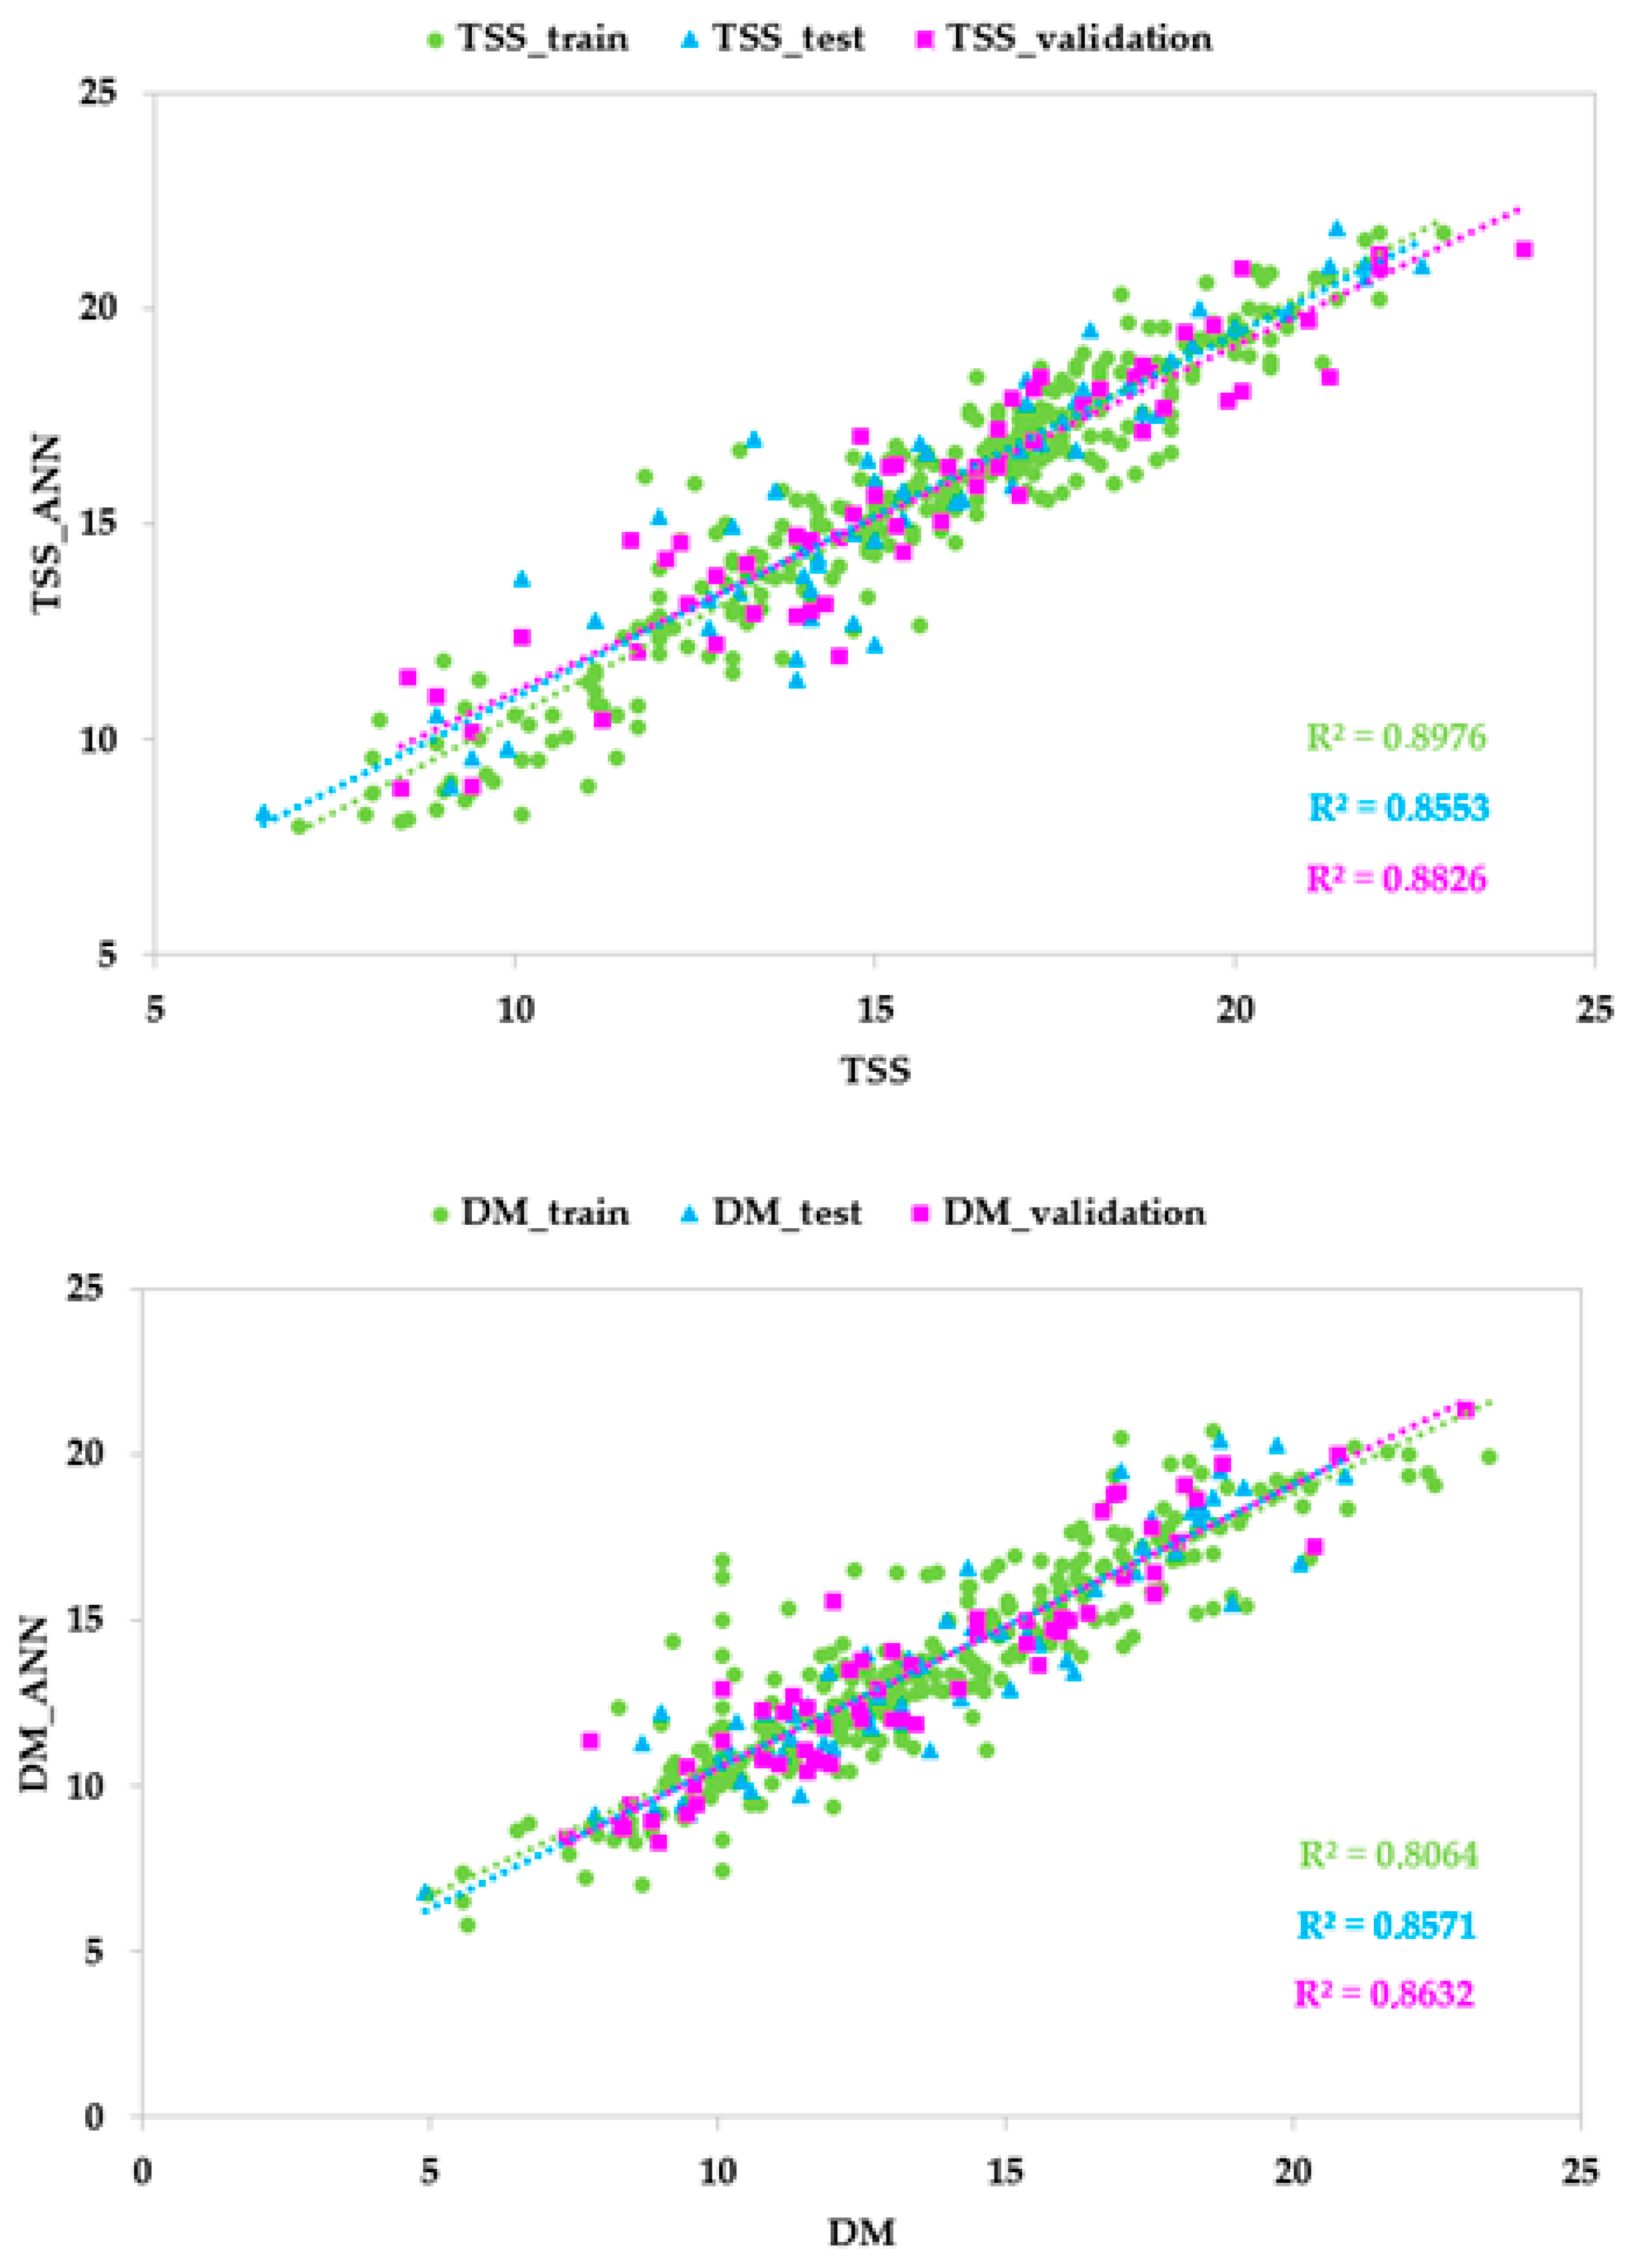
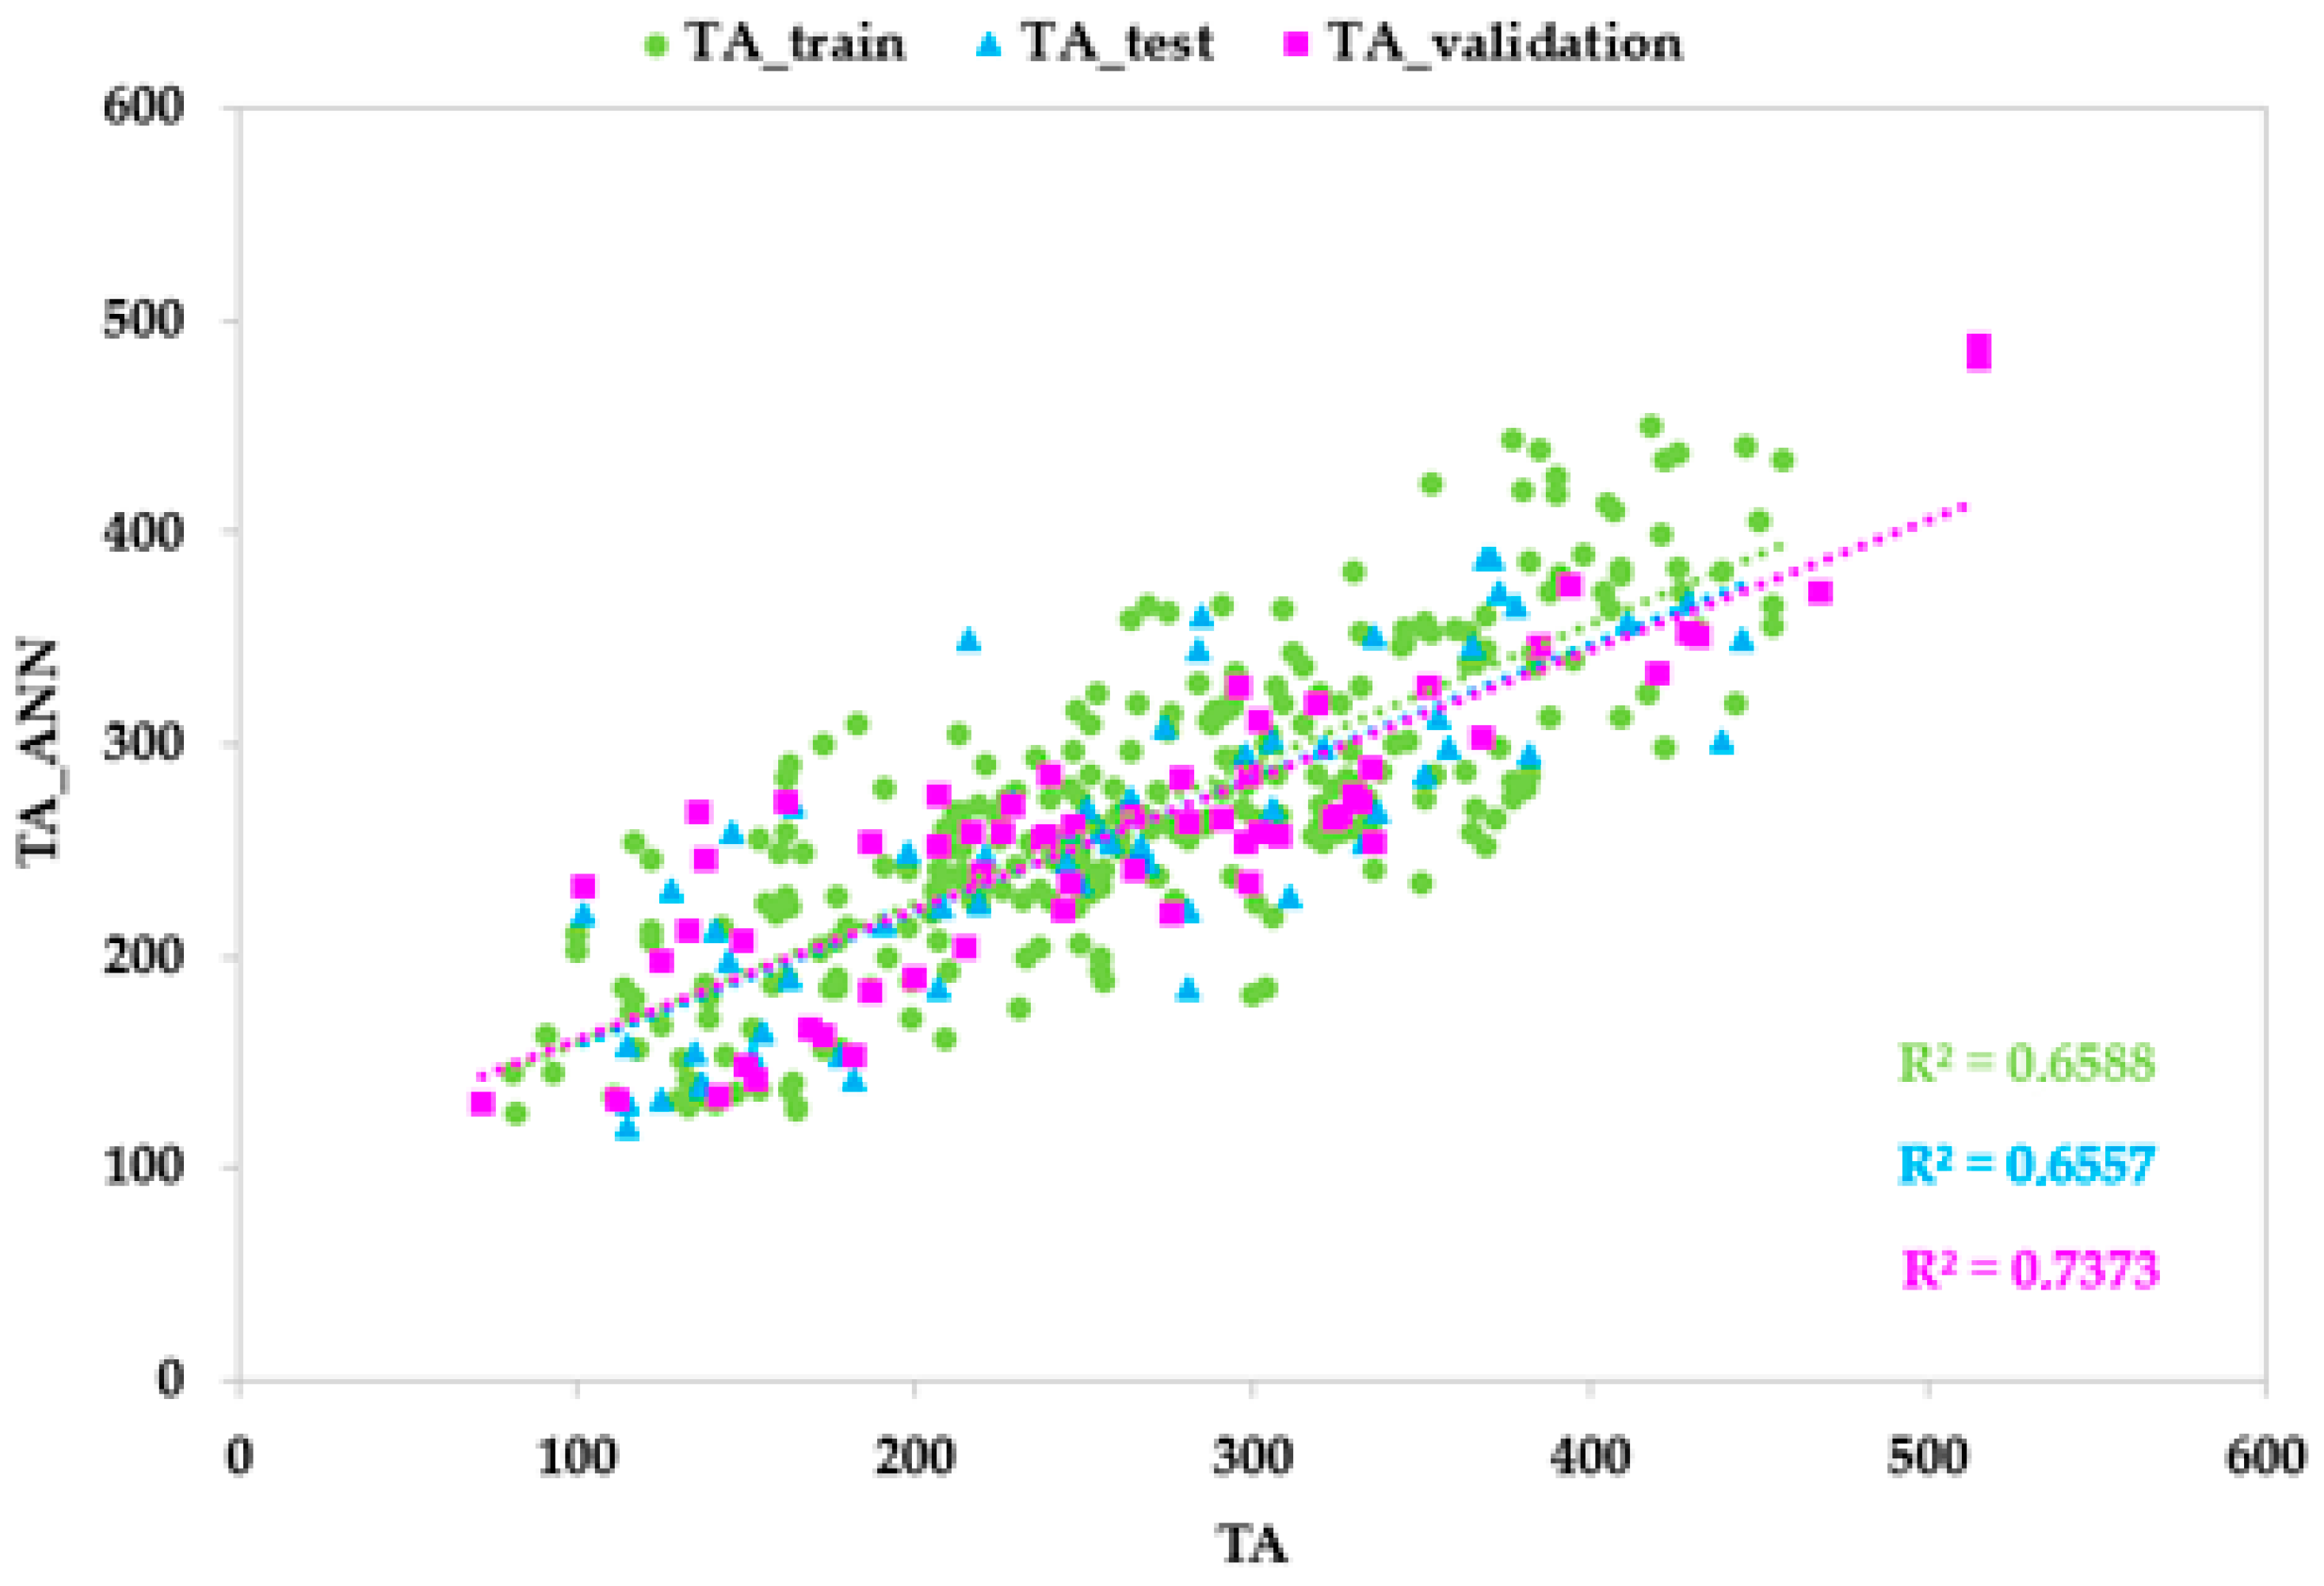
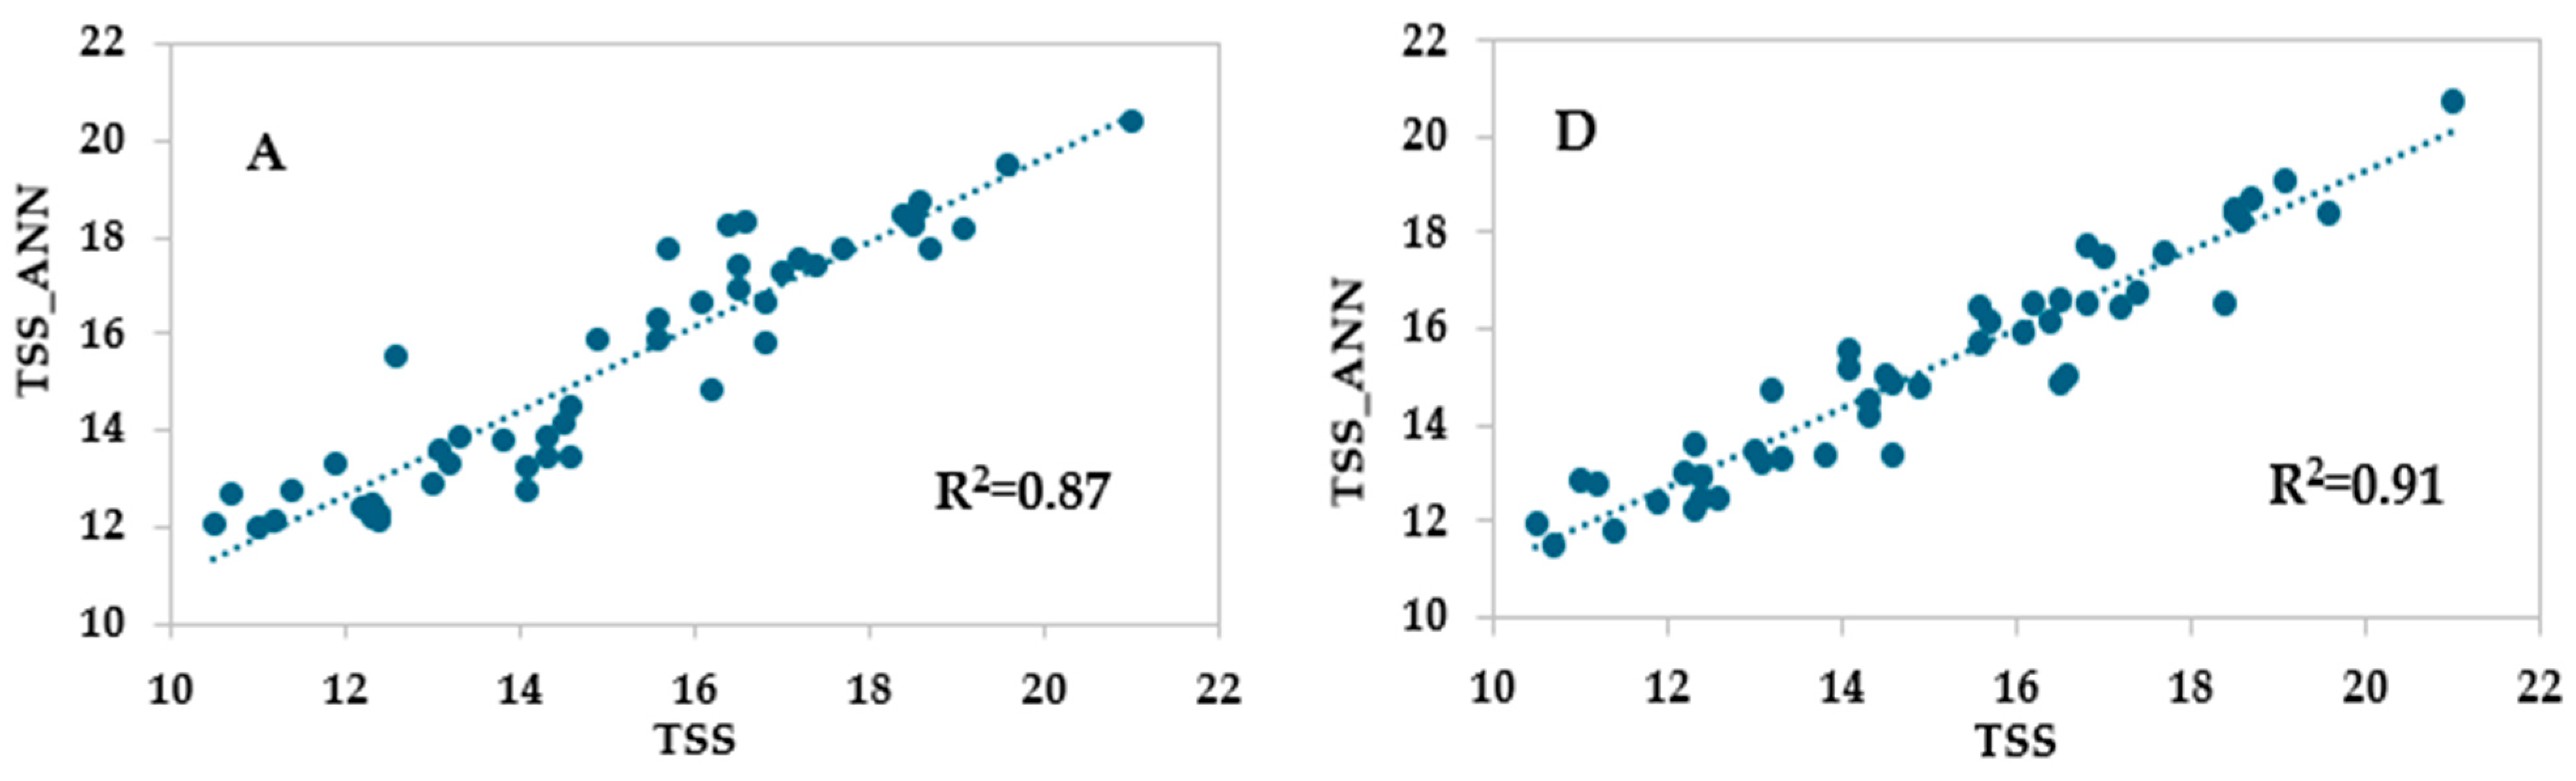
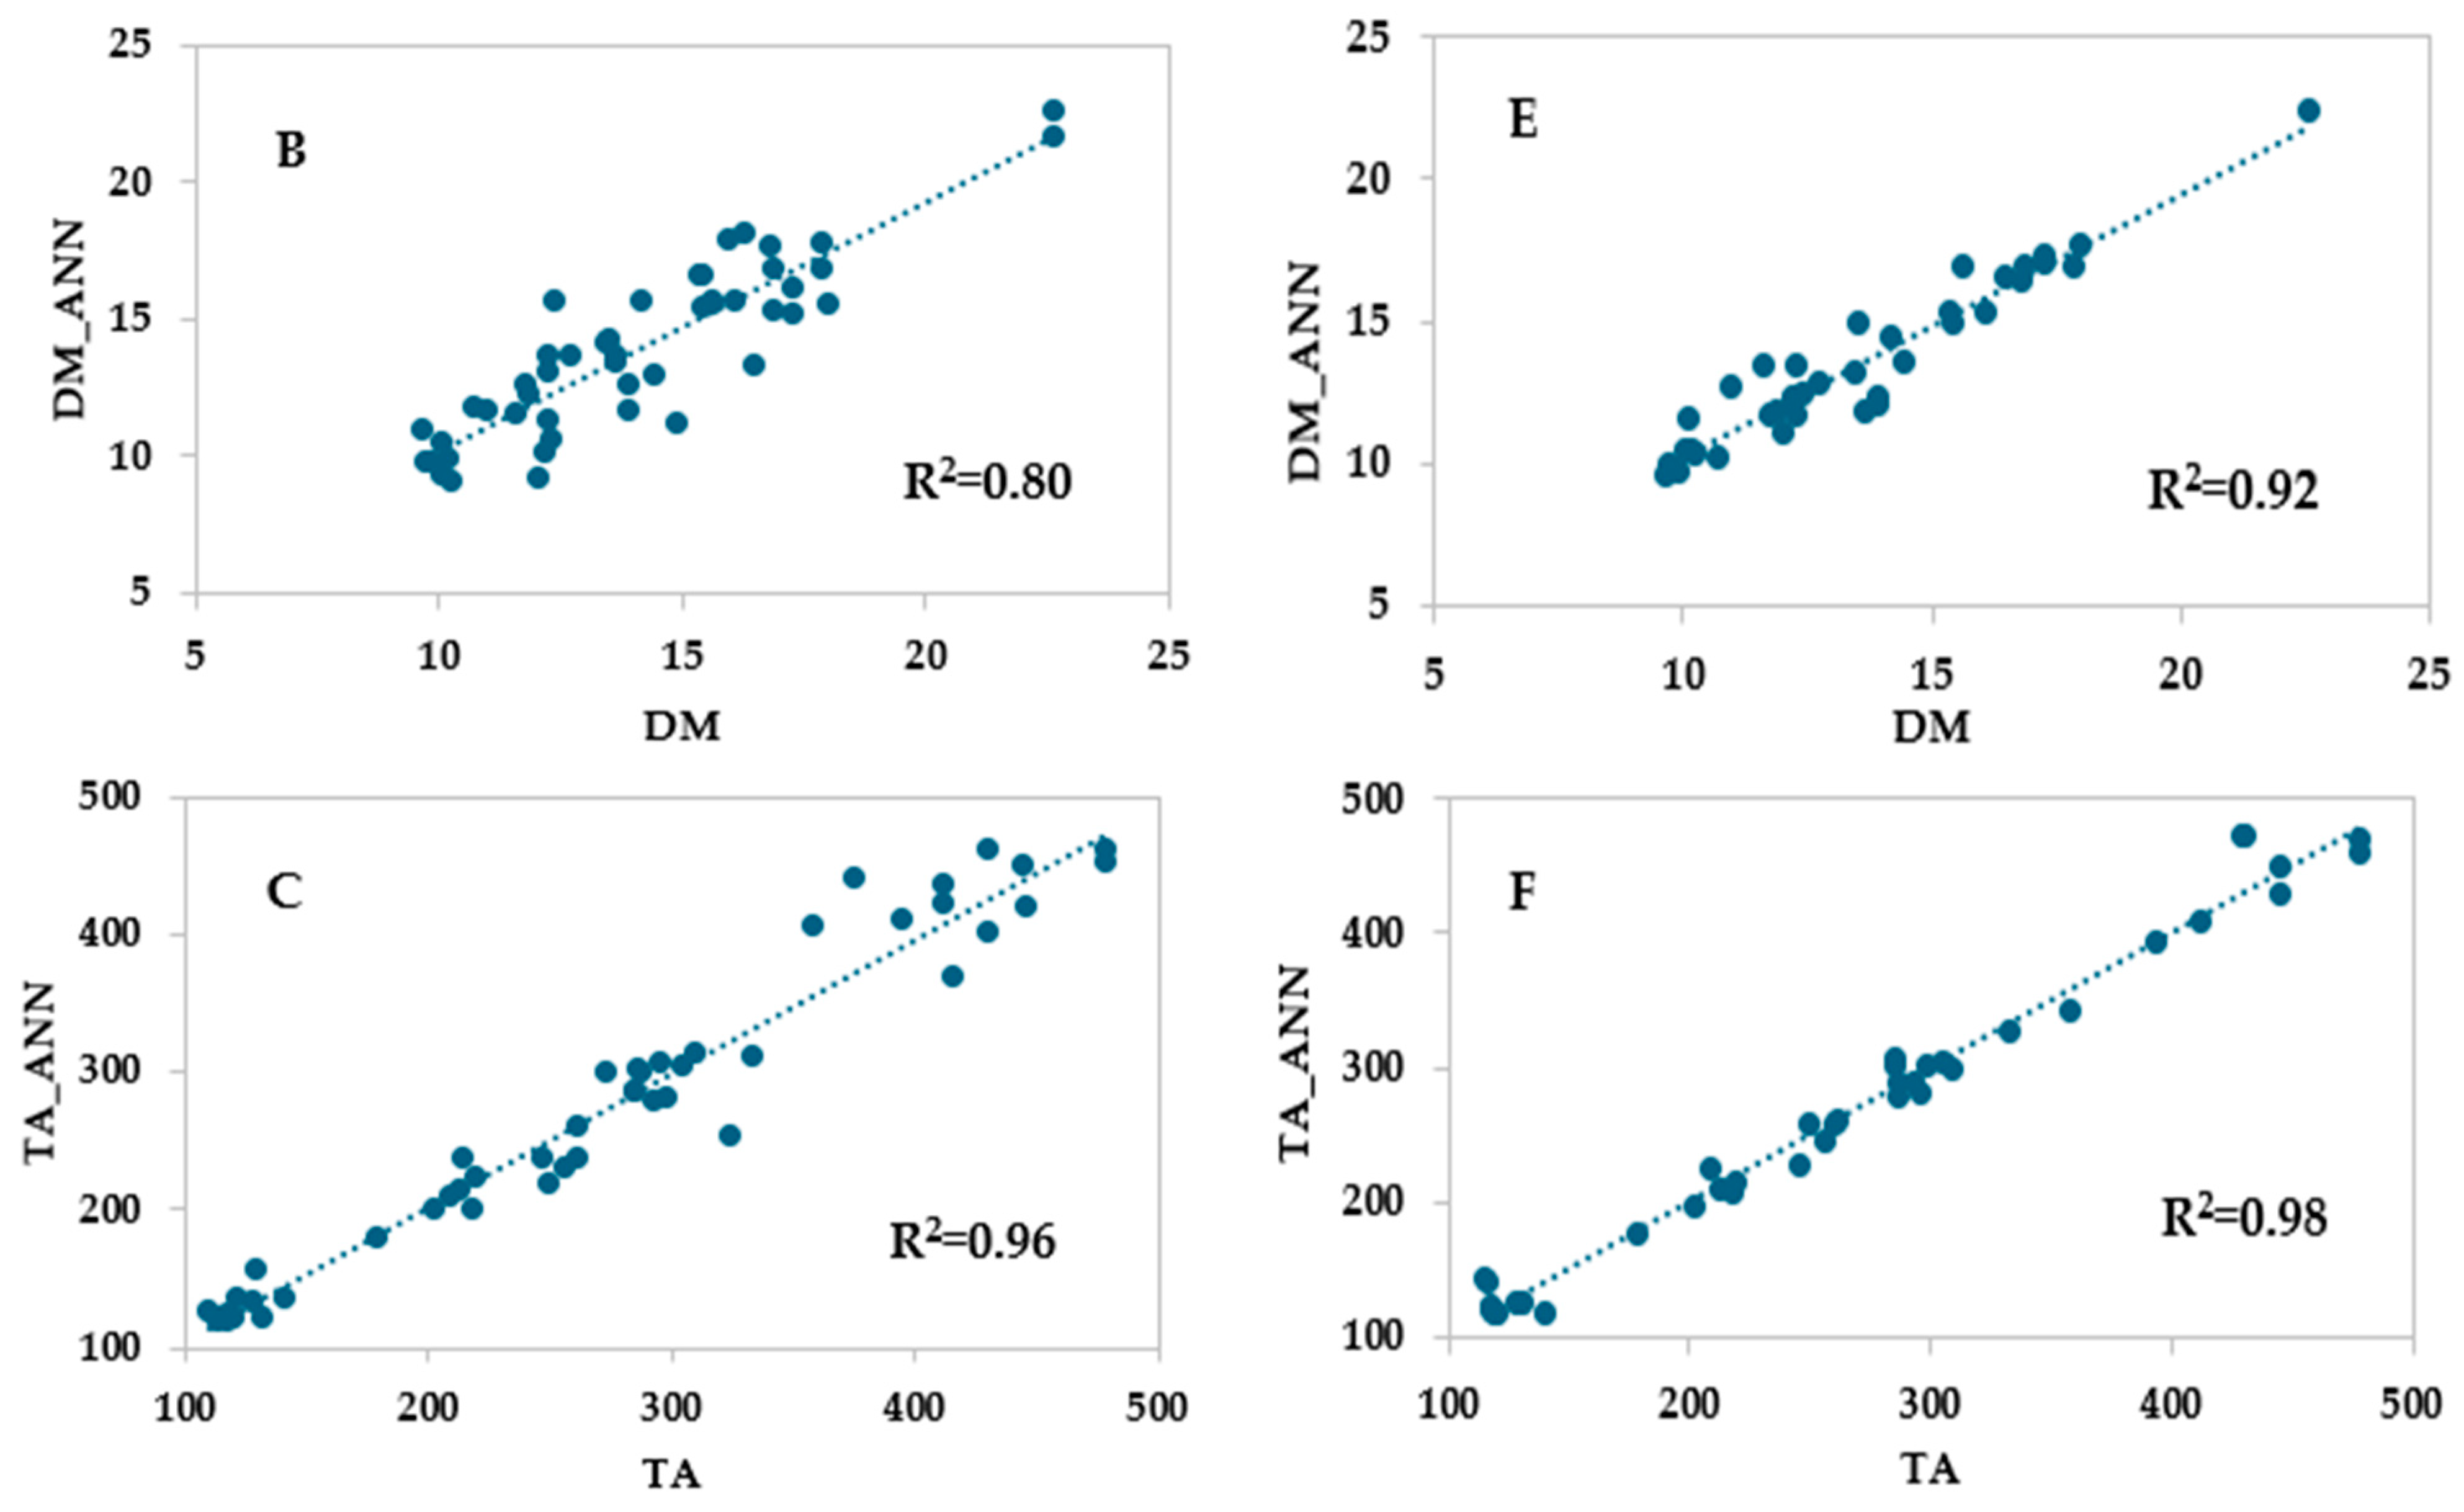
3.3. ANN Models Based on Vis/NIR Spectrophotometer Data

The predictive performances of ANN models based on Vis/NIR data with different architectures (topologies and activation functions) in terms of the coefficient of correlation (r), the coefficient of determination (R2), the mean absolute error (MAE), and the root mean squared error (RMSE) for the training, test, and validation sets are shown in Table 5 and Figure 5. Table S1 (Supplementary Materials) reports the best five ANN architectures for each parameter.
Regarding TSS, high correlation was found with 17 neurons in the hidden layer, a logistic activation function for the hidden neurons and for the output neurons. The high values of r and R2 (0.925 and 0.855, respectively) and the low values of RMSE and MAE (1.319 and 0.080, respectively) for the test set demonstrated good predictive accuracy. Similarly, the best model for DM, carried out with 27 neurons in the hidden layer, an exponential activation function for the hidden neurons, and a hyperbolic tangent function for the output neurons, showed good predictive performance (r = 0.926; R2 = 0.857; RMSE = 1.379, MAE = 0.047 for the test set). Lastly, the model for TA, obtained with 17 neurons in the hidden layer and a logistic activation function for the hidden and the output neurons, presented unsatisfactory predictive ability due to the values of r and R2 being equal to 0.825 and 0.681, respectively, and the high values of the other metrics for the test set.

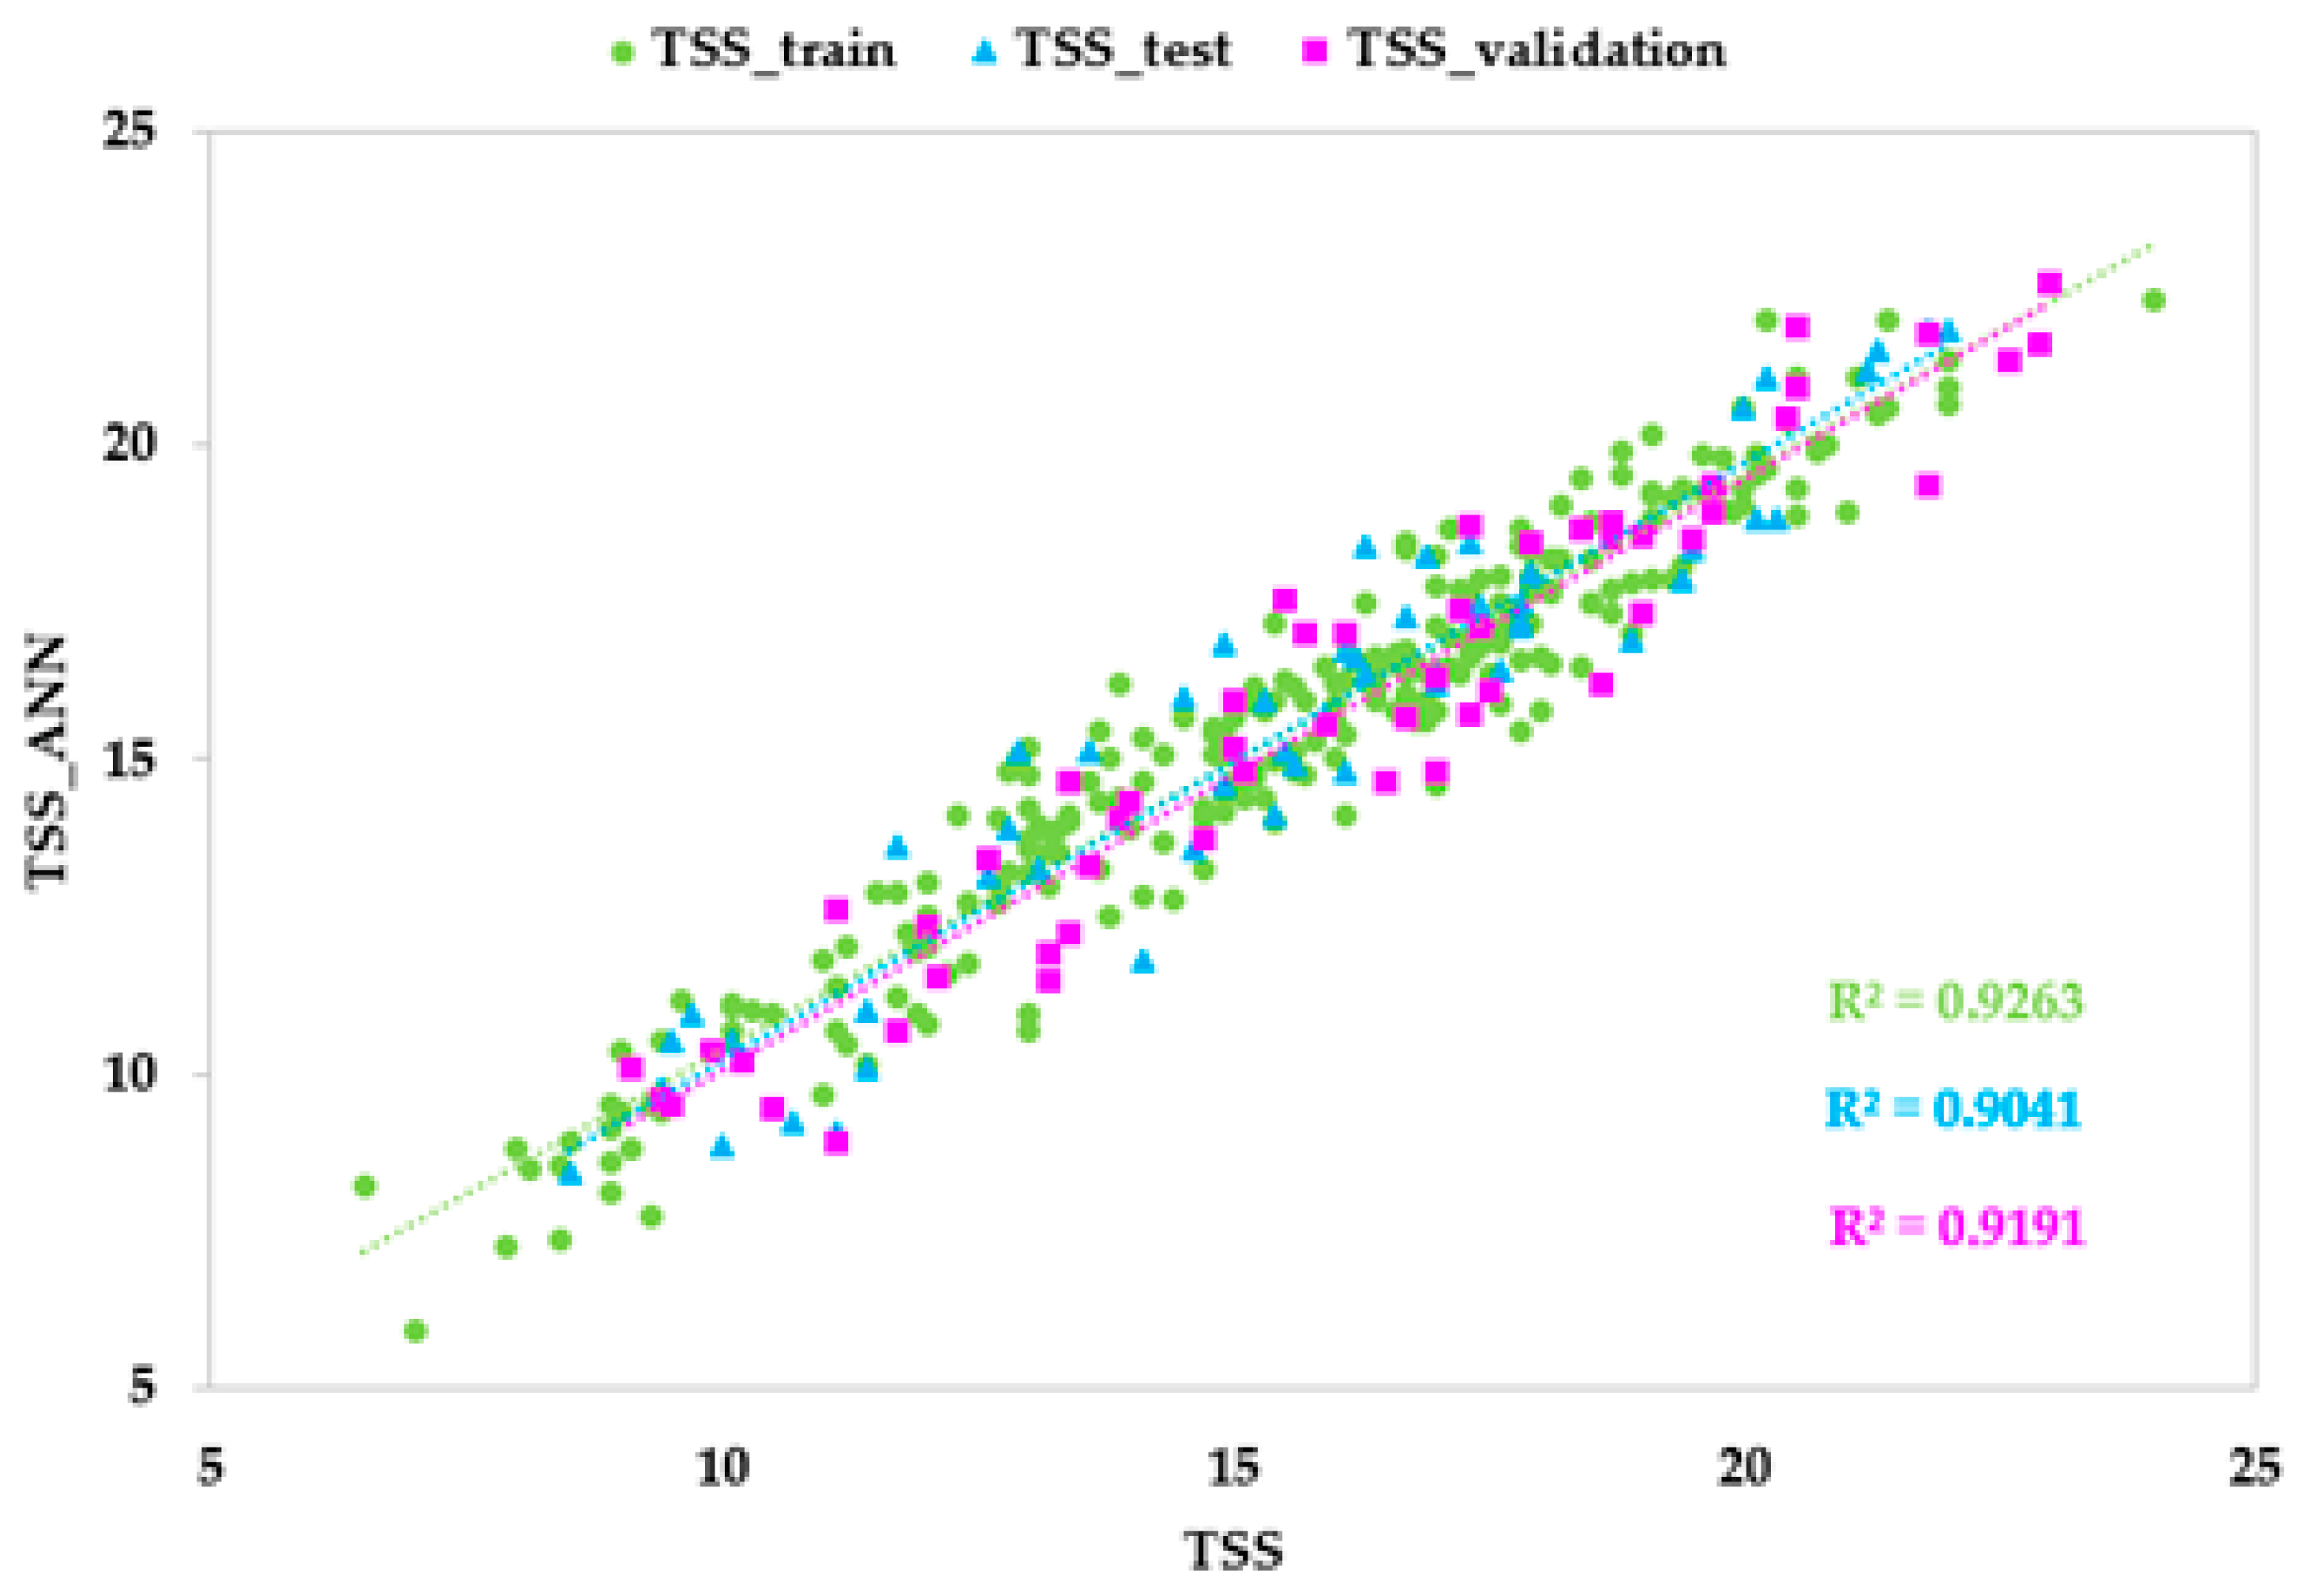
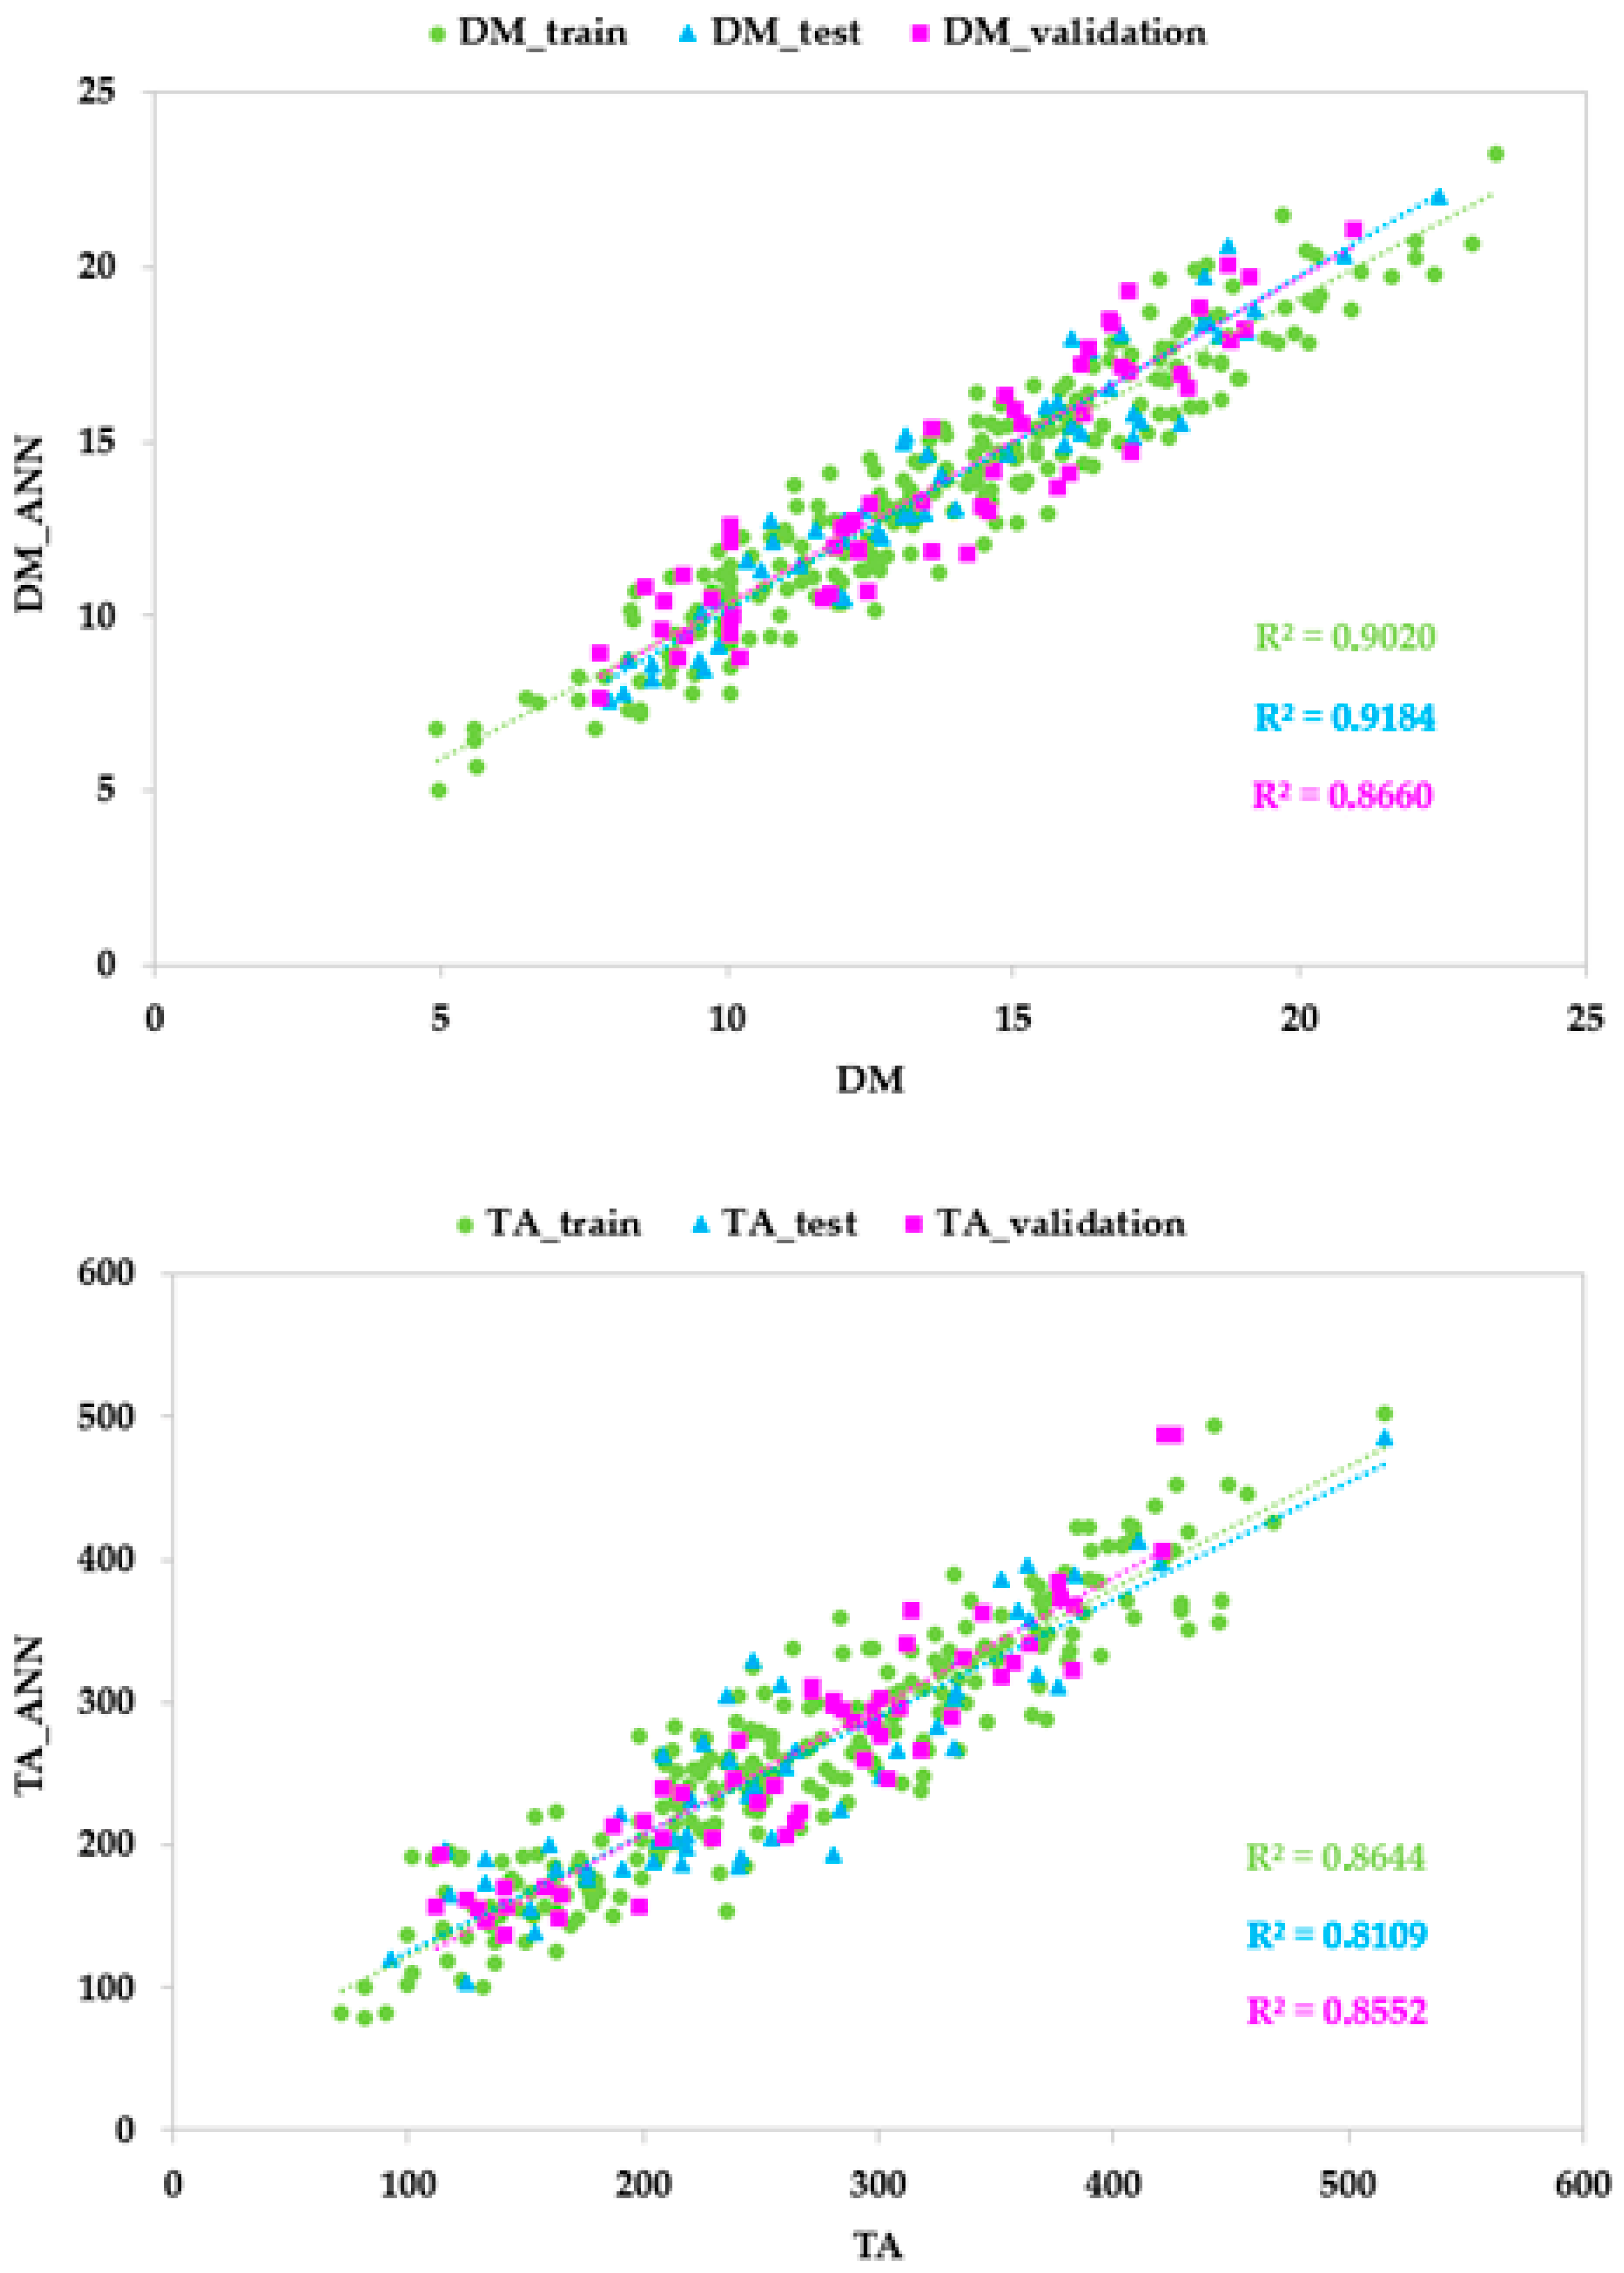
3.4. ANN Models Based on HSI Data

The predictive performances of the ANN models based on HSI data with different architectures (topologies and activation functions) in terms of the coefficient of correlation (r), the coefficient of determination (R2), the mean absolute error (MAE) and the root mean squared error (RMSE) for the training, test, and validation sets are shown in Table 6 and Figure 6. Table S2 (Supplementary Materials) reports the five best ANN architectures for each parameter.
The best model for TSS was developed with 31 neurons in the hidden layer, and an identity logistic activation function for the hidden and output neurons. The metrics for this model highlighted an optimal goodness of fit, with r and R2 values higher than 0.90, and low values of RMSE and MAE for all sets. The good performance also resulted in the model developed for DM, obtained with 20 neurons in the hidden layer, and an identity activation function for the hidden and output neurons. The high values of r and R2 (0.958 and 0.918, respectively), and the low values of RMSE and MAE (1.039 and 0.009, respectively) for the test set demonstrated high predictive accuracy. The optimal model for TA was developed with 50 neurons in the hidden layer, and a logistic activation function for the hidden and output neurons. The predictive ability result was good, with values of r and R2 equal to 0.901 and 0.811, respectively, and values of RMSE and MAE equal to 38.974 and 2.237, respectively, for the test set.

3.5. Sensitivity Analysis

To determine which input spectral variables had a greater impact on the output parameters, a sensitivity analysis was carried out for each ANN model (Table 7), in accordance with Pizarroso et al. [35] and Amoriello et al. [24]. If the independent variable is important, the global sensitivity should be large (>>1). The spectral regions, shown for both devices, corresponding to the second overtone of O–H and N–H, to the third overtone of C–H, and to a combination band of O–H bonds mostly affected TSS, TA, and DM, in agreement with Camps e Christen [6] and Pu et al. [34].

3.6. Validation of Developed Models with External Datasets

External validation is the evaluation of model performance in datasets that differ from those for model development. In our study, 48 quality and spectral data from four different cultivars, namely, Biotipo A, Ottavianese, Pellecchiella, and Perla, collected during the harvests of 2023 and 2024, were used to understand the generalizability of our results. The optimal topologies for each model and for the two devices were applied to the two external validation datasets. Figure 7 shows the deviations between the measured and predicted parameters and the coefficients of determination (R2). Overall, the performances obtained for the models built with HSI data were better than those with Vis/NIR data, in agreement with those obtained for the internal datasets. Moreover, an accuracy higher than 90% of the external validation means that the model is robust [36]. Following this criterion, it is possible to assert that the models obtained for the HSI dataset are robust, while a lower generalizability was found for the TSS and DM models of the Vis/NIR dataset.

4. Discussion

The evaluation of fruit quality is a crucial point for growers, producers, shippers, packers, retailers, and consumers. The presence of immature, overripe, or low-quality fruits on the market can negatively influence apricot consumption and reduce profits. Apricot quality is determined by many pre-harvest factors (genetics, environmental conditions, agronomic management systems), as well as post-harvest factors (textural problems, handling) [37].
In this work, the influence of the varieties and the annual environmental conditions on quality was considered. To do this, fruits of seventeen early-to-late cultivars representative of apricot species from a single orchard with the same agronomic management system were analyzed. Sample quality was determined by external traits and physico-chemical characteristics (Table 2, Table 3 and Table 4). In particular, the internal characteristics are considered the main descriptors of consumer acceptability, of the reiteration of the fruit purchase [38], and of the optimal harvest time [39]. In previous studies, Crisosto et al. [40] and Ceccarelli et al. [41] highlighted the relationship between the soluble solids content and the titratable acidity to evaluate consumers’ acceptability of fruits.
The results represented the expected variation in quality parameters, highlighting differences among cultivars (Table 4). Flesh firmness is considered a good index of maturity, and it is strongly dependent on genetic characteristics [42]. In our study, early cultivars showed higher FF values. Moreover, FF can also be used as a measure of eating quality because fruits with high firmness can cause difficulties in chewing [7]. The significant differences in terms of sugar content can be due to both specific genetic characteristics and to the different solar radiation during the May–July period, corresponding to the periods of early, intermediate, and late maturation. Solovchenko et al. [43] and Intrigliolo et al. [44] reported a significant relationship between the primary and secondary metabolism of plants and solar radiation. In fact, the biosynthesis of carbohydrates partially accumulated in fruits increases as the number of hours of sunshine per day increases. At the same time, as the number of hours of sunshine and temperatures increase, the plant is naturally exposed to water stress, which leads to a reduction in water in the fruit and, therefore, to an increase in total soluble solids. Many studies highlighted high variability in flesh color, flowering time, and soluble solids content in different apricot genotypes [37,42,45,46]. Regarding titratable acidity, higher values were detected for the early cultivars compared to the intermediate and late ones. This is mainly due to the genetic differences between the cultivars and, consequently, the primary and secondary metabolism of the plants themselves, as reported by Pennone et al. [47]. Similar results on different commercial apricot cultivars from large-scale retail trade were also reported in a previous study by Amoriello et al. [7]. Dry matter is a key factor used to assess both fruit’s susceptibility to handling and transportation and suitability for dehydration and processing of apricots into jams, jellies, and juices [48]. Generally, cultivars with low DM values are meant to fresh consumption, whereas drying and processing are preferred for cultivars with high DM values [48,49]. All cultivars showed DM values similar to those reported by Milosevic et al. [50], Drogoudi et al. [51], and Ruiz and Egea [52].
The spectral information in the Vis/NIR regions enabled the differentiation of the cultivars, capturing differences in the pigment content and macro components of the apricot samples. In fact, each pigment has a specific absorption spectrum in the visible region (300–750 nm), whereas the NIR region is related to the measurement of overtones and combination tones of molecular vibrations. For instance, carotenes and xanthophylls absorb at 464 and 435 nm, respectively; anthocyanins at 530–550 nm; sugar–protein complexes at 580 nm; and chlorophyll at around 680 nm [7,30,31,32]. High signal intensity in these spectral regions could be correlated to the samples with high values of b* and a* (Table 2), indicating a very light or not red blush color, as reported by Sartori et al. [20] and Della Strada et al. [19]. Moreover, the NIR region is characterized by the overtones of the OH groups related to water (780–970 nm), the second overtone of the O–H and N–H groups, the combination bands of the O–H bonds, and of the third overtone of the C– bonds (at around 830 nm, and between 950 and 1000 nm) [5,6,33,34]. Indeed, this spectral region is closely related to the carbohydrate, sugar, and water absorbance bands, which showed the maximum intensity for Portici and Cafona I, correspondent to high DM and TSS contents.
The second aim of this study was to verify the ability of portable Vis/NIR instruments (a Vis/NIR spectrophotometer and a hyperspectral imaging device) to provide measurements of apricots’ internal quality attributes in real time in a non-invasive and non-destructive manner, and requiring minimal sample preparation. The use of these spectrum-based instruments in fruit quality monitoring is growing enormously, also due to the possibility of the simultaneous assessment of multiple parameters, with the purpose of replacing traditional analytical methods [53]. Although several studies have been conducted on the non-destructive quality assessment of apricots, especially for Vis/NIR spectrophotometers, some aspects still need to be explored. Among these is the need to obtain robust calibration models, and therefore an appropriate choice of prediction algorithms, which are able to take into account all genetic, agronomic, and environmental factors [54]. In previous studies, model calibrations for determining fruit quality attributes were obtained using multiple linear regression or partial least squares (PLS) algorithms, thus assuming linear relationships between input and output variables [4,5,6,8]. In recent years, the spread of artificial intelligence techniques has made prediction models more efficient. In particular, artificial neural networks (ANNs) have been widely used with the advantage of not making any assumptions about the data distribution or the relationship between quality attributes and spectral variables [11,14,15,16,17]. In our study, we successfully applied artificial neural networks to predict total soluble solid content and dry matter, and, to a lesser extent, titratable acidity. Differently from previous studies, these models were built with samples from many apricot cultivars and harvested in two years, effectively making the models multi-cultivar and multi-year in nature. External validation was crucial for establishing machine learning model quality and for determining model efficacy and generalizability. In fact, internal validation techniques, such as cross-validation and bootstrap, cannot guarantee the accuracy or the robust sensitivity and specificity of machine learning models due to potentially biased training data and the complexity of the validation procedure itself [36]. Although the internal validation approach, which consists of splitting one input dataset into parts (a training subset, a test subset, and a validation subset) is more economic, validation with an external dataset can avoid yielding overly optimistic performance estimates. On the other hand, an additional external dataset entails an additional cost in terms of time and money, which are not always available. This is often the reason why few studies make use of external validation. Another element to consider is the finding of the optimal external sample sizes. Also in this case, economic and temporal availability is crucial. Our results are encouraging for the prediction of the internal quality of apricot fruit, especially if the HSI device is used. However, taking into account the different cost of the two instruments, the end user must evaluate whether the lower predictive ability of the Vis/NIR spectrophotometer is acceptable in the face of a significantly lower cost of the instrument and ease of use.
Furthermore, the biggest challenge is to create low-cost portable instruments, making these technologies more widely applicable. To do this, it is necessary to identify the spectral regions that affect the models the most. In fact, the selection of most predictive spectral bands can (i) improve the prediction ability by eliminating uninformative or interfering variables; (ii) reduce the risk of overfitting; (iii) increase the computational speed of prediction by reducing the number of possible combinations; and (iv) allow the building of instruments for the accurate prediction of the internal qualitative attributes on low spectral ranges, providing a more stable result and allowing considerable savings in the production costs of the instrument [55]. The sensitivity analysis allowed us to select wavelengths from the regions corresponding to the second overtone of O–H and N–H, to the third overtone of C–H, and to a combination band of O–H bonds, proving to be the most informative and predictive bands for the TSS, TA, and DM models. These spectral regions have been confirmed to be related to TSS, TA, and DM in previous studies [6,34].

5. Conclusions

In this work, the potential of a portable Vis/NIR spectrophotometer (310–1100 nm) and of a portable hyperspectral imaging device (400–1000 nm) for evaluating the quality of apricot fruit in a sustainable, non-destructive, and rapid way was investigated. Spectral information allowed cultivars to be discriminated, highlighting the spectral regions that most influenced the clustering of the seventeen cultivars. Cultivar discrimination can help breeders, producers, etc., to enhance the product’s marketability, according to quality and nutritional attributes. Furthermore, cultivar-independent and multi-year models based on spectral data and artificial neural networks were built for three physico-chemical attributes (total soluble solids content, titratable acidity, and dry matter). High accuracy and predictive power were obtained, especially for total soluble solids content and dry matter, whereas lower prediction accuracy was found for titratable acidity. Moreover, the most predictive spectral regions were identified for all qualitative parameters. These results can favor the development of rapid, non-destructive, and low-cost portable tools for monitoring fruit quality, enhancing the efficiency of the apricot supply chain. It could be necessary further studies to use these systems for the real-time prediction and classification of apricots in a sorting line, refining the models and testing them on additional cultivars.

Supplementary Materials

The following supporting information can be downloaded at: https://www.mdpi.com/article/10.3390/foods14020196/s1, Table S1: Neural network architectures and correlation coefficients for the developed ANN models based on Vis/NIR data. The best architecture for each parameter was highlighted in bold; Table S2: Neural network architectures and correlation coefficients for the developed ANN models based on hyperspectral data. The best architecture for each parameter was highlighted in bold.

Author Contributions

Conceptualization, T.A. and R.C. (Roberto Ciccoritti); methodology, T.A. and R.C. (Roberto Ciccoritti); validation, T.A. and R.C. (Roberto Ciccoritti); formal analysis, R.C. (Roberto Ciorba), G.R., F.M., D.S. and R.C. (Roberto Ciccoritti); investigation, T.A. and R.C. (Roberto Ciccoritti); data curation, T.A.; writing—original draft preparation, T.A. and R.C. (Roberto Ciccoritti); writing—review and editing, T.A., R.C. (Roberto Ciccoritti), R.C. (Roberto Ciorba), G.R., F.M. and D.S. All authors have read and agreed to the published version of the manuscript.

Funding

This research was partially funded by the Horizon Europe Framework Programme of the European Union, grant number 101061028.

Institutional Review Board Statement

Not applicable.

Informed Consent Statement

Not applicable.

Data Availability Statement

The original contributions presented in the study are included in the article/Supplementary Materials, further inquiries can be directed to the corresponding author.

Acknowledgments

Grateful acknowledgements are given to Stefano Vona, Marco Bertolami, Alisea Sartori, and Piera Puleo for their technical assistance.

Conflicts of Interest

The authors declare no conflicts of interest.

References

  1. FAOSTAT. Food and Agriculture Organization Statistical Databases. 2024. Available online: http://faostat.fao.org (accessed on 30 January 2024).
  2. Hegedüs, A.; Pfeiffer, P.; Papp, N.; Abrankó, L.; Blázovics, A.; Pedryc, A.; Stefanovits-Bányai, E. Accumulation of antioxidants in apricot fruit through ripening: Characterization of a genotype with enhanced functional properties. Biol. Res. 2011, 44, 339–344. [Google Scholar] [CrossRef] [PubMed]
  3. Leccese, A.; Bartolini, S.; Viti, R. From genotype to apricot fruit quality: The antioxidant properties contribution. Plant Foods Hum. Nutr. 2012, 67, 317–325. [Google Scholar] [CrossRef] [PubMed]
  4. Bureau, S.; Ruiz, D.; Reich, M.; Gouble, B.; Bertrand, D.; Audergon, J.M.; Renard, C.M.G.C. Rapid and non-destructive analysis of apricot fruit quality using FT-near-infrared spectroscopy. Food Chem. 2009, 113, 1323–1328. [Google Scholar] [CrossRef]
  5. Bureau, S.; Ruiz, D.; Reich, M.; Gouble, B.; Bertrand, D.; Audergon, J.M.; Renard, C.M.G.C. Application of ATR-FTIR for a rapid and simultaneous determination of sugars and organic acids in apricot fruit. Food Chem. 2009, 115, 1133–1140. [Google Scholar] [CrossRef]
  6. Camps, C.; Christen, D. Non-destructive assessment of apricot fruit quality by portable visible-near infrared spectroscopy. LWT-Food Sci. Technol. 2009, 42, 1125–1131. [Google Scholar] [CrossRef]
  7. Amoriello, T.; Ciccoritti, R.; Paliotta, M.; Carbone, K. Classification and prediction of early-to-late ripening apricot quality using spectroscopic techniques combined with chemometric tools. Sci. Hortic. 2018, 240, 310–317. [Google Scholar] [CrossRef]
  8. Amoriello, T.; Ciccoritti, R.; Carbone, K. Vibrational spectroscopy as a green technology for predicting nutraceutical properties and antiradical potential of early-to-late apricot genotypes. Postharvest Biol. Technol. 2019, 155, 156–166. [Google Scholar] [CrossRef]
  9. Wang, M.; Xu, Y.; Yang, Y.; Mu, B.; Nikitina, M.A.; Xiao, X. Vis/Nir optical biosensors applications for fruit monitoring. Biosens. Bioelectron. 2022, 11, 100197. [Google Scholar] [CrossRef]
  10. Ozdogan, G.; Lin, X.; Sun, D.W. Rapid and noninvasive sensory analyses of food products by hyperspectral imaging: Recent application developments. Trends Food Sci. Technol. 2021, 111, 151–165. [Google Scholar] [CrossRef]
  11. Amoriello, T.; Ciorba, R.; Ruggiero, G.; Amoriello, M.; Ciccoritti, R. A Performance Evaluation of Two Hyperspectral Imaging Systems for the Prediction of Strawberries’ Pomological Traits. Sensors 2024, 24, 174. [Google Scholar] [CrossRef] [PubMed]
  12. Fatchurrahman, D.; Nosrati, M.; Amodio, M.L.; Chaudhry, M.M.A.; de Chiara, M.L.V.; Mastrandrea, L.; Colelli, G. Comparison Performance of Visible-NIR and Near-Infrared Hyperspectral Imaging for Prediction of Nutritional Quality of Goji Berry (Lycium barbarum L.). Foods 2021, 10, 1676. [Google Scholar] [CrossRef] [PubMed]
  13. Munera, S.; Rodríguez-Ortega, A.; Aleixos, N.; Cubero, S.; Gómez-Sanchis, J.; Blasco, J. Detection of Invisible Damages in ‘Rojo Brillante’ Persimmon Fruit at Different Stages Using Hyperspectral Imaging and Chemometrics. Foods 2021, 10, 2170. [Google Scholar] [CrossRef]
  14. Goyal, S. Artificial Neural Networks in Fruits: A Comprehensive Review. Int. J. Image Graph. Signal Process. 2014, 5, 53–63. [Google Scholar] [CrossRef]
  15. Naroui Rad, M.R.; Koohkan, S.; Fanaei, H.R.; Pahlavan Rad, M.R. Application of Artificial Neural Networks to predict the final fruit weight and random forest to select important variables in native population of melon (Cucumis melo L.). Sci. Hortic. 2015, 181, 108–112. [Google Scholar] [CrossRef]
  16. Torkashvand, A.M.; Ahmadi, A.; Nikravesh, N.L. Prediction of kiwifruit firmness using fruit mineral nutrient concentration by artificial neural network (ANN) and multiple linear regressions (MLR). J. Integr. Agric. 2017, 16, 1634–1644. [Google Scholar] [CrossRef]
  17. Huang, X.; Wang, H.; Qu, S.; Luo, W.; Gao, Z. Using artificial neural network in predicting the key fruit quality of loquat. Food Sci. Nutr. 2021, 9, 1780–1791. [Google Scholar] [CrossRef] [PubMed]
  18. Lan, H.; Wang, Z.; Niu, H.; Zhang, H.; Zhang, Y.; Tang, Y.; Liu, Y. A non-destructive testing method for soluble solid content in Korla fragrant pears based on electrical properties and artificial neural network. Food Sci. Nutr. 2020, 8, 5172–5181. [Google Scholar] [CrossRef] [PubMed]
  19. Della Strada, G.; Pennone, F.; Fideghelli, C.; Monastra, F.; Cobianchi, D. Monografia di Cultivar di Albicocco; Ministero delle Politiche Agricole e Forestali: Roma, Italy, 1989. [Google Scholar]
  20. Sartori, A.; Vitellozzi, F.; Grassi, F.; Della Strada, G.; Fideghelli, C. Drupacee. In Il Germoplasma Frutticolo in Italia; Istituto Sperimentale per la Frutticoltura: Roma, Italy, 2004; Volume I. [Google Scholar]
  21. Giovannoni, J.; Nguyen, C.; Ampofo, B.; Zhong, S.; Fei, Z. The epigenome and transcriptional dynamics of fruit ripening. Annu. Rev. Plant Biol. 2017, 68, 61–84. [Google Scholar] [CrossRef]
  22. Minas, I.S.; Anthony, B.M.; Pieper, J.R.; Sterle, D.G. Large-scale and accurate non-destructive visual to near infrared spectroscopy-based assessment of the effect of rootstock on peach fruit internal quality. Eur. J. Agron. 2023, 143, 126706. [Google Scholar] [CrossRef]
  23. Escribano, S.; Biasi, W.V.; Lerud, R.; Slaughter, D.C.; Mitcham, E.J. Non-destructive prediction of soluble solids and dry matter content using NIR spectroscopy and its relationship with sensory quality in sweet cherries. Postharvest Biol. Technol. 2017, 128, 112–120. [Google Scholar] [CrossRef]
  24. Amoriello, T.; Mellara, F.; Amoriello, M.; Ciccoritti, R. Evaluation of Nutritional Values of Edible Algal Species Using a Shortwave Infrared Hyperspectral Imaging and Machine Learning Technique. Foods 2024, 13, 2277. [Google Scholar] [CrossRef] [PubMed]
  25. Amoriello, T.; Ciccoritti, R.; Ferrante, P. Prediction of Strawberries’ Quality Parameters Using Artificial Neural Networks. Agronomy 2022, 12, 963. [Google Scholar] [CrossRef]
  26. Commission Regulation (EC) No 851/2000 of 27 April 2000 Laying down the Marketing Standard for Apricots. 2000. Available online: https://www.fao.org/faolex/results/details/es/c/LEX-FAOC036585/ (accessed on 26 October 2024).
  27. Ruiz, D.; Egea, J.; Tomás-Barberán, F.A.; Gil, M.I. Carotenoids from new apricot (Prunus armenica L.) varieties and their relationship with flesh and skin color. J. Agric. Food Chem. 2005, 53, 6368–6374. [Google Scholar] [CrossRef]
  28. Manley, M.; Joubert, E.; Myburgh, L.; Kidd, M. Prediction of Soluble Solids Content and Post-Storage Internal Quality of Bulida Apricots Using near Infrared Spectroscopy. J. Near Infrared Spectrosc. 2007, 15, 179–188. [Google Scholar] [CrossRef]
  29. Benelli, A.; Cevoli, C.; Fabbri, A.; Ragni, L. Hyperspectral imaging to measure apricot attributes during storage. J. Agric. Eng. 2022, 53, 1311. [Google Scholar] [CrossRef]
  30. Walsh, K.B.; Blasco, J.; Zude-Sasse, M.; Sun, X. Visible-NIR ‘point’ spectroscopy in postharvest fruit and vegetable assessment: The science behind three decades of commercial use. Postharvest Biol. Technol. 2020, 168, 111246. [Google Scholar] [CrossRef]
  31. Merzlyak, M.N.; Gitelson, A.A.; Chivkunova, O.B.; Rakitin, V.Y. Non-destructive optical detection of pigment changes during leaf senescence and fruit ripening. Physiol. Plant. 2003, 106, 135–141. [Google Scholar] [CrossRef]
  32. Toledo-Martín, E.M.; García-García, M.C.; Font, R.; Moreno-Rojas, J.M.; Gomez, P.; Salinas-Navarro, M.; Del Río-Celestino, M. Application of visible/near-infrared spectroscopy for predicting internal and external quality in pepper. J. Sci. Food Agric. 2016, 96, 3114–3125. [Google Scholar] [CrossRef]
  33. Nicolaï, B.M.; Beullens, K.; Bobelyn, E.; Peirs, A.; Saeys, W.; Theron, K.I.; Lammertyn, J. Nondestructive measurement of fruit and vegetable quality by means of NIR spectroscopy: A review. Postharvest Biol. Technol. 2007, 46, 99–118. [Google Scholar] [CrossRef]
  34. Pu, H.; Liu, D.; Wang, L.; Sun, D.W. Soluble solids content and pH prediction and maturity discrimination of Lychee fruits using visible and near infrared hyperspectral imaging. Food Anal. Methods 2016, 9, 235–244. [Google Scholar] [CrossRef]
  35. Pizarroso, J.; Portela, J.; Munoz, A. NeuralSens: Sensitivity Analysis of Neural Networks. J. Stat. Softw. 2022, 10, 1–36. [Google Scholar] [CrossRef]
  36. Ho, S.Y.; Phua, K.; Wong, L.; Goh, W.W.B. Extensions of the External Validation for Checking Learned Model Interpretability and Generalizability. Patter 2020, 1, 100129. [Google Scholar] [CrossRef]
  37. Ciccoritti, R.; Ciorba, R.; Mitrano, F.; Cutuli, M.; Amoriello, T.; Ciaccia, C.; Testani, E.; Ceccarelli, D. Diversification and Soil Management Effects on the Quality of Organic Apricots. Agronomy 2021, 11, 1791. [Google Scholar] [CrossRef]
  38. Crisosto, C.H.; Garner, D.; Crisosto, G.M.; Bowerman, E. Increasing ‘Blackamber’ plum (Prunus salicina Lindell) consumer acceptance. Postharvest Biol. Technol. 2004, 34, 237–244. [Google Scholar] [CrossRef]
  39. Costa, G.; Noferini, M.; Fiori, G.; Ziosi, V.; Berthod, N.; Rossier, J. Establishment of the optimal harvest time in apricot (‘Orangered’and ‘Bergarouge’) by means of a new index based on vis spectroscopy. Acta Hortic. 2010, 862, 533–538. [Google Scholar] [CrossRef]
  40. Crisosto, C.H.; Crisosto, G.; Neri, F. Understanding tree fruit quality based on consumer acceptance. Acta Hortic. 2006, 712, 183–189. [Google Scholar] [CrossRef]
  41. Ceccarelli, D.; Antonucci, F.; Costa, C.; Talento, C.; Ciccoritti, R. An artificial class modelling approach to identify the most largely diffused cultivars of sweet cherry (Prunus avium L.) in Italy. Food Chem. 2020, 333, 127515. [Google Scholar] [CrossRef] [PubMed]
  42. Ferik, F.; Ates, D.; Ercisli, S.; Erdogan, A.; Orhan, E.; Tanyolac, M.B. Genome-wide association links candidate genes to fruit firmness, fruit flesh color, flowering time, and soluble solid content in apricot (Prunus armeniaca L.). Mol. Biol. Rep. 2022, 49, 5283–5291. [Google Scholar] [CrossRef] [PubMed]
  43. Solovchenko, A.; Schmitz-Eiberger, M. Significance of skin flavonoids for UV-B protection in apple fruits. J. Exp. Bot. 2003, 54, 1977–1984. [Google Scholar] [CrossRef] [PubMed]
  44. Intrigliolo, D.S.; Castel, J.R. Response of plum trees to deficit irrigation under two crop levels: Tree growth, yield and fruit quality. Irrig. Sci. 2010, 28, 525–534. [Google Scholar] [CrossRef]
  45. García-Gómez, B.E.; Ruiz, D.; Salazar, J.A.; Rubio, M.; Martínez-García, P.J.; Martínez-Gómez, P. Analysis of metabolites and gene expression changes relative to apricot (Prunus armeniaca L.) fruit quality during development and ripening. Front. Plant Sci. 2020, 11, 1269. [Google Scholar] [CrossRef] [PubMed]
  46. Caliskan, O.; Bayazit, S.; Sumbul, A. Fruit quality and phytochemical attributes of some apricot (Prunus armeniaca L.) cultivars as affected by genotypes and seasons. Not. Bot. Horti Agrobot. Cluj-Napoca 2012, 40, 284–294. [Google Scholar] [CrossRef]
  47. Pennone, F.; Berra, L.; Viti, R.; Guerriero, R. Albicocco. Terra E Vita 2005, 46, 6–14. [Google Scholar]
  48. Alajil, O.; Sagar, V.R.; Kaur, C.; Rudra, S.G.; Sharma, R.R.; Kaushik, R.; Verma, M.K.; Tomar, M.; Kumar, M.; Mekhemar, M. Nutritional and phytochemical traits of apricots (Prunus armeniaca L.) for application in nutraceutical and health industry. Foods 2021, 10, 1344. [Google Scholar] [CrossRef]
  49. Akin, E.B.; Karabulut, I.; Topcu, A. Some compositional properties of main Malatya apricot (Prunus armeniaca L.) varieties. Food Chem. 2008, 107, 939–948. [Google Scholar] [CrossRef]
  50. Milosevic, T.; Milosevic, N.; Glisic, I.; Mladenovic, J. Fruit quality, phenolics content and antioxidant capacity of new apricot cultivars from Serbia. Acta Sci. Polonorum. Hortorum Cultus 2012, 11, 3–15. [Google Scholar]
  51. Drogoudi, P.D.; Vemmos, S.; Pantelidis, G.; Petri, E.; Tzoutzoukou, C.; Karayiannis, I. Physical characters and antioxidant, sugar, and mineral nutrient contents in fruit from 29 apricot (Prunus armeniaca L.) cultivars and hybrids. J. Agric. Food Chem. 2008, 56, 10754–10760. [Google Scholar] [CrossRef] [PubMed]
  52. Ruiz, D.; Egea, J. Phenotypic diversity and relationships of fruit quality traits in apricot (Prunus armeniaca L.) germplasm. Euphytica 2008, 163, 143–158. [Google Scholar] [CrossRef]
  53. Escárate, P.; Farias, G.; Naranjo, P.; Zoffoli, J.P. Estimation of Soluble Solids for Stone Fruit Varieties Based on Near-Infrared Spectra Using Machine Learning Techniques. Sensors 2022, 22, 6081. [Google Scholar] [CrossRef] [PubMed]
  54. Grabska, J.; Beć, K.B.; Ueno, N.; Huck, C.W. Analyzing the Quality Parameters of Apples by Spectroscopy from Vis/NIR to NIR Region: A Comprehensive Review. Foods 2023, 12, 1946. [Google Scholar] [CrossRef] [PubMed]
  55. Song, X.; Huang, Y.; Yan, H.; Xiong, Y.; Min, S. A novel algorithm for spectral interval combination optimization. Anal. Chim. Acta 2016, 948, 19–29. [Google Scholar] [CrossRef]
Figure 1. Schematic diagram of the Vis/NIR hyperspectral imaging system.
Foods 14 00196 g001
Figure 2. ANN-MLP structure.
Foods 14 00196 g002
Figure 3. Mean reflectance spectra between 400 and 1000 nm wavelengths of 17 apricot genotypes, obtained with the HSI device.
Foods 14 00196 g003
Figure 4. Mean second derivative absorbance spectra between 321 and 1100 nm wavelengths of 17 apricot genotypes, obtained with the Vis/NIR spectrophotometer. The Y-axis represents the second derivative absorbance with respect to wavelength.
Foods 14 00196 g004
Figure 5. Predicted vs. experimental values of total soluble solids content (TSS), titratable acidity (TA), and dry matter (DM) using the optimal ANN topologies and Vis/NIR spectra. The coefficients of determination (R2) for training, test, and validation sets are reported.
Foods 14 00196 g005aFoods 14 00196 g005b
Figure 6. Predicted vs. experimental values of total soluble solids content (TSS), titratable acidity (TA), and dry matter (DM) using the optimal ANN topologies and HSI spectra. The coefficients of determination (R2) for the training, test, and validation sets are reported.
Foods 14 00196 g006aFoods 14 00196 g006b
Figure 7. Predicted vs. experimental values of total soluble solid content (TSS), titratable acidity (TA), and dry matter (DM) using external Vis/NIR spectrophotometer dataset (AC), external HSI dataset (DF) and the optimal ANN topologies. The coefficients of determination (R2) are reported.
Foods 14 00196 g007aFoods 14 00196 g007b
Table 1. Geographical origin, ripening time, and parental lines of genotypes analyzed, according to the varietal lists [[19,20], https://plantgest.imagelinenetwork.com (accessed on 10 November 2024)]. * Number of days before ripening of Goldrich (18 June).
GenotypePedigreeOriginRipening Time *
AuroraGoldrich × OuardiItaly (Emilia Romagna)Early (−21)
Bella d’ImolaOpen pollinationItaly (Emilia Romagna)Early-Medium (−7)
BoraEarly Blush × PA7005-2 (Rival × PA 63-265)Italy (Emilia Romagna)Early-Medium (−14)
BulidaUnknownSpainMedium-Late (9)
Cafona IUnknownItaly (Campania)Medium (0)
Krupna SkopjankaUnknownMacedoniaMedium (0)
Marietta MiladyS. Francesco × PolonaisItaly (Tuscany)Medium (6)
MuscatUnknownFranceMedium-Late (9)
NellaUnknownItaly (Campania)Early (−21)
NinfaOuardi × ThyrinthosItalia (Emilia Romagna)Early (−21)
NJA42UnknownItaly (Tuscany)Medium-Late (10)
PorticiUnknownItaly (Campania)Medium-Late (9)
Precoce ToscanaUnknownItaly (Tuscany)Medium (0)
RubistaUnknownUnknownEarly-Medium (−14)
S. CastrenseUnknownItaly (Campania)Medium (6)
Tardiva di BordaneilUnknownFranceEarly (−18)
ThyrinthosUnknownGreeceEarly-Medium (−14)
Table 2. Pomological characteristics (mean ± standard deviations) of 17 apricot genotypes. Differences between letters in the same column indicate significant differences (p < 0.05).
CVWeight (g)Longitudinal
Diameter (mm)
Lateral
Diameter (mm)
Equatorial
Diameter (mm)
Aurora45 ± 23 bcd40 ± 3 cd38 ± 4 cd40 ± 2 cd
Bella di Imola69 ± 12 a51 ± 4 a49 ± 5 a47 ± 2 a
Bora70 ± 11 a50 ± 4 a48 ± 3 a47 ± 3 a
Bulida59 ± 11 b47 ± 4 b48 ± 4 a46 ± 4 ab
Cafona I39 ± 5 d38 ± 3 d39 ± 3 cd38 ± 3 d
Krupna Skopjanka46 ± 8 c42 ± 3 c45 ± 3 ab40 ± 2 cd
Marietta Milady54 ± 6 b44 ± 4 b43 ± 3 bc44 ± 2 b
Muscat30 ± 4 e38 ± 2 d36 ± 3 d34 ± 3 e
Nella56 ± 7 b44 ± 2 bc46 ± 2 ab46 ± 3 ab
Ninfa43 ± 10 cd41 ± 3 cd41 ± 4 bc41 ± 3 c
NJA4257 ± 15 b48 ± 6 ab43 ± 4 bc44 ± 4 b
Portici50 ± 9 bc48 ± 9 ab42 ± 5 bc41 ± 2 c
Precoce Toscana47 ± 4 c46 ± 4 b43 ± 3 bc39 ± 2 d
Rubista53 ± 11 b42 ± 4 c43 ± 3 bc41 ± 3 c
S. Castrense39 ± 5 d39 ± 2 d39 ± 3 cd38 ± 2 d
Tardiva di Bordaneil66 ± 10 ab47 ± 3 b48 ± 3 a48 ± 2 a
Thyrinthos51 ± 8 bc45 ± 4 b44 ± 2 b43 ± 2 bc
Table 3. Mean values ± standard deviations of CIELab coordinates (L*, a*, b*) for each cultivar. Differences between letters in the same column indicate significant differences (p < 0.05).
CVL*a*b*
Aurora55.99 ± 6.54 a12.82 ± 6.18 bcde36.38 ± 6.63 cd
Bella di Imola59.87 ± 4.11 a18.75 ± 3.88 b44.24 ± 4.39 a
Bora57.70 ± 4.12 a19.39 ± 4.18 b41.08 ± 5.12 ab
Bulida59.44 ± 4.93 a11.28 ± 3.31 de43.88 ± 6.28 a
Cafona I59.70 ± 4.77 a10.88 ± 3.96 e33.07 ± 6.25 d
Krupna Skopjanka59.13 ± 4.88 a14.60 ± 2.97 cd40.92 ± 6.20 ab
Marietta Milady60.67 ± 4.66 a14.80 ± 2.40 cd41.14 ± 7.09 ab
Muscat57.30 ± 6.77 a14.24 ± 3.11 cd34.40 ± 7.23 d
Nella57.49 ± 5.60 a15.39 ± 5.79 c40.81 ± 6.34 ab
Ninfa61.78 ± 6.35 a12.15 ± 4.02 cde39.13 ± 7.50 bc
NJA4260.80 ± 4.21 a14.67 ± 2.47 cd42.85 ± 3.92 ab
Portici61.50 ± 7.90 a12.76 ± 3.76 bcde43.10 ± 9.60 ab
Precoce Toscana58.89 ± 4.04 a13.84 ± 4.12 bcd44.44 ± 3.51 a
Rubista36.42 ± 4.49 b29.25 ± 5.33 a13.65 ± 4.99 e
S. Castrense56.99 ± 4.21 a15.35 ± 2.66 c32.97 ± 6.60 d
Tardiva di Bordaneil62.30 ± 9.07 a19.12 ± 5.99 b41.70 ± 6.39 ab
Thyrinthos59.81 ± 9.08 a18.86 ± 8.71 b41.85 ± 9.48 ab
Table 4. Mean values ± standard deviations of quality traits of 17 apricot genotypes. FF (N) = firmness; TSS (g 100 g−1 FW) = total soluble solids content; TA (mEq 100 L−1) = titratable acidity; DM (g 100 g−1 FW) = dry matter; FW = fresh weight. Differences between letters in the same column indicate significant differences (p < 0.05).
CVFF
(N)
TSS
(g 100 g−1 FW)
DM
(g 100 g−1 FW)
TA
(mEq 100 L−1)
Aurora10 ± 4 ef14.9 ± 2.3 cd14.2 ± 1.9 d391 ± 61 a
Bella di Imola46 ± 29 a15.5 ± 2.6 c12.4 ± 1.8 e271 ± 37 d
Bora47 ± 36 a14.1 ± 3.0 d12.0 ± 2.7 ef358 ± 50 b
Bulida13 ± 7 ef17.3 ± 1.0 b17.5 ± 1.7 b203 ± 79 e
Cafona I10 ± 8 f19.2 ± 1.6 a17.7 ± 1.6 b154 ± 22 fg
Krupna Skopjanka8 ± 4 f17.3 ± 0.7 b15.4 ± 1.7 c320 ± 30 c
Marietta Milady31 ± 28 bc15.2 ± 1.6 cd12.4 ± 1.9 e264 ± 37 d
Muscat11 ± 8 ef19.6 ± 2.1 a19.3 ± 2.5 a173 ± 27 f
Nella17 ± 9 def12.3 ± 2.7 e10.5 ± 2.4 gh260 ± 26 d
Ninfa22 ± 9 cde11.4 ± 3.3 e9.4 ± 1.9 i206 ± 76 e
NJA4238 ± 34 ab15.1 ± 1.2 cd12.0 ± 1.4 ef202 ± 59 e
Portici19 ± 15 def19.5 ± 1.8 a17.0 ± 2.5 b130 ± 30 g
Precoce Toscana15 ± 9 ef15.1 ± 1.7 cd12.1 ± 0.9 ef272 ± 53 d
Rubista14 ± 15 ef15.9 ± 1.3 c12.9 ± 1.8 e417 ± 43 a
S. Castrense19 ± 9 def19.0 ± 1.9 a15.9 ± 2.2 c275 ± 53 d
Tardiva di Bordaneil26 ± 13 cd12.4 ± 2.6 e11.0 ± 1.9 fg285 ± 64 d
Thyrinthos26 ± 7 cd11.2 ± 2.1 e9.8 ± 1.6 hi315 ± 30 c
Table 5. Neural network architectures, regression metrics for the highest training, test, and validation set predictions, goodness of fit, and residual analysis for the developed ANN models based on Vis/NIR data. MLP = multilayer perceptron; Tanh = hyperbolic tangent function; Exp = exponential function; TSS = total soluble solids content (g 100 g−1 FW); TA = titratable acidity (mEq L−1); DM = dry matter (g 100 g−1 FW); r = coefficient of correlation; R2 = coefficient of determination; MAE = mean absolute error; RMSE = root mean squared error.
TSSDMTA
Topology
(input–hidden–output)
MLP (260–17–1)MLP (260–27–1)MLP (260–17–1)
Activation FunctionHidden Neurons
Output Neurons
Logistic
Logistic
Exp
Tahn
Logistic
Logistic
Training setr0.9470.8980.819
R20.8980.8060.671
RMSE1.0481.53551.814
MAE0.0490.0451.110
Test setr0.9250.9260.825
R20.8550.8570.681
RMSE1.3191.37955.073
MAE0.0800.0470.376
Validation setr0.9390.9290.810
R20.8830.8630.656
RMSE1.2861.31053.588
MAE0.0310.0322.374
Table 6. Neural network architectures, regression metrics for the highest training, test, and validation sets predictions, goodness of fit, and residual analysis for the developed ANN models based on HSI data. MLP = multilayer perceptron; Tanh = hyperbolic tangent function; Exp = exponential function; TSS = total soluble solids content (g 100 g−1 FW); TA = titratable acidity (mEq L−1); DM = dry matter (g 100 g−1 FW); r = coefficient of correlation; R2 = coefficient of determination; MAE = mean absolute error; RMSE = root mean squared error.
TSSDMTA
Topology
(input–hidden–output)
MLP (260–31–1)MLP (260–20–1)MLP (260–50–1)
Activation FunctionHidden Neurons
Output Neurons
Identity
Identity
Identity
Identity
Logistic
Logistic
Training setr0.9620.9500.930
R20.9260.9020.864
RMSE0.9351.18734.32
MAE0.0840.1590.655
Test setr0.9510.9580.901
R20.9040.9180.811
RMSE1.1031.03938.974
MAE0.0550.0092.237
Validation setr0.9590.9310.925
R20.9190.8660.855
RMSE1.1121.28832.741
MAE0.3000.0900.953
Table 7. Main sensitive spectral ranges from sensitivity analysis for each ANN model; TSS = total soluble solids content; TA = titratable acidity; DM = dry matter.
TSSDMTA
Vis/NIR spectrophotometer
(310–1100 nm)
410–420
740–760
850–920
950–970
380–420
470–490
740–770
840–1000
320–350
410–500
530–550
655–665
720–920
990–1060
HSI device
(400–1000 nm)
460–480
730–790
800–920
940–990
400–440
730–780
850–890
900–980
400–430
480–520
540–570
630–700
730–770
870–950
Disclaimer/Publisher’s Note: The statements, opinions and data contained in all publications are solely those of the individual author(s) and contributor(s) and not of MDPI and/or the editor(s). MDPI and/or the editor(s) disclaim responsibility for any injury to people or property resulting from any ideas, methods, instructions or products referred to in the content.

