
Upcycling Scented Pandan Leaf Waste into High-Value Cellulose Nanocrystals via Ultrasound-Assisted Extraction for Edible Film Reinforcement
 , ,
, ,
Abstract
:1. Introduction
2. Materials and Methods
2.1. Raw Materials and Chemicals
2.2. Extraction of Cellulose from Dried Scented Pandan Leaves
2.3. Optimization of UAE Conditions for CNCs
2.3.1. Experimental Design, Mathematical Modeling, Fitting, and Statistical Analysis
2.3.2. UAE of CNC from Scented Pandan Leaves
2.3.3. Analysis of CNC Properties
Yield of CNCs
Crystallinity Index and Crystallite Size
Fourier Transform Infrared (FT-IR) Spectroscopy
X-Ray Diffraction (XRD)
Zeta Potential and Polydispersity Index
2.4. Preparation of SPS Film Reinforced with CNC
2.5. Characterization of Films
2.5.1. Characterization of Film Structural Properties
FT-IR Analysis of Films
XRD Analysis of Films
Scanning Electron Microscopy (SEM)
2.5.2. Physical and Chemical Properties
Film Thickness
Moisture Content
Water Vapor Permeability (WVP)
Mechanical Properties Analysis
Light Transmittance Analysis
Color
Statistical Analysis
3. Results and Discussion
3.1. Model Fitting and Response Surface Analysis
3.2. Optimization of UAE Conditions and Model Validation
3.3. CNC Properties
3.3.1. Cellulosic and Non-Cellulosic Components in Scented Pandan CNCs
3.3.2. Zeta Potential
3.3.3. Average Particle Diameter and Polydispersity Index
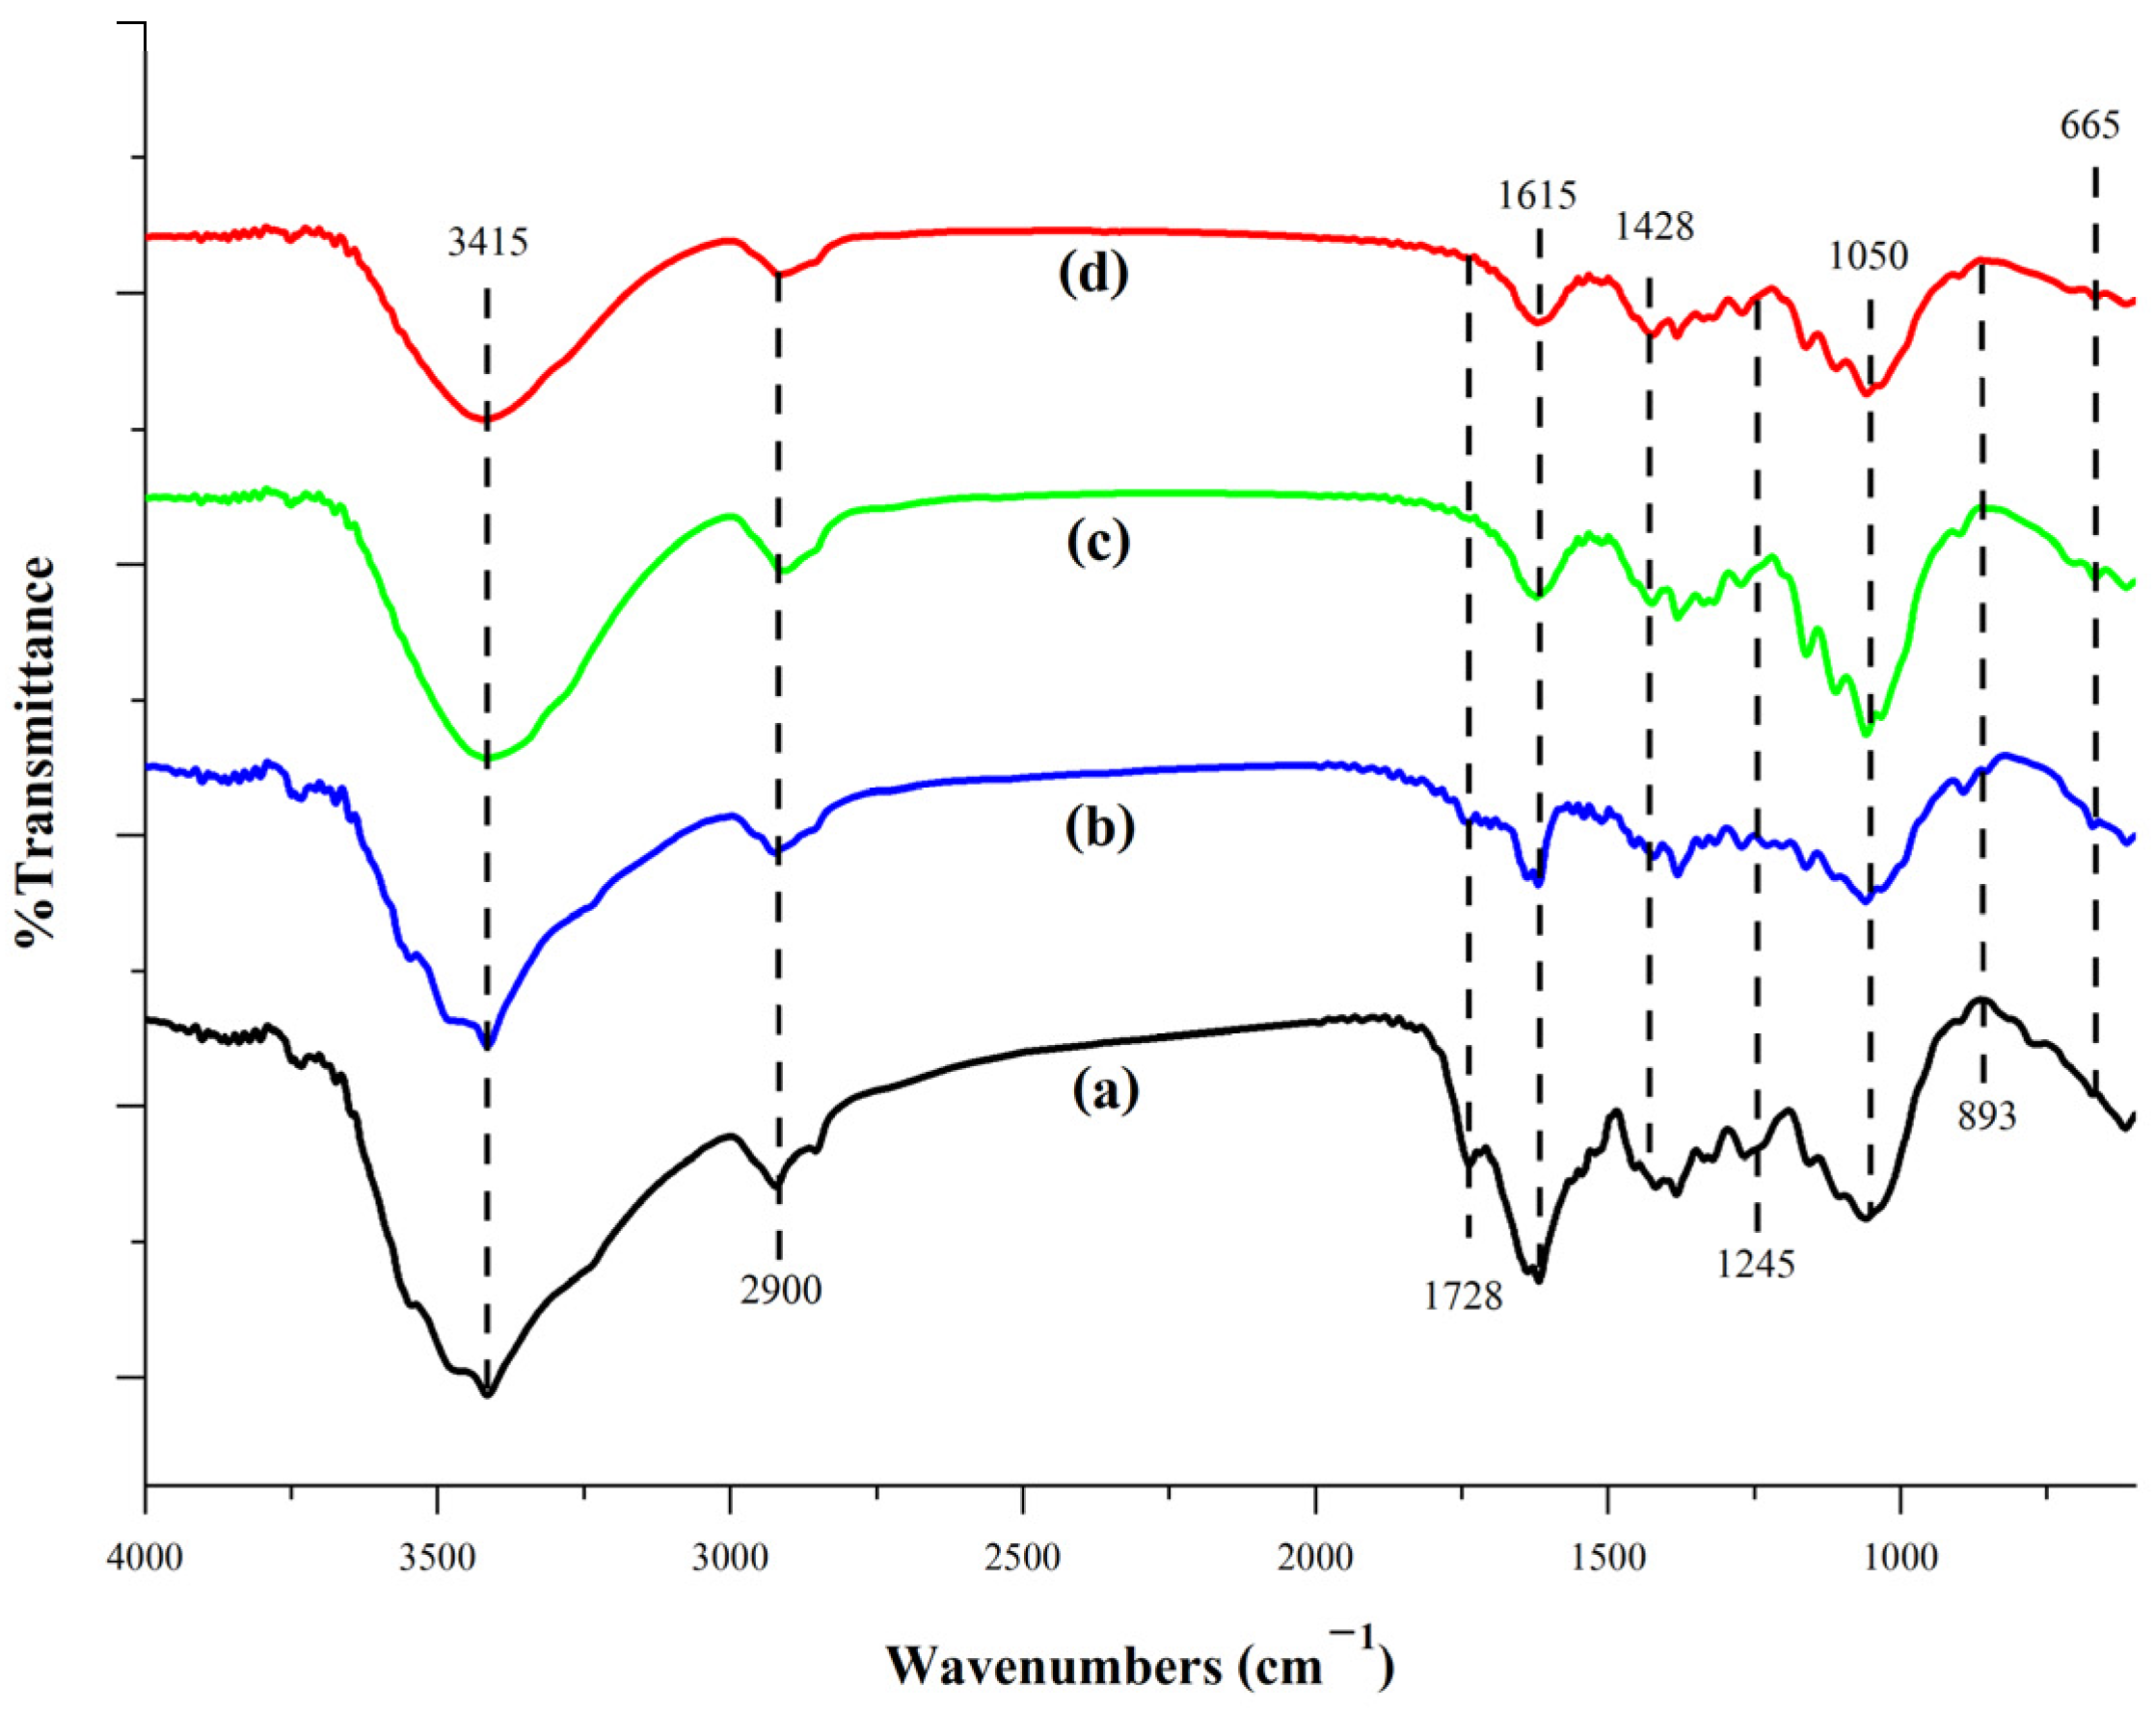
3.3.4. FT-IR Analysis
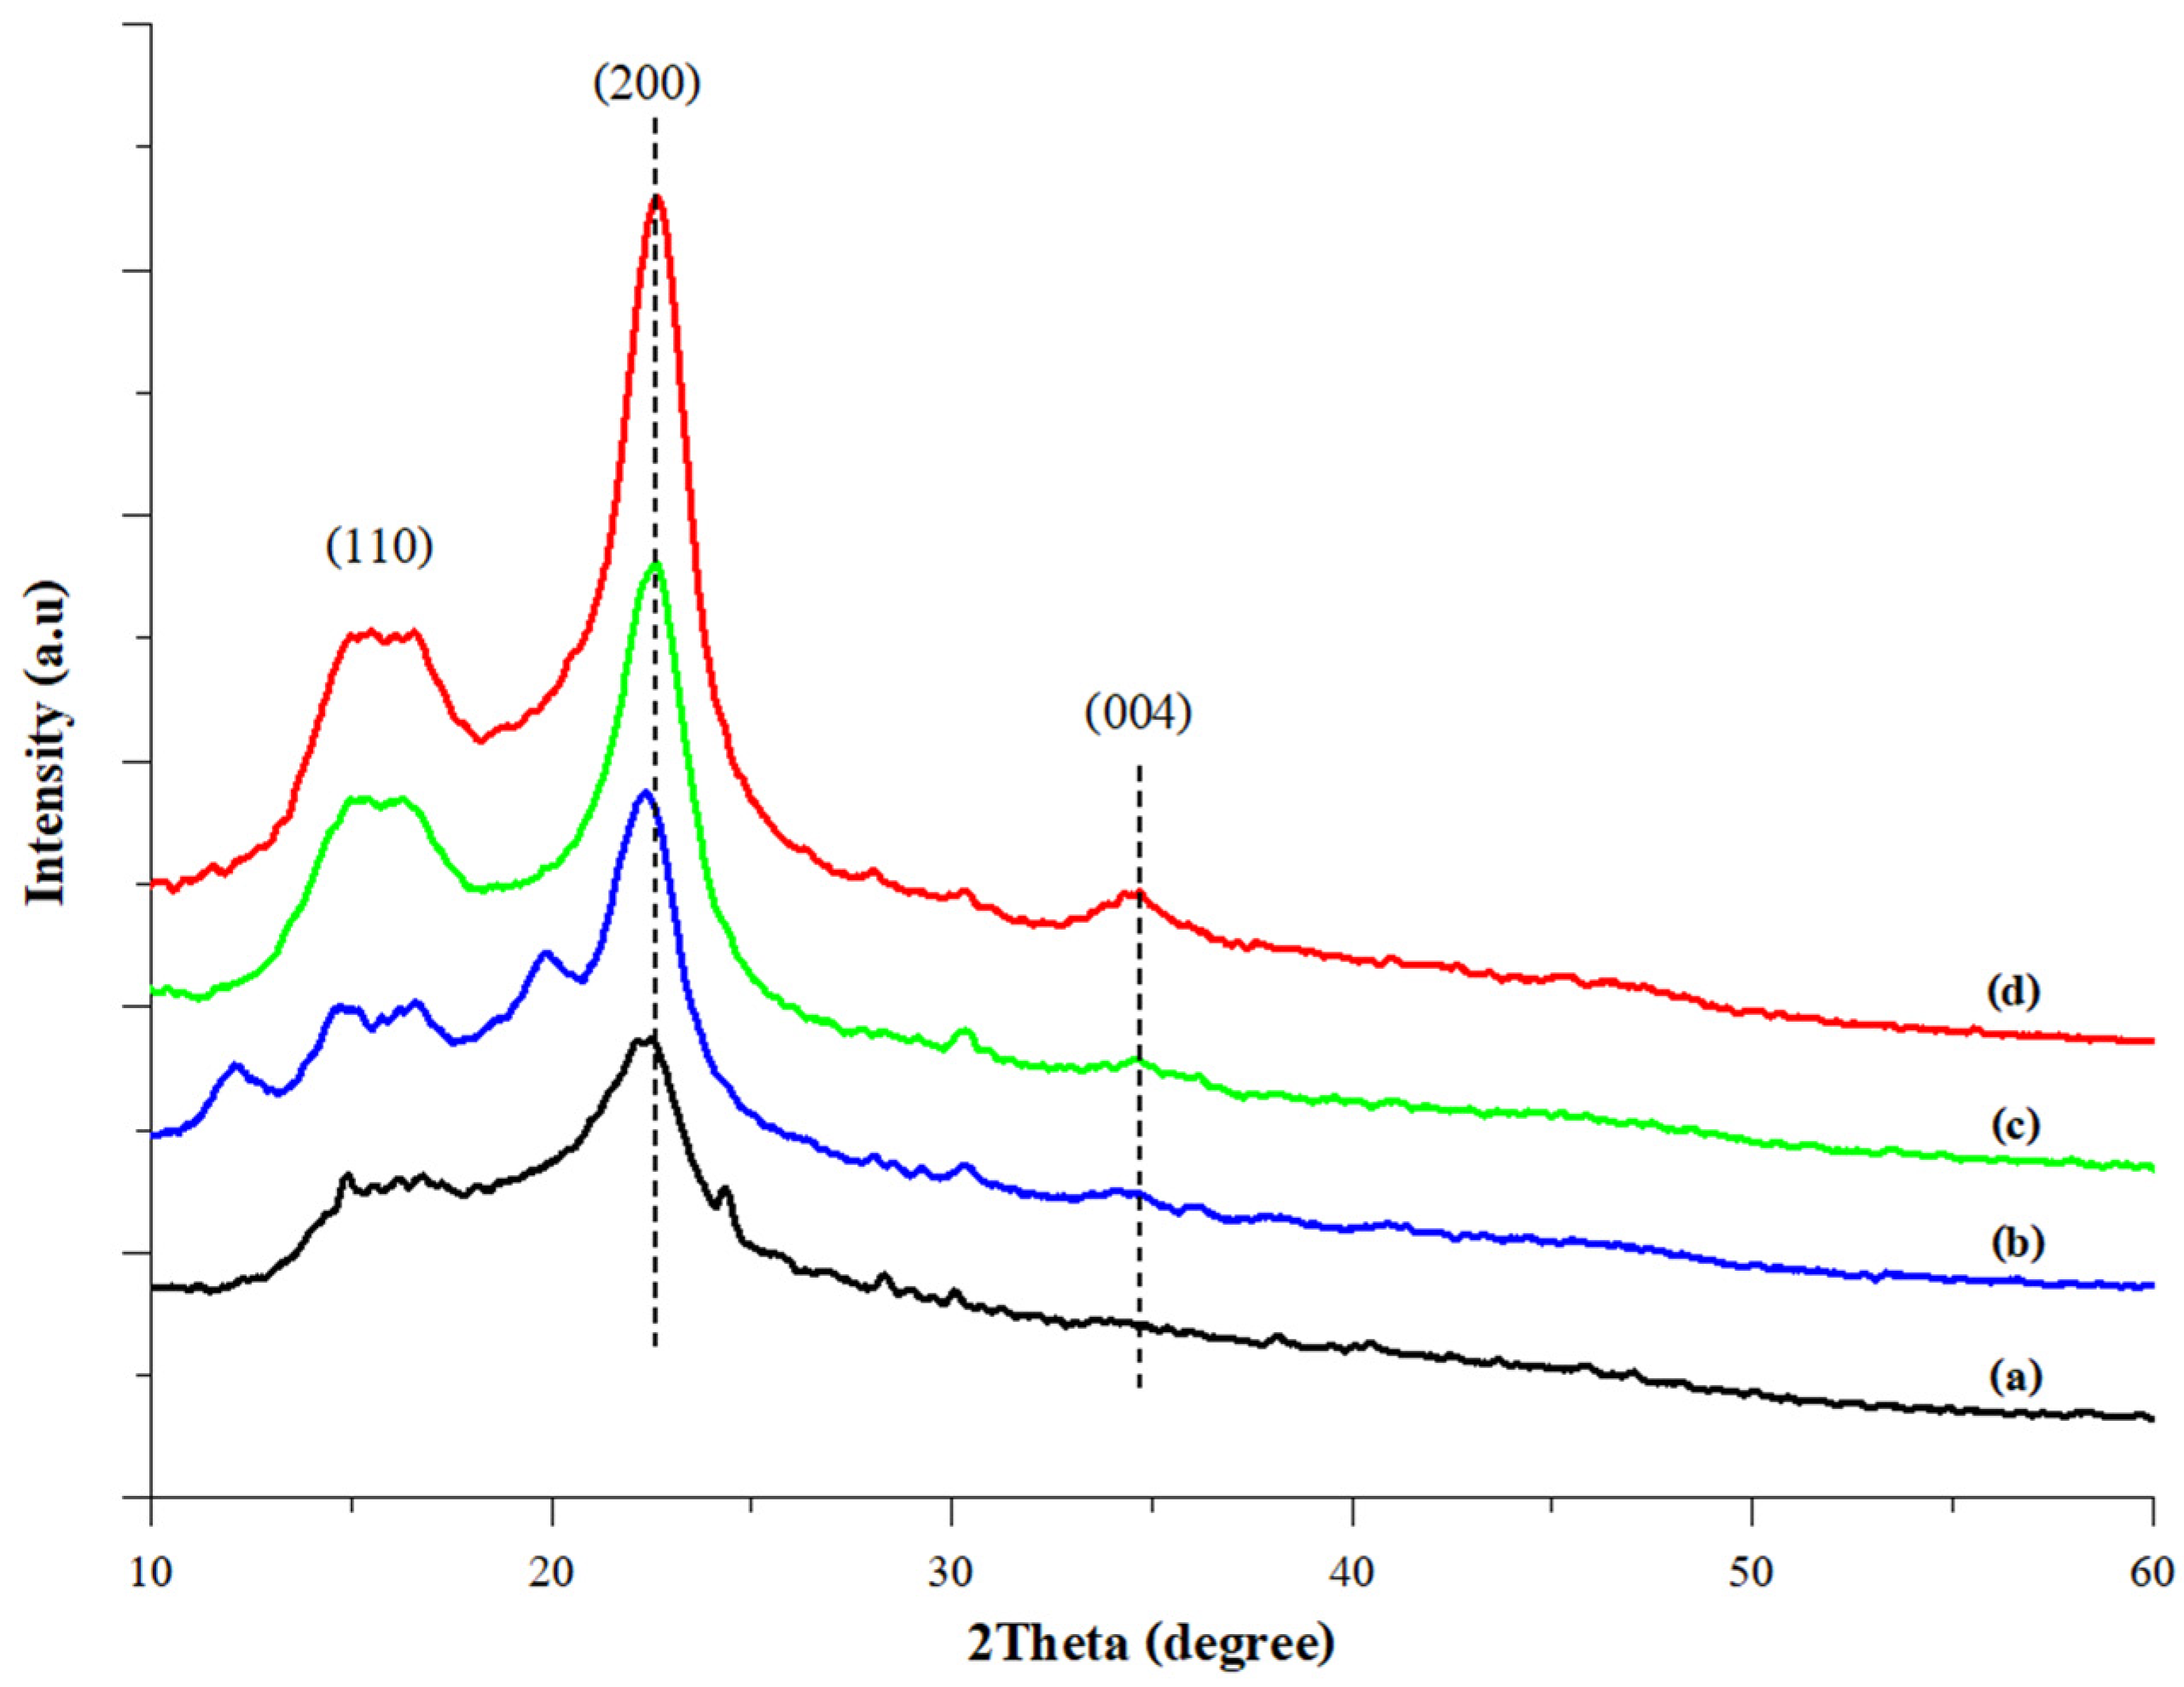
3.3.5. XRD Analysis
3.4. Influences of CNC Incorporation on Sweet Potato Starch-Based Film Properties
3.4.1. Structural Properties of Films
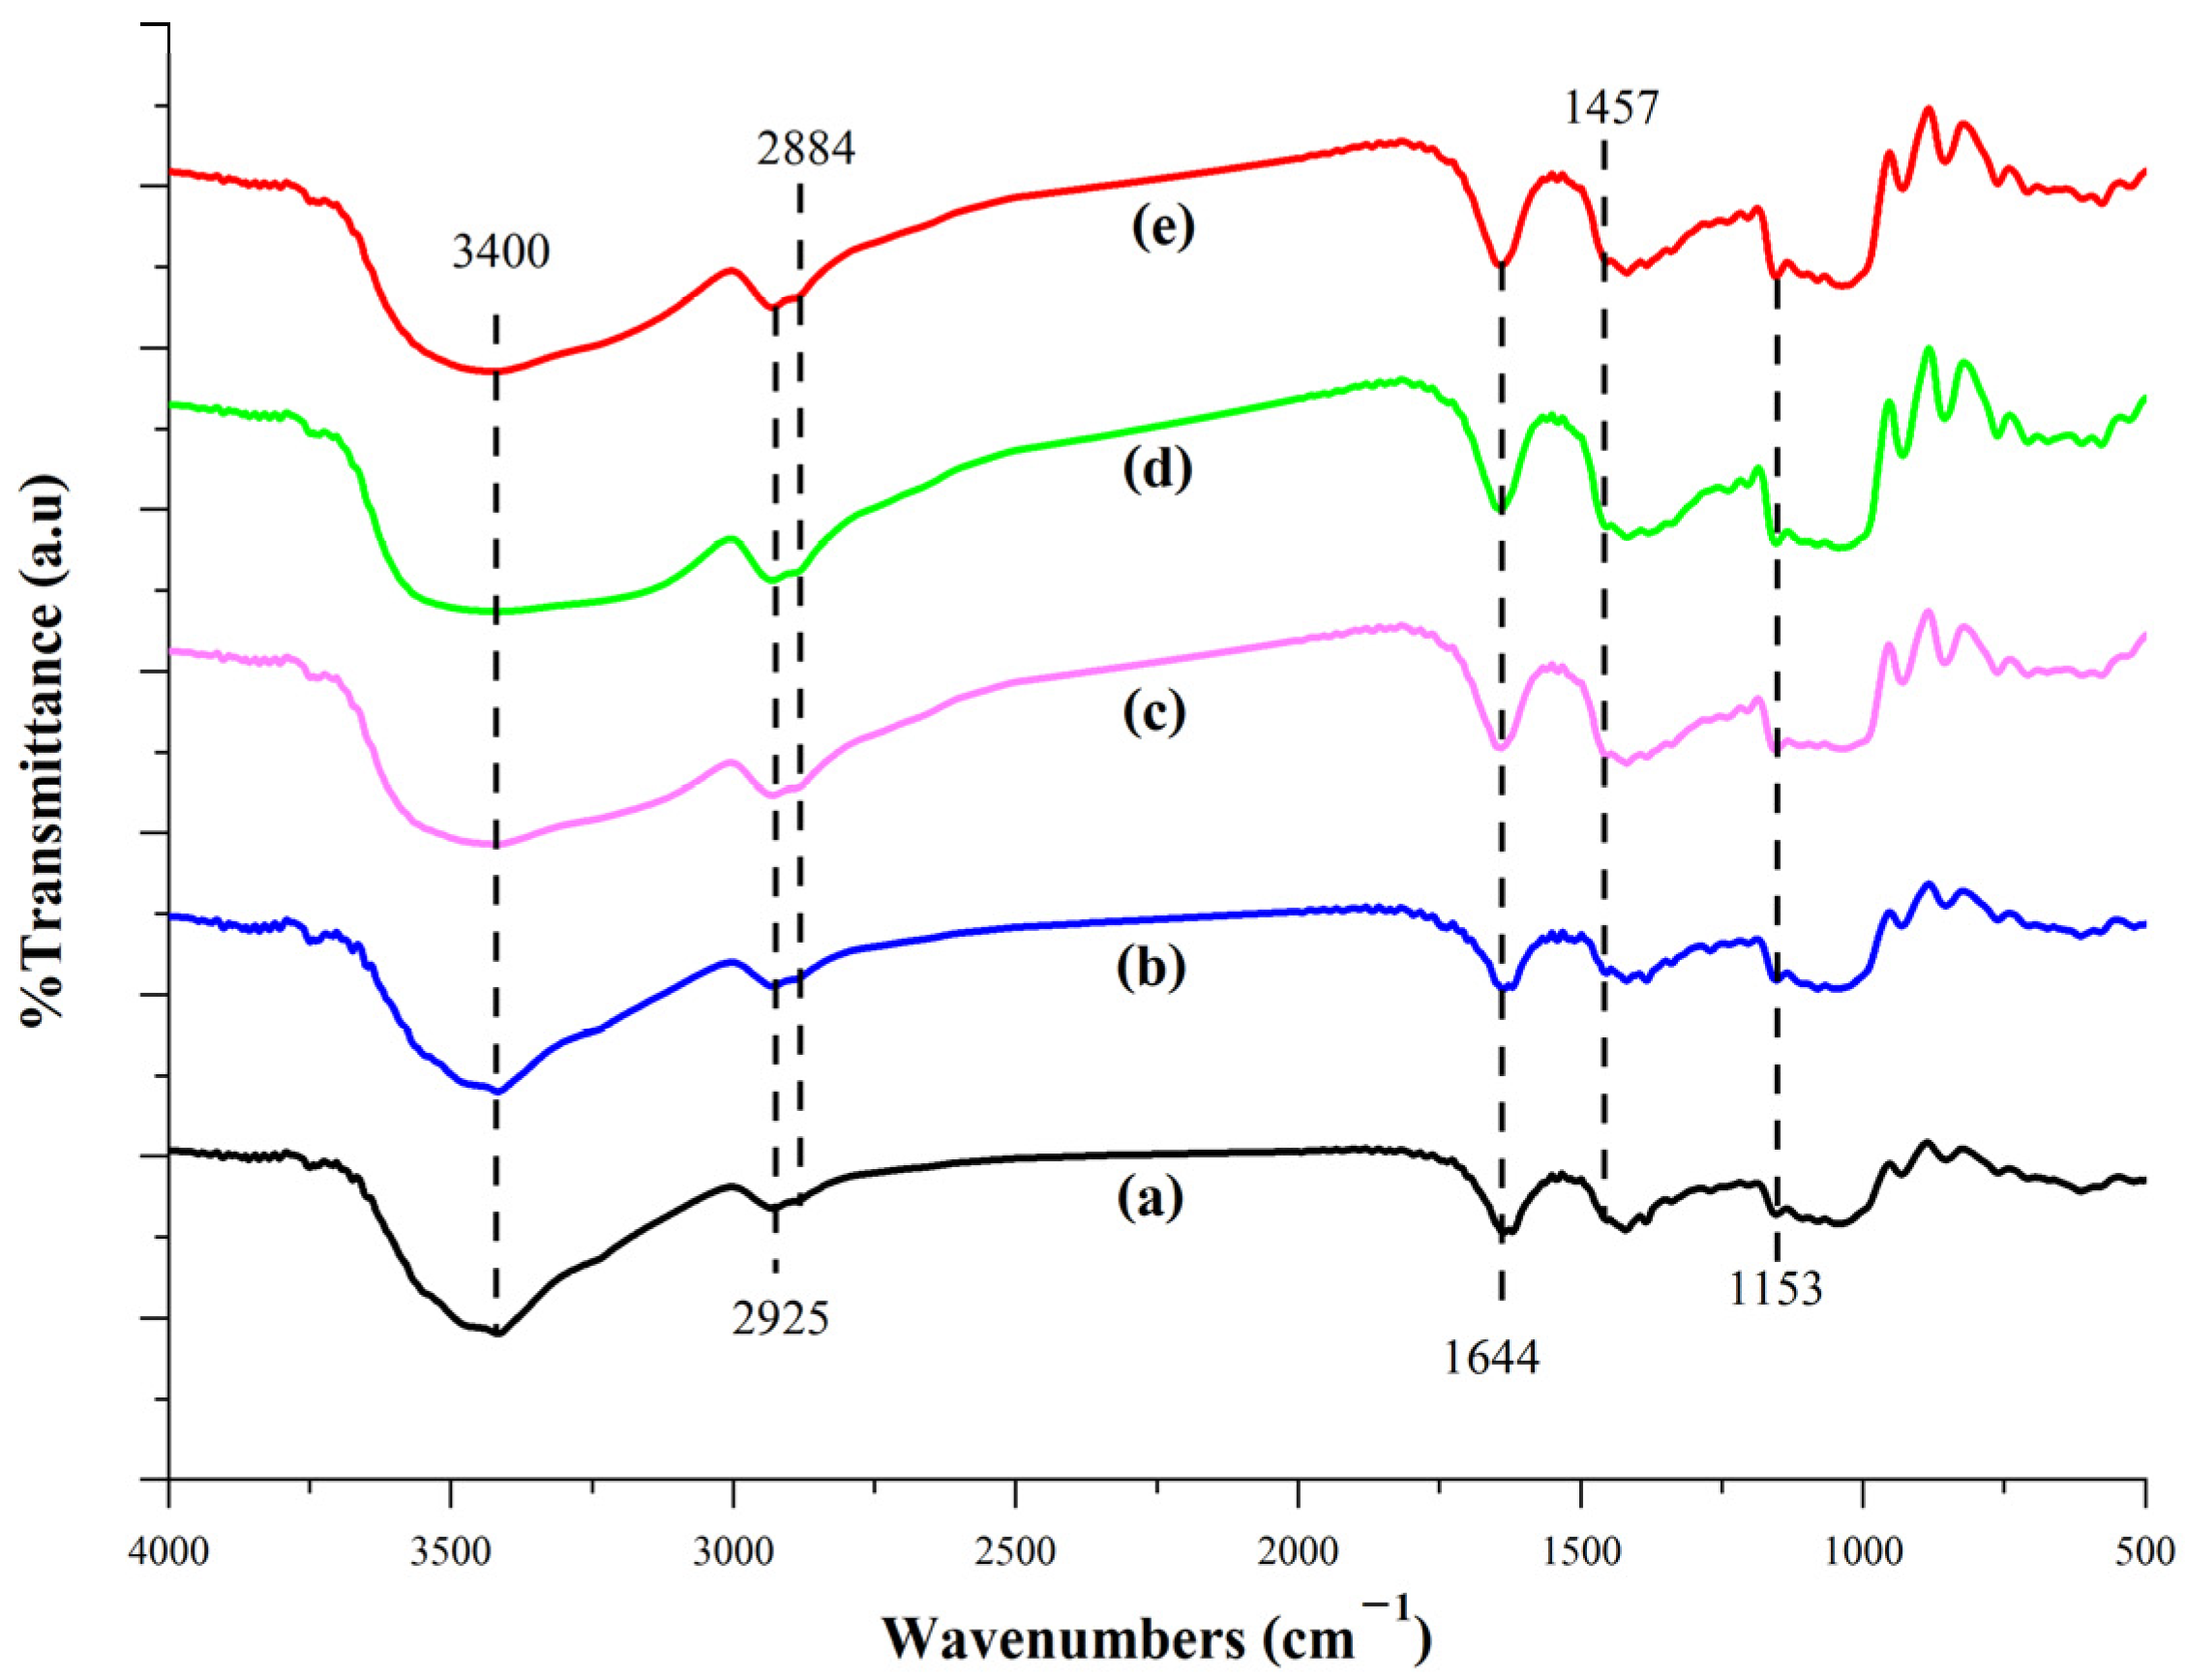
FT-IR
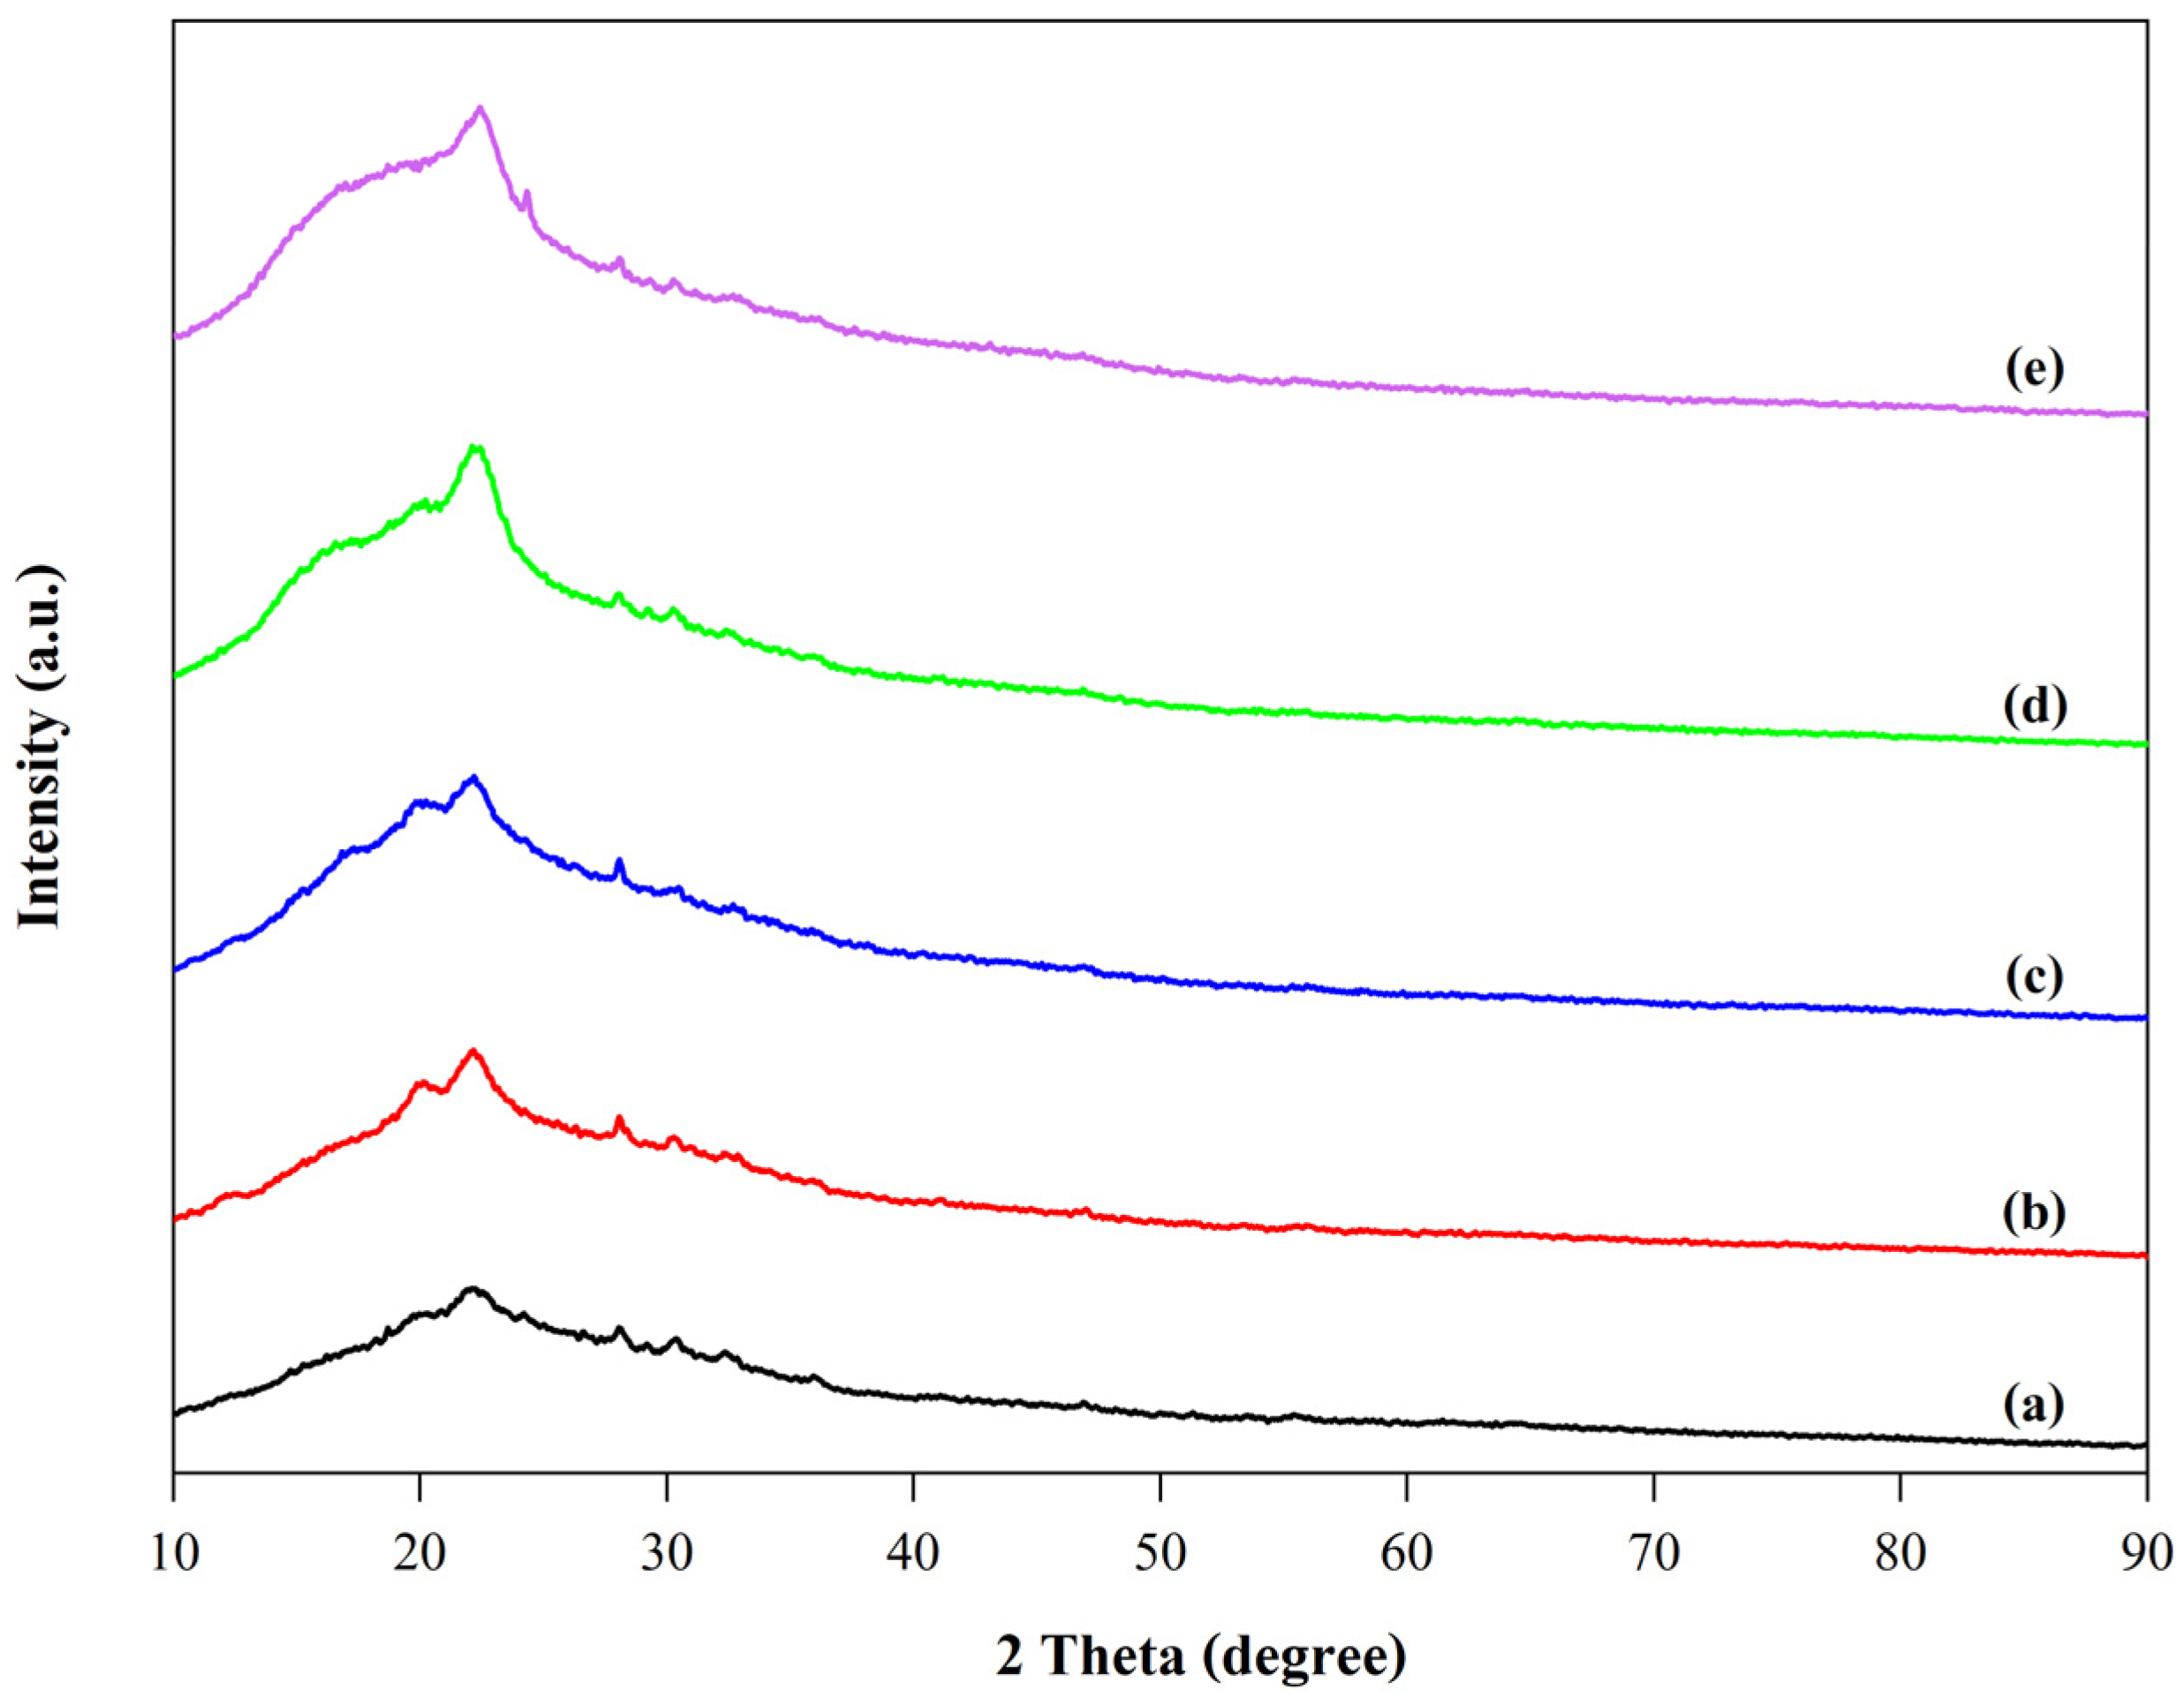
XRD
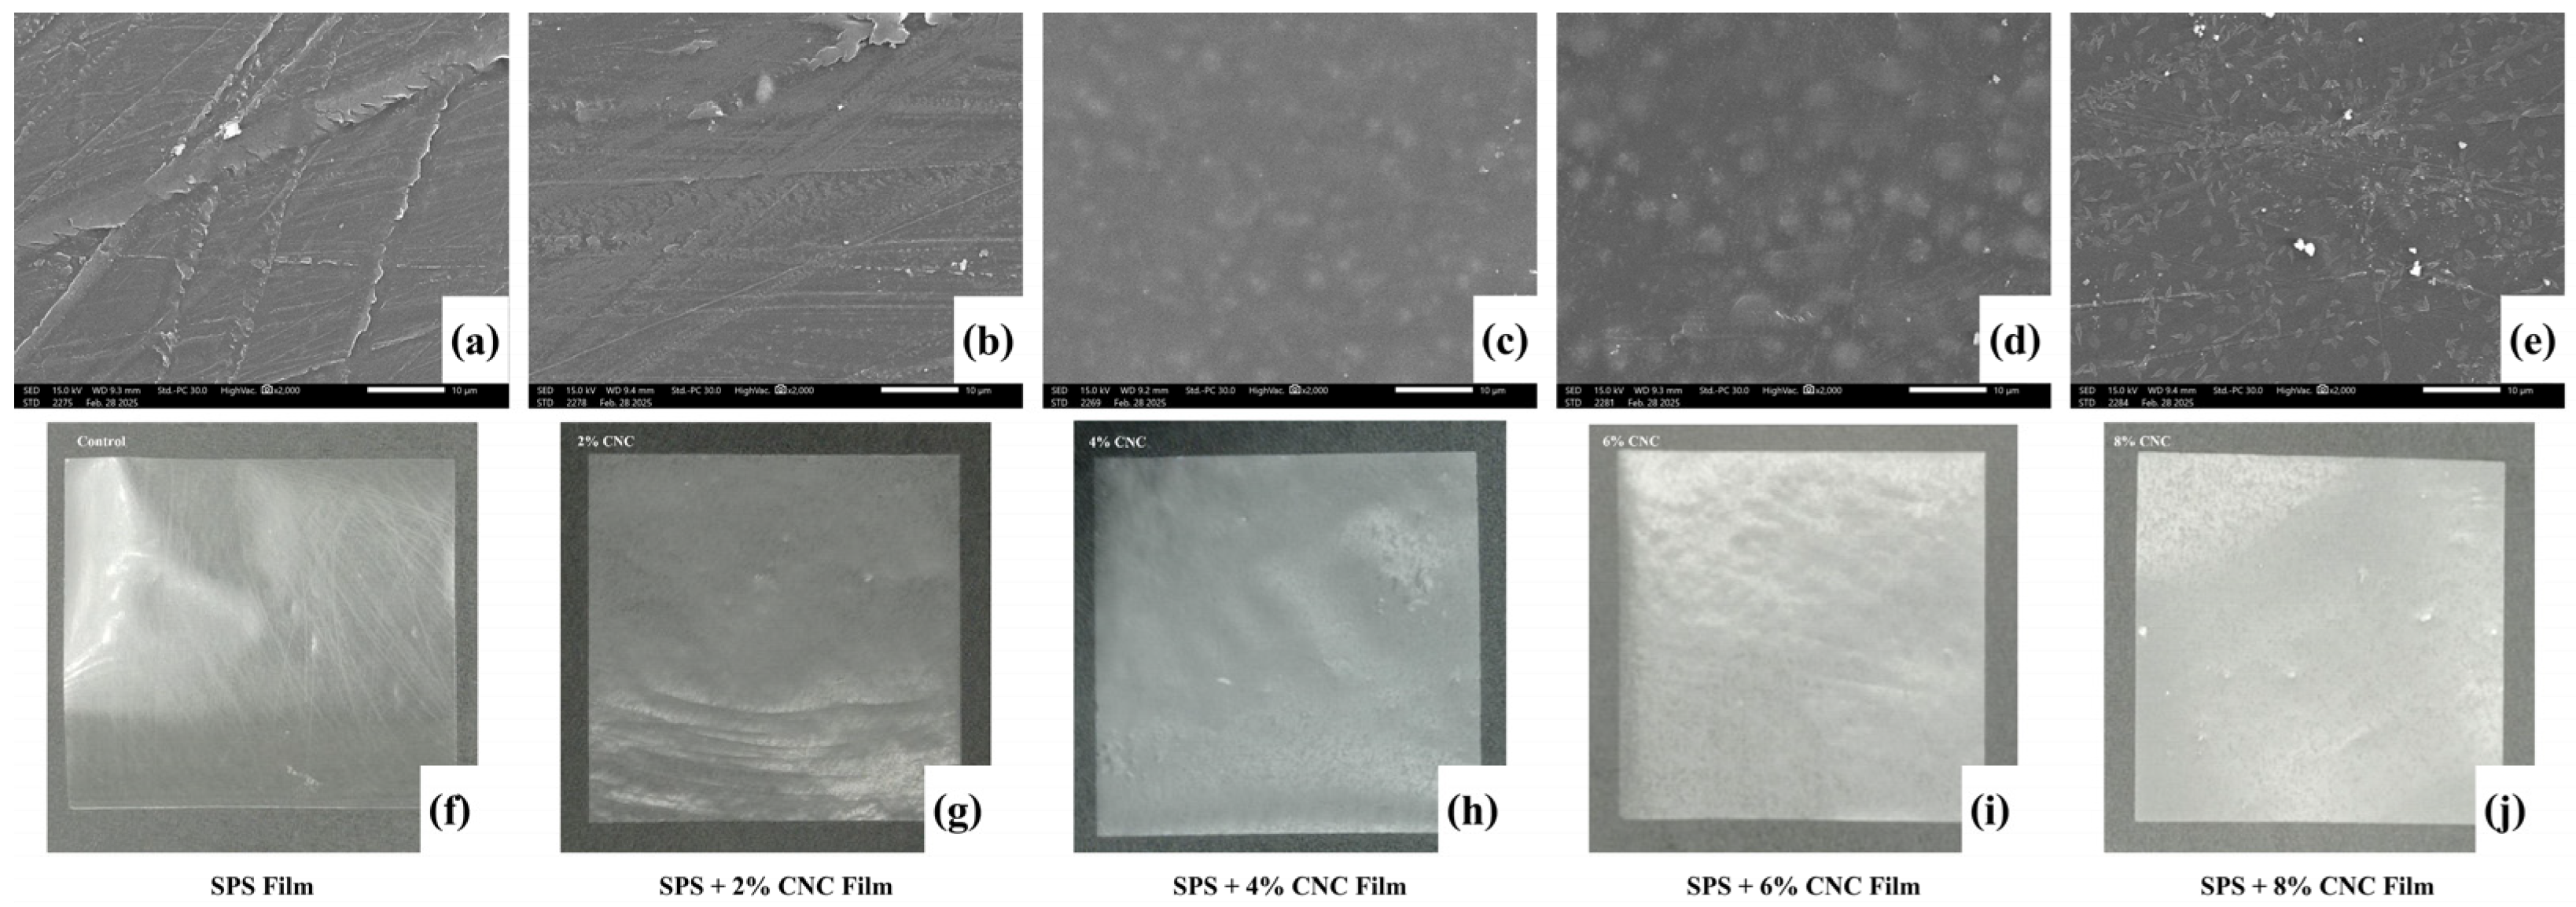
Surface Morphology
3.4.2. Physical and Chemical Properties of the Films
Film Thickness and Moisture Content
Water Vapor Permeability
Mechanical Properties
Light Transmittance
Color Properties
4. Conclusions
Author Contributions
Funding
Institutional Review Board Statement
Informed Consent Statement
Data Availability Statement
Acknowledgments
Conflicts of Interest
References
- Perumal, A.B.; Nambiar, R.B.; Moses, J.A.; Anandharamakrishnan, C. Nanocellulose: Recent trends and applications in the food industry. Food Hydrocoll. 2022, 127, 107484. [Google Scholar] [CrossRef]
- Gupta, V.; Ramakanth, D.; Verma, C.; Maji, P.K.; Gaikwad, K.K. Isolation and characterization of cellulose nanocrystals from amla (Phyllanthus emblica) pomace. Biomass Convers. Biorefinery 2021, 13, 15451–15462. [Google Scholar] [CrossRef]
- Klemm, D.; Heublein, B.; Fink, H.P.; Bohn, A. Cellulose: Fascinating biopolymer and sustainable raw material. Angew. Chem. Int. Ed. Engl. 2005, 44, 3358–3393. [Google Scholar] [CrossRef] [PubMed]
- George, J.; Sabapathi, S.N. Cellulose nanocrystals: Synthesis, functional properties, and applications. Nanotechnol. Sci. Appl. 2015, 8, 45–54. [Google Scholar] [CrossRef] [PubMed]
- Huang, S.; Tao, R.; Ismail, A.; Wang, Y. Cellulose Nanocrystals Derived from Textile Waste through Acid Hydrolysis and Oxidation as Reinforcing Agent of Soy Protein Film. Polymers 2020, 12, 958. [Google Scholar] [CrossRef]
- Xu, J.T.; Chen, X.Q.; Shen, W.H.; Li, Z. Spherical vs rod-like cellulose nanocrystals from enzymolysis: A comparative study as reinforcing agents on polyvinyl alcohol. Carbohydr. Polym. 2021, 256, 117493. [Google Scholar] [CrossRef] [PubMed]
- Elazzouzi-Hafraoui, S.; Nishiyama, Y.; Putaux, J.-L.; Heux, L.; Dubreuil, F.; Rochas, C. The shape and size distribution of crystalline nanoparticles prepared by acid hydrolysis of native cellulose. Biomacromolecules 2008, 9, 57–65. [Google Scholar] [CrossRef]
- Kaur, R.; Shekhar, S.; Chaudhary, S.; Singh, B.; Prasad, K. Non-thermal Food Preservation Technologies. In Smart and Sustainable Food Technologies; Sehgal, S., Singh, B., Sharma, V., Eds.; Springer Nature: Singapore, 2022; pp. 157–195. [Google Scholar]
- Tomšik, A.; Pavlić, B.; Vladić, J.; Ramić, M.; Brindza, J.; Vidović, S. Optimization of ultrasound-assisted extraction of bioactive compounds from wild garlic (Allium ursinum L.). Ultrason. Sonochem. 2016, 29, 502–511. [Google Scholar] [CrossRef]
- Sai Prasanna, N.; Mitra, J. Isolation and characterization of cellulose nanocrystals from Cucumis sativus peels. Carbohydr. Polym. 2020, 247, 116706. [Google Scholar] [CrossRef]
- Khawas, P.; Deka, S.C. Isolation and characterization of cellulose nanofibers from culinary banana peel using high-intensity ultrasonication combined with chemical treatment. Carbohydr. Polym. 2016, 137, 608–616. [Google Scholar] [CrossRef]
- Agustin, M.B.; Ahmmad, B.; De Leon, E.R.P.; Buenaobra, J.L.; Salazar, J.R.; Hirose, F. Starch-based biocomposite films reinforced with cellulose nanocrystals from garlic stalks. Polym. Compos. 2013, 34, 1325–1332. [Google Scholar] [CrossRef]
- Reddy, J.P.; Rhim, J.W. Characterization of bionanocomposite films prepared with agar and paper-mulberry pulp nanocellulose. Carbohydr. Polym. 2014, 110, 480–488. [Google Scholar] [CrossRef] [PubMed]
- Coelho, C.C.S.; Michelin, M.; Cerqueira, M.A.; Goncalves, C.; Tonon, R.V.; Pastrana, L.M.; Freitas-Silva, O.; Vicente, A.A.; Cabral, L.M.C.; Teixeira, J.A. Cellulose nanocrystals from grape pomace: Production, properties and cytotoxicity assessment. Carbohydr. Polym. 2018, 192, 327–336. [Google Scholar] [CrossRef] [PubMed]
- Rhim, J.-W.; Reddy, J.P.; Luo, X. Isolation of cellulose nanocrystals from onion skin and their utilization for the preparation of agar-based bio-nanocomposites films. Cellulose 2014, 22, 407–420. [Google Scholar] [CrossRef]
- Dai, H.; Ou, S.; Huang, Y.; Huang, H. Utilization of pineapple peel for production of nanocellulose and film application. Cellulose 2018, 25, 1743–1756. [Google Scholar] [CrossRef]
- Leao, R.M.; Mileo, P.C.; Maia, J.; Luz, S.M. Environmental and technical feasibility of cellulose nanocrystal manufacturing from sugarcane bagasse. Carbohydr. Polym. 2017, 175, 518–529. [Google Scholar] [CrossRef]
- Ravindran, P.N.; Pillai, G.S.; Divakaran, M. 28—Other herbs and spices: Mango ginger to wasabi. In Handbook of Herbs and Spices, 2nd ed.; Peter, K.V., Ed.; Woodhead Publishing: Sawston, UK, 2012; pp. 557–582. [Google Scholar]
- Wakte, K.V.; Nadaf, A.B.; Thengane, R.J.; Jawali, N. In vitro regenerating plantlets in Pandanus amaryllifolius Roxb. as a model system to study the development of lower epidermal papillae. In Vitro Cell. Dev. Biol.—Plant 2009, 45, 701–707. [Google Scholar] [CrossRef]
- Djenar, N.S.; Mulyono, E.W.S.; Saputra, T.R. The effect of microwave power variations on phytochemical characteristic of pandan leaves (Pandanus Amaryllifolius) using the Microwave-Assisted Extraction (MAE). J. Phys. Conf. Ser. 2020, 1450, 012007. [Google Scholar] [CrossRef]
- Li, H.; Wang, J.; Liu, Y.; Chen, J.; Wang, C.; Hu, Y.; Hu, K. Production of biodegradable potato starch films containing Lycium barbarum polysaccharide and investigation of their physicochemical properties. Food Packag. Shelf Life 2024, 44, 101320. [Google Scholar] [CrossRef]
- Yao Désiré, A.; Charlemagne, N.; Degbeu Claver, K.; Fabrice Achille, T.; Marianne, S. Starch-based edible films of improved cassava varieties Yavo and TMS reinforced with microcrystalline cellulose. Heliyon 2021, 7, e06804. [Google Scholar] [CrossRef]
- Zhang, Z.; Wang, Y.; Fang, X.; Chen, X.; Yin, Z.; Zhang, C. Preparation of edible film from sweet potato peel polyphenols: Application in fresh fruit preservation. Front. Sustain. Food Syst. 2024, 8, 1470732. [Google Scholar] [CrossRef]
- Chen, Q.; Shi, Y.; Chen, G.; Cai, M. Enhanced mechanical and hydrophobic properties of composite cassava starch films with stearic acid modified MCC (microcrystalline cellulose)/NCC (nanocellulose) as strength agent. Int. J. Biol. Macromol. 2020, 142, 846–854. [Google Scholar] [CrossRef] [PubMed]
- Ma, X.; Chang, P.R.; Yu, J. Properties of biodegradable thermoplastic pea starch/carboxymethyl cellulose and pea starch/microcrystalline cellulose composites. Carbohydr. Polym. 2008, 72, 369–375. [Google Scholar] [CrossRef]
- Reis, M.O.; Olivato, J.B.; Zanela, J.; Yamashita, F.; Grossmann, M.V.E. Influence of microcrystalline cellulose in thermoplastic starch/polyester blown films. Polímeros 2017, 27, 129–135. [Google Scholar] [CrossRef]
- Rico, M.; Rodríguez-Llamazares, S.; Barral, L.; Bouza, R.; Montero, B. Processing and characterization of polyols plasticized-starch reinforced with microcrystalline cellulose. Carbohydr. Polym. 2016, 149, 83–93. [Google Scholar] [CrossRef] [PubMed]
- Syafri, E.; Anwar, K.; Alfi, A.; Senthamaraikannan, P.; Sanjay, M.R. Studies on Ramie cellulose microfibrils reinforced cassava starch composite: Influence of microfibrils loading. J. Nat. Fibers 2020, 17, 122–131. [Google Scholar] [CrossRef]
- Syafri, E.; Kasim, A.; Abral, H.; Sudirman; Sulungbudi, G.T.; Sanjay, M.R.; Sari, N.H. Synthesis and characterization of cellulose nanofibers (CNF) ramie reinforced cassava starch hybrid composites. Int. J. Biol. Macromol. 2018, 120, 578–586. [Google Scholar] [CrossRef]
- Da Silva, J.B.; Pereira, F.V.; Druzian, J.I. Cassava starch-based films plasticized with sucrose and inverted sugar and reinforced with cellulose nanocrystals. J. Food Sci. 2012, 77, N14–N19. [Google Scholar] [CrossRef]
- Silva, A.P.M.; Oliveira, A.V.; Pontes, S.M.; Pereira, A.L.; Rosa, M.F.; Azeredo, H.M. Mango kernel starch films as affected by starch nanocrystals and cellulose nanocrystals. Carbohydr. Polym. 2019, 211, 209–216. [Google Scholar] [CrossRef]
- Slavutsky, A.M.; Bertuzzi, M.A. Water barrier properties of starch films reinforced with cellulose nanocrystals obtained from sugarcane bagasse. Carbohydr. Polym. 2014, 110, 53–61. [Google Scholar] [CrossRef]
- Shen, L.; Pang, S.; Zhong, M.; Sun, Y.; Qayum, A.; Liu, Y.; Rashid, A.; Xu, B.; Liang, Q.; Ma, H.; et al. A comprehensive review of ultrasonic assisted extraction (UAE) for bioactive components: Principles, advantages, equipment, and combined technologies. Ultrason. Sonochem. 2023, 101, 106646. [Google Scholar] [CrossRef]
- Filson, P.B.; Dawson-Andoh, B.E. Sono-chemical preparation of cellulose nanocrystals from lignocellulose derived materials. Bioresour. Technol. 2009, 100, 2259–2264. [Google Scholar] [CrossRef] [PubMed]
- Fitriani, F.; Aprilia, S.; Arahman, N.; Bilad, M.R.; Amin, A.; Huda, N.; Roslan, J. Isolation and Characterization of Nanocrystalline Cellulose Isolated from Pineapple Crown Leaf Fiber Agricultural Wastes Using Acid Hydrolysis. Polymers 2021, 13, 4188. [Google Scholar] [CrossRef] [PubMed]
- Albuquerque, B.R.; Pinela, J.; Barros, L.; Oliveira, M.B.P.P.; Ferreira, I.C.F.R. Anthocyanin-rich extract of jabuticaba epicarp as a natural colorant: Optimization of heat- and ultrasound-assisted extractions and application in a bakery product. Food Chem. 2020, 316, 126364. [Google Scholar] [CrossRef]
- Pandi, N.; Sonawane, S.H.; Anand Kishore, K. Synthesis of cellulose nanocrystals (CNCs) from cotton using ultrasound-assisted acid hydrolysis. Ultrason. Sonochem. 2021, 70, 105353. [Google Scholar] [CrossRef]
- Coelho, C.C.d.S.; Silva, R.B.S.; Carvalho, C.W.P.; Rossi, A.L.; Teixeira, J.A.; Freitas-Silva, O.; Cabral, L.M.C. Cellulose nanocrystals from grape pomace and their use for the development of starch-based nanocomposite films. Int. J. Biol. Macromol. 2020, 159, 1048–1061. [Google Scholar] [CrossRef] [PubMed]
- Wang, Q.; Zhao, X.; Zhu, J.Y. Kinetics of Strong Acid Hydrolysis of a Bleached Kraft Pulp for Producing Cellulose Nanocrystals (CNCs). Ind. Eng. Chem. Res. 2014, 53, 11007–11014. [Google Scholar] [CrossRef]
- Ahmed-Haras, M.R.; Kao, N.; Ward, L. Single-step heterogeneous catalysis production of highly monodisperse spherical nanocrystalline cellulose. Int. J. Biol. Macromol. 2020, 154, 246. [Google Scholar] [CrossRef]
- Torres-Vargas, O.; Campos Paéz, M.; Lema González, M. Corn starch based biocomposite films reinforced with cellulosic nanocrystals extracted from corn husks (Zea mays L.): Characterization and application in cherry tomato packaging. Ind. Crop. Prod. 2025, 225, 120486. [Google Scholar] [CrossRef]
- Dhiman, S.; Kumari, A.; Kumari, S.; Sharma, R. Advanced Biodegradable Starch-Based Nanocomposite Films Incorporating Zinc Oxide Nanoparticles: Synthesis, Characterization, and Efficacy in Antibacterial Food Packaging Applications. J. Environ. Chem. Eng. 2025, 13, 116296. [Google Scholar] [CrossRef]
- ASTM E96-95; Standard Test Methods for Water Vapor Transmission of Materials. ASTM: West Conshohocken, PA, USA, 2004.
- ASTM D 882-02; Standard Test Method for Tensile Properties of Thin Plastic Sheeting. ASTM International: West Conshohocken, PA, USA, 2002.
- Shi, S.; Wu, X.; Wang, Y.; Li, W.; Zhang, H.; Lou, X.; Xia, X.; Liang, W. Sodium-alginate-based indicator film containing a hydrophobic nanosilica layer for monitoring fish freshness. Int. J. Biol. Macromol. 2024, 265, 130714. [Google Scholar] [CrossRef] [PubMed]
- Agarwal, S.; Hoque, M.; Bandara, N.; Pal, K.; Sarkar, P. Synthesis and characterization of tamarind kernel powder-based antimicrobial edible films loaded with geraniol. Food Packag. Shelf Life 2020, 26, 100562. [Google Scholar] [CrossRef]
- Geada, P.; Moreira, C.; Silva, M.; Nunes, R.; Madureira, L.; Rocha, C.M.R.; Pereira, R.N.; Vicente, A.A.; Teixeira, J.A. Algal proteins: Production strategies and nutritional and functional properties. Bioresour. Technol. 2021, 332, 125125. [Google Scholar] [CrossRef] [PubMed]
- Hoo, D.Y.; Low, Z.L.; Low, D.Y.S.; Tang, S.Y.; Manickam, S.; Tan, K.W.; Ban, Z.H. Ultrasonic cavitation: An effective cleaner and greener intensification technology in the extraction and surface modification of nanocellulose. Ultrason. Sonochem. 2022, 90, 106176. [Google Scholar] [CrossRef]
- Mohd Ishak, N.A.; Khalil, I.; Abdullah, F.Z.; Muhd Julkapli, N. A correlation on ultrasonication with nanocrystalline cellulose characteristics. Carbohydr. Polym. 2020, 246, 116553. [Google Scholar] [CrossRef]
- Shojaeiarani, J.; Dilpreet, B.; Holt, G. Sonication amplitude and processing time influence the cellulose nanocrystals morphology and dispersion. Nanocomposites 2020, 6, 41–46. [Google Scholar] [CrossRef]
- Guo, J.; Guo, X.; Wang, S.; Yin, Y. Effects of ultrasonic treatment during acid hydrolysis on the yield, particle size and structure of cellulose nanocrystals. Carbohydr. Polym. 2016, 135, 248–255. [Google Scholar] [CrossRef]
- Le Normand, M.; Moriana, R.; Ek, M. Isolation and characterization of cellulose nanocrystals from spruce bark in a biorefinery perspective. Carbohydr. Polym. 2014, 111, 979–987. [Google Scholar] [CrossRef]
- Guo, Y.; Zhang, Y.; Zheng, D.; Li, M.; Yue, J. Isolation and characterization of nanocellulose crystals via acid hydrolysis from agricultural waste-tea stalk. Int. J. Biol. Macromol. 2020, 163, 927–933. [Google Scholar] [CrossRef]
- Raza, M.; Abu-Jdayil, B.; Banat, F.; Al-Marzouqi, A.H. Isolation and Characterization of Cellulose Nanocrystals from Date Palm Waste. ACS Omega 2022, 7, 25366–25379. [Google Scholar] [CrossRef]
- Rana, A.K.; Thakur, M.K.; Gupta, V.K.; Thakur, V.K. Exploring the role of nanocellulose as potential sustainable material for enhanced oil recovery: New paradigm for a circular economy. Process Saf. Environ. Prot. 2024, 183, 1198–1222. [Google Scholar] [CrossRef]
- Kalita, E.; Nath, B.K.; Agan, F.; More, V.; Deb, P. Isolation and characterization of crystalline, autofluorescent, cellulose nanocrystals from saw dust wastes. Ind. Crop. Prod. 2015, 65, 550–555. [Google Scholar] [CrossRef]
- Mahbubul, I.M. 1—Introduction to Nanofluid. In Preparation, Characterization, Properties and Application of Nanofluid; Mahbubul, I.M., Ed.; William Andrew Publishing: Norwich, NY, USA, 2019; pp. 1–13. [Google Scholar]
- Danaei, M.; Dehghankhold, M.; Ataei, S.; Hasanzadeh Davarani, F.; Javanmard, R.; Dokhani, A.; Khorasani, S.; Mozafari, M. Impact of particle size and polydispersity index on the clinical applications of lipidic nanocarrier systems. Pharmaceutics 2018, 10, 57. [Google Scholar] [CrossRef] [PubMed]
- Júnior, Z.S.S.; Botta, S.B.; Ana, P.A.; França, C.M.; Fernandes, K.P.S.; Mesquita-Ferrari, R.A.; Deana, A.; Bussadori, S.K. Effect of papain-based gel on type I collagen—Spectroscopy applied for microstructural analysis. Sci. Rep. 2015, 5, 11448. [Google Scholar] [CrossRef]
- Eyley, S.; Thielemans, W. Surface modification of cellulose nanocrystals. Nanoscale 2014, 6, 7764–7779. [Google Scholar] [CrossRef]
- Raza, M.; Abu-Jdayil, B. Cellulose nanocrystals from lignocellulosic feedstock: A review of production technology and surface chemistry modification. Cellulose 2022, 29, 685. [Google Scholar] [CrossRef]
- Babu, A.S.; Parimalavalli, R.; Jagannadham, K.; Rao, J.S. Chemical and structural properties of sweet potato starch treated with organic and inorganic acid. J. Food Sci. Technol. 2015, 52, 5745–5753. [Google Scholar] [CrossRef]
- Sun, X.; Li, Q.; Wu, H.; Zhou, Z.; Feng, S.; Deng, P.; Zou, H.; Tian, D.; Lu, C. Sustainable Starch/Lignin Nanoparticle Composites Biofilms for Food Packaging Applications. Polymers 2023, 15, 1959. [Google Scholar] [CrossRef]
- Chen, W.; He, H.; Zhu, H.; Cheng, M.; Li, Y.; Wang, S. Thermo-Responsive Cellulose-Based Material with Switchable Wettability for Controllable Oil/Water Separation. Polymers 2018, 10, 592. [Google Scholar] [CrossRef]
- He, W.; Wei, C. Progress in C-type starches from different plant sources. Food Hydrocoll. 2017, 73, 162–175. [Google Scholar] [CrossRef]
- Fernández-Santos, J.; Valls, C.; Cusola, O.; Roncero, M.B. Composites of cellulose nanocrystals in combination with either cellulose nanofibril or carboxymethylcellulose as functional packaging films. Int. J. Biol. Macromol. 2022, 211, 218–229. [Google Scholar] [CrossRef]
- Yadav, M.; Behera, K.; Chang, Y.-H.; Chiu, F.-C. Cellulose nanocrystal reinforced chitosan based UV barrier composite films for sustainable packaging. Polymers 2020, 12, 202. [Google Scholar] [CrossRef] [PubMed]
- Onyeaka, P.O.; Dai, H.; Feng, X.; Wang, H.; Fu, Y.; Yu, Y.; Zhu, H.; Chen, H.; Ma, L.; Zhang, Y. Effect of different types of nanocellulose on the structure and properties of gelatin films. Food Hydrocoll. 2023, 144, 108972. [Google Scholar] [CrossRef]
- Hossain, K.M.Z.; Calabrese, V.; da Silva, M.A.; Schmitt, J.; Bryant, S.J.; Islam, M.T.; Felfel, R.M.; Scott, J.L.; Edler, K.J. Microstructural, Thermal, Crystallization, and Water Absorption Properties of Films Prepared from Never-dried and Freeze-dried Cellulose Nanocrystals. Macromol. Mater. Eng. 2021, 306, 2000462. [Google Scholar] [CrossRef]
- Yang, J.; Zhong, F.; Liu, F. Properties of sodium alginate-based nanocomposite films: Effects of aspect ratio and surface charge of cellulose nanocrystals. Int. J. Biol. Macromol. 2024, 256, 128420. [Google Scholar] [CrossRef] [PubMed]
- Delgado, J.F.; Peltzer, M.A.; Wagner, J.R.; Salvay, A.G. Hydration and water vapour transport properties in yeast biomass based films: A study of plasticizer content and thickness effects. Eur. Polym. J. 2018, 99, 9–17. [Google Scholar] [CrossRef]
- Singh, G.P.; Bangar, S.P.; Yang, T.; Trif, M.; Kumar, V.; Kumar, D. Effect on the Properties of Edible Starch-Based Films by the Incorporation of Additives: A Review. Polymers 2022, 14, 1987. [Google Scholar] [CrossRef] [PubMed]
- Zhang, W.; Zhang, Y.; Cao, J.; Jiang, W. Improving the performance of edible food packaging films by using nanocellulose as an additive. Int. J. Biol. Macromol. 2021, 166, 288–296. [Google Scholar] [CrossRef]
- Salari, M.; Sowti Khiabani, M.; Rezaei Mokarram, R.; Ghanbarzadeh, B.; Samadi Kafil, H. Development and evaluation of chitosan based active nanocomposite films containing bacterial cellulose nanocrystals and silver nanoparticles. Food Hydrocoll. 2018, 84, 414–423. [Google Scholar] [CrossRef]
- Bizymis, A.-P.; Giannou, V.; Tzia, C. Improved Properties of Composite Edible Films Based on Chitosan by Using Cellulose Nanocrystals and Beta-Cyclodextrin. Appl. Sci. 2022, 12, 8729. [Google Scholar] [CrossRef]
- Al-Badaani, A.A.; Adam, M.S.; Hifney, A.F.; Gomaa, M. Development of Ulva lactuca-Derived Cellulose/Nanocellulose Edible Films With Enhanced Light, Oxygen, and Water Vapor Barrier Properties and Natural Antioxidant Properties. J. Aquat. Food Prod. Technol. 2025, 1–17. [Google Scholar] [CrossRef]
- Shuang, F.-F.; Zong, C.-M.; Wang, C.-C.; Hu, R.-Z.; Shen, Y.-S.; Ju, Y.-X.; Yao, X.-H.; Chen, T.; Zhao, W.-G.; Zhang, D.-Y. Chlorogenic acid and cellulose nanocrystal–assisted crosslinking preparation of a silk-based film to extend the shelf life of strawberries. LWT 2022, 172, 114218. [Google Scholar] [CrossRef]
- El-Wakil, N.A.; Hassan, E.A.; Abou-Zeid, R.E.; Dufresne, A. Development of wheat gluten/nanocellulose/titanium dioxide nanocomposites for active food packaging. Carbohydr. Polym. 2015, 124, 337–346. [Google Scholar] [CrossRef] [PubMed]
- Rhim, J.-W.; Hong, S.-I.; Park, H.-M.; Ng, P.K.W. Preparation and Characterization of Chitosan-Based Nanocomposite Films with Antimicrobial Activity. J. Agric. Food Chem. 2006, 54, 5814–5822. [Google Scholar] [CrossRef] [PubMed]
- Perumal, A.B.; Nambiar, R.B.; Sellamuthu, P.S.; Sadiku, E.R.; Li, X.; He, Y. Extraction of cellulose nanocrystals from areca waste and its application in eco-friendly biocomposite film. Chemosphere 2022, 287, 132084. [Google Scholar] [CrossRef]
- Guzman-Puyol, S.; Benítez, J.J.; Heredia-Guerrero, J.A. Transparency of polymeric food packaging materials. Food Res. Int. 2022, 161, 111792. [Google Scholar] [CrossRef]
- Xiang, F.; Xia, Y.; Wang, Y.; Wang, Y.; Wu, K.; Ni, X. Preparation of konjac glucomannan based films reinforced with nanoparticles and its effect on cherry tomatoes preservation. Food Packag. Shelf Life 2021, 29, 100701. [Google Scholar] [CrossRef]
- Wang, L.-F.; Shankar, S.; Rhim, J.-W. Properties of alginate-based films reinforced with cellulose fibers and cellulose nanowhiskers isolated from mulberry pulp. Food Hydrocoll. 2017, 63, 201–208. [Google Scholar] [CrossRef]


| Treatment | X1 (%) | X2 (min) | Yield (%) | Crystallite Size (nm) | Crystallinity Index (%) |
|---|---|---|---|---|---|
| 1 | 30 | 15 | 23.6 | 12.50 | 46.09 |
| 2 | 50 | 15 | 25.8 | 7.72 | 52.36 |
| 3 | 30 | 30 | 23.4 | 10.26 | 43.79 |
| 4 | 50 | 30 | 30.4 | 5.83 | 62.86 |
| 5 | 25.8579 | 22.5 | 23.6 | 13.48 | 35.75 |
| 6 | 54.1421 | 22.5 | 26.9 | 6.35 | 56.06 |
| 7 | 40 | 11.8934 | 23.7 | 9.83 | 48.13 |
| 8 | 40 | 33.1066 | 24.8 | 7.12 | 48.34 |
| 9 | 40 | 22.5 | 24.4 | 9.00 | 48.41 |
| 10 | 40 | 22.5 | 25.2 | 9.09 | 48.21 |
| 11 | 40 | 22.5 | 24.9 | 9.28 | 48.83 |
| 12 | 40 | 22.5 | 24.1 | 9.09 | 48.68 |
| Sample | Cellulose (%) | Hemicellulose (%) | Lignin (%) |
|---|---|---|---|
| Scented pandan leaves | 44.45 ± 0.63 d | 19.94 ± 0.52 a | 13.67 ± 0.99 a |
| Unbleached cellulose | 54.07 ± 0.15 c | 12.67 ± 0.58 b | 12.21 ± 0.32 b |
| Bleached cellulose | 69.55 ± 0.17 b | 6.79 ± 0.13 c | 5.54 ± 0.53 c |
| CNCs | 83.79 ± 0.21 a | - | - |
| Edible Films | Thickness (mm) | Moisture (%) | WVP (×10−3 g·mm/m2·h·kPa) | Tensile Strength (MPa) | Elongation at Break (%) | %T | L* | WI | ∆E* |
|---|---|---|---|---|---|---|---|---|---|
| SPS | 0.486 ± 0.005 d | 9.43 ± 0.15 a | 79.16 ± 0.17 a | 0.38 ± 0.05 c | 42.65 ± 0.24 a | 91.80 ± 0.02 a | 89.90 ± 0.05 d | 89.86 ± 0.05 d | 0.05 ± 0.03 e |
| SPS + 2% CNC | 0.509 ± 0.002 c | 8.42 ± 0.21 b | 75.25 ± 0.31 b | 0.45 ± 0.02 c | 39.07 ± 0.90 b | 85.21 ± 0.03 b | 91.20 ± 0.09 c | 91.15 ± 0.09 c | 1.28 ± 0.09 c |
| SPS + 4% CNC | 0.517 ± 0.002 b | 5.69 ± 0.24 c | 71.48 ± 0.45 b | 0.58 ± 0.01 b | 35.75 ± 0.60 c | 77.62 ± 0.05 c | 91.22 ± 0.01 c | 91.17 ± 0.01 c | 1.30 ± 0.01 c |
| SPS + 6% CNC | 0.519 ± 0.003 b | 3.08 ± 0.12 d | 70.64 ± 0.43 c | 0.67 ± 0.05 ab | 31.50 ± 0.18 d | 75.08 ± 0.01 d | 91.35 ± 0.04 b | 91.31 ± 0.04 b | 1.44 ± 0.04 b |
| SPS + 8% CNC | 0.526 ± 0.002 a | 2.15 ± 0.01 e | 68.83 ± 0.18 d | 0.76 ± 0.05 a | 29.51 ± 0.18 e | 67.97 ± 0.03 e | 92.23 ± 0.04 a | 92.19 ± 0.05 a | 2.34 ± 0.09 a |
Disclaimer/Publisher’s Note: The statements, opinions and data contained in all publications are solely those of the individual author(s) and contributor(s) and not of MDPI and/or the editor(s). MDPI and/or the editor(s) disclaim responsibility for any injury to people or property resulting from any ideas, methods, instructions or products referred to in the content. |
© 2025 by the authors. Licensee MDPI, Basel, Switzerland. This article is an open access article distributed under the terms and conditions of the Creative Commons Attribution (CC BY) license (https://creativecommons.org/licenses/by/4.0/).
Share and Cite
Rattanamato, B.; Kanha, N.; Thongchai, P.; Rakariyatham, K.; Klangpetch, W.; Osiriphun, S.; Laokuldilok, T. Upcycling Scented Pandan Leaf Waste into High-Value Cellulose Nanocrystals via Ultrasound-Assisted Extraction for Edible Film Reinforcement. Foods 2025, 14, 1528. https://doi.org/10.3390/foods14091528
Rattanamato B, Kanha N, Thongchai P, Rakariyatham K, Klangpetch W, Osiriphun S, Laokuldilok T. Upcycling Scented Pandan Leaf Waste into High-Value Cellulose Nanocrystals via Ultrasound-Assisted Extraction for Edible Film Reinforcement. Foods. 2025; 14(9):1528. https://doi.org/10.3390/foods14091528
Chicago/Turabian StyleRattanamato, Benjamard, Nattapong Kanha, Prem Thongchai, Kanyasiri Rakariyatham, Wannaporn Klangpetch, Sukhuntha Osiriphun, and Thunnop Laokuldilok. 2025. "Upcycling Scented Pandan Leaf Waste into High-Value Cellulose Nanocrystals via Ultrasound-Assisted Extraction for Edible Film Reinforcement" Foods 14, no. 9: 1528. https://doi.org/10.3390/foods14091528
APA StyleRattanamato, B., Kanha, N., Thongchai, P., Rakariyatham, K., Klangpetch, W., Osiriphun, S., & Laokuldilok, T. (2025). Upcycling Scented Pandan Leaf Waste into High-Value Cellulose Nanocrystals via Ultrasound-Assisted Extraction for Edible Film Reinforcement. Foods, 14(9), 1528. https://doi.org/10.3390/foods14091528