
Statistical Analysis of Mineral Concentration for the Geographic Identification of Garlic Samples from Sicily (Italy), Tunisia and Spain


 ,
,  ,
,  ,
,  ,
,  and
and
Abstract
:1. Introduction
2. Materials and Methods
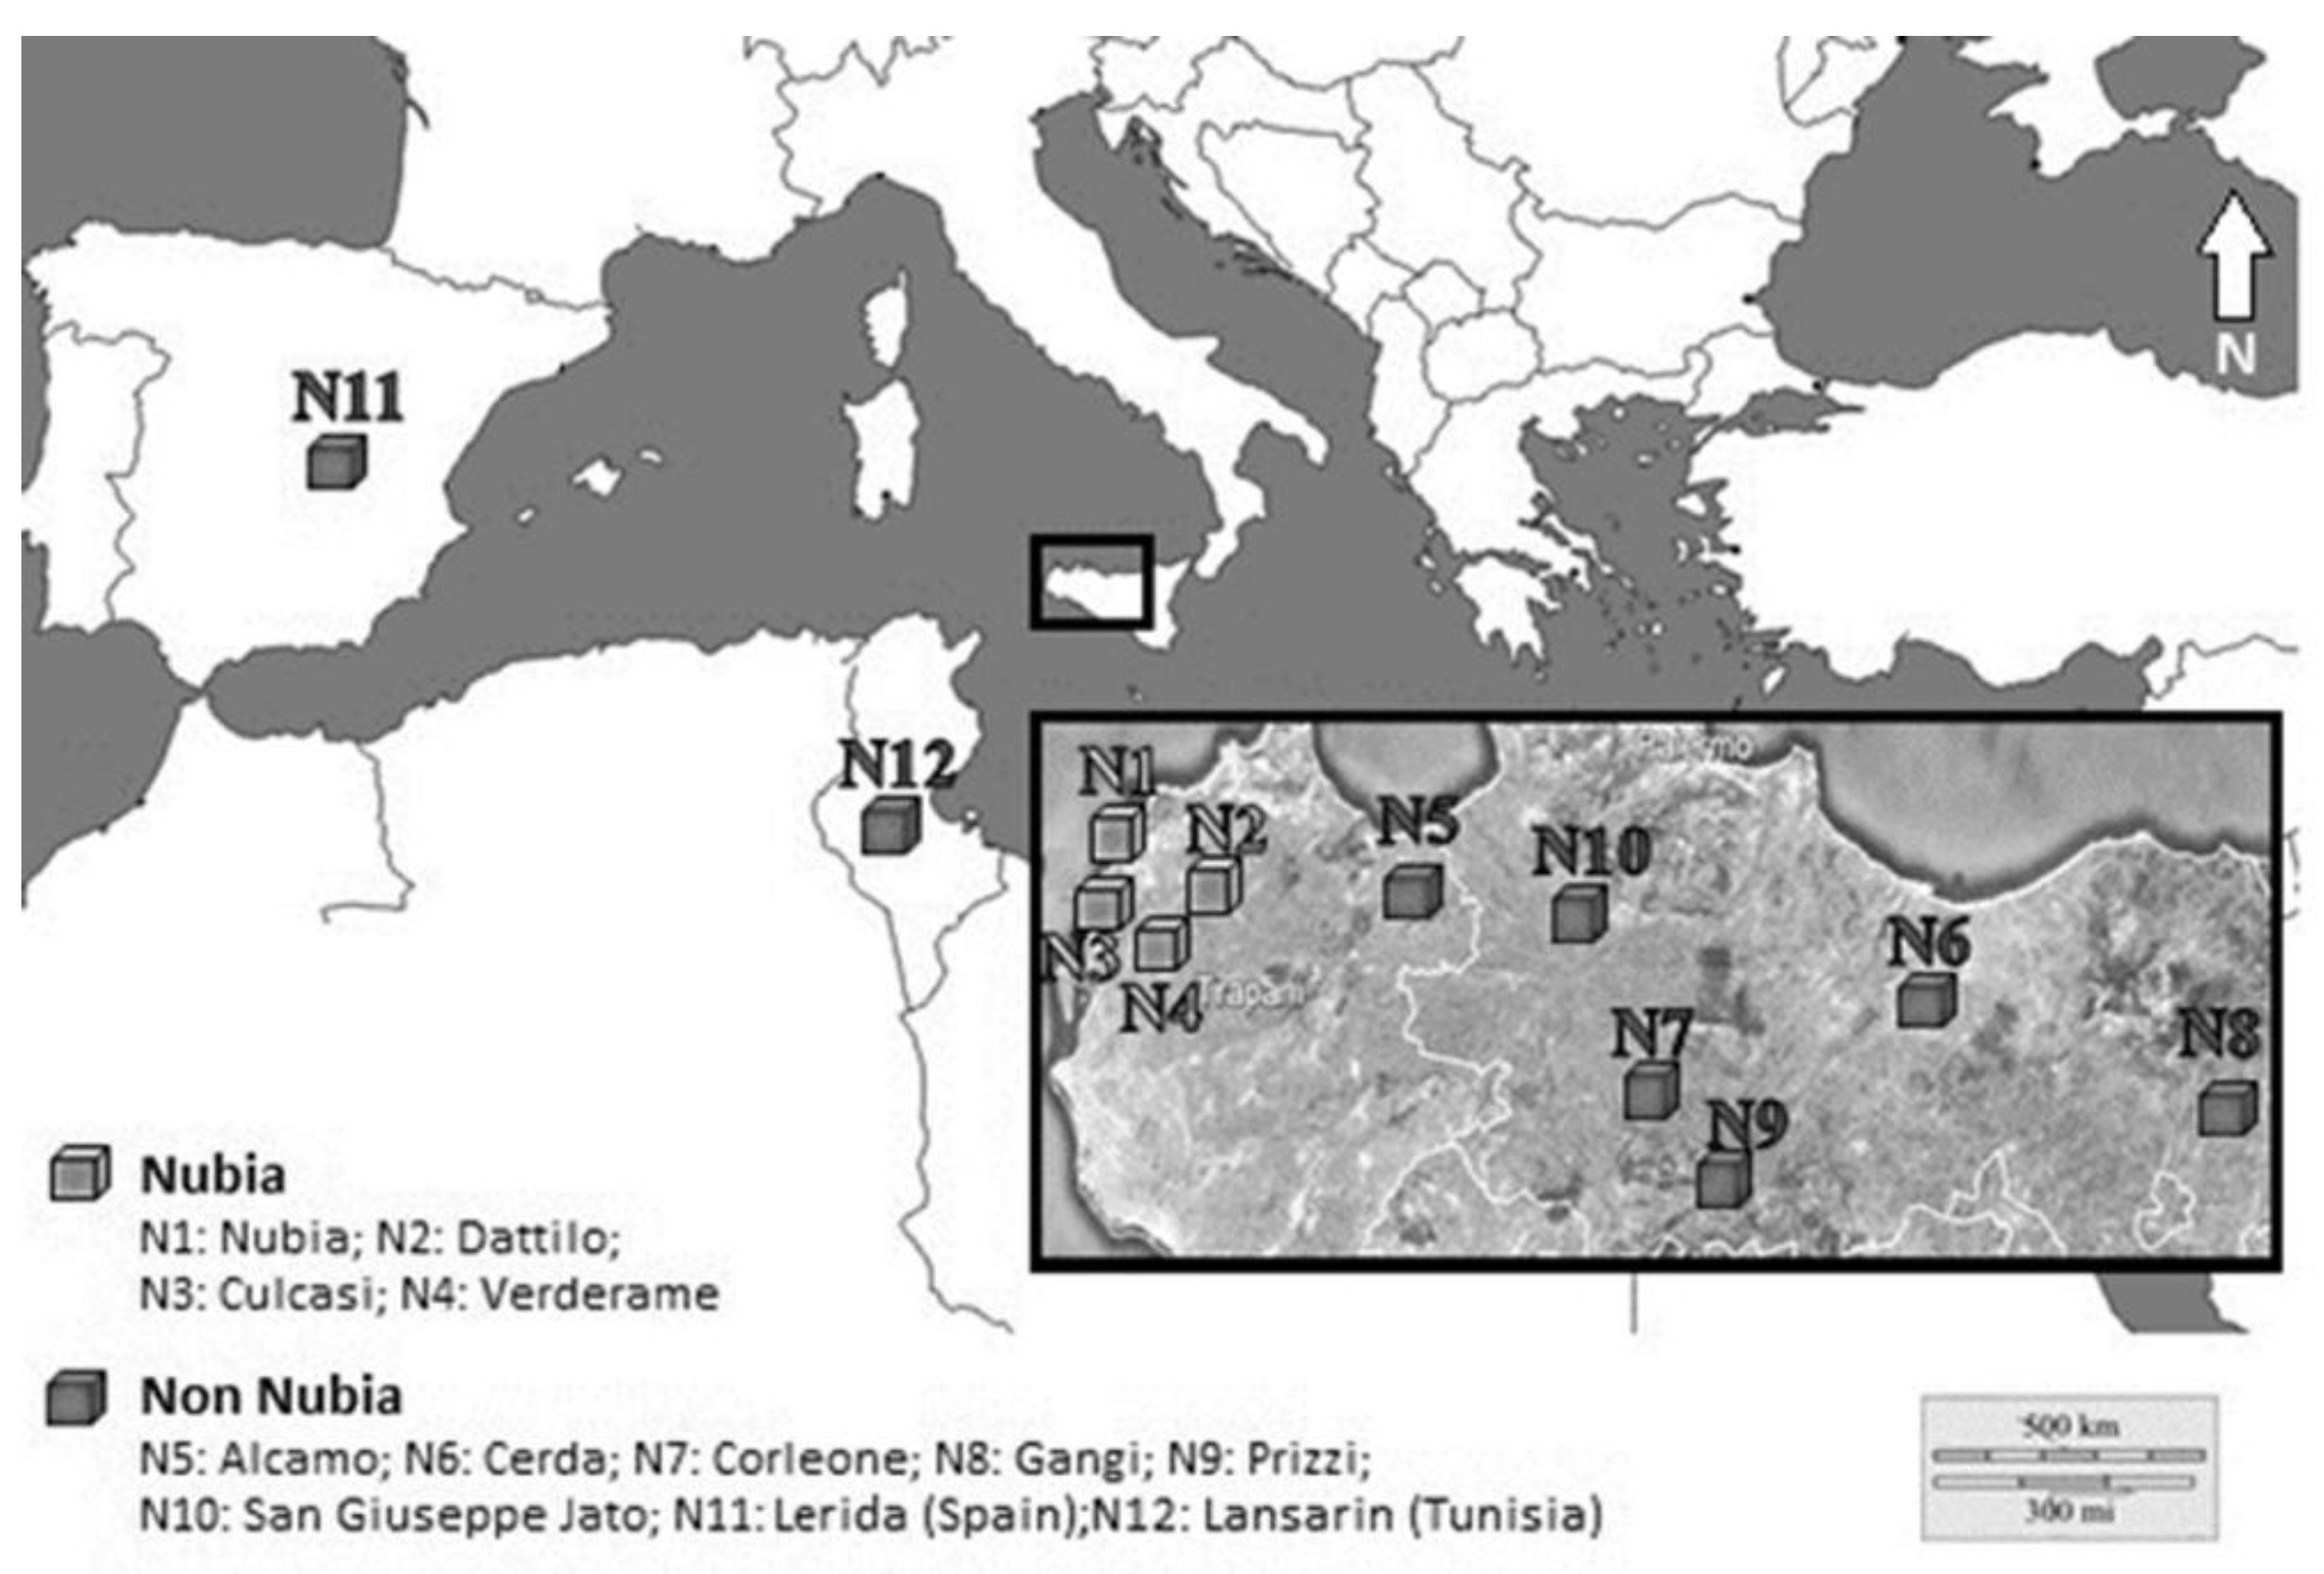
2.1. Sampling
2.2. Study Site
2.3. Chemicals and Standard Solution
2.4. Sample Preparation
2.5. Instrumentation
2.6. ICP-MS Analysis
2.7. Statistical Methods
3. Results
3.1. Method Validation
3.2. Multi-Element Profile of Garlic Samples
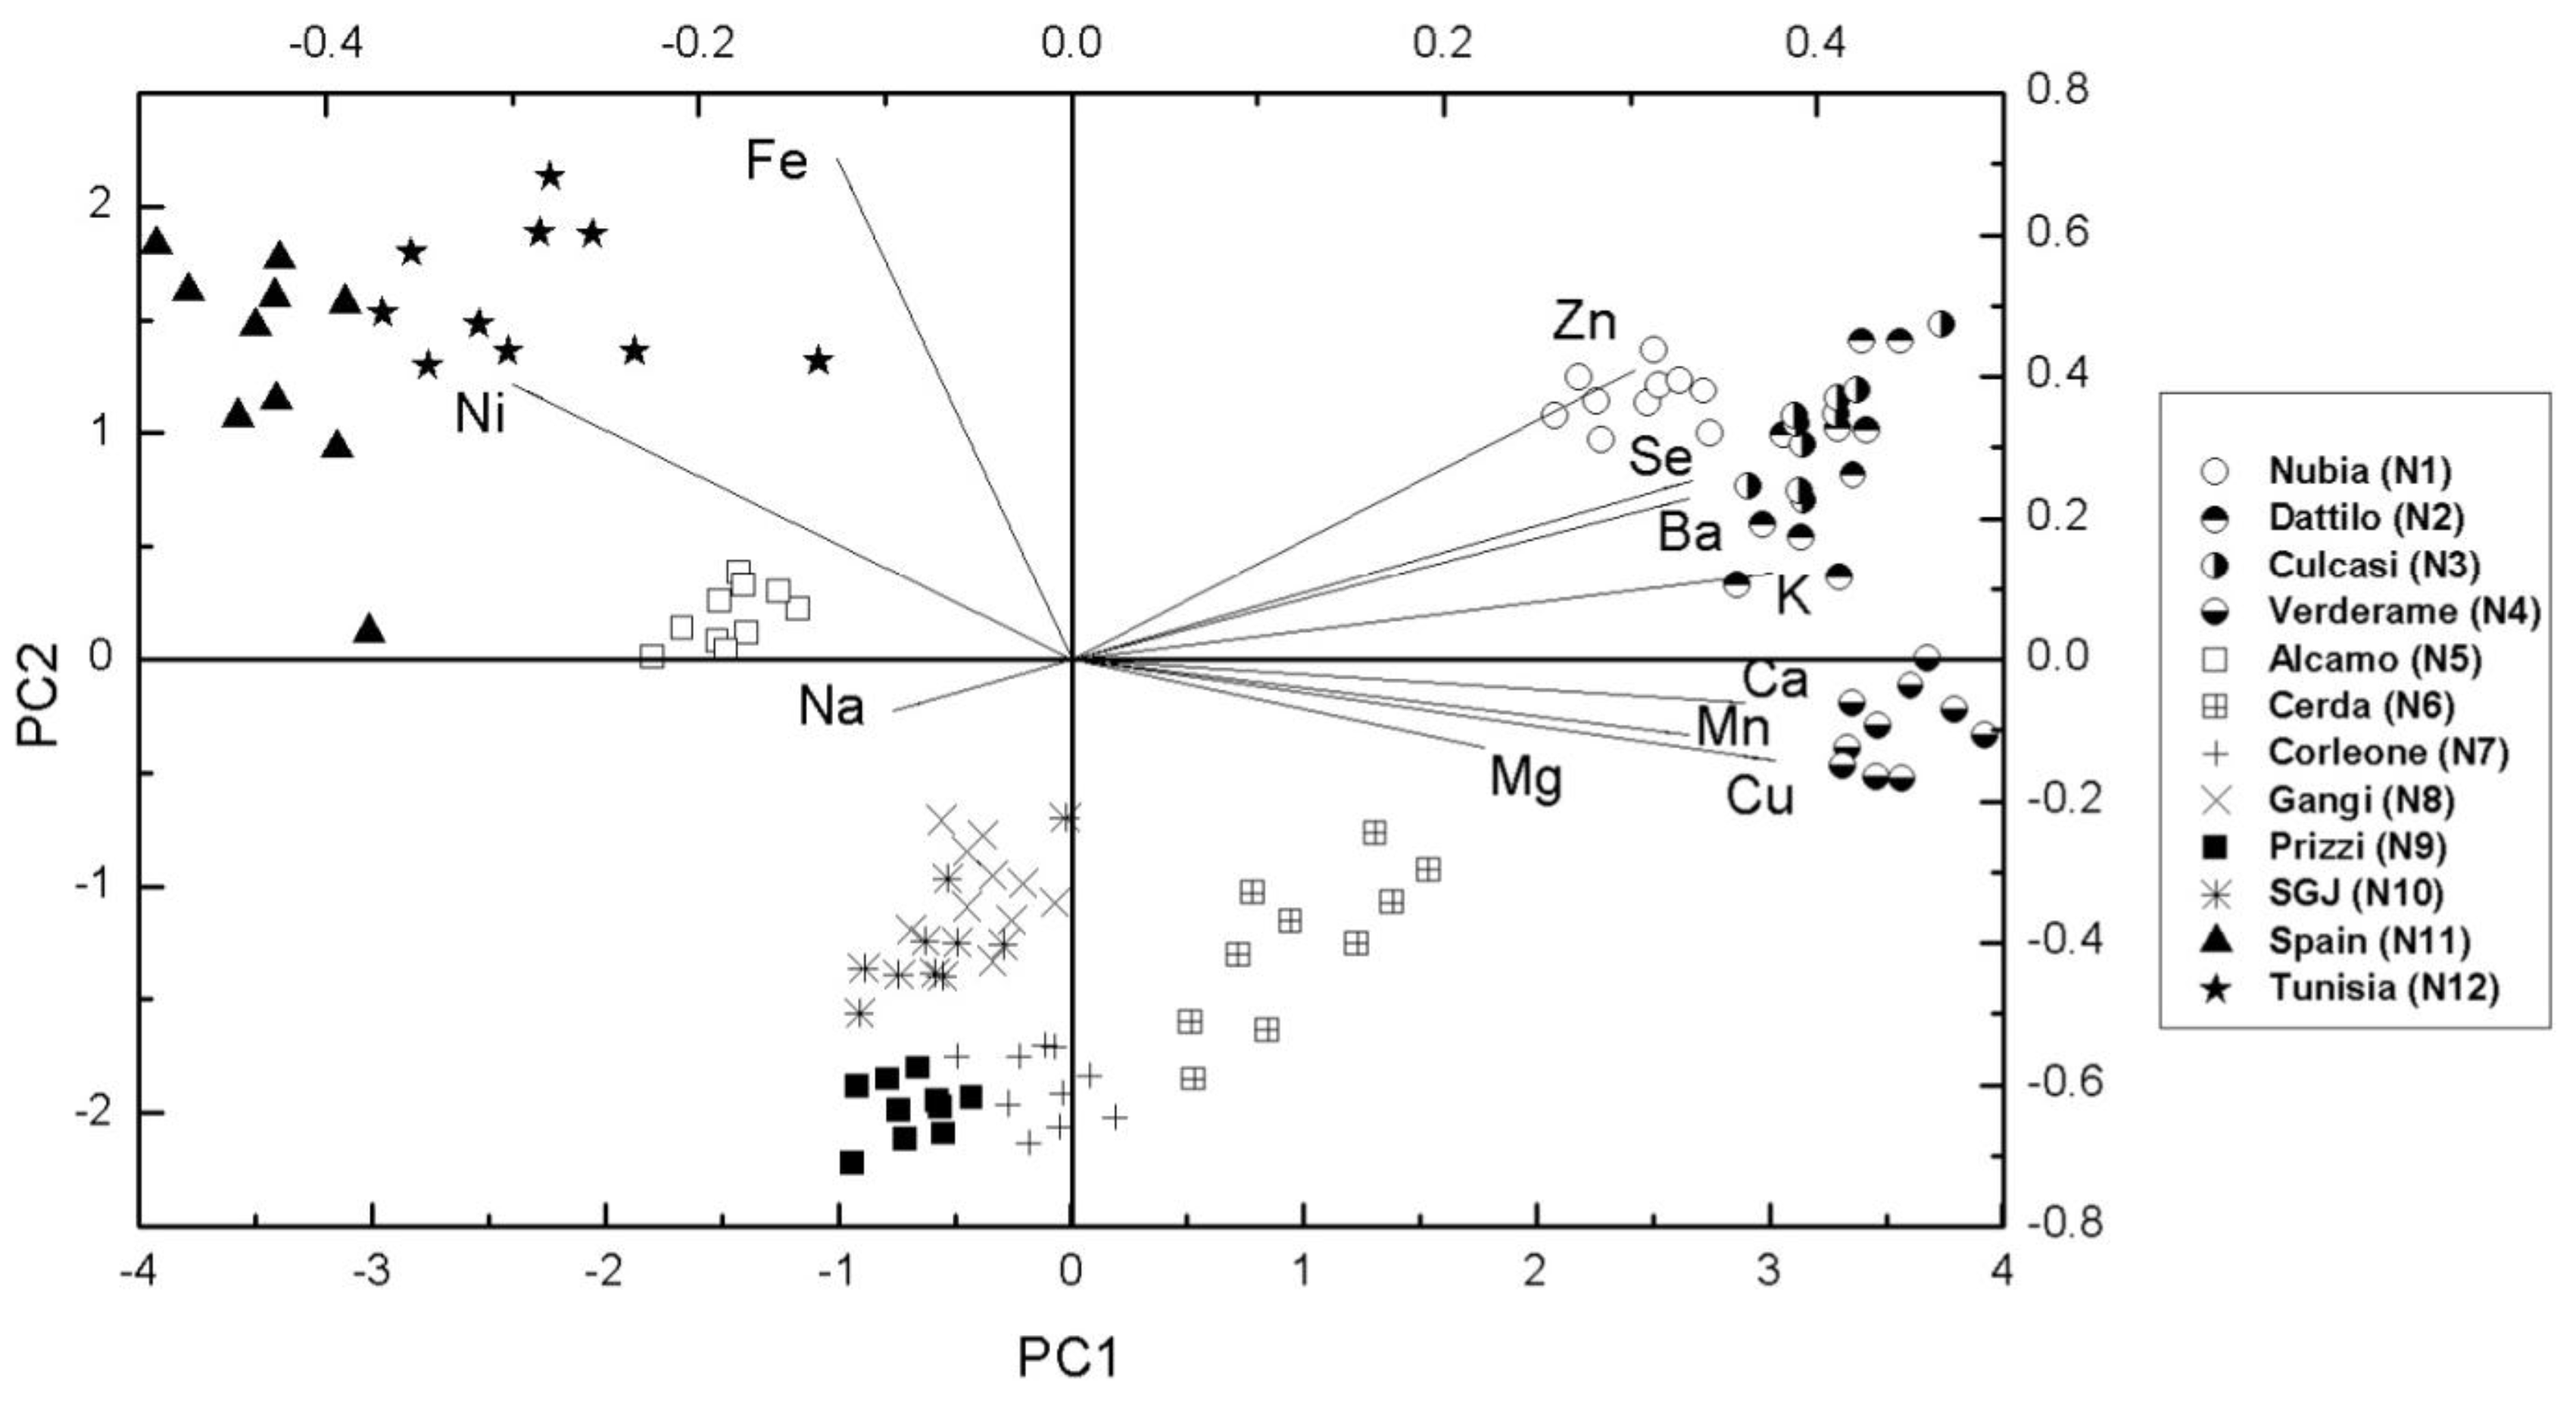
3.3. Multivariate Statistical Analysis
4. Discussion
5. Conclusions
Author Contributions
Conflicts of Interest
Abbreviations
| NRG | Nubia Red Garlic |
| PAT | Product agriculture Traditional |
| ICP-MS | Inductively Coupled Plasma Mass Spectrometry |
| PCA | Principal Components Analysis |
| LOD | Limit of Detection |
| LOQ | Limit of Quantification |
| SVD | Singular Value Decomposition |
| PC | Principal Component |
References
- Block, E. The chemistry of garlic and onions. Sci. Am. 1985, 252, 114–119. [Google Scholar] [CrossRef] [PubMed]
- Ramaa, C.S.; Shirode, A.R.; Mundada, A.S.; Kadam, V.J. Nutraceuticals: An emerging era in the treatment and prevention of cardiovascular diseases. Curr. Pharm. Biotechnol. 2006, 7, 15–23. [Google Scholar] [CrossRef] [PubMed]
- Catalano, R.; Lo Cicero, G. Guida alle escursioni-Vol 1-La Sicilia Occidentale. In Procceedings of the 79° Congresso Nazionale della Società Geologica Italiana, Palermo, Italy, 18–20 September 1998.
- Lazzarini, E. Gli Ortaggi e le Piante Aromatiche; Hoepli: Milan, Italy, 2013. [Google Scholar]
- Di Bella, G.; Potortì, A.G.; Lo Turco, V.; Bua, D.; Licata, P.; Cicero, N.; Dugo, G. Trace Elements In Thunnus Thynnus From Mediterranean Sea: Benefit-Risk Assessment For Consumer. Food Addit. Contam. 2015, 8, 175–181. [Google Scholar] [CrossRef] [PubMed]
- Lo Turco, V.; Di Bella, G.; Furci, P.; Cicero, N.; Pollicino, G.; Dugo, G. Heavy metals content by ICP-OES in Sarda sarda, Sardinella aurita and Lepidopus caudatus from Straits of Messina (Sicily, Italy). Nat. Prod. Res. 2012, 27, 518–523. [Google Scholar] [CrossRef] [PubMed]
- Naccari, C.; Cicero, N.; Ferrantelli, V.; Giangrosso, G.; Vella, A.; Macaluso, A.; Naccari, F.; Dugo, G. Toxic metals in pelagic, benthic and demersal fish species from Mediterranean FAO zone 37. Bull. Environ. Contam. Toxicol. 2015, 95, 567–573. [Google Scholar] [CrossRef] [PubMed]
- Salvo, A.; Cicero, N.; Vadalà, R.; Mottese, A.F.; Bua, D.; Mallamace, D.; Giannetto, C.; Dugo, G. Toxic and essential metals determination in commercial seafood: Paracentrotus lividus by ICP-MS. Nat. Prod. Res. 2015, 30, 657–664. [Google Scholar] [CrossRef] [PubMed]
- Salvo, A.; Potortì, A.G.; Cicero, N.; Bruno, M.; Lo Turco, V.; Di Bella, G.; Dugo, G. Statistical characterisation of heavy metal contents in Paracentrotus lividus from Mediterranean Sea. Nat. Prod. Res. 2014, 28, 718–726. [Google Scholar] [CrossRef] [PubMed]
- Poldma, P.; Tonutare, T.; Viitak, A.; Luik, A.; Moor, U. Effect of Selenium Treatment on Mineral Nutrition, Bulb Size, and Antioxidant Properties of Garlic (Allium sativum L.). J. Agric. Food Chem. 2011, 59, 5498–5503. [Google Scholar] [CrossRef] [PubMed]
- Camargo, A.B.; Resnizky, S.; Marchevsky, E.J.; Luco, J.M. Use of the Argentinean garlic (Allium sativum L.) germplasm mineral profile for determining geographic origin. J. Food Compos. Anal. 2010, 23, 586–591. [Google Scholar] [CrossRef]
- Cicero, N.; Corsaro, C.; Salvo, A.; Vasi, S.; Giofre, S.V.; Ferrantelli, V.; Di Stefano, V.; Mallamace, D.; Dugo, G. The metabolic profile of lemon juice by proton HR-MAS NMR: The case of the PGI Interdonato Lemon of Messina. Nat. Prod. Res. 2015, 29, 1894–1902. [Google Scholar] [CrossRef] [PubMed]
- Corsaro, C.; Mallamace, D.; Vasi, S.; Ferrantelli, V.; Dugo, G.; Cicero, N. H HR-MAS NMR Spectroscopy and the Metabolite Determination of Typical Foods in Mediterranean Diet. J. Anal. Methods Chem. 2015. [Google Scholar] [CrossRef] [PubMed]
- Mallamace, D.; Corsaro, C.; Salvo, A.; Cicero, N.; Macaluso, A.; Giangrosso, G.; Ferrantelli, V.; Dugo, G. A multivariate statistical analysis coming from the NMR metabolic profile of cherry tomatoes (The Sicilian Pachino case). Phys. A 2014, 401, 112–117. [Google Scholar] [CrossRef]
- Das, S. Garlic—A natural source of cancer preventive compounds. Asian Pac. J Cancer Prev. 2002, 3, 305–311. [Google Scholar] [PubMed]
- Santhoscha, S.G.; Jamuna, P.; Prabhavathi, S.N. Bioactive components of garlic and their physiological role in health maintenance: A rewiew. Food Biosci. 2013, 3, 59–74. [Google Scholar] [CrossRef]
- Arnault, I.; Auger, J. Seleno compounds in garlic and onion. J. Chromatog. A 2006, 1112, 23–30. [Google Scholar] [CrossRef] [PubMed]
- Parrinello, A.M.; Amato, A.; Cordella, C.; Pizzo, A. L’aglio nel territorio della S.O.A.T. di Paceco; Regione Siciliana, Assessorato Agricoltura E Foreste, IX Servizio Regionale Assistenza Tecnica, Sperimentazione, Ricerca Applicata E Divulgazione; Assessorato Agricoltura, Regione Sicilia: Palermo, Italy, 2002. [Google Scholar]
- Maetzke, F.; Cullotta, S.; La Mantia, T.; La Mela Veca, D.S.; Pizzurro, G.M. Individuazione di aree ecologicamente omogenee e di un sistema di aree a priorità di intervento per l’ampliamento della superficie forestale in Sicilia. Forest 2008, 5, 280–295. [Google Scholar] [CrossRef]
- Tumea, P.; Bechb, J.; Tumec, L.; Bechd, J.; Revertere, F.; Longanb, L.; Cendoya, P. Concentrations and distributions of Ba, Cr, Sr, V, Al, and Fe in Torrelles soil profiles (Catalonia, Spain). J. Geochem. Explor. 2008, 96, 94–105. [Google Scholar] [CrossRef]
- Yoshida, M.; Kallali, H. Environmental Magnetic Study of Surface Soil/Sediment in Northern Tunisia—Field Screening for Potentially Toxic Elements Contamination. In Proceedings of the 7th International Symposium on Recent Advance in Exploration Geophysics in Kyoto (RAEG2003), Kyoto University, Kyoto, Japan, January 2003.
- Zhu, Y.; Umemurab, T.; Haraguchib, H.; Inagakia, K.; Chibaa, K. Determination of REEs in seawater by ICP-MS after on-line preconcentration using a syringe-driven chelating column. Talanta 2009, 78, 891–895. [Google Scholar] [CrossRef] [PubMed]
- Gonzàlvez, A.; Armenta, S.; Cervera, M.L.; De La Guardia, M. Elemental composition of seasoning products. Talanta 2008, 74, 1085–1095. [Google Scholar] [CrossRef] [PubMed]
- Ellison, S.L.R.; Williams, A. European Pharmacopoeia Technical Guide, Eurachem/Citac Guide Quantifying Uncertainty in Analytical Measurement, 3rd ed.; LGC: London, UK, 2011. [Google Scholar]
- Dorant, E.; Van Den Brandt, P.A.; Goldbohm, R.A.; Hermus, R.J.; Sturmans, F. Garlic and its significance for the prevention of cancer in humans: A critical review. Br. J. Cancers 1993, 67, 424–429. [Google Scholar] [CrossRef]
- Li, T.S.C. Medicinal Plants; Technomic Publ. Co.: Chicago, IL, USA, 2000. [Google Scholar]
- Denkhaus, E.; Salnikow, K. Nickel essentiality, toxicity, and carcinogenicity. Crit. Rev. Oncol. Hematol. 2002, 42, 35–56. [Google Scholar] [CrossRef]
- National Research Council. Medical and Biological Effects of Environmental Pollutants. Nickel; Committee on Medical and Biological Effects of Environmental Pollutants, National Academy of Sciences: Washington, DC, USA, 1975. [Google Scholar]
- Macpherson, L.J.; Geierstanger, B.H.; Viswanath, V.; Bandell, M.; Eid, S.R.; Hwang, S.W.; Patapoutian, A. The pungency of garlic: Activation of TRPA1 and TRPV1 in response to allicin. Curr. Biol. 2005, 15, 929–934. [Google Scholar] [CrossRef] [PubMed]
- Song, K.; Milner, J.A. The influence of heating on the anticancer properties of garlic. J. Nutr. 2001, 131, 1054s–1057s. [Google Scholar] [PubMed]
- Yoshida, H.; Katsuzaki, H.; Ohta, R.; Ishikawa, K.; Fukuda, H.; Fujino, T.; Suzuki, A. An organosulfur compound isolated from oil-macerated garlic extract and its antimicrobial effect. Biosci. Biotechnol. Biochem. 1999, 63, 588–590. [Google Scholar] [CrossRef] [PubMed]
- Lawson, L.D.; Wang, Z.J. Alliin and Allicin-Derived garlic compounds increases breath acetone through Allyl Methyl Sulfide; use in measuring Allicin bioavailability. J. Agric. Food Chem. 2005, 53, 1974–1983. [Google Scholar] [CrossRef] [PubMed]
- Lawson, L.D.; Hughes, B.G. Characterization of the formation of allicin and other thiosulfinates from garlic. Planta Med. 1992, 58, 345–350. [Google Scholar] [CrossRef] [PubMed]
- Rivlin, R.S. Historical perspective on the use of garlic. J. Nutr. 2001, 131, 951S–954S. [Google Scholar] [PubMed]
- Steinmetz, K.A.; Kushi, L.H.; Bostick, R.M.; Folsome, A.R.; Potter, J.D. Vegetables fruit and colon cancer in the Iowa Women’s health Study. Am. J. Epidemiol. 1994, 139, 1–15. [Google Scholar] [PubMed]
- Ministerial Decree. 5 June 2014 Ministero delle Politiche Agricole Alimentari e Forestali G.U. Supplemento Ordinario; n. 48; 20 June 2014; XIV Revisione dell’Elenco Nazionale dei Prodotti Agroalimentari Tradizionali; MIPAAF: Roma, Italy, 2014. [Google Scholar]


| Sample Source | Latitude North | Longitude East | NS a | Bulb Das b (mm) | Bulb Aw c (g) | Bulbils An d | Bulbils Aw c (g) | |
|---|---|---|---|---|---|---|---|---|
| NRG SAMPLES | ||||||||
| N1 | Nubia | 37°58′43.58′′ | 12°30′42.27′′ | 10 | 50 | 45.21 | 13 | 3.12 |
| N2 | Dattilo | 37°58′13.68′′ | 12°38′20.62′′ | 10 | 48 | 44.92 | 13 | 3.33 |
| N3 | Culcasi | 37°58′36.98′′ | 12°29′57.53′′ | 10 | 49 | 44.72 | 13 | 3.24 |
| N4 | Verderame | 37°58′10.96′′ | 12°32′36.88′′ | 10 | 52 | 45.63 | 13 | 2.96 |
| NON NUBIA SAMPLES | ||||||||
| N5 | Alcamo | 37°58′39.26′′ | 12°58′33.76′′ | 10 | 48 | 42.86 | 13 | 3.19 |
| N6 | Cerda | 37°54′12.80′′ | 13°48′53.48′′ | 10 | 45 | 43.56 | 13 | 3.25 |
| N7 | Corleone | 37°48′42.31′′ | 13°17′39.11′′ | 10 | 43 | 39.2 | 11 | 2.86 |
| N8 | Gangi | 37°47′34.42′′ | 14°11′59.66′′ | 10 | 45 | 44.02 | 12 | 3.56 |
| N9 | Prizzi | 37°42′53.15′′ | 13°25′49.59′′ | 10 | 47 | 43.23 | 12 | 3.51 |
| N10 | San G. Jato | 37°58′07.17′′ | 13°10′41.08′′ | 10 | 46 | 41.71 | 12 | 3.37 |
| N11 | Lerida (Spain) | 41°35′08.58′′ | 0°42′18.85′′ | 10 | 55 | 51.03 | 10 | 4.97 |
| N12 | Lansarin (Tunisia) | 37°03′46.60′′ | 10°06′33.33′′ | 10 | 47 | 42.73 | 12 | 3.26 |
| Sample Source | Elements Concentration (mg/kg) | |||||||||||||
|---|---|---|---|---|---|---|---|---|---|---|---|---|---|---|
| Nubia Rec Garlic Samples | N1 | Nubia | Ba | Ca | Cu | Fe | K | Mg | Mn | Na | Se | Zn | Ni | |
| Mean | 0.518 | 1800 | 2.531 | 23.10 | 5920 | 269.7 | 10.39 | 98.56 | 0.244 | 17.63 | 0.048 | |||
| Std. Dev. | 0.096 | 110.8 | 0.211 | 1.156 | 36.80 | 5.814 | 0.702 | 4.685 | 0.430 | 1.767 | 0.007 | |||
| Skewness | −0.150 | −0.378 | 0.308 | −0.037 | 0.951 | −0.106 | 0.431 | −0.084 | 0.059 | 0.107 | 0.089 | |||
| Kurtosis | 0.815 | −0.501 | −1.331 | 0.083 | 0.109 | −0.715 | 0.551 | −1.25 | −1.489 | −1.06 | −0.849 | |||
| Range | 0.328–0.636 | 1585–1976 | 2.246–2.860 | 21.07–25.00 | 5877–5988 | 259.5–379.6 | 9.40–11.87 | 91.63–105.8 | 0.187–0.313 | 14.67–20.38 | 0.037–0.061 | |||
| N2 | Dattilo | Mean | 0.546 | 1723 | 2.843 | 20.76 | 7154 | 254.4 | 13.08 | 110.9 | 0.221 | 18.84 | 0.047 | |
| Std. Dev. | 0.116 | 92.57 | 0.095 | 0.904 | 178.57 | 8.577 | 0.405 | 7.446 | 0.023 | 2.838 | 0.006 | |||
| Skewness | 0.576 | −0.118 | −0.421 | 1.099 | −0.190 | −1.105 | 0.511 | −0.102 | 0.873 | 0.061 | 0.899 | |||
| Kurtosis | 0.021 | −0.413 | 0.848 | 1.714 | −0.346 | 1.138 | 0.357 | −0.893 | 0.844 | 0.688 | 0.849 | |||
| Range | 0.398–0.771 | 1575–1875 | 2.652–2.996 | 19.76–22.76 | 6849–7441 | 235.9–263.6 | 12.44–13.86 | 98.61–119.2 | 0.194–0.271 | 14.90–23.69 | 0.038–0.061 | |||
| N3 | Culcasi | Mean | 0.860 | 1740 | 3.261 | 24.10 | 6253 | 264.02 | 13.250 | 114.43 | 0.152 | 16.56 | 0.042 | |
| Std. Dev. | 0.107 | 138.67 | 0.191 | 0.724 | 277.79 | 4.72 | 0.461 | 10.065 | 0.018 | 2.014 | 0.008 | |||
| Skewness | −0.651 | −0.446 | −0.218 | −0.142 | 0.669 | 0.639 | 0.053 | −0.332 | −2.065 | −0.561 | 0.263 | |||
| Kurtosis | −1.414 | −1.486 | −1.569 | −1.076 | −1.173 | −1.415 | −1.267 | −0.364 | 5.229 | 0.0077 | −1.398 | |||
| Range | 0.685–0.976 | 1523–1911 | 2.998–3.498 | 23.08–25.16 | 5978–6742 | 259.16–271.42 | 12.55–13.81 | 99.16–131.01 | 0.104–0.171 | 12.91–19.69 | 0.031–0.055 | |||
| N4 | Verderame | Mean | 0.687 | 1823 | 3.110 | 15.671 | 7041 | 282.95 | 13.336 | 97.06 | 0.165 | 15.31 | 0.047 | |
| Std. Dev. | 0.132 | 119.86 | 0.134 | 1.442 | 141.28 | 10.295 | 0.794 | 3.072 | 0.41 | 1.437 | 0.008 | |||
| Skewness | −0.535 | 0.075 | 0.402 | −1.444 | −0.620 | 0.468 | −1.517 | −0.721 | 0.458 | −0.591 | −1.055 | |||
| Kurtosis | −0.983 | −1.239 | −0.834 | 2.287 | 1.664 | −1.099 | 0.935 | 0.205 | 0.604 | 2.281 | 0.631 | |||
| Range | 0.473–0.850 | 1653–1989 | 2.915–3.332 | 12.34–17.00 | 6740–7249 | 270.42–300.01 | 11.77–13.98 | 90.95–101.30 | 0.110–0.248 | 12.26–17.84 | 0.029–0.057 | |||
| Non Nubia Samples | N5 | Alcamo | Mean | 0.211 | 1274 | 0.946 | 24.63 | 4349 | 245.56 | 7.529 | 94.13 | 0.196 | 9.249 | 0.122 |
| Std. Dev. | 0.023 | 235.94 | 0.062 | 1.423 | 307.04 | 25.529 | 0.356 | 11.96 | 0.003 | 1.495 | 0.015 | |||
| Skewness | −0.754 | −0.541 | −0.491 | −0.462 | 0.557 | 1.554 | −0.777 | −1.874 | −0.221 | 1.047 | 0.765 | |||
| Kurtosis | −1.082 | −3.232 | −2.295 | −2.462 | −2.457 | 2.322 | −2.242 | 3.74 | −1.317 | 1.998 | 0.182 | |||
| Range | 0.178−0.236 | 1010–1478 | 0.867–1.012 | 22.81–25.96 | 4080–4746 | 225.79–287.98 | 7.04–7.89 | 73.45–103.25 | 0.015–0.024 | 7.570–11.62 | 0.105–0.146 | |||
| N6 | Cerda | Mean | 0.332 | 1592 | 2.811 | 17.89 | 4663 | 277.53 | 12.204 | 100.698 | 0.045 | 8.993 | 0.468 | |
| Std. Dev. | 0.11 | 95.30 | 0.127 | 0.183 | 138.701 | 10.368 | 1.18 | 1.493 | 0.015 | 2.653 | 0.337 | |||
| Skewness | −0.794 | −0.446 | −1.533 | 0.605 | 0.044 | −0.621 | −0.806 | 0.487 | −0.235 | 0.053 | −0.552 | |||
| Kurtosis | −1.833 | −0.263 | 2.388 | −1.601 | −1.927 | −1.011 | −1.703 | −0.463 | −0.922 | −2.5 | −3.216 | |||
| Range | 0.178–0.426 | 1456–1701 | 2.600–2.917 | 17.72–18.14 | 4522–4840 | 264.37–290.84 | 10.54–13.25 | 98.98–102.81 | 0.025–0.064 | 5.923–12.00 | 0.066–0.117 | |||
| N7 | Corleone | Mean | 0.220 | 1515 | 2.201 | 13.74 | 3442 | 248.57 | 11.045 | 119.20 | 0.045 | 8.113 | 0.057 | |
| Std. Dev. | 0.042 | 176.35 | 0.274 | 0.192 | 573.01 | 29.681 | 0.606 | 3.529 | 0.014 | 0.686 | 0.022 | |||
| Skewness | 0.188 | −1.303 | 0.307 | 0.277 | 0.461 | −1.938 | 0.424 | −0.531 | −0.192 | 1.188 | −0.678 | |||
| Kurtosis | −1.847 | 0.562 | −1.458 | −0.137 | −3.082 | 3.849 | −1.581 | −0.185 | 1.461 | 1.370 | 1.054 | |||
| Range | 0.175–0.275 | 1237–1636 | 1.875–2.560 | 13.50–14.01 | 2875–4087 | 197.00–269.31 | 10.41–11.86 | 114.11–123.21 | 0.025–0.065 | 7.500–9.200 | 0.024–0.084 | |||
| N8 | Gangi | Mean | 0.222 | 967.0 | 2.114 | 17.25 | 4304 | 294.78 | 8.815 | 84.075 | 0.028 | 9.515 | 0.112 | |
| Std. Dev. | 0.083 | 56.51 | 0.179 | 0.228 | 353.74 | 7.382 | 0.241 | 30.256 | 0.008 | 1.282 | 0.031 | |||
| Skewness | 0.588 | 0.361 | 0.037 | −0.922 | 0.824 | 0.034 | −1.536 | 2.160 | 1.886 | −0.770 | 0.005 | |||
| Kurtosis | −3.183 | −0.600 | −2.545 | 1,154 | −0.432 | 0.006 | 2.319 | 4.728 | 3.859 | −2.266 | −0.529 | |||
| Range | 0.150–0.320 | 899.0–1045 | 1.913–2.322 | 16.89–17.50 | 3981–4827 | 284.98–304.65 | 8.41–9.02 | 65.71–137.82 | 0.021–0.043 | 8.160–11.08 | 0.070–0.153 | |||
| N9 | Prizzi | Mean | 0.190 | 1016 | 1.959 | 13.70 | 4294 | 275.36 | 10.197 | 135.75 | 0.05 | 6.628 | 0.073 | |
| Std. Dev. | 0.032 | 63.90 | 0.098 | 0.371 | 244.41 | 16.544 | 0.476 | 10.43 | 0.0190 | 0.679 | 0.015 | |||
| Skewness | −0.353 | 0.473 | −1.919 | −1.429 | 0.071 | −1.709 | 0.825 | −0.265 | −1.185 | 1.651 | 0.363 | |||
| Kurtosis | −2.309 | −2.158 | 4.050 | 2.113 | −2.73 | 3.161 | −1.096 | −1.517 | 1.658 | 3.099 | −2.662 | |||
| Range | 0.150–0.225 | 947.0–1098 | 1.787–2.040 | 13.08–14.00 | 4023–4566 | 247.25–289.20 | 9.77–10.88 | 121.86–147.21 | 0.019–0.070 | 6.016–7.777 | 0.056–0.092 | |||
| N10 | San G. Jato | Mean | 0.211 | 1447 | 1.806 | 14.23 | 3029.4 | 184.20 | 10.489 | 113.90 | 0.067 | 11.69 | 0.061 | |
| Std. Dev. | 0.028 | 76.10 | 0.040 | 0.526 | 59.79 | 3.99 | 0.531 | 5.56 | 0.016 | 4.109 | 0.012 | |||
| Skewness | 0.316 | 0.900 | 1.740 | 0.885 | 1.529 | 0.742 | −0.003 | 0.829 | −0.334 | 2.066 | −1.519 | |||
| Kurtosis | −2.156 | 0.918 | 3.256 | −0.734 | 2.561 | −0.573 | −2.31 | 0.992 | −2.132 | 4.335 | 2.445 | |||
| Range | 0.117–0.246 | 1365–1564 | 1.776–1.875 | 13.72–14.99 | 2980–3129 | 180.11–190.01 | 9.87–11.12 | 107.62–122.40 | 0.046–0.085 | 9.200–18.92 | 0.040–0.071 | |||
| N11 | Spain | Mean | 0.216 | 804.6 | 0.960 | 25.10 | 2898 | 164.08 | 6.347 | 132.46 | 0.03 | 10.23 | 0.669 | |
| Std. Dev. | 0.086 | 107.16 | 0.144 | 0.260 | 185.30 | 10.13 | 0.399 | 34.548 | 0.01 | 2.446 | 0.262 | |||
| Skewness | 1.275 | 0.419 | 0.802 | 0.640 | −0.845 | −0.379 | 0.489 | 0.099 | 0.343 | −0.376 | −1.284 | |||
| Kurtosis | 2.721 | −1.375 | 0.317 | −0.393 | −0.306 | 0.651 | −1.549 | −2.34 | −0.457 | −0.245 | 1.567 | |||
| Range | 0.098–0.415 | 675.0–982.0 | 0.764–1.245 | 24.78–25.57 | 2537–3088 | 145.96–181.52 | 5.92–6.98 | 96.52–176.21 | 0.015–0.051 | 6.160–13.94 | 0.092–0.910 | |||
| N12 | Tunisia | Mean | 0.187 | 698.2 | 1.137 | 29.97 | 3268 | 270.61 | 10.173 | 97.55 | 0.017 | 9.350 | 0.651 | |
| Std. Dev. | 0.089 | 64.418 | 0.158 | 0.326 | 201.8 | 10.976 | 0.577 | 5.555 | 0.005 | 2.785 | 0.299 | |||
| Skewness | 0.112 | 0.422 | 0.381 | 2.285 | −0.074 | 0.385 | −0.549 | −1.089 | 1.05 | 0.637 | −1.373 | |||
| Kurtosis | −1.978 | −1.560 | −1.031 | 5.813 | −0.993 | 0.083 | 0.171 | 1.743 | 0.188 | −0.825 | 0.558 | |||
| Range | 0.105–0.300 | 618.0–798.0 | 0.957–1.412 | 29.69–30.81 | 2968–3555 | 251.54–288.28 | 9.02–10.84 | 85.27–104.25 | 0.012–0.027 | 5.94–13.74 | 0.102–0.910 | |||
| Element | Isotope | LOD a (mg/kg) | LOQ b (mg/kg) | Calibration Range (mg/kg) | R 2 c | Precision (SDR%, n = 10) d | Accuracy e (%) |
|---|---|---|---|---|---|---|---|
| Al | 27 | 0.015 | 0.052 | 0.020–2 | 0.9998 | 2.9 | 85.63 |
| As | 75 | 0.010 | 0.035 | 0.020–2 | 0.9996 | 2.6 | 89.78 |
| Ba | 137 | 0.015 | 0.052 | 0.020–5 | 0.9999 | 3.7 | 90.71 |
| Ca | 44 | 0.017 | 0.059 | 0.5–50 | 0.9993 | 2.9 | 101.54 |
| Cd | 111 | 0.018 | 0.063 | 0.020–2 | 0.9999 | 2.7 | 94.53 |
| Cr | 52 | 0.011 | 0.038 | 0.020–2 | 0.9998 | 2.4 | 91.78 |
| Cu | 63 | 0.018 | 0.063 | 0.020–5 | 0.9999 | 2.1 | 86.56 |
| Fe | 57 | 0.017 | 0.059 | 0.5–50 | 0.9999 | 2.2 | 96.54 |
| K | 39 | 0.016 | 0.056 | 0.5–50 | 0.9991 | 3.6 | 102.31 |
| Mg | 24 | 0.015 | 0.052 | 0.5–50 | 0.9993 | 3.3 | 101.44 |
| Mn | 55 | 0.014 | 0.049 | 0.5–50 | 0.9999 | 2.9 | 102.9 |
| Na | 23 | 0.016 | 0.056 | 0.5–50 | 0.9997 | 2.6 | 86.76 |
| Ni | 60 | 0.010 | 0.035 | 0.020–5 | 0.9999 | 3.2 | 83.32 |
| Sb | 121 | 0.012 | 0.042 | 0.020–2 | 0.9999 | 2.8 | 93.68 |
| Pb | 208 | 0.011 | 0.038 | 0.020–2 | 0.9999 | 2.1 | 94.37 |
| Se | 77 | 0.010 | 0.035 | 0.020–2 | 0.9995 | 2.5 | 85.89 |
| Zn | 66 | 0.016 | 0.056 | 0.5–50 | 0.9999 | 3.1 | 97.32 |
© 2016 by the authors; licensee MDPI, Basel, Switzerland. This article is an open access article distributed under the terms and conditions of the Creative Commons by Attribution (CC-BY) license (http://creativecommons.org/licenses/by/4.0/).
Share and Cite
Vadalà, R.; Mottese, A.F.; Bua, G.D.; Salvo, A.; Mallamace, D.; Corsaro, C.; Vasi, S.; Giofrè, S.V.; Alfa, M.; Cicero, N.; et al. Statistical Analysis of Mineral Concentration for the Geographic Identification of Garlic Samples from Sicily (Italy), Tunisia and Spain. Foods 2016, 5, 20. https://doi.org/10.3390/foods5010020
Vadalà R, Mottese AF, Bua GD, Salvo A, Mallamace D, Corsaro C, Vasi S, Giofrè SV, Alfa M, Cicero N, et al. Statistical Analysis of Mineral Concentration for the Geographic Identification of Garlic Samples from Sicily (Italy), Tunisia and Spain. Foods. 2016; 5(1):20. https://doi.org/10.3390/foods5010020
Chicago/Turabian StyleVadalà, Rossella, Antonio F. Mottese, Giuseppe D. Bua, Andrea Salvo, Domenico Mallamace, Carmelo Corsaro, Sebastiano Vasi, Salvatore V. Giofrè, Maria Alfa, Nicola Cicero, and et al. 2016. "Statistical Analysis of Mineral Concentration for the Geographic Identification of Garlic Samples from Sicily (Italy), Tunisia and Spain" Foods 5, no. 1: 20. https://doi.org/10.3390/foods5010020
APA StyleVadalà, R., Mottese, A. F., Bua, G. D., Salvo, A., Mallamace, D., Corsaro, C., Vasi, S., Giofrè, S. V., Alfa, M., Cicero, N., & Dugo, G. (2016). Statistical Analysis of Mineral Concentration for the Geographic Identification of Garlic Samples from Sicily (Italy), Tunisia and Spain. Foods, 5(1), 20. https://doi.org/10.3390/foods5010020