Simultaneous Determination of Pigments, Tocopherols, and Squalene in Greek Olive Oils: A Study of the Influence of Cultivation and Oil-Production Parameters


 , ,
, , 
Abstract
:1. Introduction
2. Materials and Methods
2.1. Chemicals and Reagents
2.2. Samples
2.3. Sample Preparation and Analysis
2.4. Method Validation
3. Results and Discussion
3.1. Method Development and Validation
3.2. Samples Results
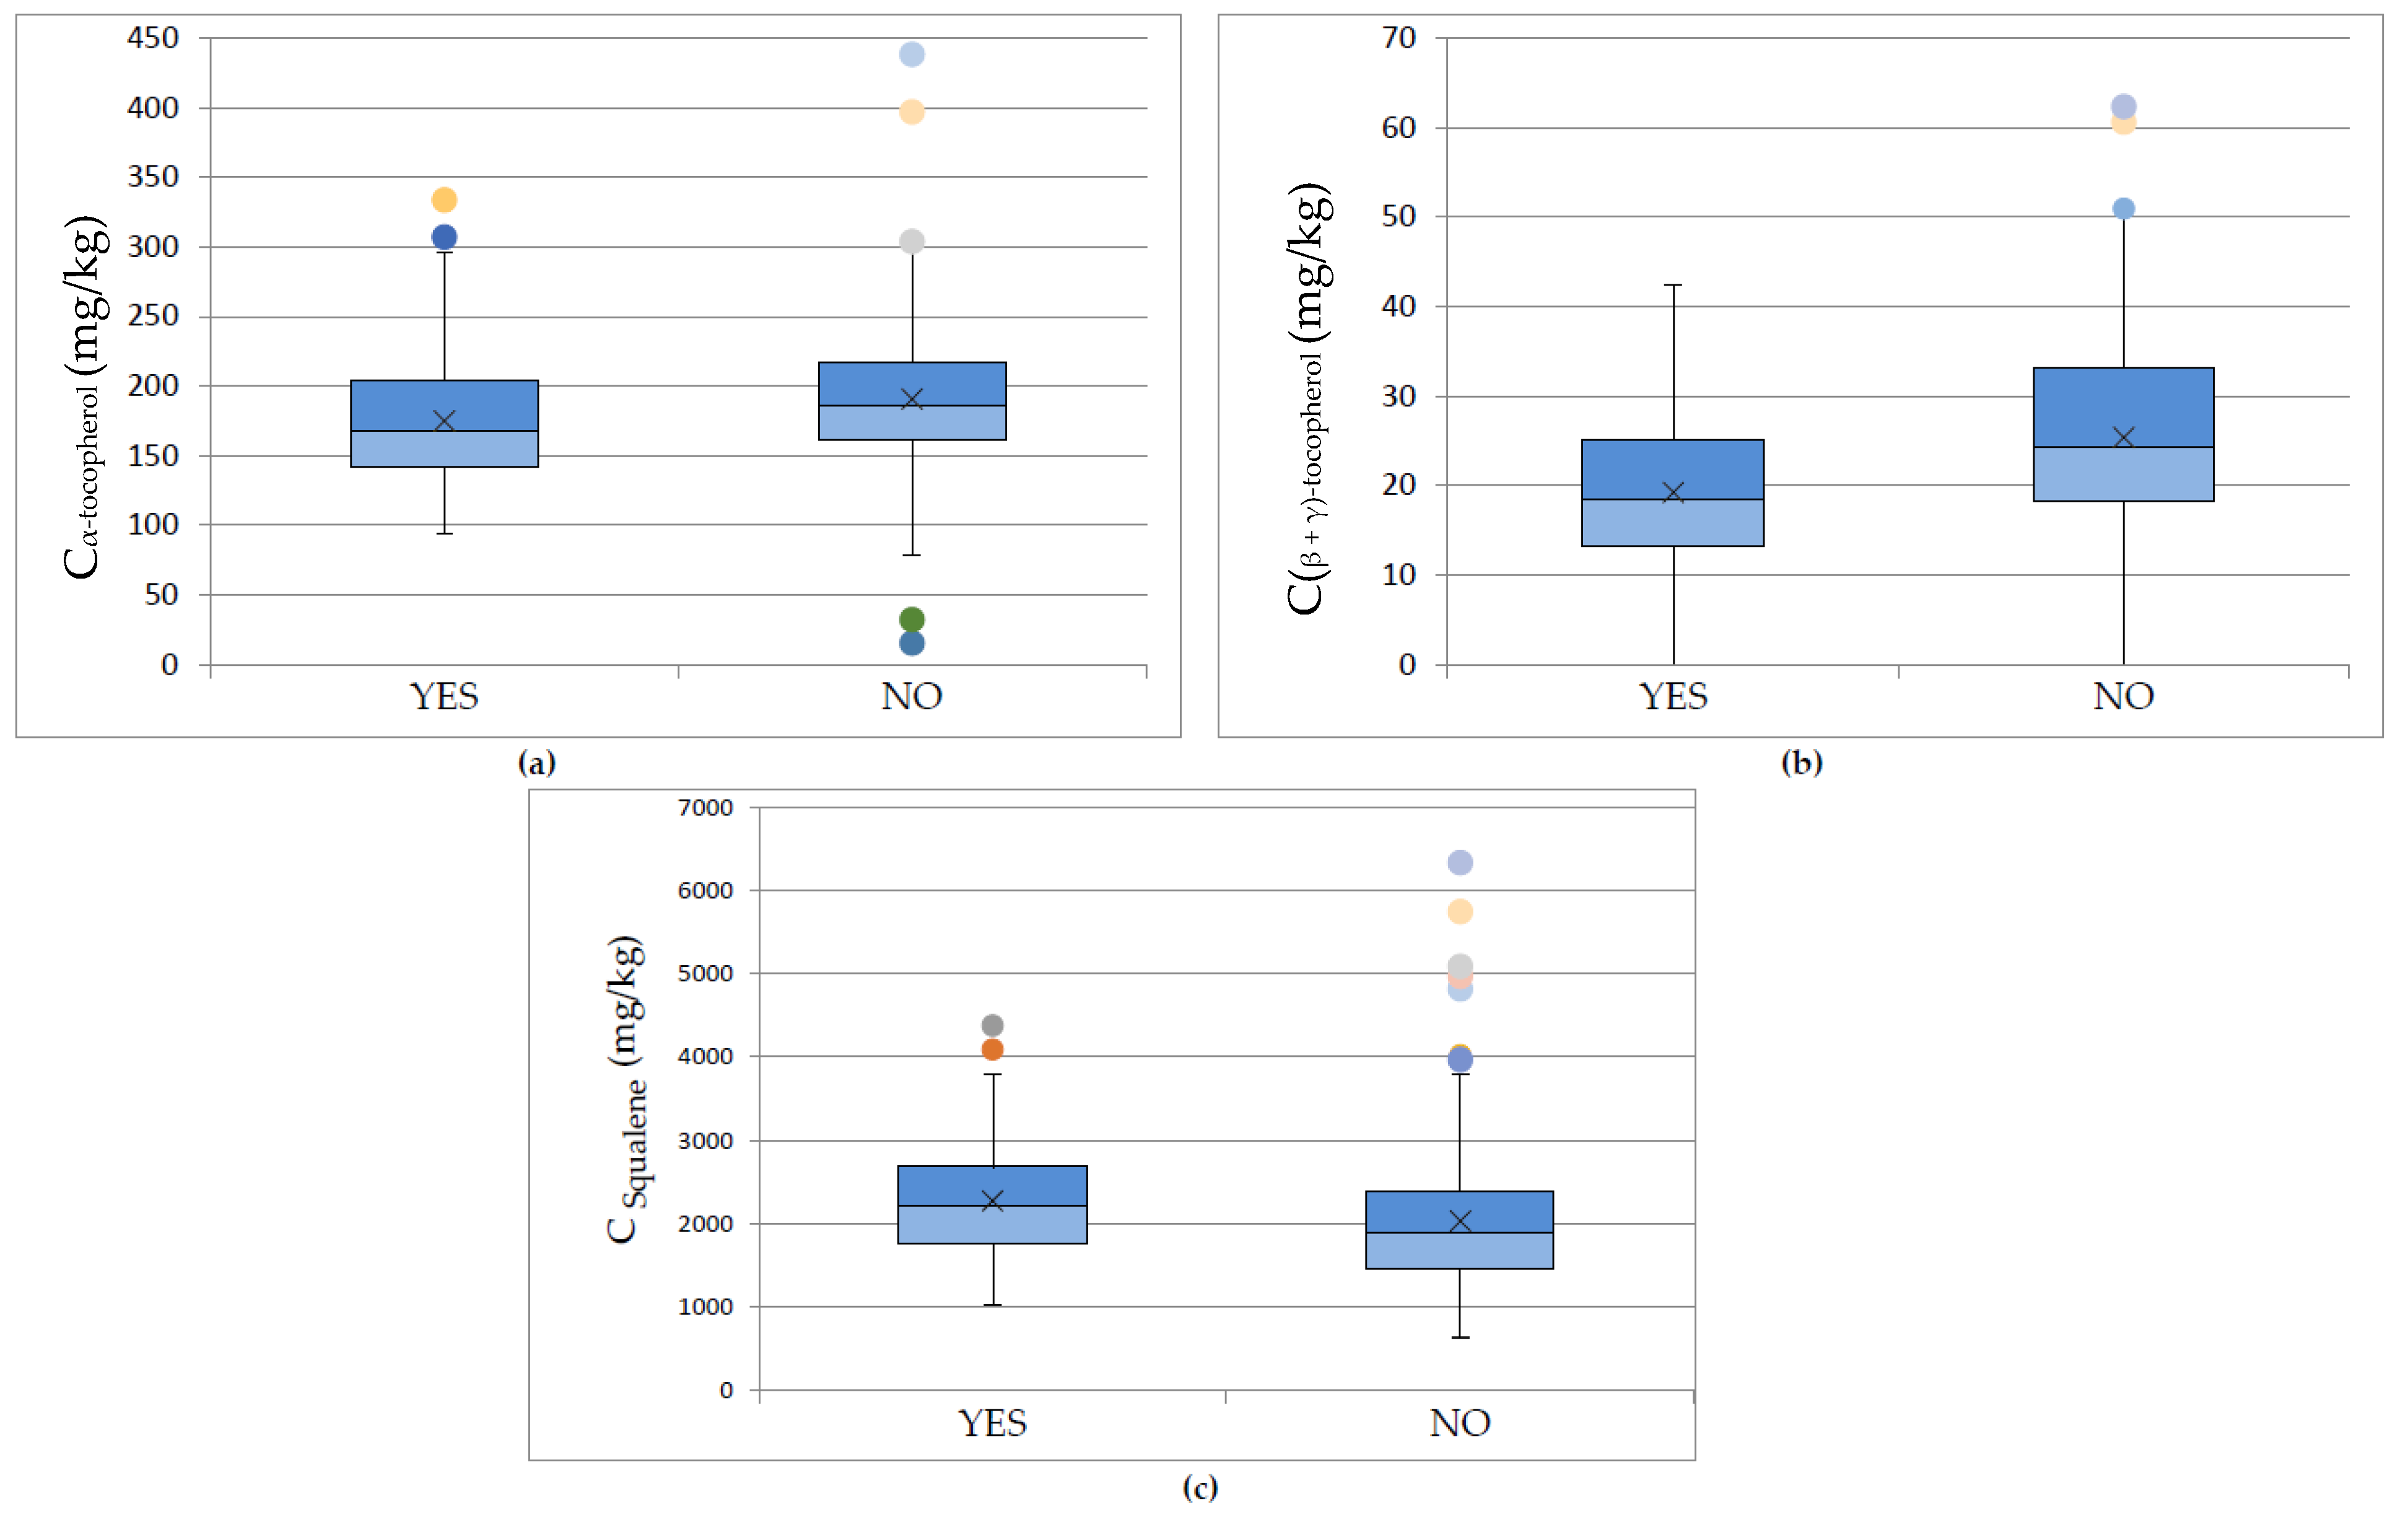
3.3. Effect of Cultivation and Olive-Producing Parameters
4. Conclusions
Supplementary Materials
Author Contributions
Funding
Acknowledgments
Conflicts of Interest
References
- Borello, E.; Domenici, V. Determination of Pigments in Virgin and Extra-Virgin Olive Oils: A Comparison between Two Near UV-Vis Spectroscopic Techniques. Foods 2019, 8, 18. [Google Scholar] [CrossRef] [PubMed] [Green Version]
- Tapiero, H.; Townsend, D.M.; Tew, K.D. The role of carotenoids in the prevention of human pathologies. Biomed Pharm. 2004, 58, 100–110. [Google Scholar] [CrossRef] [PubMed]
- Kritchevsky, S.B. Beta-Carotene, carotenoids and the prevention of coronary heart disease. J. Nutr. 1999, 129, 5–8. [Google Scholar] [CrossRef] [PubMed] [Green Version]
- Egeland, E.S. Carotenoids. In The Physiology of Microalgae; Borowitzka, M., Beardall, J., Raven, J., Eds.; Developments in Applied Phycology; Springer International Publishing: Cham, Switzerland, 2016; Volume 6. [Google Scholar]
- Giuliani, A.; Cerretani, L.; Cichelli, A. Chlorophylls in olive and in olive oil: Chemistry and occurrences. Crit. Rev. Food Sci. Nutr. 2011, 51, 678–690. [Google Scholar] [CrossRef] [PubMed]
- Cayuela, J.A.; Yousfi, K.; Carmen Martínez, M.; García, J.M. Rapid Determination of Olive Oil Chlorophylls and Carotenoids by Using Visible Spectroscopy. J. Am. Oil Chem. Soc. 2014, 91, 1677–1684. [Google Scholar] [CrossRef] [Green Version]
- Yalcin, S.; Schreiner, M. Stabilities of tocopherols and phenolic compounds in virgin olive oil during thermal oxidation. J. Food Sci. Technol. 2018, 55, 244–251. [Google Scholar] [CrossRef]
- Jukić Špika, M.; Kraljić, K.; Škevin, D. Tocopherols: Chemical Structure, Bioactivity, and Variability in Croatian Virgin Olive Oils. In Products from Olive Tree; Boskou, D., Clodoveo, M.L., Eds.; InTechOpen: Rijeka, Croatia, 2016; pp. 317–329. [Google Scholar] [CrossRef] [Green Version]
- Rodriguez-Rodriguez, R.; Simonsen, U. Natural Triterpenoids from Olive Oil: Potential Activities Against Cancer. In Natural Compounds as Inducers of Cell Death; Diederich, M., Noworyta, K., Eds.; Springer: Cham, Switzerland, 2012; Volume 1, pp. 447–461. [Google Scholar] [CrossRef]
- Newmark, H.L. Squalene, olive oil, and cancer risk: A review and hypothesis. Cancer Epidemiol. Biomark. Prev. 1997, 6, 1101–1103. [Google Scholar] [CrossRef]
- Yousfi, K.; Cert, R.M.; García, J.M. Changes in quality and phenolic compounds of virgin olive oils during objectively described fruit maturation. Eur. Food Res. Technol. 2005, 223, 117–124. [Google Scholar] [CrossRef]
- Di Giovacchino, L.; Solinas, M.; Miccoli, M. Effect of Extraction Systems on the Quality of Virgin Olive Oil. J. Am. Oil Chem. Soc. 1994, 71, 1189–1194. [Google Scholar] [CrossRef]
- Jiménez, B.; Sánchez-Ortiz, A.; Rivas, A. Influence of the malaxation time and olive ripening stage on oil quality and phenolic compounds of virgin olive oils. Int. J. Food Sci. Tech. 2014, 49, 2521–2527. [Google Scholar] [CrossRef]
- Beltrán, G.; Jiménez, A.; del Rio, C.; Sánchez, S.; Martínez, L.; Uceda, M.; Aguilera, M.P. Variability of vitamin E in virgin olive oil by agronomical and genetic factors. J. Food Compos. Anal. 2010, 23, 633–639. [Google Scholar] [CrossRef]
- Beltrán, G.; Bucheli, M.E.; Aguilera, M.P.; Belaj, A.; Jimenez, A. Squalene in virgin olive oil: Screening of variability in olive cultivars. Eur. J. Lipid Sci. Tech. 2016, 118, 1250–1253. [Google Scholar] [CrossRef]
- International Olive Council. World Olive Oil Figures. Available online: http://www.internationaloliveoil.org/estaticos/view/131-world-olive-oil-figures (accessed on 16 September 2019).
- Hornero-Méndez, D.; Gandul-Rojas, B.; Mínguez-Mosquera, M.I. Routine and sensitive SPE-HPLC method for quantitative determination of pheophytin a and pyropheophytin a in olive oils. Food Res. Int. 2005, 38, 1067–1072. [Google Scholar] [CrossRef]
- Gliszczyńska-Świgło, A.; Sikorska, E. Simple reversed-phase liquid chromatography method for determination of tocopherols in edible plant oils. J. Chromatogr. A 2004, 1048, 195–198. [Google Scholar] [CrossRef]
- Harris, W.D.; Hayward, J.W.; Lamb, R.A. Isopropanol as a Solvent for Extraction of Cottonseed Oil. II. Separation of Purified Oil from Miscella. J. Am. Oil Chem. Soc. 1949, 26, 719–723. [Google Scholar] [CrossRef]
- Psomiadou, E.; Tsimidou, M. Simultaneous HPLC Determination of Tocopherols, Carotenoids, and Chlorophylls for Monitoring Their Effect on Virgin Olive Oil Oxidation. J. Agric. Food Chem. 1998, 46, 5132–5138. [Google Scholar] [CrossRef]
- Aparicio-Ruiz, R.; Gandul-Rojas, B.; Roca, M. Pigment profile in non-Spanish olive varieties (Olea europaea L. Var. Coratina, Frantoio, and Koroneiki). J. Agric. Food Chem. 2009, 57, 10831–10836. [Google Scholar] [CrossRef]
- Ambra, R.; Natella, F.; Lucchetti, S.; Forte, V.; Pastore, G. Alpha-Tocopherol, beta-carotene, lutein, squalene and secoiridoids in seven monocultivar Italian extra-virgin olive oils. Int. J. Food Sci. Nutr. 2017, 68, 538–545. [Google Scholar] [CrossRef]
- Portilla, G.; Robert, P.; Sepúlveda, B.; Romero, N. Carotenoid Pigments, Polyphenols, Tocopherols and Fat Composition of Extra Virgin Olive Oils Produced in Chile. Acta. Hortic. 2014, 619–626. [Google Scholar] [CrossRef]
- Gu, Q.; Yi, X.; Zhang, Z.; Yan, H.; Shi, J.; Zhang, H.; Wang, Y.; Shao, J. A facile method for simultaneous analysis of phytosterols, erythrodiol, uvaol, tocopherols and lutein in olive oils by LC-MS. Anal. Methods 2016, 8, 1373–1380. [Google Scholar] [CrossRef]
- Zhang, L.; Wang, S.; Yang, R.; Mao, J.; Jiang, J.; Wang, X.; Zhang, W.; Zhang, Q.; Li, P. Simultaneous determination of tocopherols, carotenoids and phytosterols in edible vegetable oil by ultrasound-assisted saponification, LLE and LC-MS/MS. Food Chem. 2019, 289, 313–319. [Google Scholar] [CrossRef] [PubMed]
- Kalogiouri, N.P.; Aalizadeh, R.; Thomaidis, N.S. Investigating the organic and conventional production type of olive oil with target and suspect screening by LC-QTOF-MS, a novel semi-quantification method using chemical similarity and advanced chemometrics. Anal. Bioanal. Chem. 2017, 409, 5413–5426. [Google Scholar] [CrossRef] [PubMed]
- Kalogiouri, N.P.; Aalizadeh, R.; Thomaidis, N.S. Application of an advanced and wide scope non-target screening workflow with LC-ESI-QTOF-MS and chemometrics for the classification of the Greek olive oil varieties. Food Chem. 2018, 256, 53–61. [Google Scholar] [CrossRef] [PubMed]
- Karkoula, E.; Skantzari, A.; Melliou, E.; Magiatis, P. Quantitative measurement of major secoiridoid derivatives in olive oil using qNMR. Proof of the artificial formation of aldehydic oleuropein and ligstroside aglycon isomers. J. Agric. Food Chem. 2014, 62, 600–607. [Google Scholar] [CrossRef]
- Gandul-Rojas, B.; Minguez-Mosquera, M.I. Chlorophyll and Carotenoid Composition in Virgin Olive Oils from Various Spanish Olive Varieties. J. Sci. Food Agric. 1996, 72, 31–39. [Google Scholar] [CrossRef]
- Giuffrida, D.; Salvo, F.; Salvo, A.; Pera, L.L.; Dugo, G. Pigments composition in monovarietal virgin olive oils from various sicilian olive varieties. Food Chem. 2007, 101, 833–837. [Google Scholar] [CrossRef]
- Benito, M.; Oria, R.; Sanchez-Gimeno, A.C. Characterization of the olive oil from three potentially interesting varieties from Aragon (Spain). Food Sci. Technol. Int. 2010, 16, 523–530. [Google Scholar] [CrossRef]
- Clodoveo, M.L. Malaxation: Influence on virgin olive oil quality. Past, present and future—An overview. Trends Food Sci. Tech. 2012, 25, 13–23. [Google Scholar] [CrossRef]
- Lombardo, L.; Grasso, F.; Lanciano, F.; Loria, S.; Monetti, E. Broad-Spectrum Health Protection of Extra Virgin Olive Oil Compounds. Stud. Nat. Prod. Chem. 2018, 57, 41–77. [Google Scholar] [CrossRef]
- Psomiadou, E.; Tsimidou, M.; Boskou, D. Alpha-tocopherol content of Greek virgin olive oils. J. Agric. Food Chem. 2000, 48, 1770–1775. [Google Scholar] [CrossRef]
- Karabagias, I.K.; Badeka, A.; Casiello, G.; Longobardi, F.; Kontominas, M.G. Rapid screening of olive oil cultivar differentiation based on selected physicochemical parameters, pigment content and fatty acid composition using advanced chemometrics. Eur. Food Res. Technol. 2019, 245, 2027–2038. [Google Scholar] [CrossRef]


| Compound | Wavelength (nm) | Retention Time (min) |
|---|---|---|
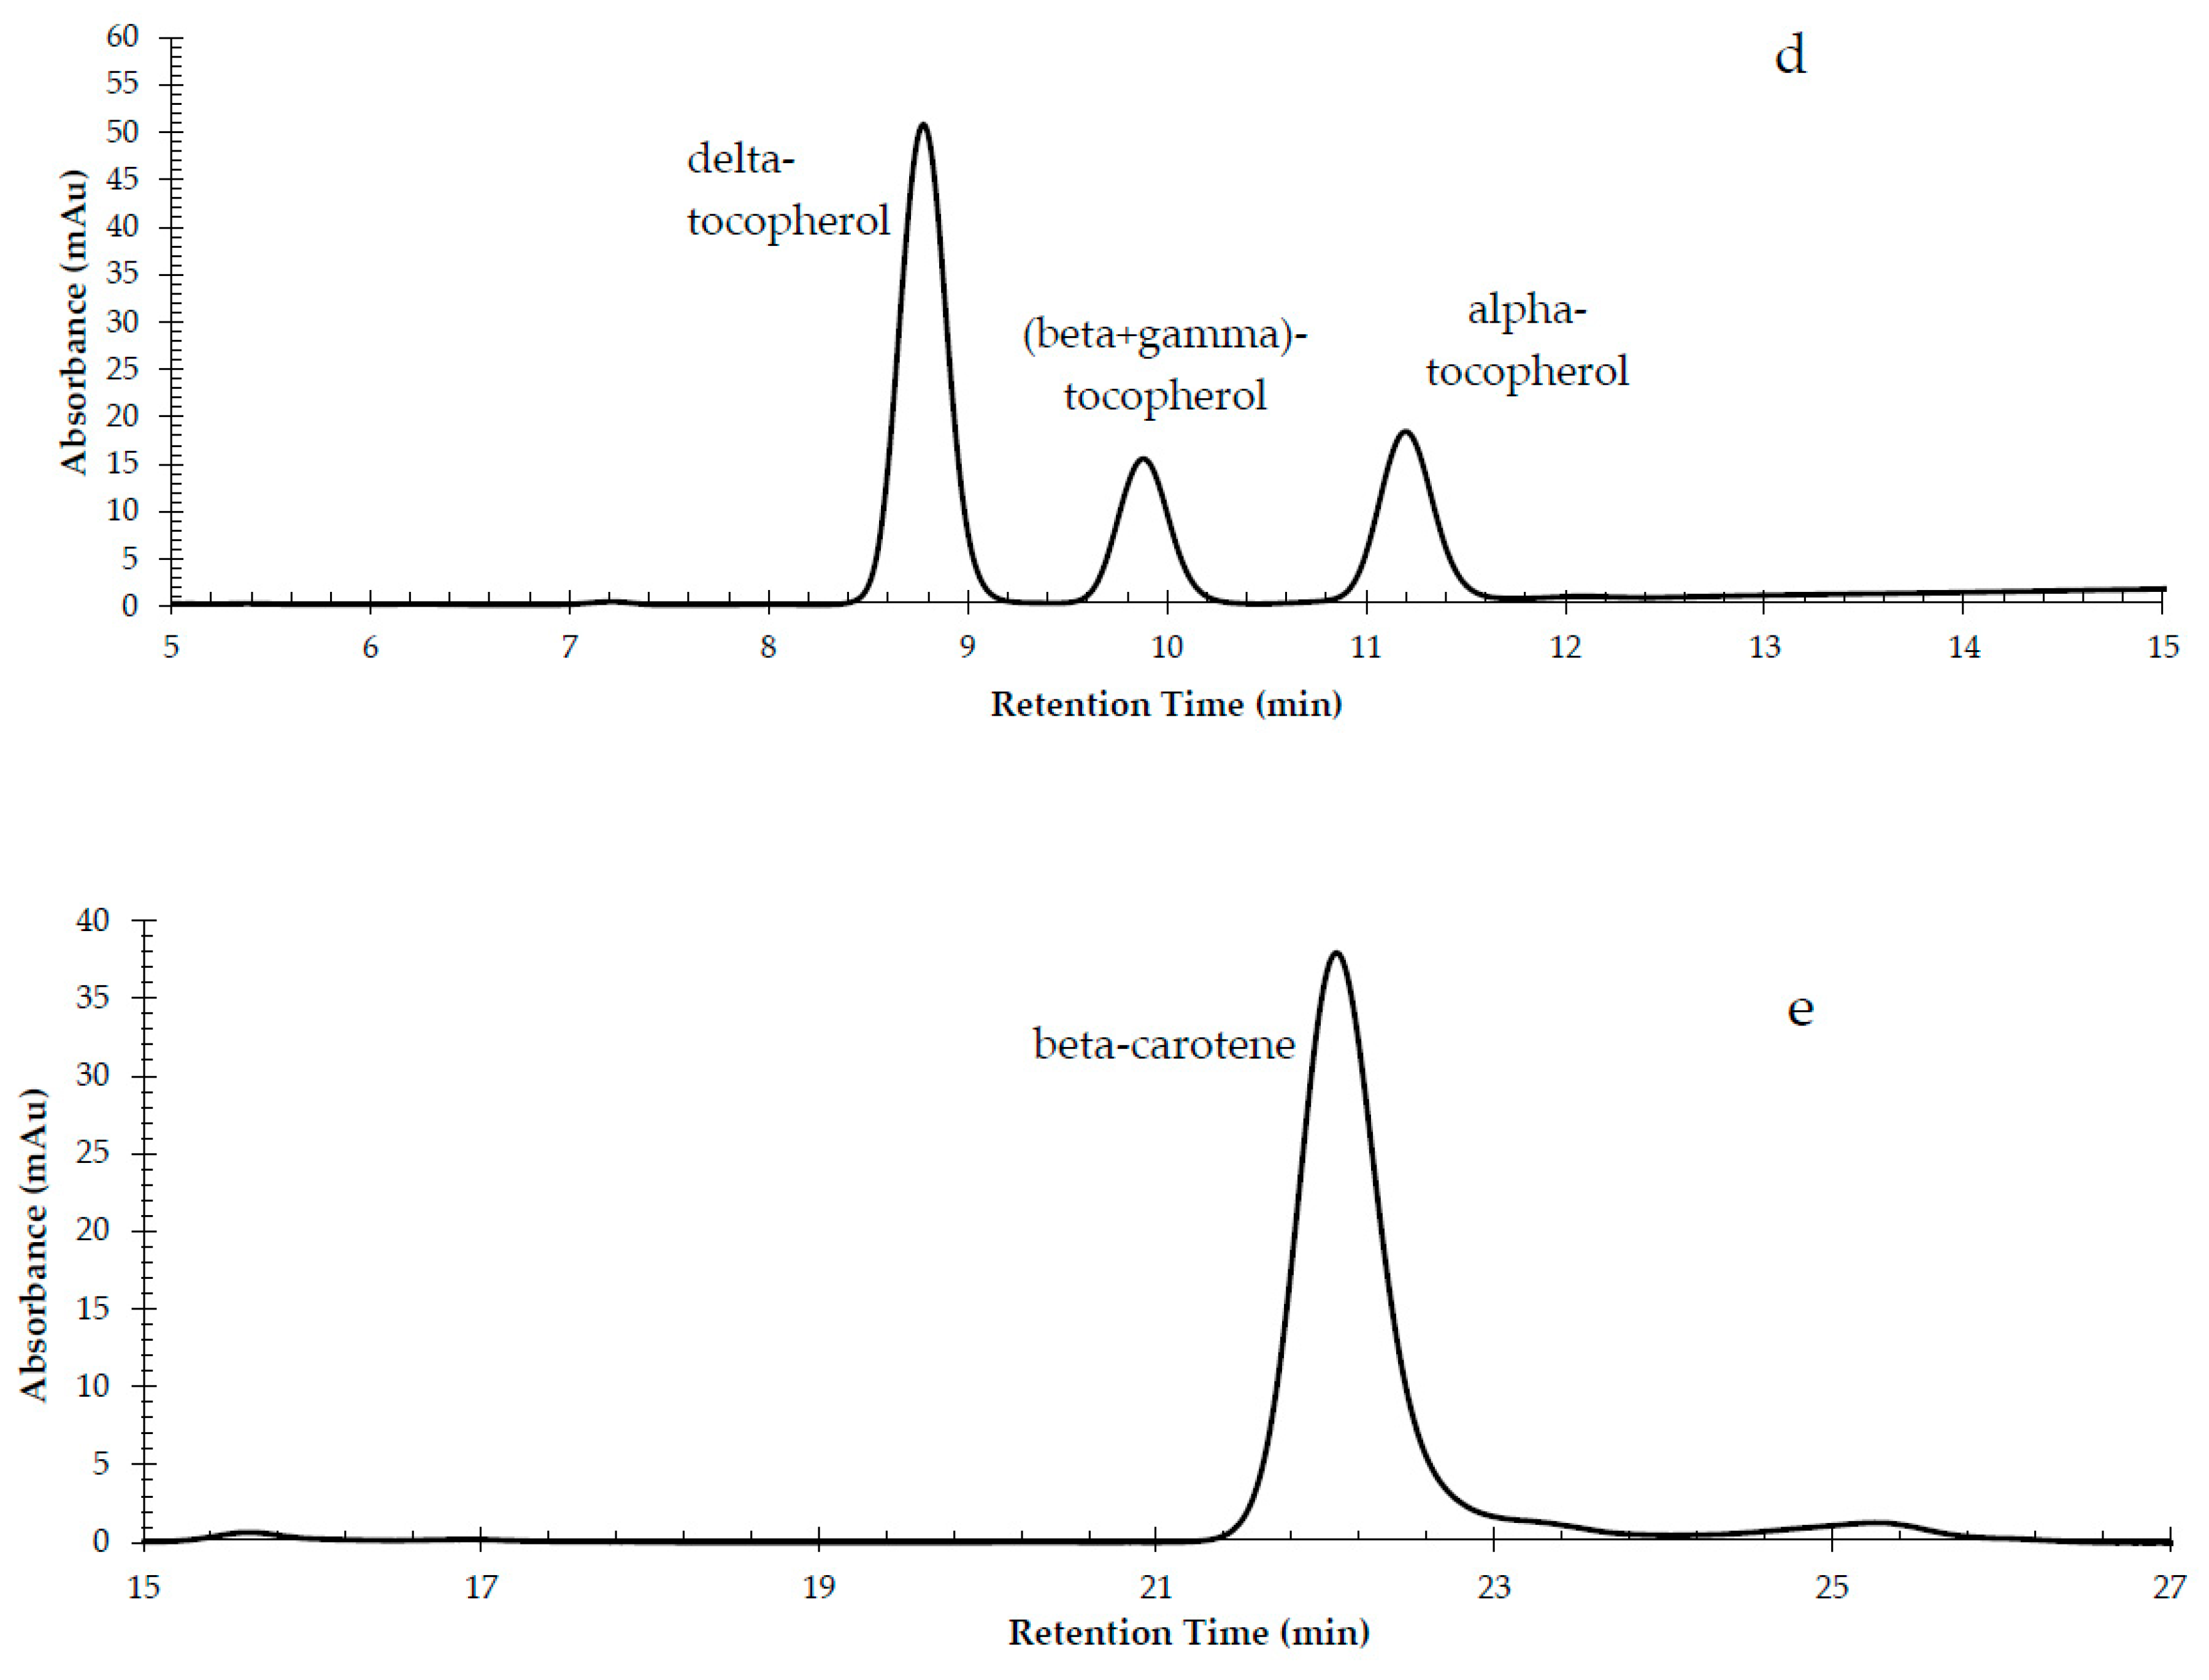
| Carotenoids | 430 and 450 | Lutein: 6.5 β-carotene: 22.5 |
| Tocopherols | 295 | α-tocopherol: 11.0 γ-tocopherol: 10.0 δ-tocopherol: 9.0 |
| Chlorophylls | 410 and 660 | Chlorophyll a: 10.0 Chlorophyll a’: 11.0 Pheophytin a: 18.0 Pyropheophytin: 25.0 |
| Squalene | 210 | Squalene: 16.5 |
| Compound | Concentration Range (mg/L) | Calibration Curve | Correlation Factor (r) |
|---|---|---|---|
| β-carotene | 0.1–5.5 | y = 111.6 (±3.1) x +11.8 (± 8.6) | 0.998 |
| lutein | 0.01–10 | y = 198.70 (±0.84) x +7.4 (±3.9) | 0.999 |
| α-tocopherol | 2–140 | y = 7.373 (±0.049) x −1.3 (±3.3) | 0.9998 |
| γ-tocopherol | 0.5–20 | y = 9.382 (±0.030) x −0.27 (±0.26) | 0.99994 |
| δ-tocopherol | 1–100 | y = 8.14 (±0.21) x −7.7 (±10.9) | 0.998 |
| squalene | 20–600 | y = 66.5 (±2.6) x +244 (±301) | 0.997 |
| chlorophyll | 0.5–10 | y = 42.72 (±0.68) x +3.7 (±3.5) | 0.9995 |
| Compound | Low Concentration (%R ± SD 1) (n = 6) | Medium Concentration (%R ± SD 1) (n = 6) | High Concentration (%R ± SD 1) (n = 6) |
|---|---|---|---|
| β-carotene | 94.3 ± 4.9 | 96.6 ± 9.4 | 82.1 ± 1.8 |
| lutein | 96.6 ± 1.0 | 91.1 ± 3.6 | 88.6 ± 3.9 |
| α-tocopherol | 98.2 ± 6.6 | 95.1 ± 6.4 | 96.7 ± 2.6 |
| γ-tocopherol | 98.6 ± 4.2 | 95.7 ± 6.1 | 93.2 ± 1.5 |
| δ-tocopherol | 105.9 ± 4.0 | 107.6 ± 1.8 | 106.9 ± 2.8 |
| squalene | 109.3 ± 3.8 | 101.0 ± 6.4 | 92.0 ± 5.6 |
| chlorophyll | 90.4 ± 5.1 | 91.8 ± 1.4 | 89.6 ± 1.5 |
| Compound | Low Concentration (%R ± SD 1) (n = 18) | Medium Concentration (%R ± SD 1) (n = 18) | High Concentration (%R ± SD 1) (n = 18) |
|---|---|---|---|
| β-carotene | 104.3 ± 10.2 | 97.2 ± 10.8 | 100.1 ± 15.3 |
| lutein | 93.5 ± 4.6 | 92.7 ± 3.2 | 91.0 ± 4.3 |
| squalene | 102.7 ± 7.5 | 102.1 ± 8.4 | 104.2 ± 7.2 |
| α-tocopherol | 99.5 ± 3.6 | 100.0 ± 6.0 | 99.6 ± 6.4 |
| γ-tocopherol | 105.3 ± 4.6 | 105.6 ± 5.2 | 104.2 ± 6.6 |
| δ-tocopherol | 103.6 ± 6.2 | 99.2 ± 4.4 | 96.0 ± 5.0 |
| chlorophyll | 101.1 ± 10.3 | 100.4 ± 7.9 | 102.1 ± 10.3 |
| Compound | LOD 1 (mg/L) (n = 10) | LOD (mg/kg) (n = 10) | LOQ 2 (mg/L) (n = 10) | LOQ (mg/kg) (n = 10) |
|---|---|---|---|---|
| β-carotene | 0.030 | 0.280 | 0.090 | 0.830 |
| lutein | 0.005 | 0.050 | 0.013 | 0.140 |
| squalene | 3.70 | 35.1 | 11.1 | 105.3 |
| α-tocopherol | 0.65 | 5.30 | 1.70 | 15.8 |
| γ-tocopherol | 0.1 | 3.50 | 0.4 | 10.6 |
| δ-tocopherol | 0.200 | 1.20 | 0.600 | 3.70 |
| chlorophyll | 0.150 | 1.30 | 0.450 | 3.90 |
| Compound | Number of Samples 1 | Concentration Range (mg/kg) | Average Concentration (mg/kg) | SD 4 (mg/kg) | Median (mg/kg) |
|---|---|---|---|---|---|
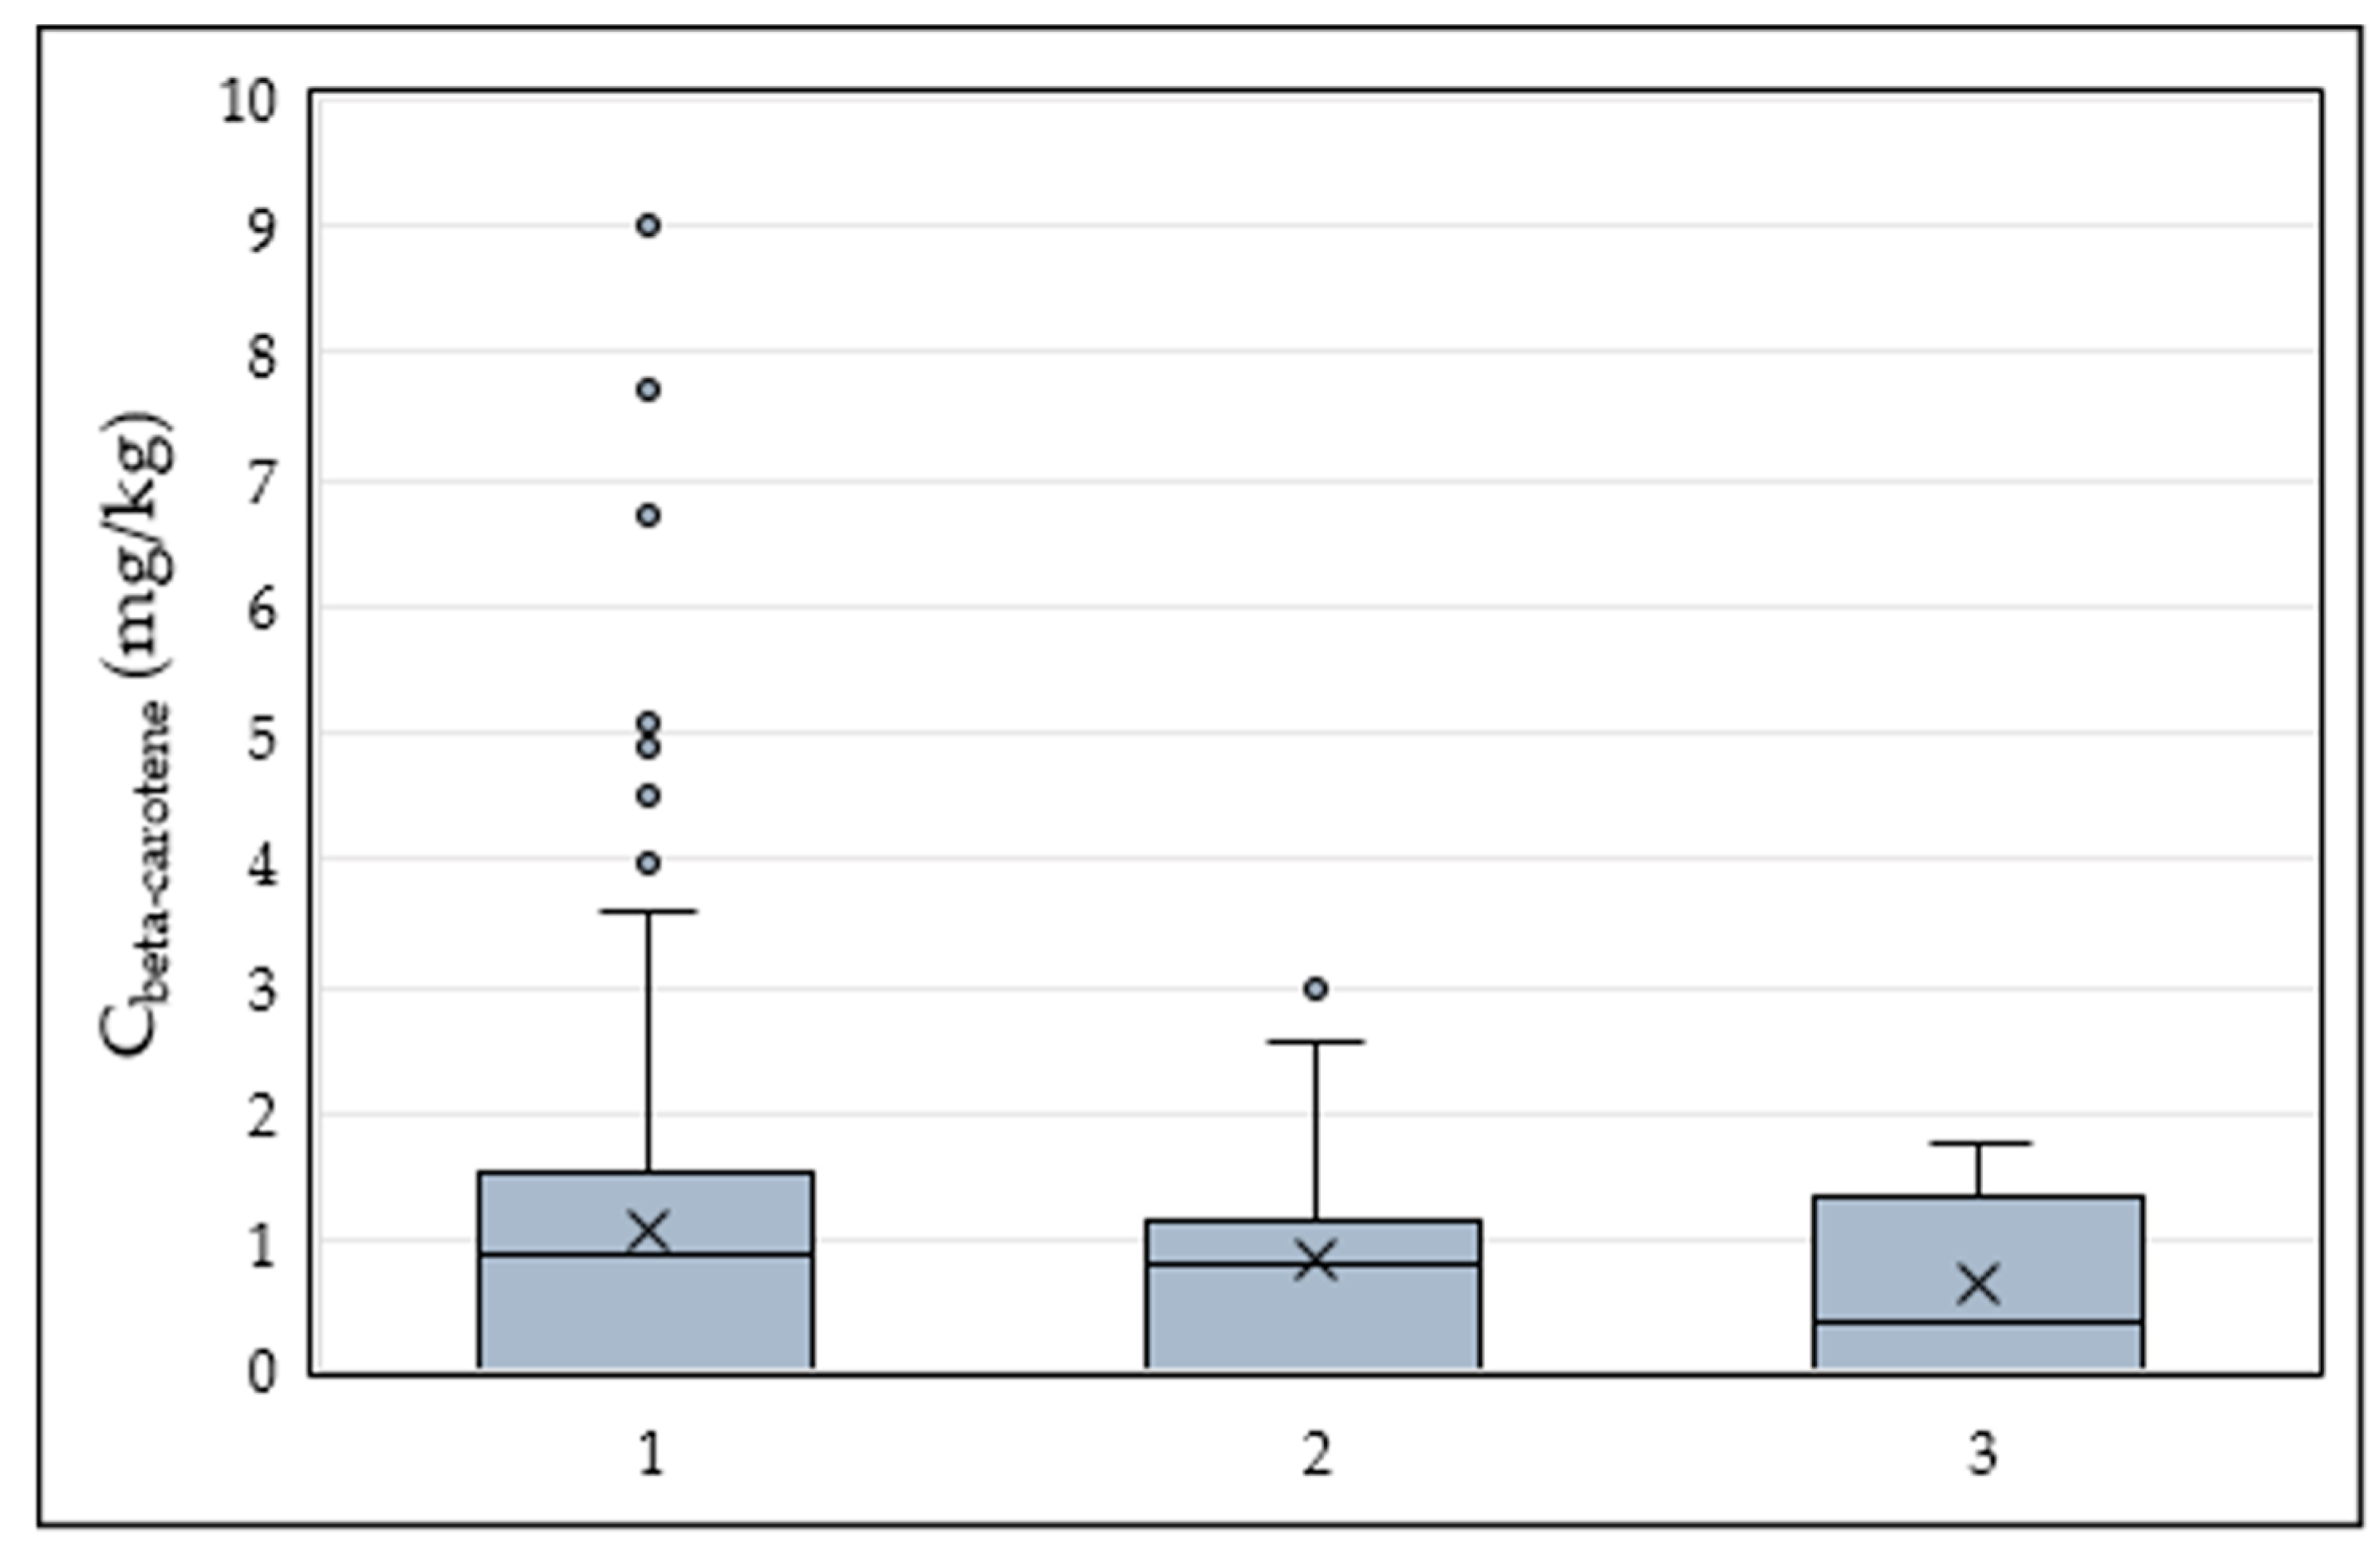
| β-carotene | 290 | 0.09–9.00 | 1.53 | 1.07 | 1.18 |
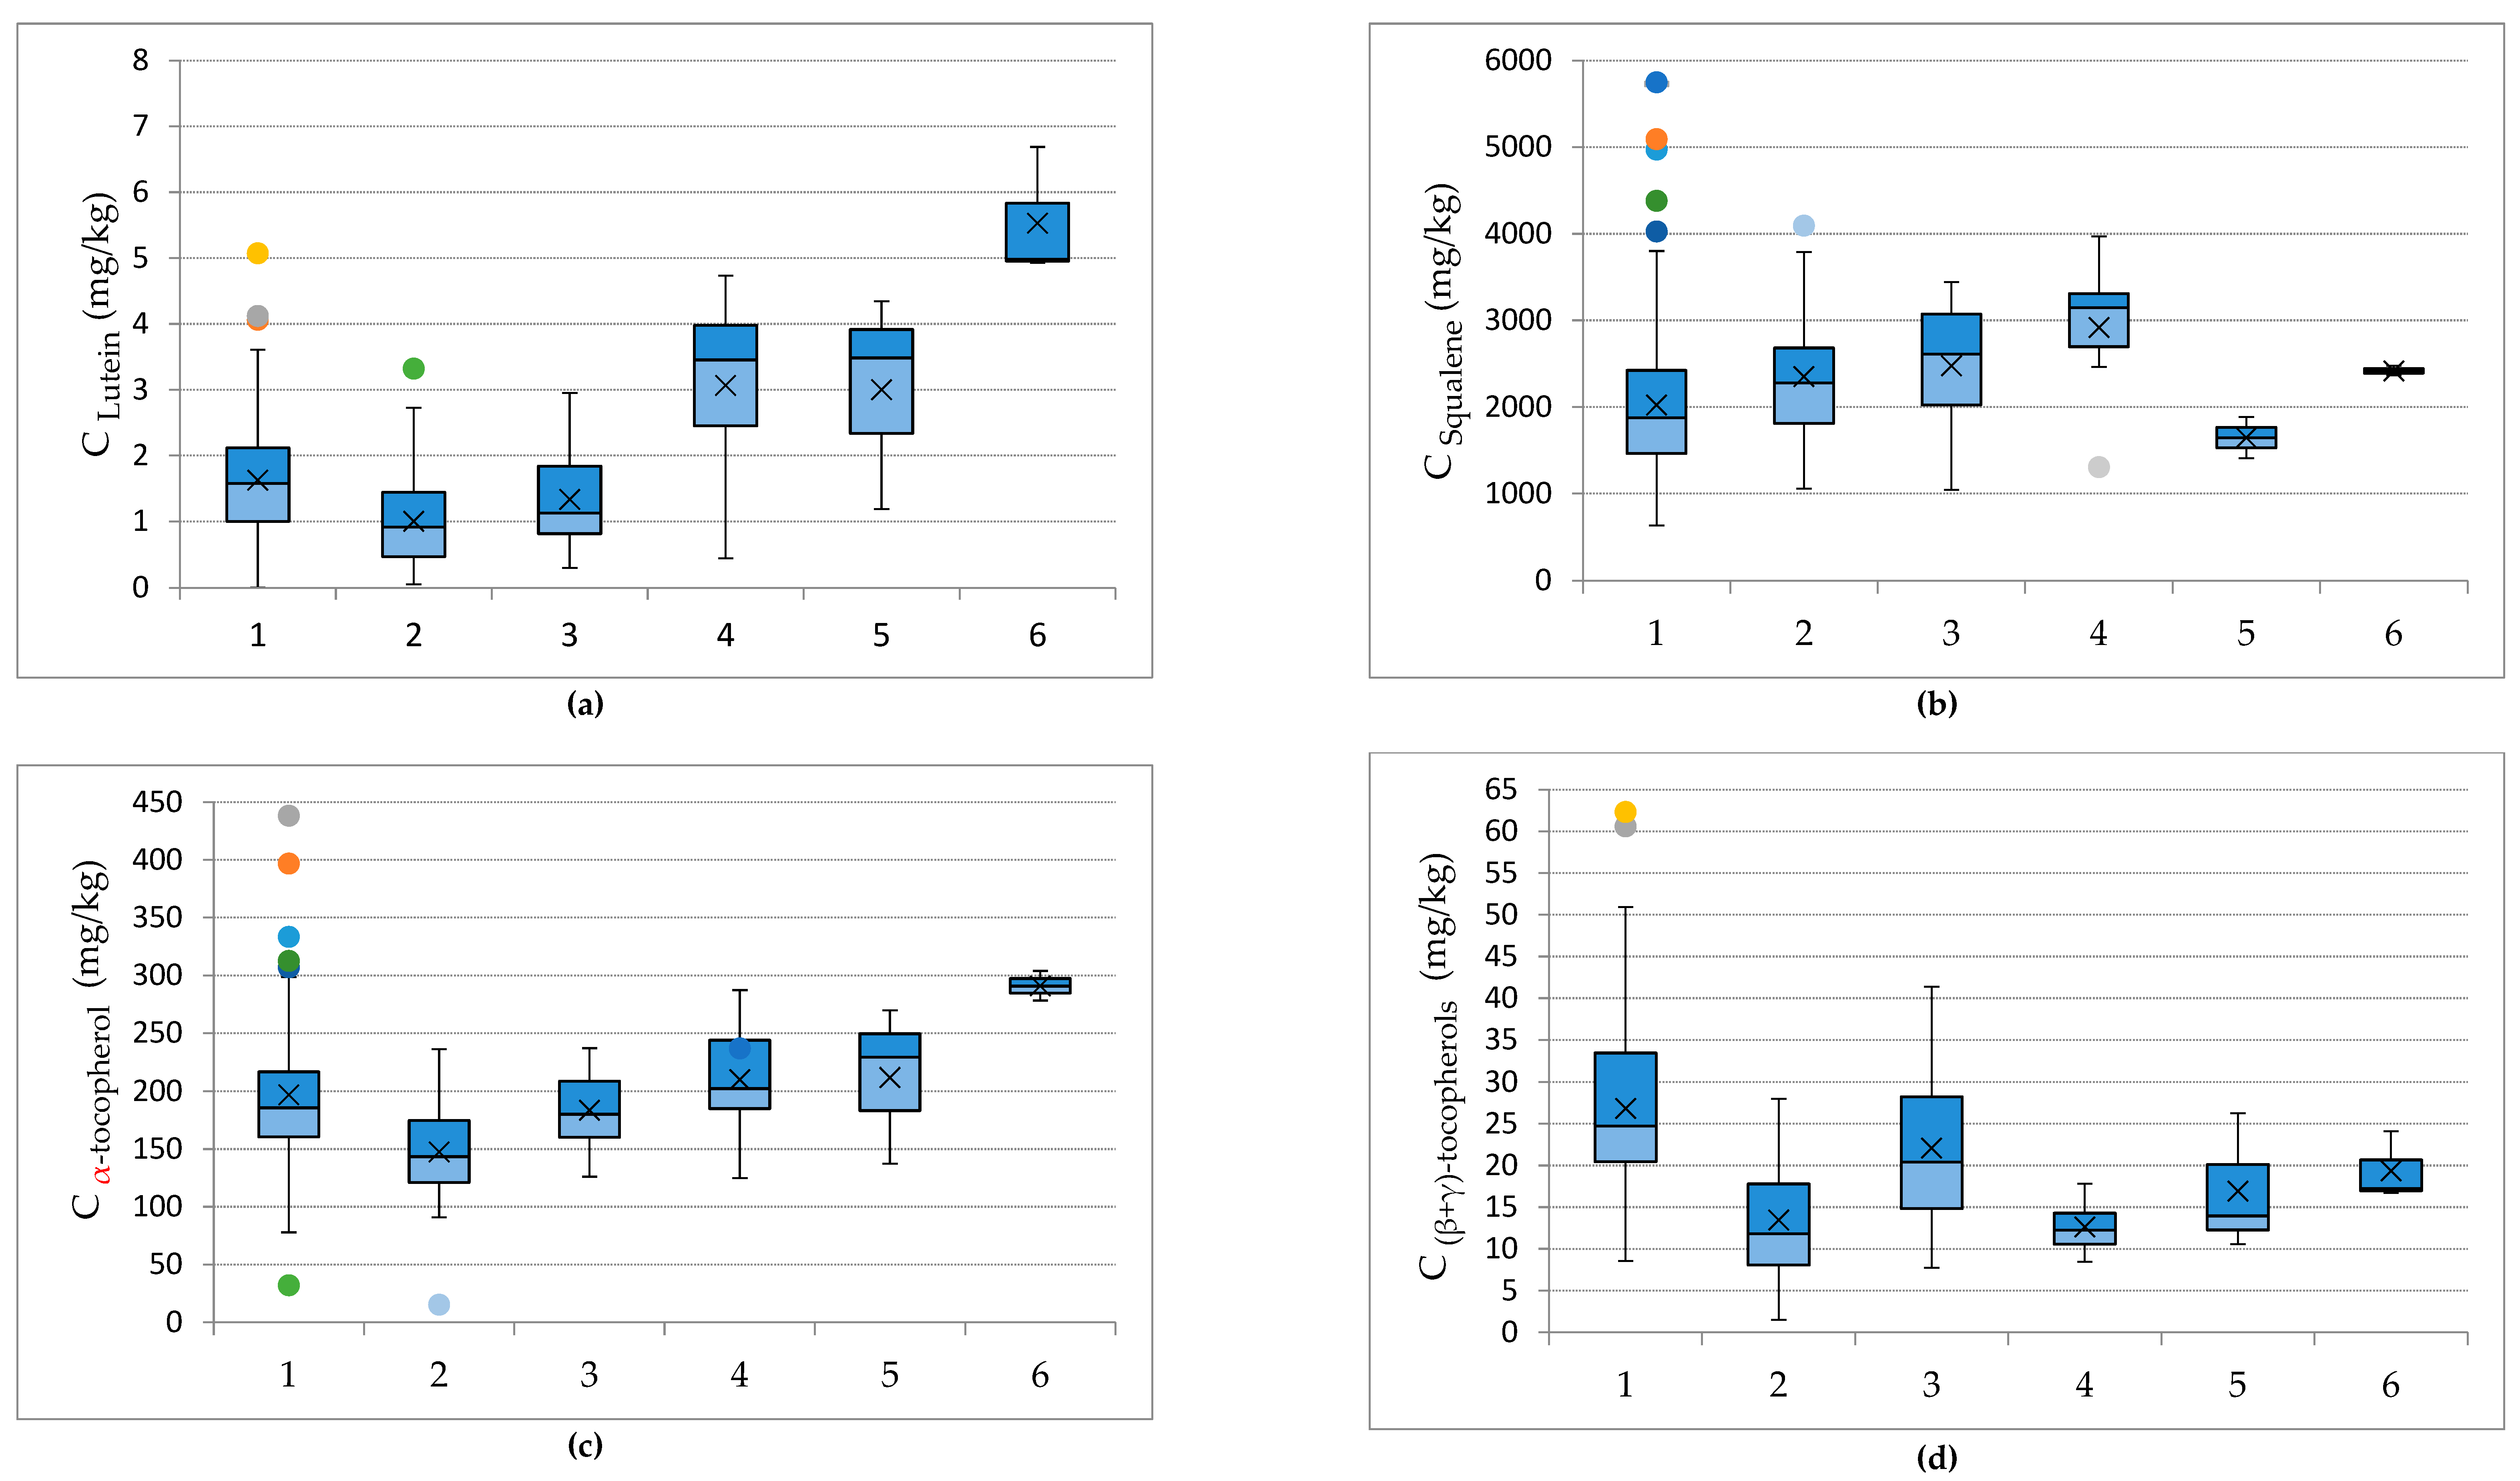
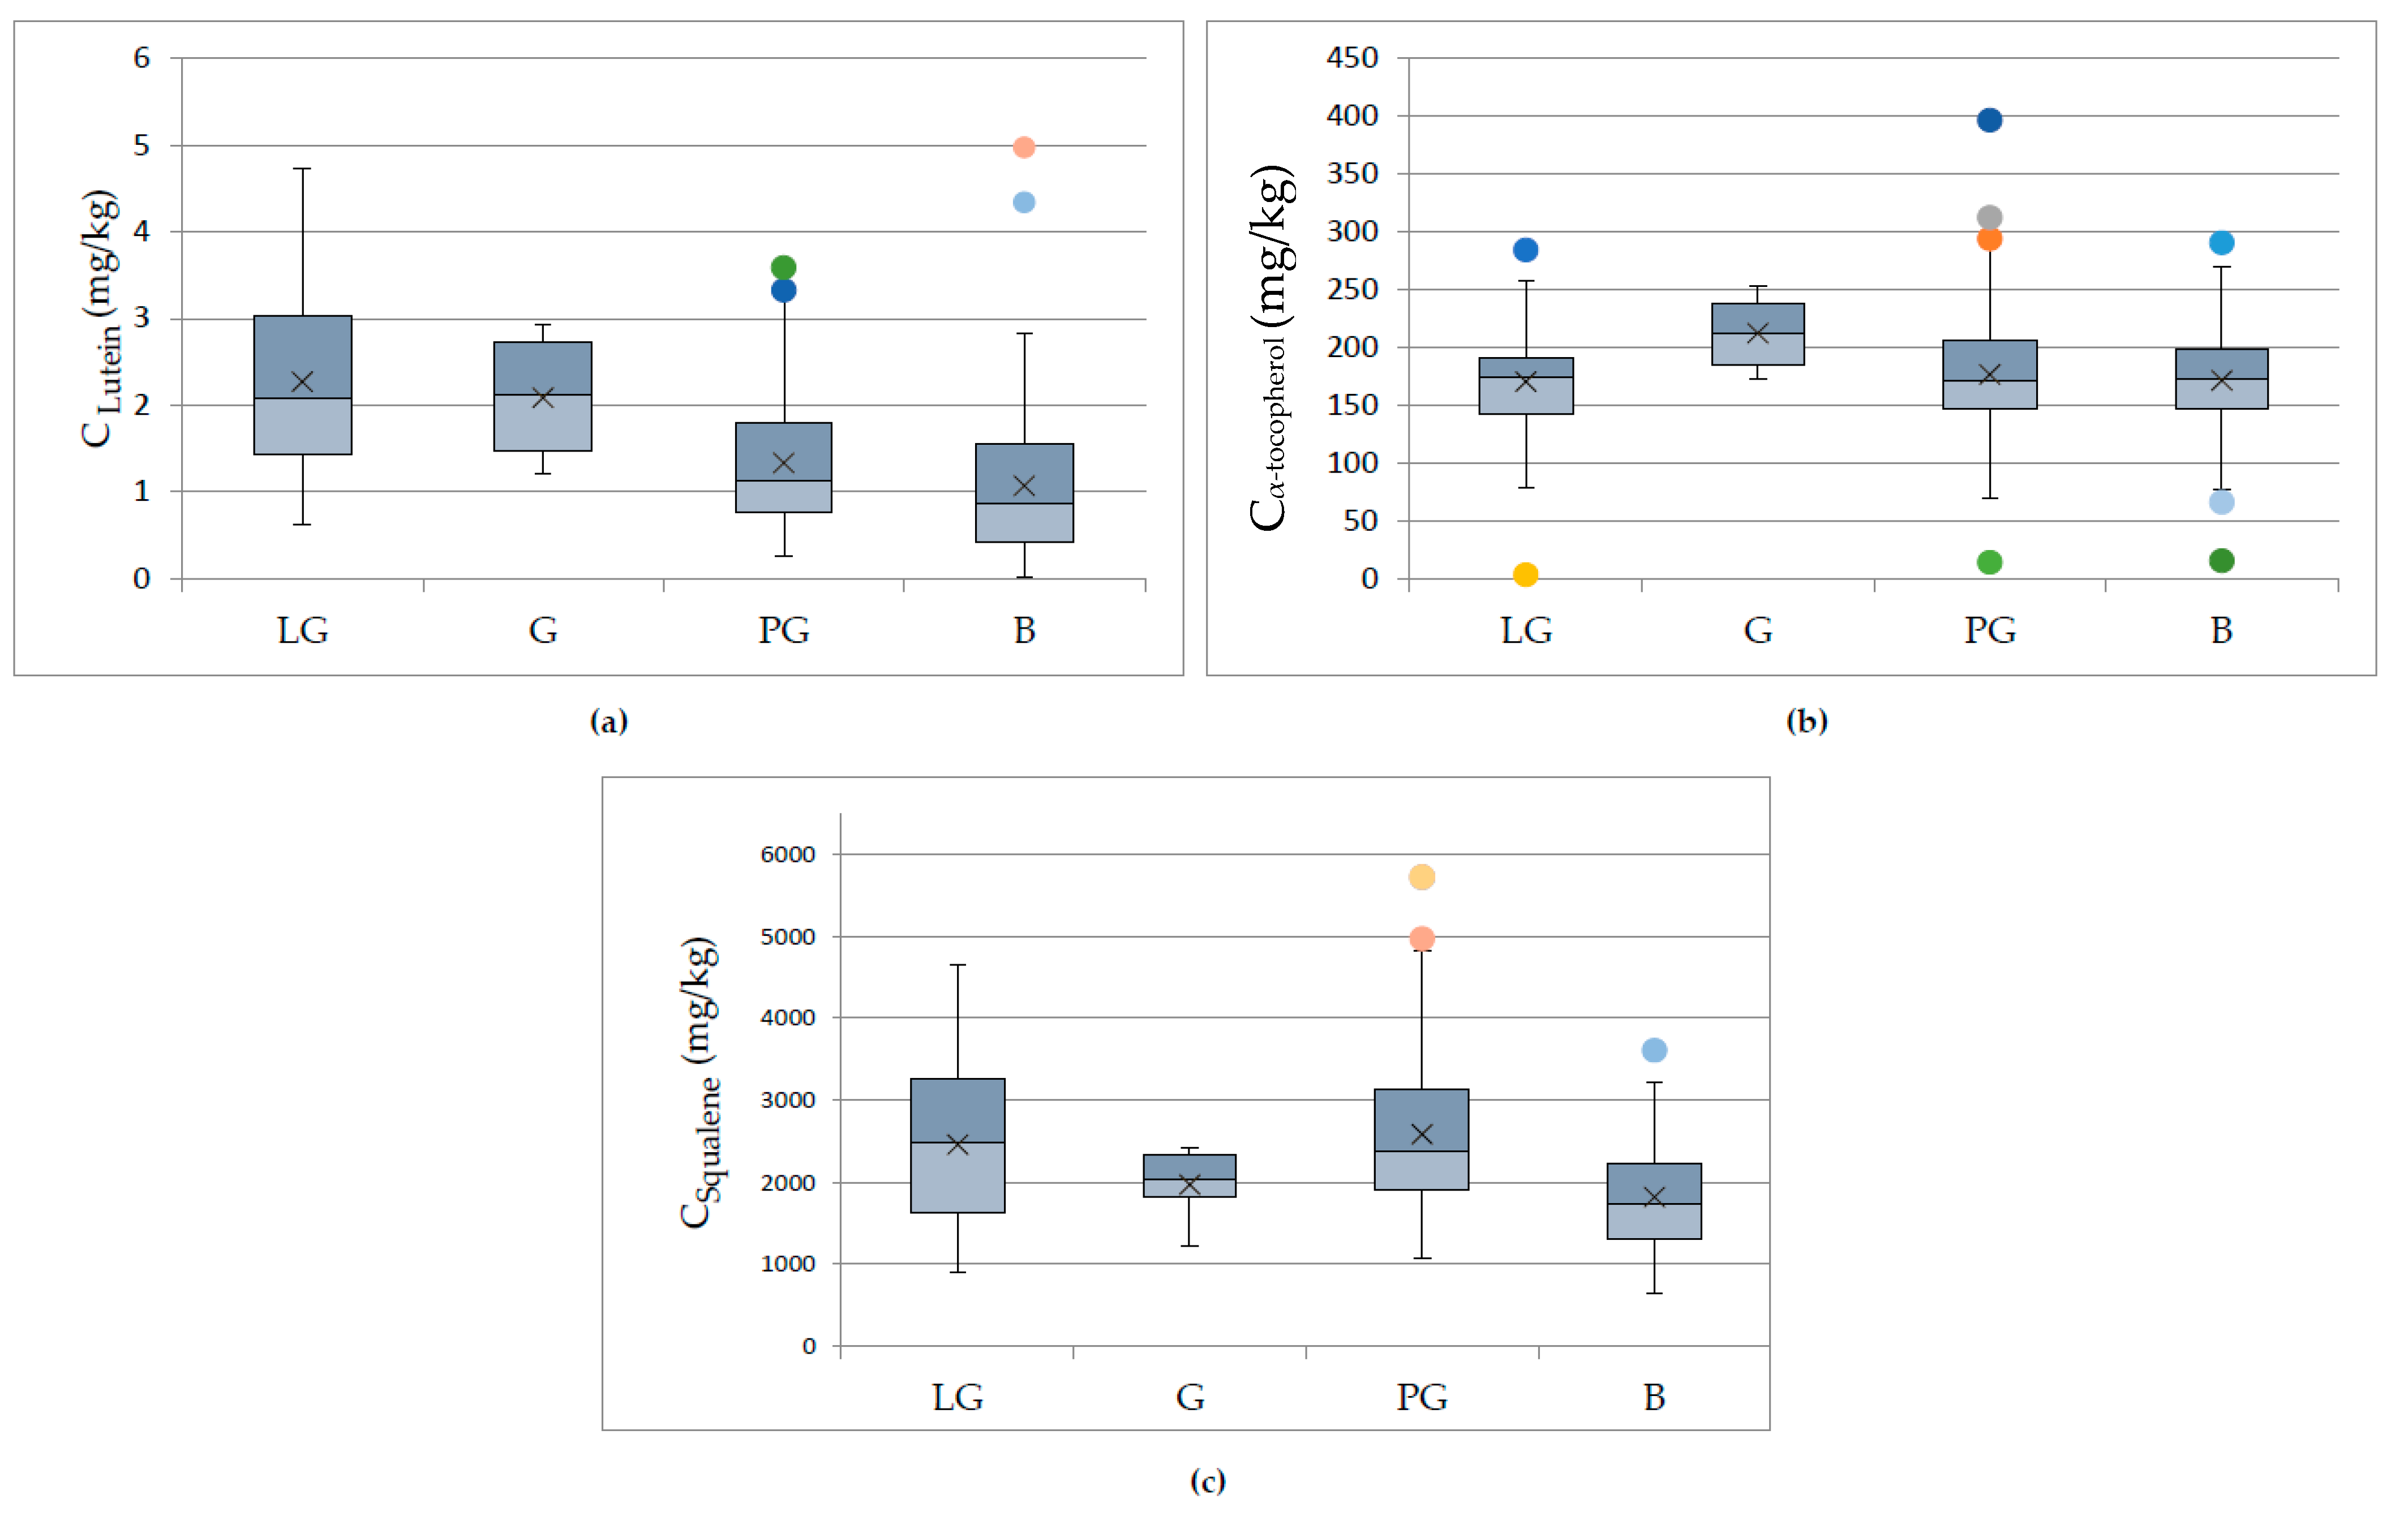
| Lutein | 452 | LOQ 3 < −7.43 | 1.59 | 0.95 | 1.50 |
| Squalene | 452 | 635–6344 | 2195 | 831 | 2109 |
| α-tocopherol | 452 | LOQ < −438 | 180 | 48 | 179 |
| (β + γ)-tocopherol 2 | 410 | LOQ < −62 | 22 | 11 | 21 |
© 2019 by the authors. Licensee MDPI, Basel, Switzerland. This article is an open access article distributed under the terms and conditions of the Creative Commons Attribution (CC BY) license (http://creativecommons.org/licenses/by/4.0/).
Share and Cite
Martakos, I.; Kostakis, M.; Dasenaki, M.; Pentogennis, M.; Thomaidis, N. Simultaneous Determination of Pigments, Tocopherols, and Squalene in Greek Olive Oils: A Study of the Influence of Cultivation and Oil-Production Parameters. Foods 2020, 9, 31. https://doi.org/10.3390/foods9010031
Martakos I, Kostakis M, Dasenaki M, Pentogennis M, Thomaidis N. Simultaneous Determination of Pigments, Tocopherols, and Squalene in Greek Olive Oils: A Study of the Influence of Cultivation and Oil-Production Parameters. Foods. 2020; 9(1):31. https://doi.org/10.3390/foods9010031
Chicago/Turabian StyleMartakos, Ioannis, Marios Kostakis, Marilena Dasenaki, Michalis Pentogennis, and Nikolaos Thomaidis. 2020. "Simultaneous Determination of Pigments, Tocopherols, and Squalene in Greek Olive Oils: A Study of the Influence of Cultivation and Oil-Production Parameters" Foods 9, no. 1: 31. https://doi.org/10.3390/foods9010031
APA StyleMartakos, I., Kostakis, M., Dasenaki, M., Pentogennis, M., & Thomaidis, N. (2020). Simultaneous Determination of Pigments, Tocopherols, and Squalene in Greek Olive Oils: A Study of the Influence of Cultivation and Oil-Production Parameters. Foods, 9(1), 31. https://doi.org/10.3390/foods9010031