1. Introduction
Taste is an important part of our perception of foods and beverages. Taste perception in humans is considered to consist of the five canonical basic taste qualities: sweet, sour, salt, bitter, and umami [
1].
These basic taste qualities interact in almost every consumed food or beverage [
2]. Taste interactions occur when at least two tastants are presented simultaneously and affect the perception of each other. Taste interactions can either be enhancing or suppressing, depending on both the taste quality, specific tastants in play, and tastant concentrations [
3,
4]. Taste interactions are complex, and, even though the interactions between tastes have been extensively researched and reviewed [
3,
4,
5], the mechanisms are still not well understood [
6].
This also applies for sweet-sour taste interactions, where both suppression and enhancement have been proposed for both tastes. The general consensus is that sweetness and sourness suppress each other [
3,
4,
7]; however, sweetness enhancement by acids have also been reported [
8,
9,
10]. Only a few studies have investigated other sour stimuli than citric acid in taste interactions with sweetness [
11,
12]. Moreover, also, very few studies have looked at tartaric acid, but with inconclusive results. Early reports found a sweetness enhancing effect of tartaric acid [
8], a claim not supported by later research that has found tartaric acid consistently suppressing sweetness [
11,
12]. To our knowledge, Fabian and Blum’s [
8] is the only study comparing the taste of citric acid and tartaric acid in relation to sweet-sour taste interactions. These authors found a suppression effect of the sourness of both tartaric- and citric acid by sub-threshold levels sucrose. In the same study, they found an unexpected enhancing effect from sub-threshold levels of both tartaric- and citric acid on the sweetness of sucrose.
This inconsistency in findings both related to suppression or enhancement between sourness and sweetness, and to different tastants, could be ascribed to differences in test protocols [
3]. Fabian and Blum [
8] used the tastant concentrations below taste threshold for the interacting tastant, whereas most others [
9,
10,
11,
12,
13,
14,
15,
16] use supra-threshold concentrations for both affected and interacting tastant. As Puputti et al. [
17] argued, supra-threshold concentrations of both tastants are the most relevant levels in which to investigate taste perception.
A further reason for inconsistencies might be individual differences in perception of taste interactions. Individual differences have not been well studied for taste interactions. McBride and Finlay [
18] investigated the effect of sensory training on sweet-sour taste interactions, in a study comparing novices with experienced trained sensory panelists. They found generally high correlations between the two groups for both sweetness suppression by citric acid and sourness suppression by sucrose. Only for the highest concentration of both citric acid and sucrose did they find a difference in sweetness response between the two groups with novices showing higher suppression. The same was not the case for sourness. This indicates low degrees of individual differences in sweet-sour taste interactions. On the other hand, individual differences have been shown to affect taste interactions in other taste combinations. Prescott et al. [
7] showed that differences in bitterness sensitivity to 6-
n-propylthiouracil (PROP) correlated with bitter compounds’ effectiveness in suppressing sweetness, indicating that individual differences might affect taste interactions. In contrast to taste interactions, individual differences in basic taste perception is better understood. Puputti et al. [
17] found substantial differences in the perception of basic tastes between individuals. Further, they found evidence suggesting a correlation between supra-threshold taste response to different tastes in one individual, but they suggested, as others before [
19], that there is a degree of independent variation in supra-threshold taste response to different tastes in individuals. Studies have found a range of factors that explain some part of supra-threshold taste response, such as genetic differences, age, gender, and weight [
20,
21,
22]. This could potentially also affect taste interactions.
Another group of individual differences that could also influence taste interactions are cultural differences. As for individual differences in general, there are only few studies investigating the effect of culture on taste interactions. Two studies, Prescott et al. [
14] and Prescott et al. [
15], indicated that even though taste intensities are perceived similarly between Australian and Japanese panelists, some taste interactions might vary with nationality. Again, there is more evidence related to basic tastes than with taste interactions. For example, differences in supra-threshold taste response has been shown in different ethnic groups [
23,
24]. Williams et al. [
23] found both African-American and Hispanic individuals to have a higher supra-threshold taste response than White individuals for all four tastes included in their study. Risso et al. [
24] investigated four different vaguely defined ethnic groups, namely Italians, Northern Europeans, Mahgrebis, and Lankans. They investigated the relationship between ethnicity and supra-threshold taste response to mono-sodium glutamate and different bitter compounds. Even though they did find evidence for differences between the ethnic groups in taste sensitivity, no clear pattern in taste sensitivity was seen. Bertino et al. [
25] investigated supra-threshold taste response in American and Taiwanese students and found that sweetness of sucrose were influenced by ethnicity both in complex matrices and a simple model matrix, with Taiwanese students ratings sweetness higher than American students.
Conducting cross-cultural comparisons of differences of sweet-sour taste interactions are important as it enables an investigation of whether these established taste interactions, and their magnitudes, are culturally unique or culturally universal [
26]. Therefore, the present study had two aims. The first aim was to investigate the effect of different acids, namely citric and tartaric acid, on sweetness- and sourness taste intensity interactions. The second aim was to investigate the perception of taste interactions between sweetness and sourness in a cross-cultural setting. By using sucrose as sweet stimulus and citric and tartaric acid as sour stimuli, all in aqueous solutions, the suppression effect of sweetness on sourness, and the suppression effect of sourness on sweetness were thus investigated using Chinese and Danish consumers. These cultures were chosen as they represent two quite different cultures with very different eating habits [
27,
28], thus making it more likely that if there indeed are cross cultural differences in taste interactions, they will be present in this context.
When conducting cross-cultural research, a definition of which culture, and which cultures are investigated, is important. Often, cross cultural studies in sensory and consumer science define culture from a geographical point [
29,
30,
31]. As the cross-cultural difference in food perception is thought to be related to eating habits [
27,
28], being at a certain place at the time of study might not be sufficient to adhere to that food culture. Thus, to further narrow down the cultural differences, nationality is also included in the cultural definition used in this study. Thus, respondents that were both located in Denmark at the time of the study and described their culture as Danish were in this study defined as having a Danish culture. Similarly, respondents that were both in China at the time of study and described themselves as Chinese were considered to have a Chinese culture.
2. Materials and Methods
Taste interaction effects between sucrose, citric acid and tartaric acid were investigated using a 2x3 full factorial design resulting in six samples in total. Relatively low but readily perceivable concentrations of sucrose and acids were chosen in order to make them acceptable for consumers. The concentrations of sucrose and citric acid were chosen based on an internal pilot-study indicating that these concentrations were similar in magnitude of intensity of sweetness and sourness, respectively. The procedure of the internal pilot-study where five internal employees tasted different solutions of citric acid and a sucrose solution with the chosen level of sucrose. After tasting, they indicated which citric acid solution, if any, had similar magnitude as the sucrose solution. To determine equal levels of sourness between citric acid and tartaric acid samples, an iso-sourness study was conducted using a trained sensory panel with eight assessors (7 female, age 42–60), following a protocol adapted after the Sucrose-Sweetener Combined protocol for sweetness by Reference [
32], using citric acid as the stereotypical sourness agent. Five different concentrations of both citric acid (0.10, 0.12, 0.14, 0.16, 0.18%
w/
v) and tartaric acid (0.80, 0.11, 0.14, 0.17, 0.20%
w/
v) were presented. Panelists were provided with three sourness references (being the lowest, medium, and highest concentrations of the citric acid samples) as anchors on the 15 cm line scales used for sourness intensity rating. The anchors were placed at 1.5, 7.5, and 13.5 [
7].
A study was conducted afterwards to validate that the sourness of the chosen concentrations of citric and tartaric acid was indeed equal. A trained panel of 10 assessors (9 female, 42–60) evaluated the samples for sourness intensity. No significant differences in sourness intensity were found. Both the iso-sourness study and the validation study were conducted at the sensory facilities at the Department of Food Science, Aarhus University, Aarslev, Denmark.
The six samples were then evaluated by Danish (21st May 2019) and Chinese (24th September 2019) consumers to investigate the effect of culture on the taste interactions.
2.1. Samples
Samples were aqueous solutions of either sucrose (Merck KGaA, Darmstadt, Germany), citric acid (Merck KGaA, Darmstadt, Germany) or tartaric acid (L-(+)-Tartaric acid) (Sigma-Aldrich, Co., St. Louis, MO, USA), or combinations of these, as shown in
Table 1. Water for the aqueous solutions was San Benedetto, still natural mineral water (San Benedetto S.p.A., Scorzè, Italy). The tastants were weighted out and transferred to 2000 mL volumetric flasks. Tastants were dissolved in approximately 1 L of water. When all tastant was dissolved, the volumetric flask was filled.
After production, 20-mL sample was dispensed into opaque sample tubes with red lids (Fisher Scientific, Roskilde, Denmark), coded with random three-digit numbers. Samples were stored at 5 °C until evaluation, which was at room temperature. The samples were served the day after production.
2.2. Consumer Studies
A consumer study was conducted at Aarhus University, Aarhus, Denmark, and at Tianjin Institute of Industrial Biotechnology, Tianjin, China. At both locations, participants were recruited through convenience sampling; thus, both students and staff were recruited to participate in the study and rewarded with a minor gratuity for participation. The consumer characteristics can be found in
Table 2. In both places, the consumers conducted the evaluation in a canteen-like area outside eating hours.
Since all ingredients were commercially available food grade products, and the study was conducted in an aqueous model system, the study was exempted from the need of formal ethical approval. However, the panelists did give their verbal consent prior to participation. After consumers agreed to participate in the study, they were asked to complete the questionnaire on their smartphone or on a provided iPad. Consumers received the six samples and were provided with a glass of San Benedetto water.
The participants were given a short verbal introduction to the questionnaire and instructed to check and ensure that the three-digit codes on the tubes matched the ones in the questionnaire, as well as to drink a sip of water between the samples. Consumers were asked to evaluate one sample at a time, and samples were served randomly in accordance with a Williams Latin Square design. All data was collected using the software Compusense (Compusense Inc., Guelph, ON, Canada), which also instructed consumers to cleanse their mouth and wait at least 30 s between the samples.
The questionnaire contained five sample-related questions and nine none-sample related questions. The sample related questions were ratings of sourness and sweetness intensity evaluated on 9-point scales with anchors “Not at all” and “Extremely” [
27]. Liking and Just About Right (JAR) for both sourness and sweetness were also evaluated. The questions were presented in the following order: sourness intensity, JAR of sourness, sweetness intensity, JAR of sweetness, and liking. The results from liking and JAR questions are not presented as the focus of this paper is on sweet-sour taste interactions.
Not sample-related questions were culture, gender, age, weight, height, and a 4-question battery of questions using a 7 point Likert scale about general sweet and sour food liking (“I like to eat sweet foods”, “I like to eat sour foods”, “I like to drink fruit juices”, “I like to drink soft drinks”) ranging from “Strongly disagree” corresponding to 1 and “Strongly agree” corresponding to 7. These were all asked after all samples had been evaluated.
Body Mass Index (BMI) was calculated based on consumer height and weight (kg)/(height (m)2).
2.3. Statistical Analysis
All data analyses were performed using R [
33] and RStudio [
34]. Data formatting and plotting was conducted using the Tidyverse package [
35]. In accordance with the aim only consumers with Danish or Chinese culture were included in the analysis. Further, the age ranged was narrowed to only include consumers in the age 18–30 years of age to ensure a more homogeneous consumer sample. Student’s
t-tests for comparison of baseline characteristics were conducted using the R package FactoMineR [
36].
2.3.1. Overall Sample Evaluation Analysis
To provide an overview of the ratings for sourness intensity and sweetness intensity, means were calculated using R package SensoMineR [
37] and Tukey’s Honest Significant Differences (HSD) were used to evaluate pairwise significant differences between samples, considering sample effects as fixed effects and consumer effects as random effects. HSD was determined using the R package lmerTest [
38]. Furthermore, Analysis of Variance (ANOVA) was conducted as a mixed model ANOVA using R package SensMixed [
39], with Mixed Assessor Model (MAM) to adjust for scaling. Similar to the HSD, in this model, sample effects are considered fixed effects, and consumer effects are considered random effects.
2.3.2. Effect of Acid Quality on Sourness and Sweetness Taste Perception
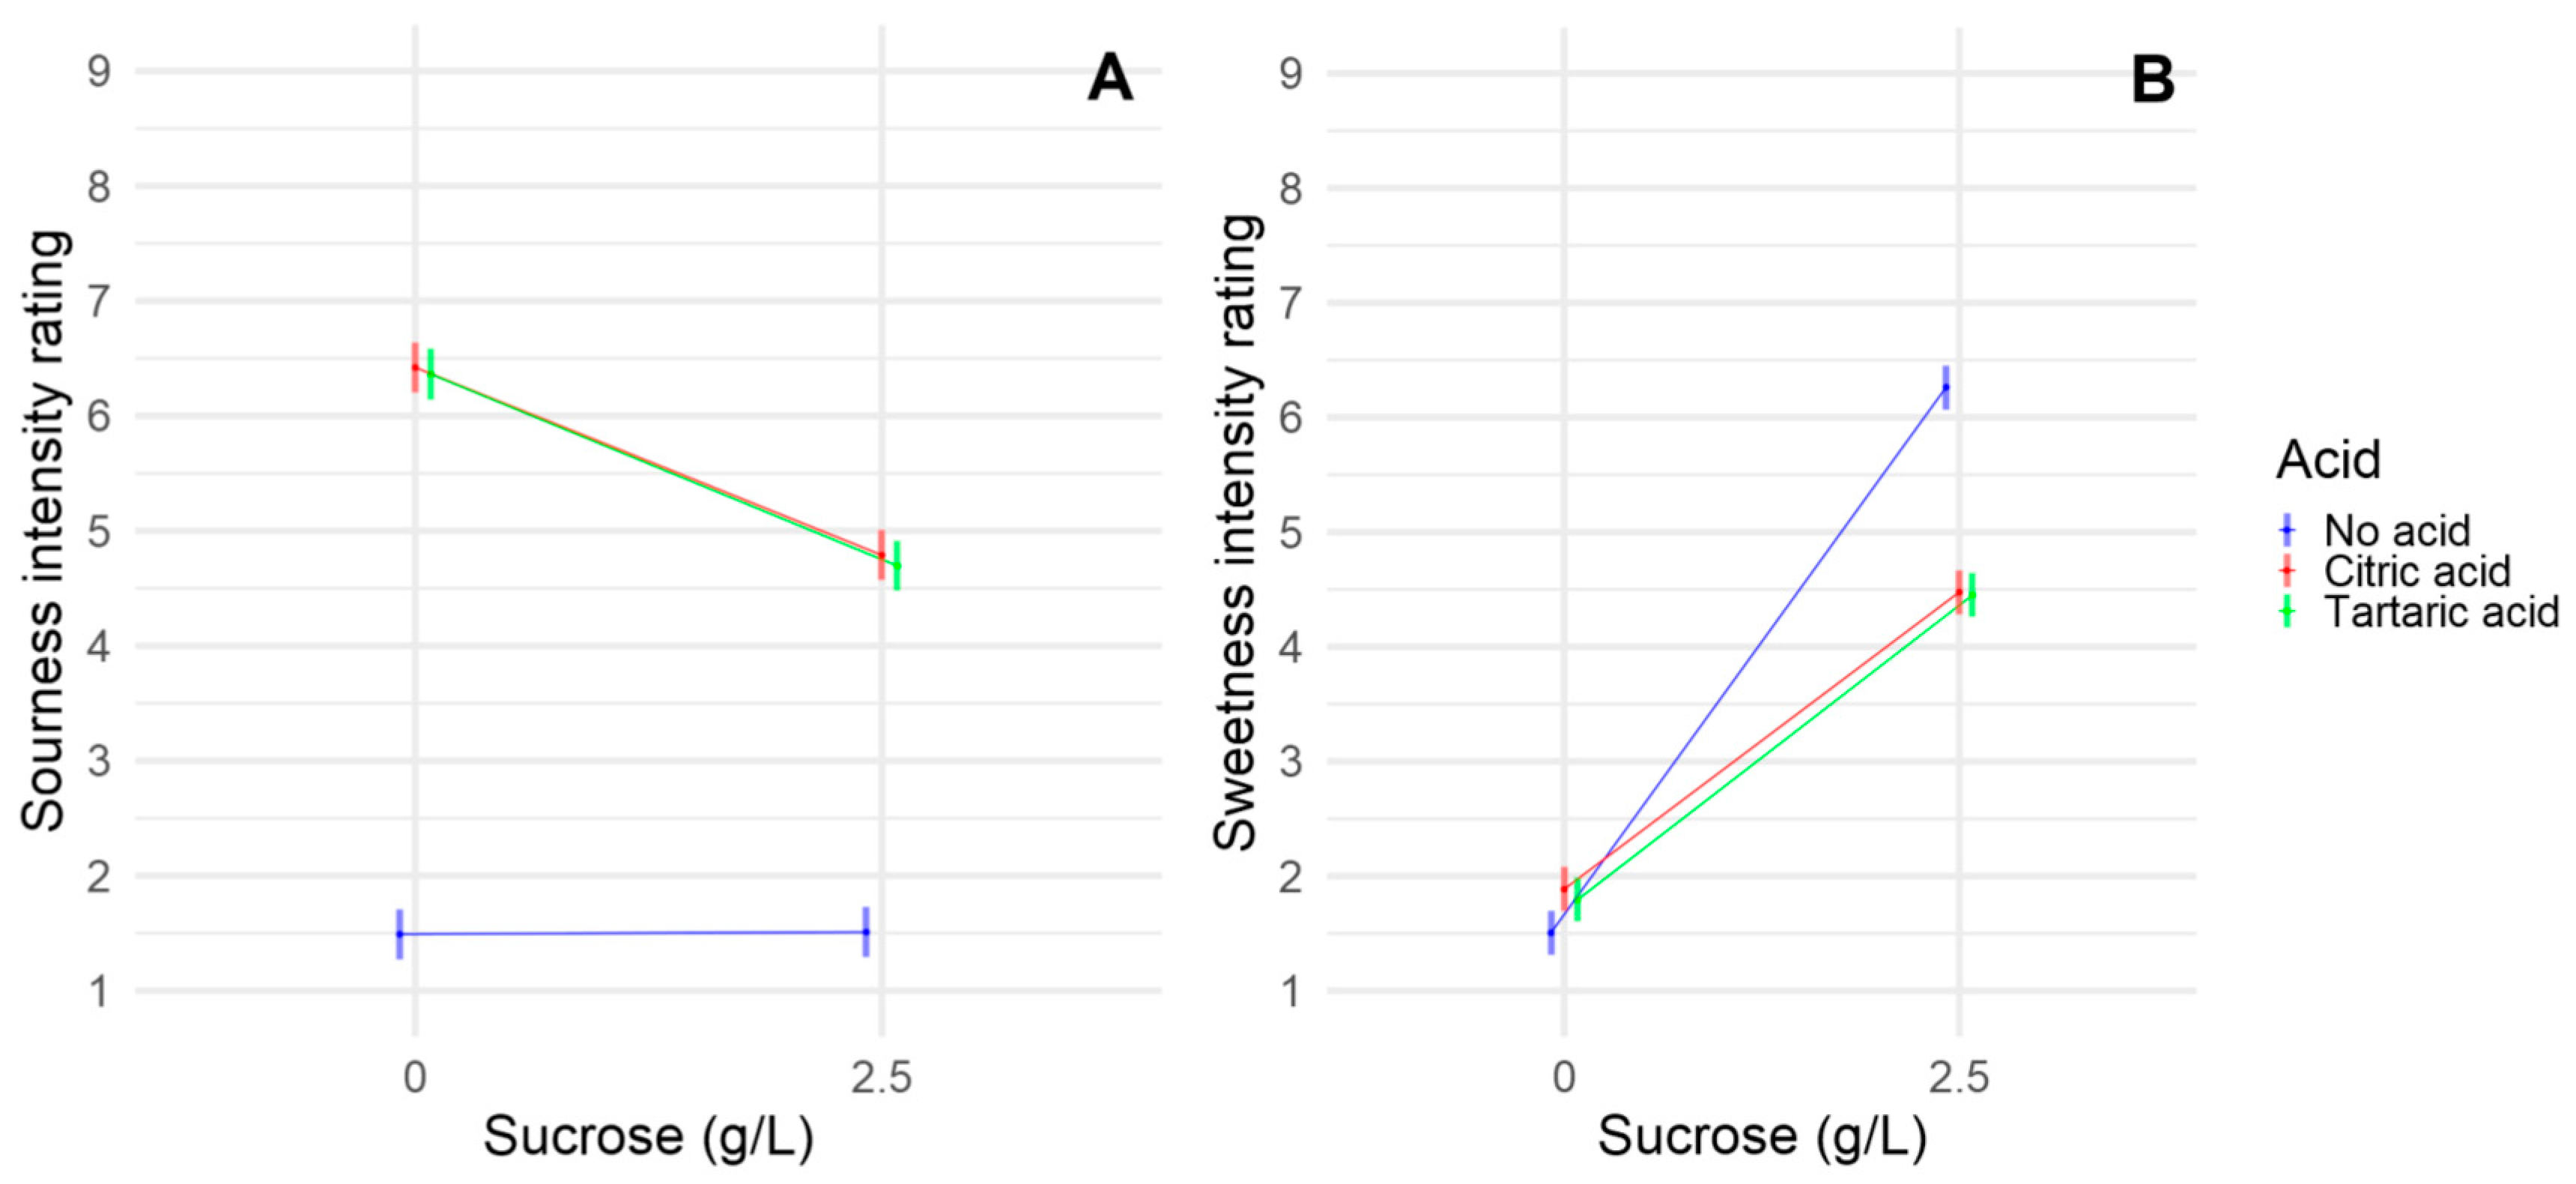
To investigate the effect of different acids on the sweet-sour taste interaction, interaction plots for the interaction between acid and sucrose for sweetness intensity ratings and sourness intensity ratings, respectively, were compiled. These plots were constructed using R packages lsmeans [
40] and ggplot2 [
41].
2.3.3. Overall Effect of Culture
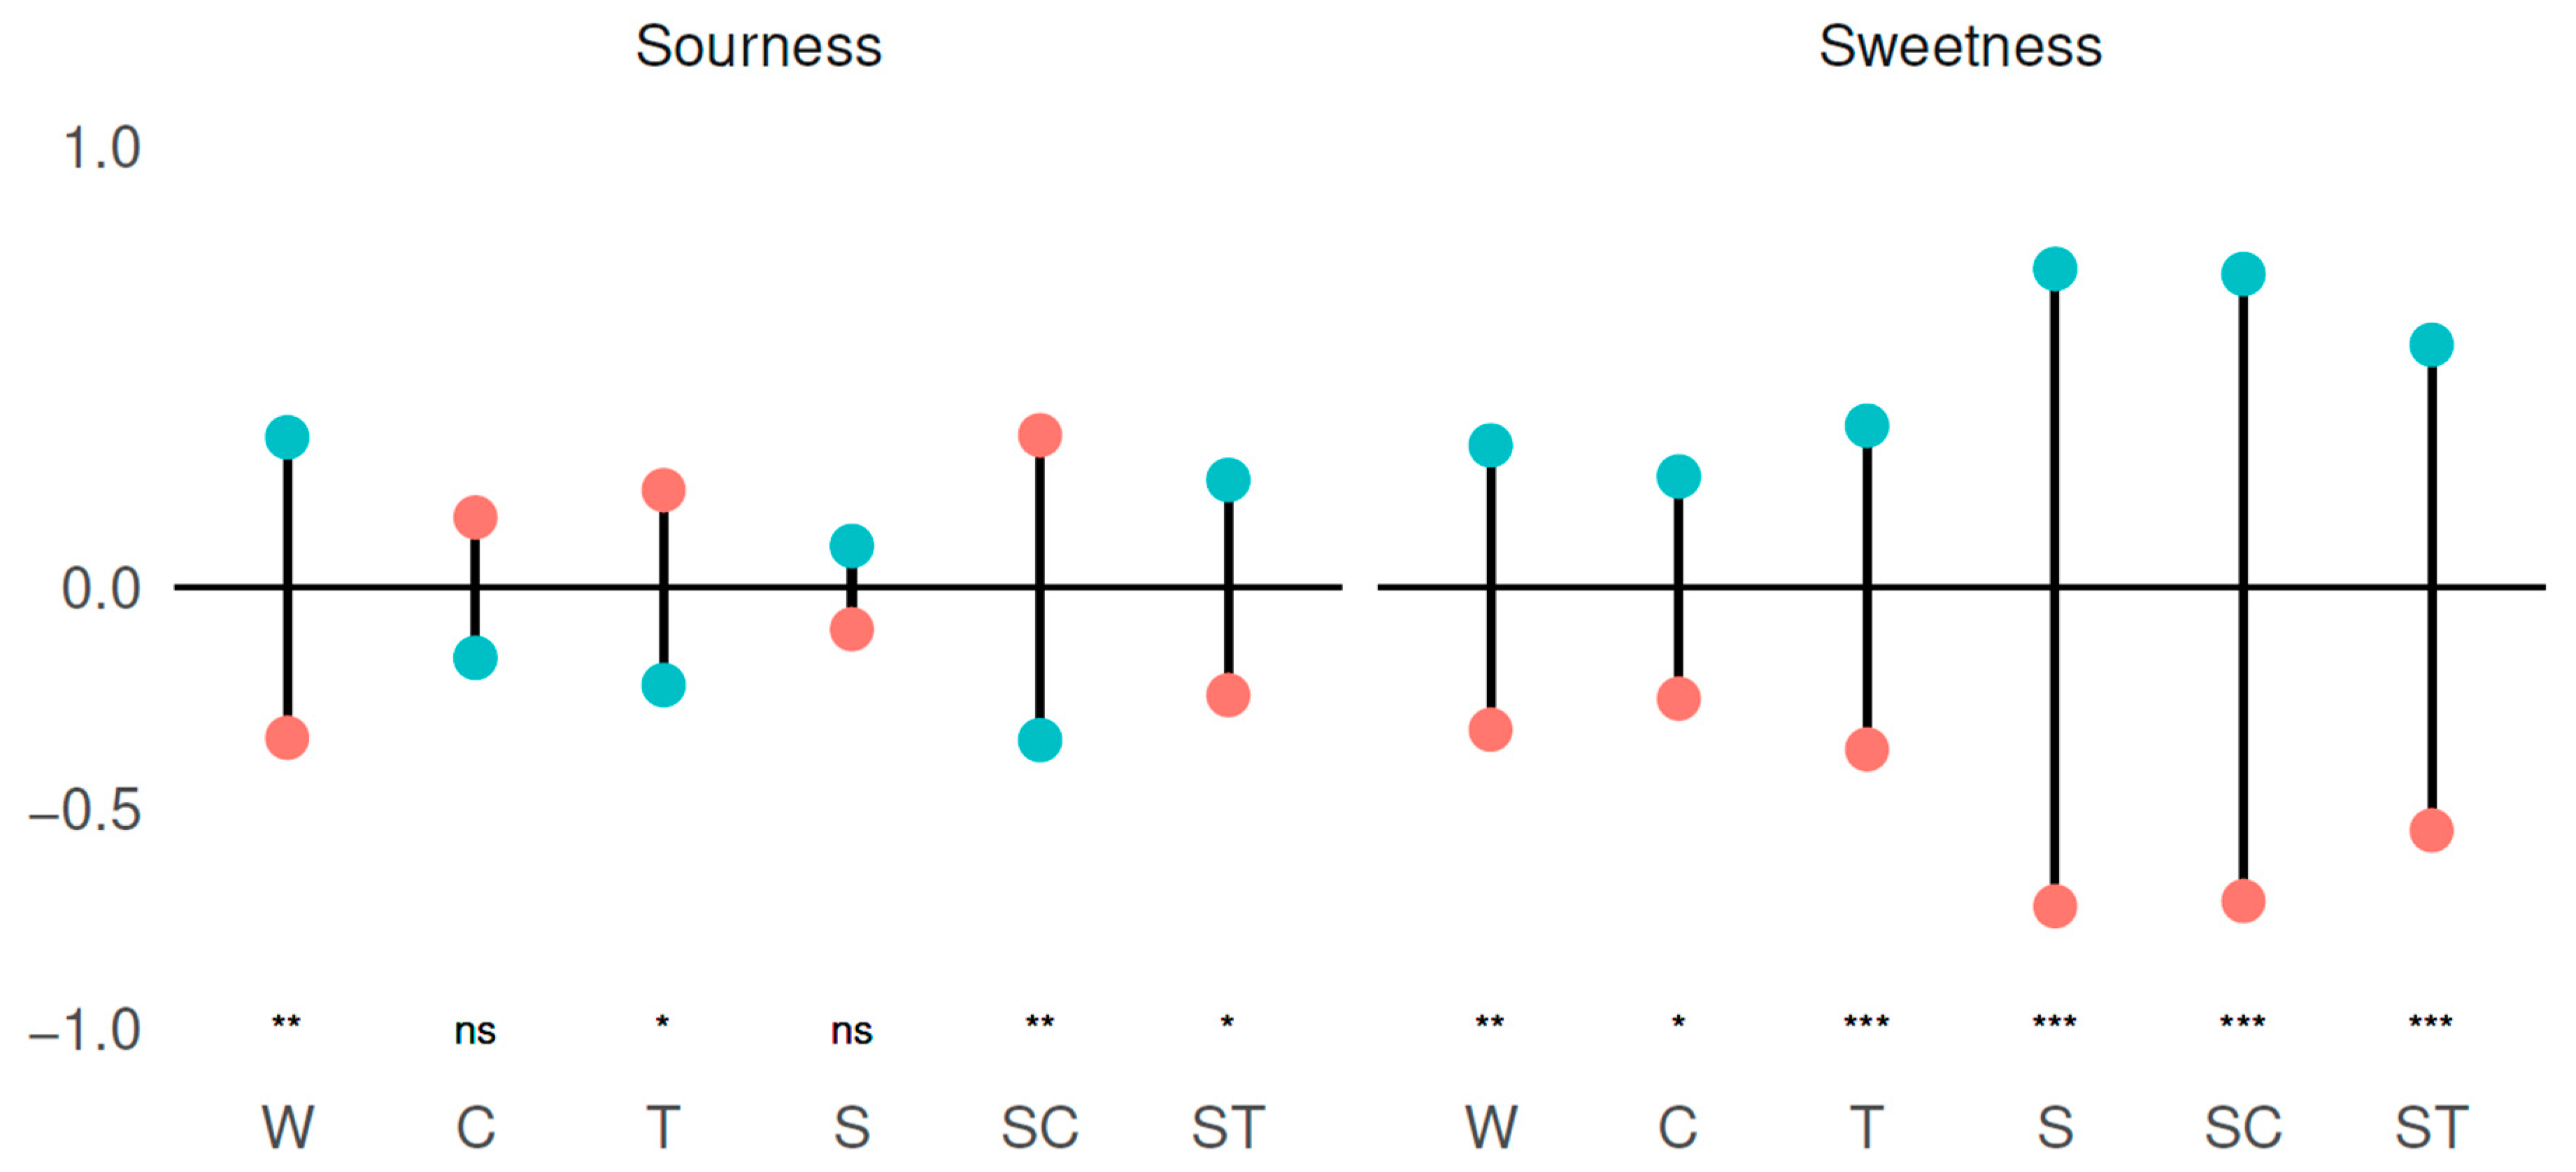
Differences in sourness intensity and sweetness intensity, between Danish and Chinese consumers are presented visually using the ggplot2 package in R [
42]. They are shown as differences in estimated marginal means between the two groups. Significant differences were calculated using pairwise comparison of estimated marginal means and
p-values shown are adjusted using Bonferroni corrections [
43]. These were calculated using R packages rstatix [
44] and emmeans [
45].
2.3.4. Effect of Culture on Sweetness- and Sourness Intensity Ratings
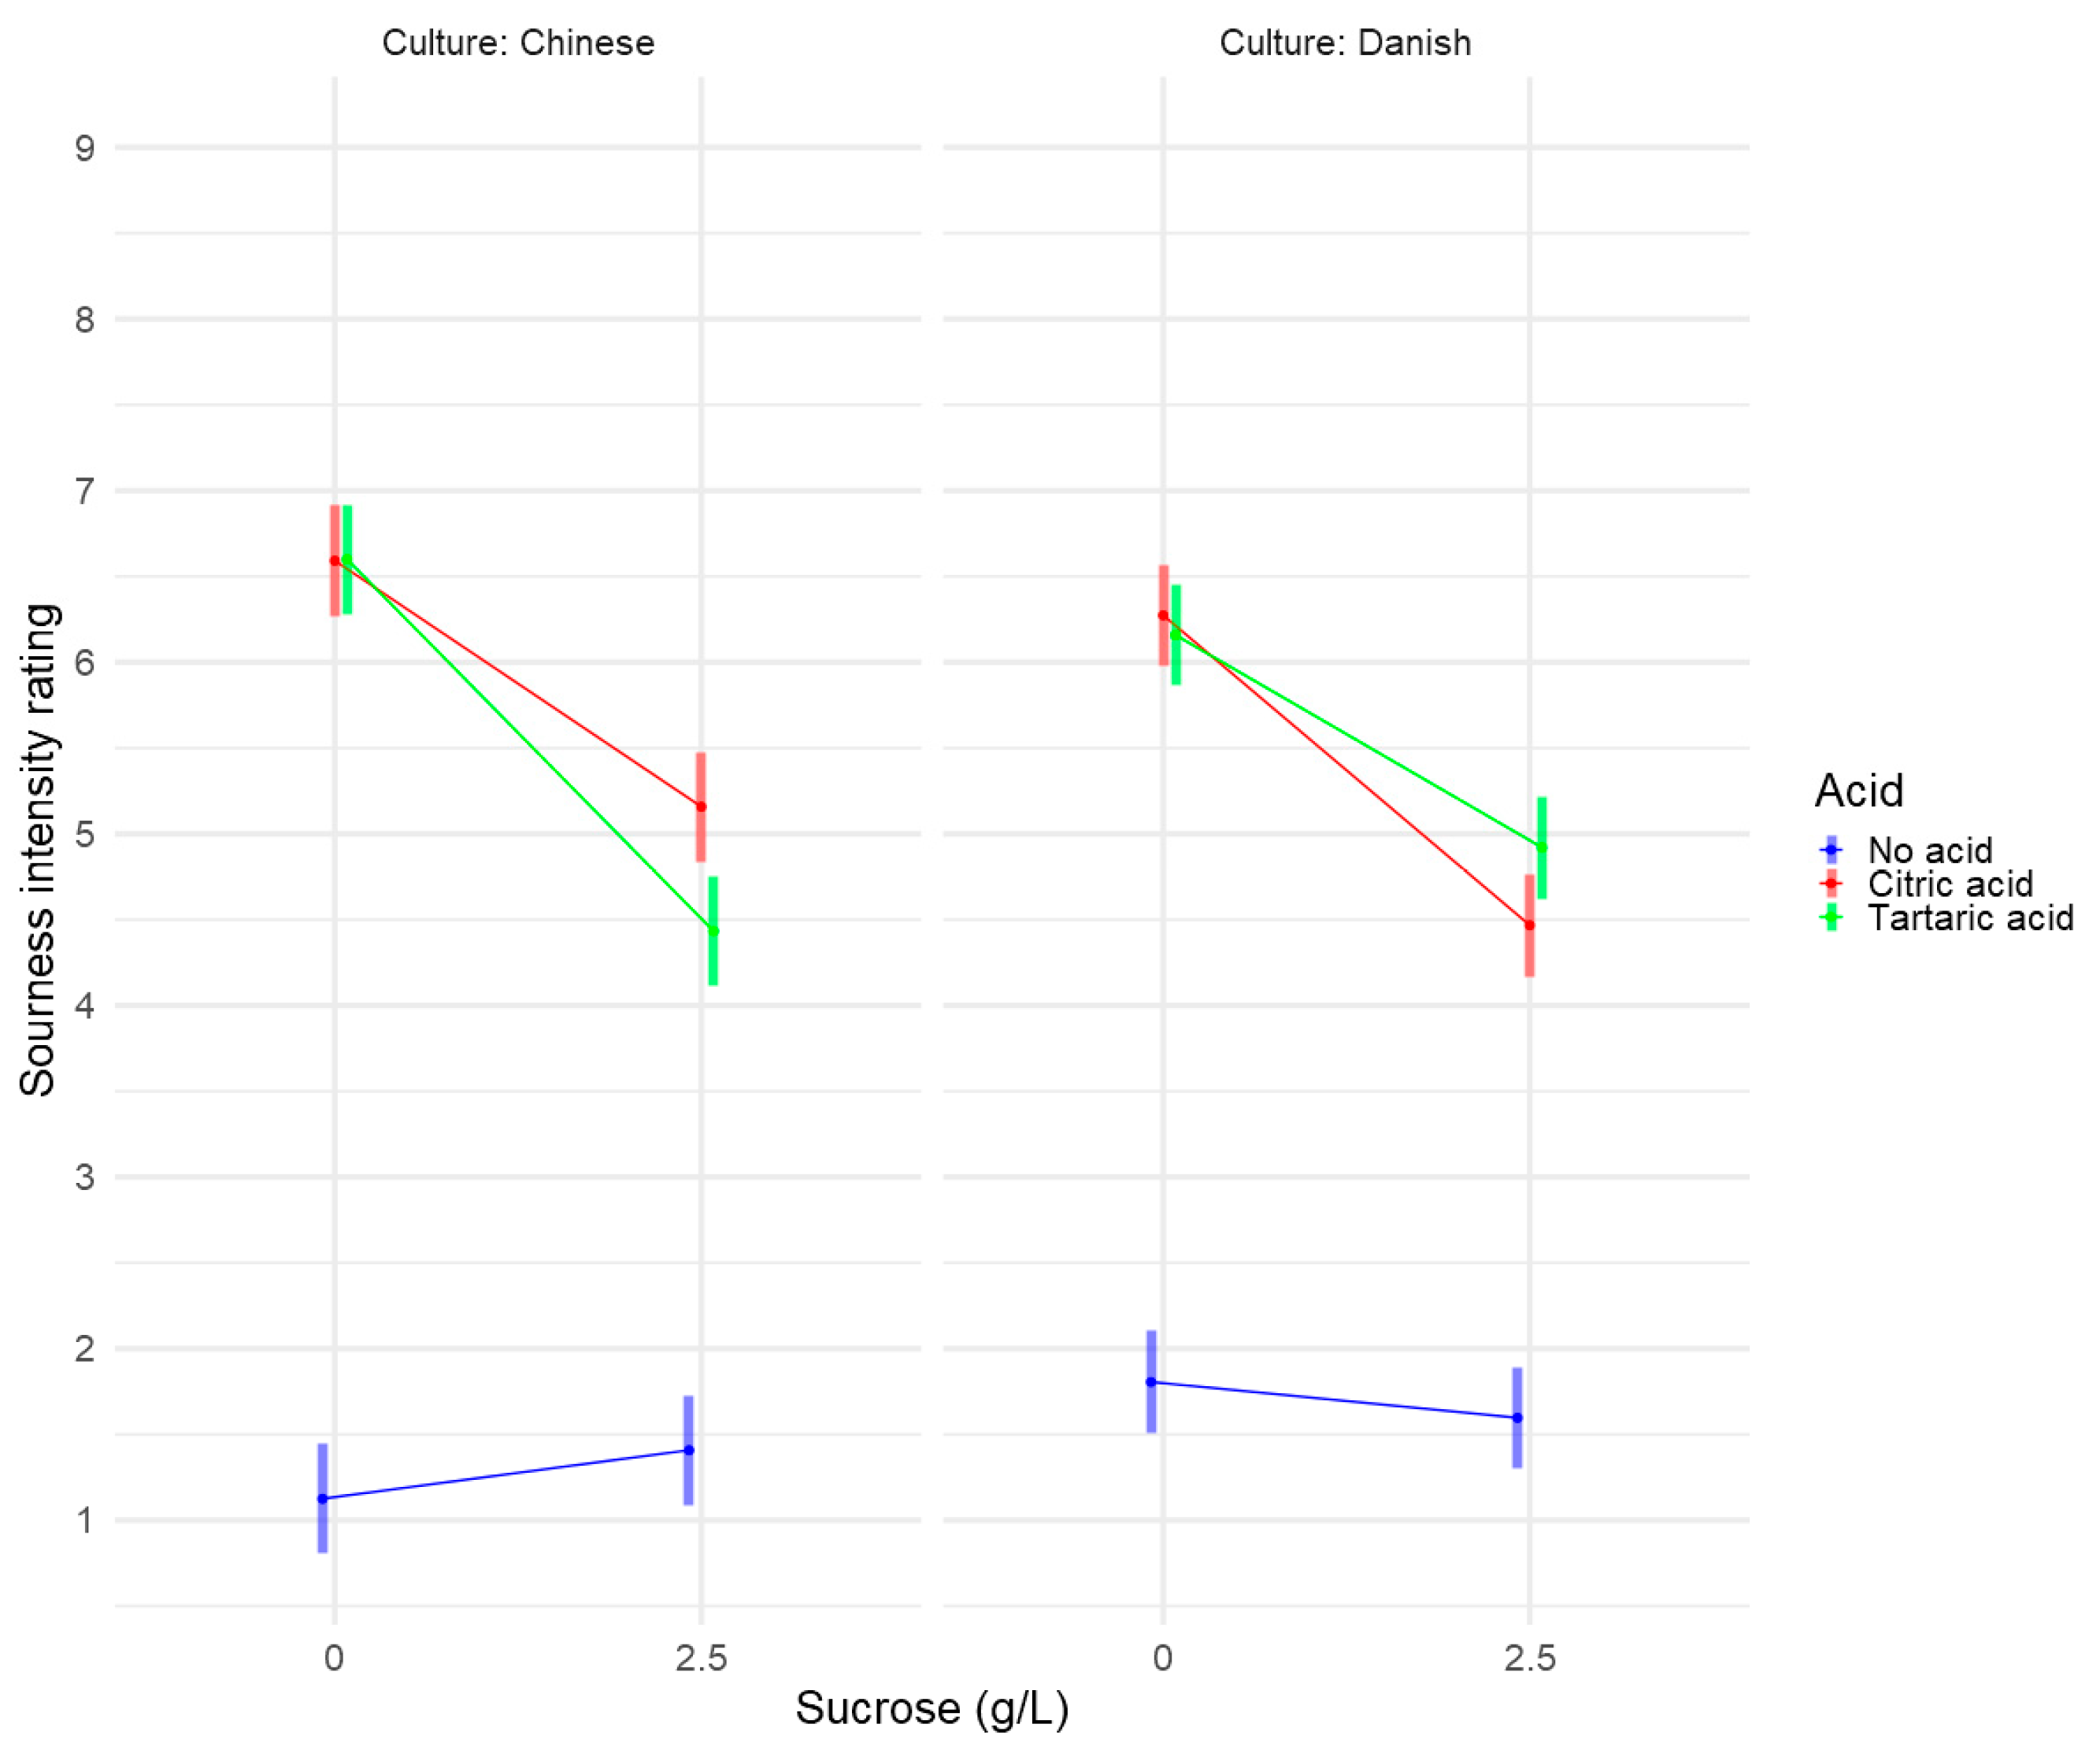
To investigate the effect of culture on taste interactions, ratings of sweetness- and sourness intensities were analyzed as follows. Dummy variables were constructed for sucrose and acids indicating whether samples contained this or not. The effects of acid, sucrose, culture and the interactions between these on either sweetness or sourness ratings were analyzed using Mixed model ANOVA with MAM. In the model, the effects of acid, sucrose, and culture were considered as fixed effects, and consumer effects were considered random effects. To further investigate the three-way interactions between acid, sucrose and culture for sourness these were presented visually. This plot was constructed similarly as the interaction plot for the effect of different acids.
2.3.5. Cluster Analysis on Sweetness and Sourness Ratings
Two separate cluster analyses were performed on the ratings of sweetness intensity and sourness intensity, respectively. In both cases, we used Agglomerative Hierarchical Clustering with Euclidean distances and Wards method using the R package cluster [
46]. The number of clusters were determined using NbClust package [
47] using the majority rule.
Characteristics of consumers in each cluster were summarized, and differences in culture and gender were evaluated using
2-tests, whereas gender, BMI, sweet food liking, and sour food liking were evaluated with ANOVA. Mean ratings of the different samples were calculated for each cluster, and HSD and ANOVA test for significant differences between clusters for each sample were performed. Mean calculation and HSD were performed similarly to the Overall Sample Evaluation Analysis. ANOVA was performed as one-way ANOVA between samples and clusters for each of the two taste intensity ratings. Lastly, consumers were plotted in PCA, showing both their culture and cluster number using the R package ggfortify [
48].
5. Conclusions
This study investigated the effect of different acids on sweet-sour taste interactions. It was shown that citric and tartaric acid both showed a similar overall suppression effect of sweetness from sucrose. Likewise, sucrose showed an overall suppression effect of sourness from both citric and tartaric acid. The effects on sourness from citric and tartaric acid were similar.
Further, this study investigated the perception of taste interactions between sweetness and sourness in a cross-cultural setting with Danish and Chinese consumers. An effect of culture on taste interactions of sweetness on sourness was found, but not of sourness on sweetness. Further analysis revealed that sucrose suppressed sourness of tartaric acid to a larger degree in Chinese than Danish consumers.
Lastly, cluster analysis showed differences in taste interactions for both sweetness and sourness between different clusters, with little cultural selection into the groups.
These findings build to the evidence that differences in the perception of taste interactions in beverages are due to the individual rather than cultural differences. Thus, with a focus in the beverage industry to the diversification of the product range, it might be fruitful to investigate not only different demographic and hedonic consumer segments but also perceptual segments.

 ,
, 


