Article

The Application of Chemometrics to Volatile Compound Analysis for the Recognition of Specific Markers for Cultivar Differentiation of Greek Virgin Olive Oil Samples

by
Ioanna S. Kosma
,
Michael G. Kontominas
and
Anastasia V. Badeka
*
Laboratory of Food Chemistry, Department of Chemistry, University of Ioannina, 45110 Ioannina, Greece
*
Author to whom correspondence should be addressed.
Foods 2020, 9(11), 1672; https://doi.org/10.3390/foods9111672
Submission received: 12 October 2020 / Revised: 11 November 2020 / Accepted: 13 November 2020 / Published: 15 November 2020

Abstract

:
In the present study, volatile compound analysis of olive oil samples belonging to ten Greek cultivars was carried out. A total of 167 olive oil samples collected from two consecutive harvest years were analyzed by Head Space-Solid Phase Microextraction-Gas Chromatography/Mass Spectrometry (HS-SPME-GC/MS). Volatile compound data were combined with chemometric methods (Multivariate Analysis of Variance (MANOVA) and Linear Discriminant Analysis (LDA)) with the aim not only to differentiate olive oils but also to identify characteristic volatile compounds that would enable differentiation of botanical origin (marker compounds). The application of Stepwise LDA (SLDA) effectively reduced the large number of statistically significant volatile compounds involved in the differentiation process, and thus, led to a set of parameters, the majority of which belong to compounds that are highly dependent on variety. In addition, the use of these marker compounds resulted in an increased correct classification rate (85.6%) using the cross-validation method indicating the validity of the model developed despite the use of a large number of dependent variables (cultivars).

1. Introduction

Olive tree cultivation, one of the oldest and most important agricultural activities, has led to the diversification of olives into a large number of cultivars. The olive fruit cultivar is a major determinant of olive oil quality due to differences in specific aroma and taste, phenolic content, etc. leading to a variety of olive oils, each with unique flavor characteristics and stability. In Greece more than 30 cultivars of olives exist, and most are characteristic of cultivation area (i.e., Galano cultivar from Metagitsi of Halkidiki, Topiki Makris cultivar from Evros, Samothrakis cultivar from Samothraki island, etc.) [1,2].
According to the International Food Authenticity Assurance Organization (ΙFAAO) [3], “food authenticity is the process of irrefutably proving that a food or food ingredient is in its original, genuine, verifiable and intended form as declared and represented”. Food authentication is the concern of (i) regulatory authorities to avoid food adulteration (ii) food processors that do not wish to be subjected to unfair competition from unscrupulous processors who would gain an economic advantage from the misrepresentation of the food they are selling and (iii) the rights of consumers who expect to purchase and consume genuine, unadulterated and quality foods for which they usually pay a premium price. Having all this in mind, the European Union has issued regulation 178/2002 [4] regarding the quality, safety and traceability of commercially available foods.
Sophisticated analytical techniques used for the authentication of olive oil include: analysis of volatile compounds by the HS-SPME-GC/MS method [1,2], proton transfer mass spectrometry (PTR/MS) [5], isotopic ratio mass spectroscopy (IRMS) [6,7], nuclear magnetic resonance (NMR) [8,9,10], DNA molecular techniques [11,12,13], two dimensional gas chromatography (GC x GC) [14], liquid chromatography with DAD or mass spectrometry [15,16], inductively coupled plasma spectroscopy (ICP) [17], etc.
Olive oil is generally defined on the basis of its sensory as well as its physico-chemical characteristics. Within sensory evaluation, many volatile compounds are considered responsible for desirable and undesirable odor attributes of olive oil. As volatiles are influenced by many factors (olive cultivar, fruit ripeness, local climatic and soil conditions, specific agriculture practices, processing and packaging conditions, etc.) [18], variation is observed in the olive oil aroma profile. A high concentration of volatile compounds in olive oil does not guarantee the intensity of its aroma. This can be explained by the fact that the aromatic profile may include compounds with a very low olfactory threshold, in contrast to others that are present in higher concentrations and yet, contribute very little or not at all to olive oil aroma. Either major or minor volatile compounds are crucial for olive oil quality. The wide variety of volatile compounds present in high quality virgin olive oil belong to several chemical groups. The most important groups are the C5 and C6 compounds that include aldehydes, alcohols, esters and hydrocarbons. These compounds are produced via the lipoxygenase pathway (LOX) and fatty acid and amino acid metabolism [18,19,20].
The sensory evaluation protocol for olive oil, namely, the Panel Test, has been established by the International Olive Oil Council [21] and EU regulations [22,23]. In this procedure, a group of more than eight trained panelists detects the presence of different sensory attributes in virgin olive oil samples and scores their intensity into a scale from 0 to 10. Several disadvantages of this evaluation technique, however, include the lack of reference standards, low repeatability of data, and to a certain degree subjectivity, etc. [24]. The volatile profile of an olive oil sample represents a fingerprint of the specific sample and gas chromatography (GC) coupled to mass spectrometry (MS) has been the most widely employed technique in combination with SPME that has been successfully applied for the classification of olive oils according to cultivar and/or geographical origin [1,2,25,26,27,28,29].
Previously published data on the differentiation of olive oil cultivars by means of instrumental analysis combined with chemometrics have led to the conclusion that this combination is a very powerful tool for the determination of authenticity of olive oil [1,2,25]. Literature data has shown that volatile compound analysis per se or in combination with other analytical parameters resulted in a greater aggregation of olive oil samples in respective cultivars. This fact and the potential of this analytical technique have been used in the present study, the aim of which was to determine those volatiles which have a higher discriminant ability for cultivar differentiation of olive oil. For this purpose, the volatile compound data from ten different olive oil cultivars were combined and analyzed using Multivariate Analysis of Variance (MANOVA) and Linear Discriminant Analysis (LDA). As the number of significant variables (p < 0.05) that derive from MANOVA may be quite large, stepwise LDA (SLDA) was then applied in order to reduce this number of volatiles to that which could be considered as the best set of predictors-markers of authenticity in relation to the herein studied cultivars.

2. Materials and Methods

2.1. Olive Oil Samples

A total of 167 virgin olive oil samples were collected during the harvest years 2012–2013 and 2013–2014 from various regions in Greece belonging to ten different cultivars, namely: Ladolia Kerkyras, Galano, Adramitiani, Samothraki, Athinolia, Hontrolia, Koutsourelia, Kolovi, Topiki Makris and Manaki (Table 1). Sampling was carried out during the months November until the end of January of each year. Olives were picked by hand at the stage of optimum maturity (maturity index 5–6). All olive samples were washed, crushed and fed to the malaxation station where the olive paste was processed at 30 °C for a period of 30 min. The paste was then separated by centrifugation at 35 °C. According to Guerrini et al. [30] an increase in temperature between malaxation and centrifugation positively affects olive oil quality and yield. Finally, olive oil was filtered and stored in dark glass bottles at 4 °C until analysis.

2.2. Determination of Free Acidity, Peroxide Value and Absorption Coefficients (K232, K270)

The conventional quality parameters were determined according to the Official EU method [22]. All determinations were carried out in triplicate.

2.3. HS-SPME-GC/MS

The determination of volatile compounds was carried out according Kosma et al. [1], using SPME in combination with GC/MS. Semi-quantification of volatile compounds was carried out using the internal standard method. Concentrations were calculated using the following formula:
C x = A R E A x × C i A R E A i
where Cx = concentration of the unknown compound, Ci = concentration of the internal standard solution, AREAx = peak area of the unknown compound and AREAi = peak area of the internal standard solution); results were expressed as μg/kg. All determinations were carried out in triplicate.

2.4. Statistical Analysis

Statistical treatment of data was performed using SPSS 25.0 software. Data were subjected to MANOVA in order to determine those variables that are significant for the differentiation of olive oil cultivar. Cultivar was taken as the independent variable, while volatile compounds were taken as the dependent variables. Pillai’s Trace and Wilks’ Lambda indices were computed to determine a possible significant effect of experimental parameter values on olive oil cultivar. LDA was then applied using the selected dependent variables in order to explore the potential for classification of olive oil samples according to cultivar. Original and leave-one-out cross-validation methods were used to test the prediction classification ability. In the original method, the prediction rate results from the contribution of all cases in the discriminant functions while in cross-validation, a randomly chosen parameter, is classified in a group based on a discriminant function, created by all the other parameters (except the randomly chosen one). This procedure is repeated for all the parameters of the tested sample. The homogeneity of variability was tested by application of the Box M index [31].
Since the number of volatile compounds resulting from the analysis is quite large, SLDA was used as a final step in order to determine those variables that show higher discriminant ability. The SLDA method is based on the creation of an initial model which does not include any of the significant variables-predictors. The predictors are introduced in the analysis sequentially, one-at-a-time, until all are included in the model. The SLDA classification method applies a forward variable selection algorithm using Wilks’ Lambda as a selection criterion and the F-statistical factor in order to determine the significance of changes in Wilks’ Lambda when the impact of a new variable is evaluated [32]. Before a new variable enters the classification model, the step-by-step process checks if all previous variables remain significant. If any of these are no longer significant, they are removed from the model and the process continues until there are no other variables that meet the entering standard or when the variable that will be inserted next is the one that was just rejected; at this point the variable selection process stops [33]. Thus, the SLDA procedure is guided by the corresponding F-to enter and the F-to remove values. The F-value, for a variable, indicates its statistical significance in discriminating between groups which is a measure of the degree a variable contributes to predicting group membership. The criteria for entry and removal are set by default, given by the statistical software, i.e., minimum F to enter the analysis is 3.84, maximum F to remove from the analysis is 2.71 [34]. The evaluation of the SLDA classification results was conducted using the leave-one-out method.

3. Results

3.1. Analysis of Conventional Quality Parameters

As shown in Table 2 the majority of olive oil samples tested were categorized as extra virgin olive oil since their acidity, peroxide value and absorption coefficients (K232 and K270) did not exceed the internationally established limits set by the EU Regulation [22]. Specifically, acidity recorded values between 0.3% ± 0.2 in Galano samples to 1.8% ± 1.6 in Adramitiani samples which along with samples from Ladolia Kerkyras, Samothraki and Athinolia (1.3 ± 1.5, 0.9 ± 0.6 and 0.8 ± 0.6, respectively) recorded higher acidity values and were categorized as virgin olive oil. Furthermore, Ladolia Kerkyras recorded the highest K232 value (2.76 ± 1.02) this categorizing this oil as “lampante” while the other samples remained lower than the internationally established limit of 2.50 [22].
In a similar study by Pouliarekou et al. [35] who classified olive oil samples from Western Greece according to cultivar and geographical origin, high values of quality parameters for samples belonging to Lanolia Kerkyras were also recorded. These samples were also categorized as “lampante” and according to the authors this may be related to the method of olive fruit collection, where in certain olive orchards in Kerkyra, fruits are left to fall off the olive tree and are collected in nets on the ground. In general, this collecting method is not a common practice as it causes damages to the fruit.

3.2. Analysis Volatile Compound Analysis

Sixty volatile compounds were identified and semi-quantified in olive oil samples tested (Table 3). These volatiles included alcohols, aldehydes, ketones, esters and hydrocarbons. The higher total concentration was recorded for the cultivars Ladolia Kerkyras (47,765.9 μg/kg), Topiki Makris (43,172.2 μg/kg) and Hontrolia (42,132.9 μg/kg).
The lipoxygenase pathway has a major contribution to virgin olive oil aroma as a wide variety of volatile compounds are produced through this biological pathway [19]. Aldehydes represented the most abundant chemical class, being the products of the lipoxygenase pathway, which starts right after damage of olive fruit tissues due to the release of enzymes that oxidize and cleave polyunsaturated fatty acids. (E)-2-Hexenal was the most abundant aldehyde identified in all samples tested, related to olive fruit maturity (characteristic of olive cultivar) and oxidation stage of olive oil [20,35] recording its higher concentration in the Topiki Makris cultivar (27,638.6 ± 4366.2 μg/kg). Hexanal followed, recording its highest concentration in the Ladolia Kerkyras (3774.7 ± 2983.8 μg/kg) and Topiki Makris (3189.8 ± 1057.7 μg/kg) samples. It should be noted that the relatively high hexanal content observed in the olive oil samples tested does not necessarily indicate either oxidized olive oils or olive oils in the early stages of oxidation. According to Morales et al. [36], and Vichi et al. [37], hexanal levels cannot distinguish oxidized from “virgin” olive oils as they come from both the lipoxygenase pathway and chemical oxidation of olive oil. (E)-2-Pentenal derives from the lipoxygenase pathway through the action of alkoxy radicals on linolenic acid 13-hydroperoxides producing the corresponding alcohol ((Z)-2-pentenol) which is subsequently oxidized. (E)-2-pentenal was not detected in the Adramitiani, Samothrakis, Athinolia, Ladolia Kerkyras and Manaki cultivars, while it showed the highest concentration in the Topiki Makris cultivar (67.7 ± 55.5 μg/kg). According to Morales et al. [36], and Kiritsakis [38], pentanal, octanal, nonanal and hexanal are the main compounds that form in oxidized olive oils, whereas in the samples tested, the first three were found at relatively low levels. Of these, pentanal and nonanal were identified in all olive oil samples, while octanal was not detected in the in Manaki cultivar.
Aldehydes are reduced to alcohols through the action of alcohol dehydrogenase. (E)-2-Hexenol was the most abundant alcohol recording its highest concentration in the Koutsourelia (1397.7 ± 1385.0 μg/kg), while hexanol, the second most abundant alcohol recorded the highest concentration in the Kolovi (1704.6 ± 1079.5 μg/kg) samples. These two alcohols can be used for cultivar differentiation while (E)-2-hexenol is responsible for the characteristic “green” aroma notes of the olive oil; hexanol’s odor perception is considered as fruity, banana like and grassy [1,2]. 1-Penten-3-ol, deriving from the lipoxygenase pathway through the action of alkoxy radicals on 13-hydroxy peroxides of linolenic acid [18], was present in all olive oil samples and its concentration ranged from 6.5 ± 23.5 μg/kg in the Samothrakis samples to 165.5 ± 125.4 μg/kg in Koutsourelia.
Another important chemical class that has a major contribution to olive oil aroma is that of esters. Esters derive from the lipoxygenase pathway, through the action of alcohol acyltransferase that catalyzes the formation of acetate esters through acetyl-CoA derivatives. Despite the fact that esters comprise minor components of olive oil aroma their contribution is quite significant as they complement aroma with sweet and pleasant notes [18,39]. Kolovi (3307.1 μg/kg), Manaki (2870.6 μg/kg) and Koutsourelia (2710.4 μg/kg) samples recorded the highest total concentrations compared to the other cultivars while esters were not identified in the volatile fraction of the Galano and Hontrolia olive oils. The absence of esters in the volatile fraction of certain cultivars may be due to the action of the enzyme alcohol acyltransferase. The activity of this enzyme is significantly influenced by pH (6.8–8) and temperature (35 °C), as well as the availability of the appropriate substrate. The activity of alcohol acyltransferase can be enhanced by cultivar selection as well as by modifying olive oil extraction conditions, i.e., operation at lower temperatures to prevent inactivation of the enzymes and promotion of esterification reactions [39].
Regarding ketones, their highest total concentration was recorded in the Hontrolia (3630.0 μg/kg) and Ladolia Kerkyras (3570.2 μg/kg) while Samothrakis recorded the lowest concentration (206.0 μg/kg). 1-Penten-3-one also derives from the lipoxygenase pathway and is positively correlated to bitter taste [39]. In olive oil samples tested, the lowest and highest concentration of 1-penten-3-one appeared in the Samothrakis and Topiki Makris cultivars (9.1 ± 22.4 μg/kg and 284.3 ± 148.8 μg/kg, respectively). 2-Pentanone and 3-pentanone resulting from homolytic cleavage processes, are also responsible for the green notes of aroma [40]. The highest concentrations of 2-pentanone and 3-pentanone occurred in the Kolovi cultivar (69.0 ± 130.0 μg/kg and 410.4 ± 271.3 μg/kg, respectively). Furthermore, 6-methyl-5-hepten-2-one was present in all samples tested with the exception of the Manaki samples. This ketone is produced through the action of the pseudomonads that break down terpene alcohols present in olive oil [41]. The organoleptic perception of this compound is characterized as pleasant, green, fruity and spicy, but when it exceeds the odor threshold (1.0 mg/kg) it gives an unpleasant aroma [41,42]. The 6-Methyl-5-hepten-2-one showed the highest concentration in Adramitiani cultivar (260.6 ± 240.3 μg/kg).
In the intact tissues of the olive fruit there are only a few volatile components, mainly hydrocarbons which do not contribute to fruit aroma. Most of the volatile compounds form as soon as the tissues are damaged and the various enzymatic activities, previously mentioned, initiate [43]. Significant variations were observed in the total amount of hydrocarbons as these were found at low concentrations in most of the samples with the exception of Ladolia Kerkyras (13006.4 μg/kg) and Hondrolia (15966.5 μg/kg). The lowest total amount of hydrocarbons was recorded in the Kolovi cultivar (1351.1 μg/kg). 3-Ethyl-1,5-octadiene deriving from the lipoxygenase pathway, recorded significant variations in all samples tested, indicating the influence of cultivar and/or environmental conditions on olive tree growing. Specifically, the highest value of 3-ethyl-1,5-octadiene was recorded in the Topiki Makris (858.9 ± 343.2 μg/kg) and the lowest in Athinolia (198.7 ± 148.4 μg/kg).
According to Bubola et al. [44], some volatile terpenes have been suggested as useful indicators for the geographical and botanical differentiation of virgin olive oil. The total amount of terpenes showed significant variations among cultivars. Three cultivars appeared to have a fairly high content of terpenes namely, Ladolia Kerkyras (3781.4 μg/kg), Adramitiani (5476.3 μg/kg) and Kolovi (4405.3 μg/kg). The terpenes identified and semi-quantified were α-pinene, δ-3-carene, p-cymene, dl-limonene, (E)-β-ocimene, allo-ocimene, α-copaene, (E)-β-farnesene, (E,E)-α-farnesene and α-muurolene.

3.3. Multivariate Analysis of Variance

As a first step, the 167 olive oil samples were subjected to MANOVA in order to determine those volatile compounds which are significant for cultivar differentiation. Dependent variables included the total 60 volatile compounds identified and semi-quantified while cultivar was taken as the independent variable. Pillai’s Trace = 7.049 (F = 6.059, p = 0.001 < 0.05) and Wilks’ Lambda = 0.001 (F = 8.875, p = 0.001 < 0.05) index values showed the existence of a significant multivariable effect of cultivar on the identity of volatile compounds.

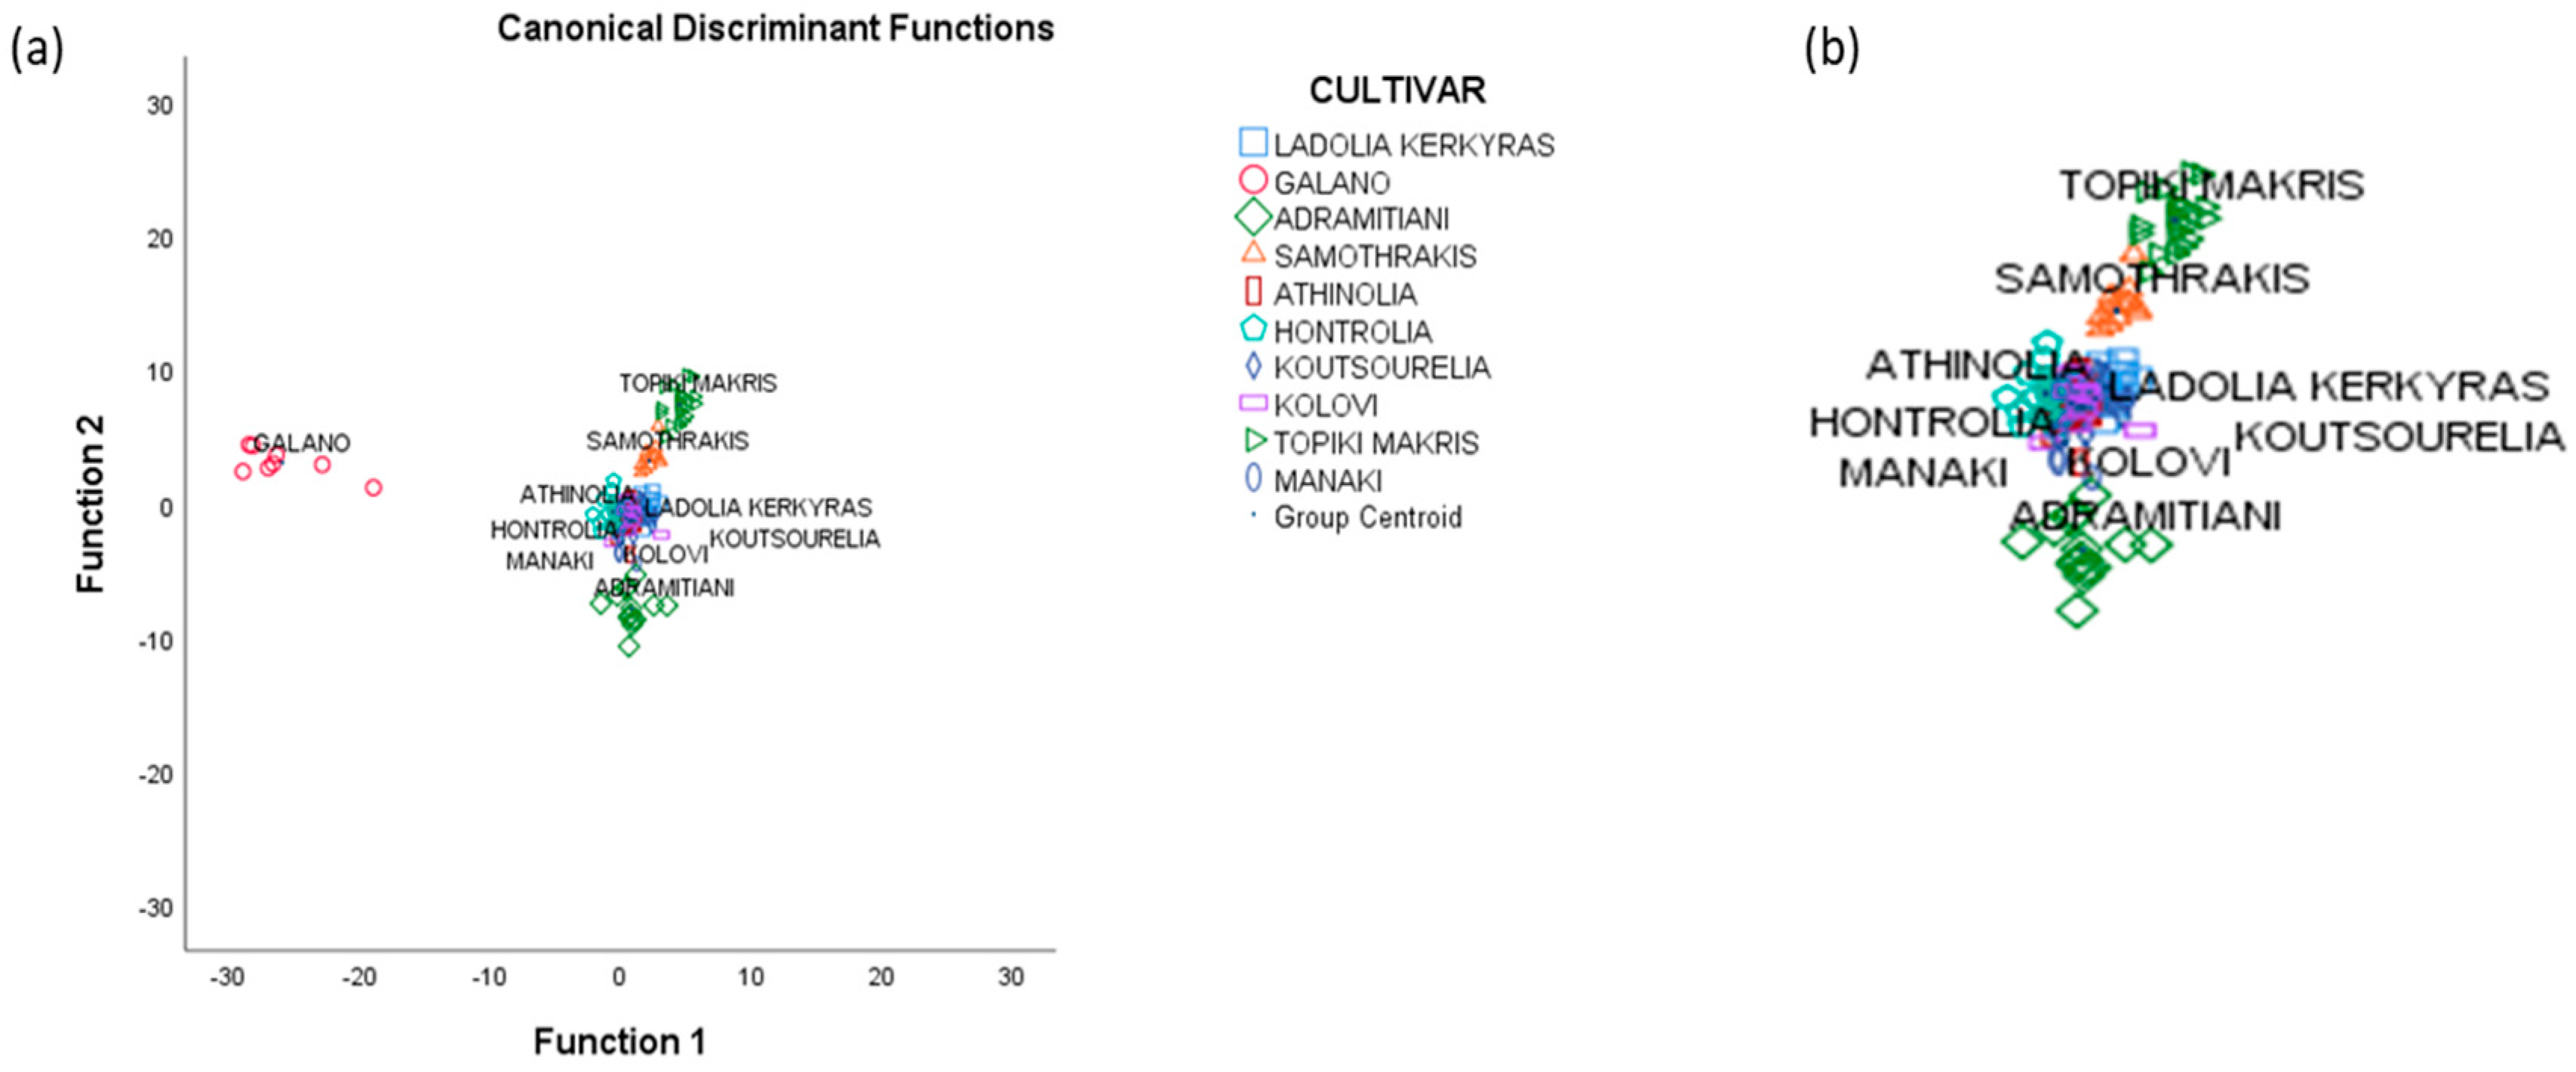
3.4. Linear Discriminant Analysis

Fifty-five volatiles were found to be significant (p < 0.05) for cultivar differentiation and thus, were subjected to LDA, a second step of the analysis. Results showed that three statistically significant discriminant functions are formed (Table 4). A significant value of Wilks’ Lambda index shows that the discriminant function is basic for the differentiation of the investigated groups. Testing of the uniformity of variability (Box M index = 736.955, F = 3.134, p = 0.050) was insignificant at the 95% confidence level indicating the existence of uniformity of sample variability for each cultivar. In Figure 1a it is shown that olive oil samples from Galano are very well differentiated from the other cultivars. In Figure 1b it is clear that Samothraki, Topiki Makris and Adramitiani cultivars are well differentiated while the other cultivars are overlapping. The overall correct classification rate was 99.4% for the original and 83.2% for the cross-validation method. Correct cultivar classification (100%) was achieved for Adramitiani, Samothraki and Galano cultivars.
Regarding five of the above olive cultivars (i.e., Galano, Samothrakis, Adramitiani, Athinolia and Ladolia Kerkyras) previously published work [1] showed that the application of LDA to olive oil volatiles led to a very satisfactory classification rate (97% original, 83% cross-validation), while Galano and Samothraki cultivars were fully differentiated from the rest of the cultivars investigated. Furthermore, regarding the other five cultivars (i.e., Hontrolia, Koutsourelia, Kolovi, Topiki Makris and Manaki) the classification rate achieved in previous work was 100% for the original and 82.4% for the cross-validation method also leading to very satisfactory differentiation of the tested cultivars [2]. In the present study, despite the quite large number of cultivars and dependent variables, the statistical model used showed a promising potential for olive oil cultivar differentiation. Combining the volatile compound analysis data of the ten cultivars, the classification rate slightly increased to 83.2% while four of the ten cultivars (Galano, Samothrakis, Topiki Makris and Adramitiani) were well differentiated.

3.5. Stepwise Linear Discriminant Analysis

As the final step of data statistical treatment, SLDA was used in order to select the variables with the higher discriminant ability. Of the 55 significant volatile compounds only 17 were found to have a higher discriminant ability (Table 5). Three statistically significant discriminant functions were formed (Table 4). As shown in Figure 2a, the Galano samples are very well differentiated. Figure 2b shows that olive oil samples from Samothraki, Topiki Makris and Adramitiani cultivars are also adequately differentiated while all other cultivars are overlapping. The overall correct classification rate was 94% for the original and 85.6% for the cross-validation method, somewhat increased in this case. Correct cultivar classification (100%) was achieved only for Galano, Adramitiani and Topiki Makris cultivars.
Of the 17 volatile compound-markers, 5 derive through the lipoxygenase pathway [1-penten-3-ol, (E)-2-hexen-1-ol, (E)-2-pentenal, (E)-2-hexenal and hexyl acetate. This fact indicates strong dependence of this biological pathway on cultivar as these compounds have a major contribution to virgin olive oil aroma with a wide variety of volatile compounds being produced through this biological pathway [13]. Pizarro et al. [32], in an attempt to recognize volatile markers for the geographical discrimination of Spanish olive oil samples, identified six volatile compounds as markers, all deriving from the lipoxygenase pathway. According to Angerosa et al. [18] the effect of cultivar can be demonstrated by the various amounts of C6 compounds resulting from the LOX pathway for oils obtained under the same operating conditions collected at the same ripening stage. Furthermore, minor dependence of the number of volatiles from climatic conditions and the geographical area of cultivation emphasizes that cultivar is the dominant factor affecting the aroma formation of olive oil. This feature, in combination with the different concentration of (E)-2-hexenal, represents an effective tool for differentiating single-variety oils from different varieties. Focusing on specific volatile compound-markers, Kesen et al. [42] reported that the most abundant aldehyde was (E)-2-hexenal, followed by hexanal, in Turkish olive oil samples belonging to the Halhali cultivar. Furthermore, Bubola et al. [44] reported that among the 50 volatile compounds identified in olive oils from Bova cultivar, C6 compound (E)-2-hexenal was the most abundant aldehyde, while Tanouti et al. [40] recorded that the main volatile compounds present in olive oil samples produced in eastern Morocco were C6 compounds such as hexanal, (E)-hex-2-enal, Z-3-hexen-1-ol and 1-hexanol, as in the present study. Finally, Issaoui et al. [26] who studied the effect of the growing area of cultivation on aroma profiles of Chemlali and Chetoui cultivars, recorded that (E)-2-hexenal and 1-hexanol can be used as potential indicators, in this case for geographical differentiation. Ethanol, according to Kalua et al. [39], results from the fermentation process that takes place in the olive fruit before oil extraction contributing wine aroma notes to olive oil. It, thus, can be considered as a sugar fermentation marker. Nonanal is one of the main compounds that forms in oxidized olive oils and is associated with oil sensory defects [36,38,41]. Thus, nonanal can be considered as a possible marker of early oxidation processes in olive oil. Finally, terpene concentration significantly varies depending on cultivar and geographical origin and terpenes have been suggested as indicators for virgin olive oil differentiation [42,44]. In the present study three terpenes (dl-limonene, (E)-β-ocimene and α-copaene) were identified as volatile markers. According to Zunin et al. [45], α-copaene along with α-muurolene and α-farnesene were the terpenes that aided the discrimination between extra virgin olive oil from West Liguria from those of other Mediterranean regions.

4. Conclusions

In the present study, volatile compound analysis from olive oil samples belonging to ten different cultivars from Greece was carried out in an effort to (i) to differentiate cultivar based on volatile compounds and (ii) to investigate the selection of potential markers leading to a successful cultivar differentiation. The results of the statistical treatment (MANOVA/LDA) showed that the differentiation of olive oil samples according to cultivar is possible despite the quite large number of cultivars investigated (83.2% cross-validation). Furthermore, the results obtained after the application of SLDA to the selected set of variables (55 volatile compounds) led to a quite reduced set of data (17 volatile compounds). These compounds provide a higher discriminant ability compared to the other volatiles, increasing the classification rate to 85.6% with the application of the cross-validation method. The specific volatile compounds identified as markers included a total of seventeen compounds. Of these, five derive from the lipoxygenase pathway (hexyl acetate, (E)-2-hexenal, (E)-2-hexenol, 1-penten-3-ol, (E)-2-pentenal) while three are terpenes (α-copaene, (E)-β-ocimene, dl-limonene), indicating a strong dependence of cultivar on the formation of olive oil’s volatile fraction. The resulting distribution diagram showed that the cultivars Galano, Samothrakis, Topiki Makris and Adramitiani were clearly differentiated. The results are quite encouraging, demonstrating the validity of the statistical model developed for the authentication of olive oil in relation to the differentiation of olive cultivars.

Author Contributions

Conceptualization, A.V.B.; I.S.K.; M.G.K.; methodology, I.S.K.; software, I.S.K.; formal analysis, I.S.K.; investigation, A.V.B.; I.S.K.; data curation, I.S.K.; writing—original draft preparation, I.S.K.; A.V.B.; writing—review and editing, I.S.K.; A.V.B.; M.G.K.; supervision, A.V.B.; M.G.K.; funding acquisition, M.G.K. All authors have read and agreed to the published version of the manuscript.

Funding

This research was funded by European and Greek funds through project “Determination of Authenticity of Selected Food Stuffs from Epirus” MIS 348127 within the operational program “Thessaly, Central Greece, Epirus 2007–2013” NSRF 2007–2013.

Conflicts of Interest

The authors declare no conflict of interest.

References

  1. Kosma, I.; Badeka, A.; Vatavali, K.; Kontakos, S.; Kontominas, M. Differentiation of Greek extra virgin olive oils according to cultivar based on volatile compound analysis and fatty acid composition. Eur. J. Lipid Sci. Technol. 2016, 118, 849–861. [Google Scholar] [CrossRef]
  2. Kosma, I.; Vavoura, M.; Kontakos, S.; Karabagias, I.; Kontominas, M.; Kiritsakis, A.; Badeka, A. Characterization and classification of extra virgin olive oil from five less well-known Greek olive cultivars. J. Am. Oil Chem. Soc. 2016, 93, 837–848. [Google Scholar] [CrossRef]
  3. International Food Authenticity Assurance Organization. Available online: https://uia.org/s/or/en/1122281809 (accessed on 30 October 2020).
  4. European Union No. 178/2002 of 28 January 2002, laying down the general principles and requirements of food law, establishing the European Food Safety Authority and laying down procedures in matters of food safety. Off. J. Eur. Union 2002, L31, 1–24.
  5. Ruiz-Samblás, C.; Tres, A.; Koot, A.; van Ruth, S.M.; González-Casado, A.; Luis Cuadros-Rodríguez, L. Proton transfer reaction-mass spectrometry volatile organic compound fingerprinting for monovarietal extra virgin olive oil identification. Food Chem. 2012, 134, 589–596. [Google Scholar] [CrossRef]
  6. Camin, F.; Larcher, R.; Perini, M.; Bontempo, L.; Bertoldi, D.; Gagliano, G.; Nicolini, G.; Versini, G. Characterisation of authentic Italian extra-virgin olive oils by stable isotope ratios of C, O and H and mineral composition. Food Chem. 2010, 118, 901–909. [Google Scholar] [CrossRef]
  7. Lukić, I.; Da Ros, A.; Guella, G.; Camin, F.; Masuero, D.; Mulinacci, N.; Vrhovsek, U.; Mattivi, F. Lipid Profiling and Stable Isotopic Data Analysis for Differentiation of Extra Virgin Olive Oils Based on Their Origin. Molecules 2019, 25, 4. [Google Scholar] [CrossRef] [Green Version]
  8. Lia, F.; Vella, B.; Zammit Mangion, M.; Farrugia, C. Application of 1H and 13C NMR fingerprinting as a tool for the authentication of Maltese extra virgin olive oil. Foods 2020, 9, 689. [Google Scholar] [CrossRef]
  9. Dais, P.; Hatzakis, E. Quality assessment and authentication of virgin olive oil by NMR spectroscopy: A critical review. Anal. Chim. Acta 2013, 765, 1–27. [Google Scholar] [CrossRef]
  10. Del Coco, L.; Schena, F.P.; Fanizzi, F.P. 1H Nuclear Magnetic Resonance Study of Olive Oils Commercially Available as Italian Products in the United States of America. Nutrients 2012, 4, 343–355. [Google Scholar] [CrossRef] [Green Version]
  11. Costa, J.; Mafra, I.; Oliveira, M.B.P.P. Advances in vegetable oil authentication by DNA-based markers. Trends Food Sci. Technol. 2012, 26, 43–55. [Google Scholar] [CrossRef]
  12. Giménez, M.J.; Pistón, F.; Martín, A.; Atienza, S.G. Application of real-time PCR on the development of molecular markers and to evaluate critical aspects for olive oil authentication. Food Chem. 2010, 118, 482–487. [Google Scholar] [CrossRef]
  13. Raieta, K.; Muccillo, L.; Colantuoni, V. A novel reliable method of DNA extraction from olive oil suitable for molecular traceability. Food Chem. 2015, 172, 596–602. [Google Scholar] [CrossRef] [PubMed]
  14. Stilo, F.; Cordero, C.; Sgorbini, B.; Bicchi, C.; Liberto, E.; Stilo, F.; Cordero, C.; Sgorbini, B.; Bicchi, C.; Liberto, E. Highly Informative Fingerprinting of Extra-Virgin Olive Oil Volatiles: The Role of High Concentration-Capacity Sampling in Combination with Comprehensive Two-Dimensional Gas Chromatography. Separations 2019, 6, 34. [Google Scholar] [CrossRef] [Green Version]
  15. Carranco, N.; Farrés-Cebrián, M.; Saurina, J.; Núñez, O. Authentication and quantitation of fraud in extra virgin olive oils based on HPLC-UV fingerprinting and multivariate calibration. Foods 2018, 7, 44. [Google Scholar] [CrossRef] [PubMed] [Green Version]
  16. Garcia-Villalba, R.; Carrasco-Pancorbo, A. Oliveras-Ferraros, C.; Vazquez-Martin, A.; Menendez, J.A.; Segura-Carretero, A.; Fernandez- Gutierrez, A. Characterization and quantification of phenolic compounds of extra-virgin olive oils with anticancer properties by a rapid and resolutive LC-ESI-TOF MS method. J. Pharmaceut. Biomed. Anal. 2010, 51, 416–429. [Google Scholar]
  17. Aceto, M.; Calà, E.; Musso, D.; Regalli, N.; Matteo Oddone, M. A preliminary study on the authentication and traceability of extra virgin olive oil made from Taggiasca olives by means of trace and ultra-trace elements distribution. Food Chem. 2019, 298, 125047. [Google Scholar] [CrossRef]
  18. Angerosa, F.; Servili, M.; Selvaggini, R.; Taticchi, A.; Esposto, S.; Montedoro, G. Volatile compounds in virgin olive oil: Occurrence and their relationship with the quality. J. Chromatogr. A 2004, 1054, 17–31. [Google Scholar] [CrossRef]
  19. Hatanaka, A. The biogeneration of green odour by green leaves. Phytochemistry 1993, 34, 1201–1218. [Google Scholar] [CrossRef]
  20. Angerosa, F. Influence of volatile compounds on virgin olive oil quality evaluated by analytical approaches and sensor panels. Eur. J. Lipid Sci. Technol. 2002, 104, 639–660. [Google Scholar] [CrossRef]
  21. International Olive Oil Council. Organoleptic Assessment of Virgin Olive Oil; IOOC Standard Procedure: Madrid, Spain, 1996. [Google Scholar]
  22. European Union No. 2568/91 of 11 July 1992 on the characteristics of olive oil and olive-residue oil and on the relevant methods of analysis. Off. J. Eur. Union 1991, L248, 1–83.
  23. European Union No. 796/2002 of 6 May 2002 amending Regulation (EEC) No. 2568/91 on the characteristics of olive oil and olive-pomace oil and on the relevant methods of analysis and additional notes in the Annex to Council regulation (EEC) No. 2658/91 on the tariff and statistical nomenclature and on the Common Customs Tariff. Off. J. Eur. Union 2002, L128, 23–28.
  24. Lawless, H.T. Descriptive analysis of complex odors: Reality, model or illusion? Food Qual. Pref. 1992, 10, 325–332. [Google Scholar] [CrossRef]
  25. Kosma, I.; Vatavali, K.; Kontakos, S.; Kontominas, M.; Kiritsakis, A.; Badeka, A. Geographical Differentiation of Greek Extra Virgin Olive Oil from Late-Harvested Koroneiki Cultivar Fruits. J. Am. Oil Chem. Soc. 2017, 94, 1373–1384. [Google Scholar] [CrossRef]
  26. Issaoui, M.; Flamini, G.; Brahmi, F.; Dabbou, S.; Hassine, K.B.; Taamali, A.; Chehab, H.; Ellouz, M.; Zarrouk, M.; Hammami, M. Effect of the growing area conditions on differentiation between Chemlali and Chétoui olive oils. Food Chem. 2010, 119, 220–225. [Google Scholar] [CrossRef]
  27. Baccouri, B.; Temime, S.B.; Campeol, E.; Cioni, P.L.; Daoud, D.; Zarrouk, M. Application of solid-phase microextraction to the analysis of volatile compounds in virgin olive oils from five new cultivars. Food Chem. 2007, 102, 850–856. [Google Scholar] [CrossRef]
  28. Berlioz, B.; Cordella, C.; Cavalli, J.; Lizzani-Cuvelier, L.; Loiseau, A.; Fernandez, X. Comparison of the amounts of volatile compounds in French protected designation of origin virgin olive oils. J. Agric. Food. Chem. 2006, 54, 10092–100101. [Google Scholar] [CrossRef]
  29. Luna, G.; Morales, M.T.; Aparicio, R. Characterization of 39 Varietal Virgin Olive Oils by their Volatile Compositions. Food Chem. 2006, 98, 243–252. [Google Scholar] [CrossRef]
  30. Guerrini, L.; Masella, P.; Angeloni, G.; Zanoni, B.; Breschi, C.; Calamia, L.; Parrenti, A. The effect of an increase in paste temperature between malaxation and centrifugation on olive oil quality and yield: Preliminary results. Ital. J. Food Sci. 2019, 31, 451–458. [Google Scholar]
  31. Field, A. Discovering Statistics Using SPSS; Sage Publications Ltd.: London, UK, 2009. [Google Scholar]
  32. Pizarro, C.; Rodríguez-Tecedor, S.; Pérez-del-Notario, N.; González-Sáiz, J.M. Recognition of volatile compounds as markers in geographical discrimination of Spanish extra virgin olive oils by chemometric analysis of non-specific chromatography volatile profiles. J. Chromatogr. A. 2011, 1218, 518–523. [Google Scholar] [CrossRef]
  33. Guo, J.; Yue, T.; Yuan, Y.; Sun, N.; Liu, P. Characterization of volatile and sensory profiles of apple juices to trace fruit origins and investigation of the relationship between the aroma properties and volatile constituents. LWT Food Sci. Technol. 2020, 124, 109203. [Google Scholar] [CrossRef]
  34. IBM Knowledge Center. Available online: https://www.ibm.com/support/knowledgecenter/en/SSLVMB_23.0.0/spss/tutorials/discrim_telco_stepwise.html (accessed on 19 February 2020).
  35. Pouliarekou, E.; Badeka, A.; Tasioula-Margari, M.; Kontakos, S.; Longobardi, F.; Kontominas, M.G. Characterization and classification of Western Greek olive oils according to cultivar and geographical origin based on volatile compounds. J. Chromatogr. 2011, 1218, 7534–7542. [Google Scholar] [CrossRef] [PubMed]
  36. Morales, M.T.; Rios, J.J.; Aparicio, R. Changes in the volatile composition of virgin olive oil during oxidation: Flavors and off-flavors. J. Agric. Food. Chem. 1997, 45, 2666–2673. [Google Scholar] [CrossRef]
  37. Vichi, S.; Pizzale, L.; Conte, L.S.; Buxaderas, S.; Lopez-Tamames, E. Solid-phase microextraction in the analysis of virgin olive oil volatile fraction: Characterization of virgin olive oils from two distinct geographical areas of northern Italy. J. Agric. Food. Chem. 2003, 51, 6572–6577. [Google Scholar] [CrossRef] [PubMed]
  38. Kiritsakis, A. Flavor components of olive oil. A review. J. Am. Oil Chem. Soc. 1998, 75, 673–681. [Google Scholar] [CrossRef]
  39. Kalua, C.M.; Allen, M.S.; Bedgood, D.R., Jr.; Bishop, A.G.; Prenzler, P.D.; Robards, K. Olive oil volatile compounds, flavor development and quality: A critical review. Food Chem. 2007, 100, 273–286. [Google Scholar] [CrossRef]
  40. Tanouti, K.; Serghini-Caid, H.; Sindic, M.; Wathelet, J.P.; Bouseta, A.; Elamrani, A. Volatile compounds, profiles of virgin olive oils produced in the eastern Morocco: Oxidative stability and sensory defects. J. Food Res. 2012, 1, 194–206. [Google Scholar] [CrossRef] [Green Version]
  41. Morales, M.T.; Luna, G.; Aparicio, R. Comparative study of virgin olive oil sensory defects. Food Chem. 2005, 91, 293–301. [Google Scholar] [CrossRef]
  42. Kesen, S.; Kelebek, H.; Selli, S. Characterization of the volatile, phenolic and antioxidant properties of monovarietal olive oil obtained from cv. Halhali. J. Am. Oil Chem. Soc. 2013, 90, 1685–1696. [Google Scholar] [CrossRef]
  43. Morales, M.T.; Aparicio-Ruiz, R.; Aparicio, R. Chromatographic Methodologies: Compounds for Olive Oil Odor Issues. In Handbook of Olive Oil. Analysis and Properties, 2nd ed.; Aparicio, R., Harwood, J., Eds.; Springer: New York, NY, USA, 2013; pp. 261–310. [Google Scholar]
  44. Bubola, K.B.; Krapac, M.; Lukić, I.; Sladonja, B.; Autino, A.; Cantini, C.; Poljuha, D. Morphological and Molecular Characterization of Bova Olive Cultivar and Aroma Fingerprint of Its Oil. Food Technol. Biotech. 2014, 52, 342–350. [Google Scholar]
  45. Zunin, P.; Boggia, R.; Salvadeo, P.; Evangelisti, F. Geographical Traceability of West Liguria Extra Virgin Olive Oils by the Analysis of Volatile Terpenoid Hydrocarbons. J. Chromatogr. A. 2005, 1089, 243–249. [Google Scholar] [CrossRef]
Figure 1. (a) Olive oil cultivar differentiation based on volatile compound analysis, distribution diagram obtained after the application of LDA (99.4% original, 83.2% cross-validation), (b) blow up of Figure 1a.
Foods 09 01672 g001
Figure 2. (a) Olive oil cultivar differentiation based on volatile compound analysis, distribution diagram obtained after the application of SLDA (93.4%original, 85.6% cross-validation), (b) blow up of Figure 2a.
Foods 09 01672 g002
Table 1. Olive oil samples collected.
Cultivars (Origin)Number of Samples
Topiki Makris (Evros)21
Samothraki (Samothraki isle)13
Galano (Metagitsi-Chalkidiki)8
Hontrolia (Chalikidiki)21
Adramitiani (Lesvos isle)15
Kolovi (Lesvos isle)8
Ladolia Kerkyras (Corfu isle)21
Koutsourelia (Etoloakarnania)18
Manaki (Korinthos)6
Athinolia (Lakonia)36
Table 2. Conventional Quality Parameters.
Cultivars% AcidityPV (meq O2/kg)Κ232Κ270
Topiki Makris0.6 ± 0.3 a12.3 ± 3.6 ab2.38 ± 0.38 bc0.15 ± 0.03 ab
Samothraki0.9 ± 0.6 ab8.7 ± 2.9 a1.89 ± 0.31 ab0.20 ± 0.03 b
Galano0.3 ± 0.2 a10.7 ± 2.6 a1.97 ± 0.21 ab0.14 ± 0.03 a
Hontrolia0.4 ± 0.2 a9.0 ± 3.2 a1.77 ± 0.27 a0.15 ± 0.03 a
Adramitiani1.8 ± 1.6 c11.2 ± 7.4 ab2.39 ± 0.86 bc0.17 ± 0.05 ab
Kolovi0.4 ± 0.2 a10.2 ± 5.0 a2.04 ± 0.45 ab0.16 ± 0.04 ab
Ladolia Kerkyras1.3 ± 1.5 bc15.6 ± 8.7 b2.76 ± 1.02 c0.20 ± 0.06 b
Koutsourelia0.5 ± 0.4 a10.0 ± 4.5 a2.04 ± 0.82 ab0.17 ± 0.04 ab
Manaki0.4 ± 0.2 a7.8 ± 1.2 a1.68 ± 0.22 a0.13 ± 0.03 a
Athinolia0.8 ± 0.6 ab10.8 ± 5.2 a1.93 ± 0.25 ab0.13 ± 0.02 a
Means with different letters in the same row are significantly different (p < 0.05).
Table 3. Mean values and standard deviation of volatile compounds (μg/kg) identified in olive oil samples.
Topiki MakrisSamothrakisGalanoHontroliaAdramitianiKoloviLadolia KerkyrasKoutsoureliaManakiAthinoliaRIlit1RIexp2
Alcohols
Ethanol22.8 ± 104.4 a83.9 ± 205.4 a238.9 ± 258.5 a153.8 ± 300.9 a1348.4 ± 1117.8 b2282.2 ± 2386.9 c104.5 ± 412.7 a172.9 ± 244.5 a1323.7 ± 682.0 b286.6 ± 453.3 a<500-3
1-Penten-3-ol 87.3 ± 46.2 b6.5 ± 23.5 a77.9 ± 51.6 b40.8 ± 65.8 ab64.2 ± 50.6 ab103.1 ± 72.6 b73.3 ± 77.9 b165.5 ± 125.4 c83.5 ± 44.7 b66.7 ± 65.3 b682686
1-Pentanol 3.3 ± 15.0 a31.5 ± 69.3 ab52.2 ± 62.4 b17.3 ± 59.6 ab62.4 ± 131.0 b16.5 ± 40.4 ab 768766
(Z)-2-Pentenol25.9 ± 48.0 a 6.6 ± 30.4 a6.3 ± 16.8 a101.7 ± 86.5 b25.6 ± 50.2 a100.4 ± 116.9 b 14.1 ± 36.4 a770767
(E)-2-Hexenol 855.7 ± 584.6 ab1387.1 ± 844.2b519.6 ± 466.5 a1336.0 ± 1068.0 b505.6 ± 457.8 a419.2 ± 278.4 a829.5 ± 551.5 ab1397.7 ± 1385.0b632.0 ± 321.9 a327.3 ± 220.6 a867862
Hexanol655.0 ± 378.5 ab1222.4 ± 1064.1cd325.4 ± 339.3 a637.5 ± 684.1 ab603.0 ± 525.3 ab1704.6 ± 1079.5 cd460.8 ± 778.3 ab935.7 ± 918.4 bc1335.0 ± 658.3 d320.9 ± 230.3 a870862
Total Alcohols1646.72699.91161.92178.02600.64663.11511.12834.53390.61027.2
Aldehydes
Butanal, 3-methyl- 1039.8 ± 4765.0 a6.9 ± 18.9 a3.4 ± 9.7 a15.3 ± 34.8 a39.4 ± 69.5 a 7.7 ± 20.3 a656660
Pentanal 151.7 ± 171.8 b155.2 ± 89.4 b68.8 ± 121.9 ab9.2 ± 42.1 a141.7 ± 161.2 ab36.0 ± 70.1 ab122.0 ± 315. 7 ab71.7 ± 84.2 ab7.8 ± 19.2 a16.5 ± 43.9 a699695
(E)-2-Pentenal 67.7 ± 55.5 b 10.0 ± 9.0 a7.6 ± 34.7 a 7.7 ± 21.8 a 25.3 ± 50.5 a 758754
(Z)-3-Hexenal181.8 ± 226.3 c32.3 ± 78.9 a116.5 ± 115.7 abc117.7 ± 129.2 abc 59.1 ± 167.2 ab89.6 ± 121.1 abc152.8 ± 198.8bc 14.4 ± 64.3 a800798
Hexanal 3189.8 ± 1057.7 cd2376.5 ± 913.3 abc1716.4 ± 1281.4 ab1523.6 ± 822.2 ab2451.1 ± 1281.2 bc1441.9 ± 1515.3 ab3774.7 ± 2983.8 d1457.7 ± 973.8 ab1101.3 ± 1008.3 a2539.4 ± 938.2 bc803798
(E)-2-Hexenal 27,638.6 ± 4366.2 c14,650.8 ± 6449.5 b8189.5 ± 5980.5 a15,450.5 ± 11,180.0 b2905.4 ± 1912.1 a5506.3 ± 3055.5 a19,133.1 ± 11,778.4 b17,274.3 ± 9844.7 b4486.1 ± 2568.5 a7010.0 ± 5588.7 a858852
Heptanal64.5 ± 52.6 a45.2 ± 59.9 a43.0 ± 121.7 a10.6 ± 33.5 a57.8 ± 75.5 a20.2 ± 43.4 a270.2 ± 382.0 b60.2 ± 134.6 a 140.1 ± 113.2 a904899
(E,E)-2,4-Hexadienal323.0 ± 106.4 b76.7 ± 123.9 a102.6 ± 141.9 a85.4 ± 175.4 a 8.5 ± 15.9 a92.0 ± 133.0 a272.7 ± 247.0b 916916
(E)-2-Heptenal139.2 ± 111.2 b81.6 ± 78.3 ab27.3 ± 77.3 ab61.5 ± 108.6 ab58.5 ± 90.1 ab 261.4 ± 241.0 c53.6 ± 78.4 ab 93.0 ± 136.8 ab961963
Benzaldehyde24.7 ± 40.6 ab 3.0 ± 11.7 a 30.5 ± 77.4 ab62.5 ± 102.9 b 4.7 ± 20.4 a974970
(E,E)-2,4-Heptadienal364.8 ± 514.6 ab207.1 ± 292.3 ab377.5 ± 162.3 ab394.9 ± 183.9 ab91.1 ± 131.2 a289.0 ± 206.9 ab161.9 ± 113.3 ab457.4 ± 203.7 b177.0 ± 64.4 ab144.5 ± 137.4 a10021008
Octanal 20.7 ± 51.8 a144.2 ± 318.0 a 75.5 ± 154.7 a 83.3 ± 175.5 a 100.5 ± 120.8 a10061004
Nonanal334.3 ± 120.1 a291.5 ± 168.2 a244.3 ± 277.6 a123.0 ± 138.8 a435.1 ± 438.2 a246.9 ± 338.2 a1203.8 ± 1528.3 a330.3 ± 469.5 a66.2 ± 74.9 a1028.2 ± 699.5 b11081099
Total Aldehydes32552.717937.711030.219447.06293.17642.525439.920277.75838.411889. 9
Ketones
2-Propanone 1437.9 ± 1814.9 ab 3406.4 ± 3664.4 b1781.0 ± 1682.8 ab2409.3 ± 720.9 ab3199.5 ± 1683.8 b342.3 ± 815.7 a356.2 ± 388.9 a2049.5 ± 2950.5 ab<500-
1-Penten-3-one 284.3 ± 148.8 b9.1 ± 22.4 a232.1 ± 232.3b68.1 ± 126.0 a27.7 ± 63.4 a69.6 ± 118.6 a41.3 ± 57.6 a262.2 ± 252.4b26.4 ± 64.7 a75.0 ± 100.4 a685678
2-Pentanone 61.8 ± 222.8 a 31.2 ± 60.0 a69.0 ± 130.0 a10.5 ± 33.3 a 46.5 ± 109.2 a686689
3-Pentanone 105.7 ± 76.8 abc69.9 ± 64.2 ab144.1 ± 111.0 abc117.5 ± 109.2 abc103.7 ± 62.7 abc410.4 ± 271.3d38.7 ± 77.5 a217.3 ± 190.2 c189.5 ± 65.9 bc60.2 ± 58.8 ab696694
2-Heptanone 10.6 ± 30.1 a 264.9 ± 559.7 b 14.3 ± 39.8 a 1.6 ± 9.8 a891889
6-Methyl-5-hepten-2-one130.0 ± 91.6 abc65.2 ± 84.6 a84.0 ± 107.1 a38.1 ± 66.9 a260.6 ± 240.3 c47.8 ± 57.1 a245.7 ± 350.8 bc112.7 ± 183.2 ab 57.6 ± 86.2 a986985
2-Octanone 275.9 ± 588.4 b 20.3 ± 49.9 a 12.4 ± 30.1 a992989
Total Ketones1957.8206.0470.83630.02745.23006.73570.2934.4572.22302.9
Esters
(Z)-3-Hexenyl acetate 425.0 ± 333.9 a258.8 ± 261.4 a 262.9 ± 298.5 a2698.5 ± 1110.6 c311.0 ± 431.4 a1986.2 ± 1224.8 b2021.0 ± 1291.3 b232.4 ± 390.8 a10041005
Hexyl acetate93.9 ± 73.7 a93.7 ± 87.1 a 76.5 ± 104.4 a608.6 ± 307.8 bc69.3 ± 142.1 a724.3 ± 393.5 bc849.7 ± 367.2 c61.1 ± 131.3 a10101011
Total Esters518.9352.4 339.43307.1380.32710.42870.6293.5
Terpenes
α-Pinene57.7 ± 135.4 a29.1 ± 104.8 a 31.2 ± 99.9 a3997.5 ± 5975.8 b154.6 ± 300.7 a654.6 ± 1452.6 a53.2 ± 195.0 a28.8 ± 44.9 a 945932
δ-3-Carene 6.8 ± 24.4 a 130.6 ± 273.6 b 133.0 ± 310.1 b 10221010
p-Cymene37.3 ± 66.6 a50.1 ± 64.9 a 4.4 ± 20.1 a49.0 ± 88.8 a176.4 ± 407.6 b47.9 ± 63.1 a9.1 ± 28.1 a 36.4 ± 59.0 a10351023
dl-Limonene39.0 ± 55.2 a874.0 ± 3061.2 a27.1 ± 50.2 a63.6 ± 72.0 a420.0 ± 1095.6 a3515.7 ± 5393.3 b665.9 ± 1757.8 a76.3 ± 224.9 a 87.6 ± 326.7 a10411035
(E)-β-Ocimene258.5 ± 77.9 a157.0 ± 201.4 a411.6 ± 299.2 a310.1 ± 286.0 a262.8 ± 136.4 a172.9 ± 148.7 a2009.3 ± 2244.1 b179.4 ± 315.4 a18.8 ± 29.4 a13.4 ± 33.5 a10491035
γ-Terpinene0.9 ± 3.9 a 16.9 ± 65.5 a306.6 ± 729.1 b44.2 ± 174.3 a 2.0 ± 12.0 a10681048
allo-Ocimene 7.5 ± 29.1 a 47.5 ± 87.6 b 11461129
α-Copaene182.7 ± 47.2 b101.9 ± 87.9 ab748.0 ± 309.4c197.4 ± 193.2 b31.1 ± 40.7 a16.6 ± 2.9 a4.4 ± 20.2 a3.8 ± 16.2 a37.7 ± 70.2 a1.1 ± 6.6 a14041392
(E)-β-Farnesene 31.4 ± 46.7 b 14671471
(E,E)-α-Farnesene282.8 ± 221.8 bcd325.8 ± 278.9 cd142.8 ± 157.7 abc194.6 ± 257.2 abc518.4 ± 371.7 d62.5 ± 67.9 ab151.9 ± 135.6 abc18.5 ± 45.1 a 15121509
α-Muurolene6.7 ± 30.7 a 72.9 ± 80.3 b20.2 ± 44.4 a11.2 ± 43.4 a 22.6 ± 73.7 a7.3 ± 31.0 a 15261530
Total Terpens865.51544.71402.3821.55476.34405.33781.4347.685.4140.5
Hydrocarbons
1,3-Butadiene, 2-methyl-35.2 ± 64.0b 13.4 ± 43.1 a <500-
(Z)-1,3-Pentadiene 26.4 ± 36.7 a 5.6 ± 25.7 a 17.2 ± 48.7 a 56.3 ± 81.5b <500-
Pentane, 2,2,4-trimethyl-1335.7 ± 3943.5 a4438.7 ± 5333.5 a1078.9 ± 1220.1 a14,039.8 ± 12,531.5 b22.9 ± 61.2 a 10,369.6 ± 13,701.5 b639.9 ± 1204.6 a149.1 ± 73.4 a510.7 ± 955.7 a689668
Heptane80.7 ± 121.1 a 236.4 ± 595.5 a198.4 ± 246.2 a87.2 ± 161.4 a165.7 ± 327.8 a23.8 ± 56.3 a 180.1 ± 289.8 a700700
Toluene 69.9 ± 80.4 a 15.6 ± 50.8 a10.3 ± 21.8 a106.8 ± 119.6 a256.8 ± 774.6 a212.3 ± 295.1 a12.6 ± 31.0 a10.3 ± 29.9 a773771
1-Octene 27.3 ± 34.2 a 39.2 ± 69.1 a 68.4 ± 143.3 a 70.5 ± 110.4 a793792
2-Octene 17.9 ± 64.6 a 7.0 ± 26.9 a 150.2 ± 313.4 b 22.0 ± 75.5 a818815
Xylene34.8 ± 47.4 a 5.1 ± 16.0 a21.1 ± 38.4 a92.6 ± 111.1 a311.6 ± 1013.2 a259.9 ± 581.8 a 9.5 ± 21.8 a879870
Cyclopentane, 2-propenyl-235.7 ± 91.2 c76.9 ± 53.5 ab108.7 ± 48.9 b49.2 ± 53.7 ab30.7 ± 42.6b76.5 ± 49.8 ab48.7 ± 58.9 ab111.6 ± 42.4 b21.6 ± 34.2 b17.4 ± 34.4 a898850
Styrene 22.3 ± 43.8 a 57.5 ± 158.2 ab 165.5 ± 373.3 b 39.5 ± 74.5 a901895
Nonane 6.8 ± 24.6 a 130.8 ± 211.1 b 900900
3-Ethyl-1,5-octadiene858.9 ± 343.2 c430.9 ± 232.7 ab618.6 ± 160.0 bc379.2 ± 184.6 ab214.2 ± 175.7 a412.3 ± 200.2 ab265.4 ± 195.5 a595.4 ± 247.4 bc283.8 ± 84.7 a198.7 ± 148.4 a939949
Benzene, 1,3,5-trimethyl- 27.9 ± 27.8 a 53.9 ± 208.9 a 978976
1,7-Nonadiene, 4,8-dimethyl569.4 ± 524.8 b330.7 ± 347.0 ab530.2 ± 121.4 b402.1 ± 170.3 ab139.4 ± 179.4 a345.5 ± 286.5 ab166.8 ± 221.3 a550.1 ± 273.4 b247.9 ± 78.7 ab154.3 ± 165.0 a9981026
Undecane 186.5 ± 36.5 c 118.3 ± 162.3 b 11001100
(E)-4,8-Dimethyl-1,3,7-nonatriene546.1 ± 208.7 c404.9 ± 431.0 bc57.1 ± 84.4 a19.3 ± 43.5 a10.1 ± 27.4 a50.3 ± 56.7 a385.9 ± 336.9 bc203.2 ± 158.5 ab 193.8 ± 120.2 ab1116-
Dodecane 120.1 ± 24.3 b 12.5 ± 33.2 a 12001200
Cyclodecane, methyl-276.2 ± 189.3 a229.0 ± 288.6 a1368.3 ± 896.3 c814.3 ± 471.2 b3451.8 ± 1527.7 d162.8 ± 182.4 a598.0 ± 439.9 ab274.7 ± 349.7 a881.4 ± 483.7 b73.7 ± 302.1 a12081202
Total Hydrocarbons4069.16013.54068.415966.54464.21351.113006.42940.61596.51480.5
Miscellaneous
Ethyl ether 87.4 ± 169.9 a 11.1 ± 31.4 a89.9 ± 175.7 a 43.6 ± 123.4 a76.7 ± 162.8 a39.2 ± 77.0 a27.7 ± 67.8 a97.6 ± 177.0 a<500-
Hexane, 1-methoxy-1120.3 ± 600.6 c867.9 ± 432.2 b 4.1 ± 15.9 a192.3 ± 206.0 a 56.4 ± 138.1 a 831832
(Z)-3-Hexene, 1-methoxy-353.7 ± 342.8 b354.0 ± 283.0 b 3.0 ± 11.6 a19.6 ± 55.5 a 832801
Total Miscellaneous1561.41221.811.189.97.1255.676.739.284.097.6
Total Volatiles43,172.229,976.018,154.642,132.921,925.824,631.447,765.930,084.514,437.817,232.2
Means with different letters in the same row are significantly different (p < 0.05), 1: RIlit: literature retention index, 2: RIexp: experimental retention index (NIST MS search), 3: not calculated.
Table 4. Discriminant functions formed and Linear Discriminant Analysis (LDA) and Stepwise LDA (SLDA) results (eigenvalues, explained variance, canonical correlation, W’Lambda, X2, df and p for each function).
Discriminant FunctionEigenvalueVariance %Cumulative %Can. CorrelationWilks’ LambdaX2dfp < 0.05
LDA
138.11048.248.20.9870.0012146.7694950.000
215.27619.367.60.9690.0011657.3084320.001
39.07011.579.00.9490.0041284.8823710.001
SLDA
110.90033.833.80.9570.0011649.2901620.000
28.93827.761.60.9480.0011272.8621360.000
34.77814.876.40.9090.002923.8201120.000
Table 5. Variables-predictors produced from SLDA.
StepVariables in the AnalysisF-Statisticdf1df2p
1Dodecane98.1359157.0000.001
2Hexane, 1-methoxy-69.98518312.0000.000
3Cyclodecane, methyl-60.43827453.3220.001
4Hexyl acetate55.04736578.8470.000
5α-Copaene46.78345687.5090.001
6Cyclopentane, 2-propenyl-40.90854779.6450.001
7(E)-β-Ocimene36.18363856.5480.001
8Nonanal33.01672919.9940.000
9Ethanol30.78381971.8860.001
10(E,Ε)-2,4-Heptadienal 29.134901014.0430.000
11(E)-2-Hexenal25.6851081075.4170.001
12(E)-2-Hexenol 24.2041171097.1960.001
133-Pentanone23.1181261114.3920.000
14dl-Limonene22.1181351127.7940.001
151-Penten-3-ol21.3621441138.0460.000
16(E)-2-Pentenal20.6471531145.6750.001
172-Propanone20.0221621151.1060.001
At each step, the variable that minimizes the overall Wilks’ Lambda is entered. Maximum number of steps is 110. Minimum partial F to enter is 3.84. Maximum partial F to remove is 2.71.
Publisher’s Note: MDPI stays neutral with regard to jurisdictional claims in published maps and institutional affiliations.

