Multi-Objective Optimization of Nutritional, Environmental and Economic Aspects of Diets Applied to the Spanish Context


 , and
, and 
Abstract
1. Introduction
2. Materials and Methods
2.1. Pre-Defined Daily Diet Scenarios
- The diet based on the National Dietary Guidelines—NDG [26].
- The diet followed the Mediterranean diet pyramid—MED [27].
- The diet followed taking into account ovo-lacto-vegetarian (OLV) recommendations from the Spanish Vegetarian Union
- The diet based on the recommendations for a vegan diet (VEG) provided by the Spanish Vegetarian Union
- The diet followed taking into consideration the Planetary Health (PLH) diet proposed by the EAT-Lancet Commission [1].
2.2. Multi-Objective Optimization Programming
2.3. Comparison among Diets
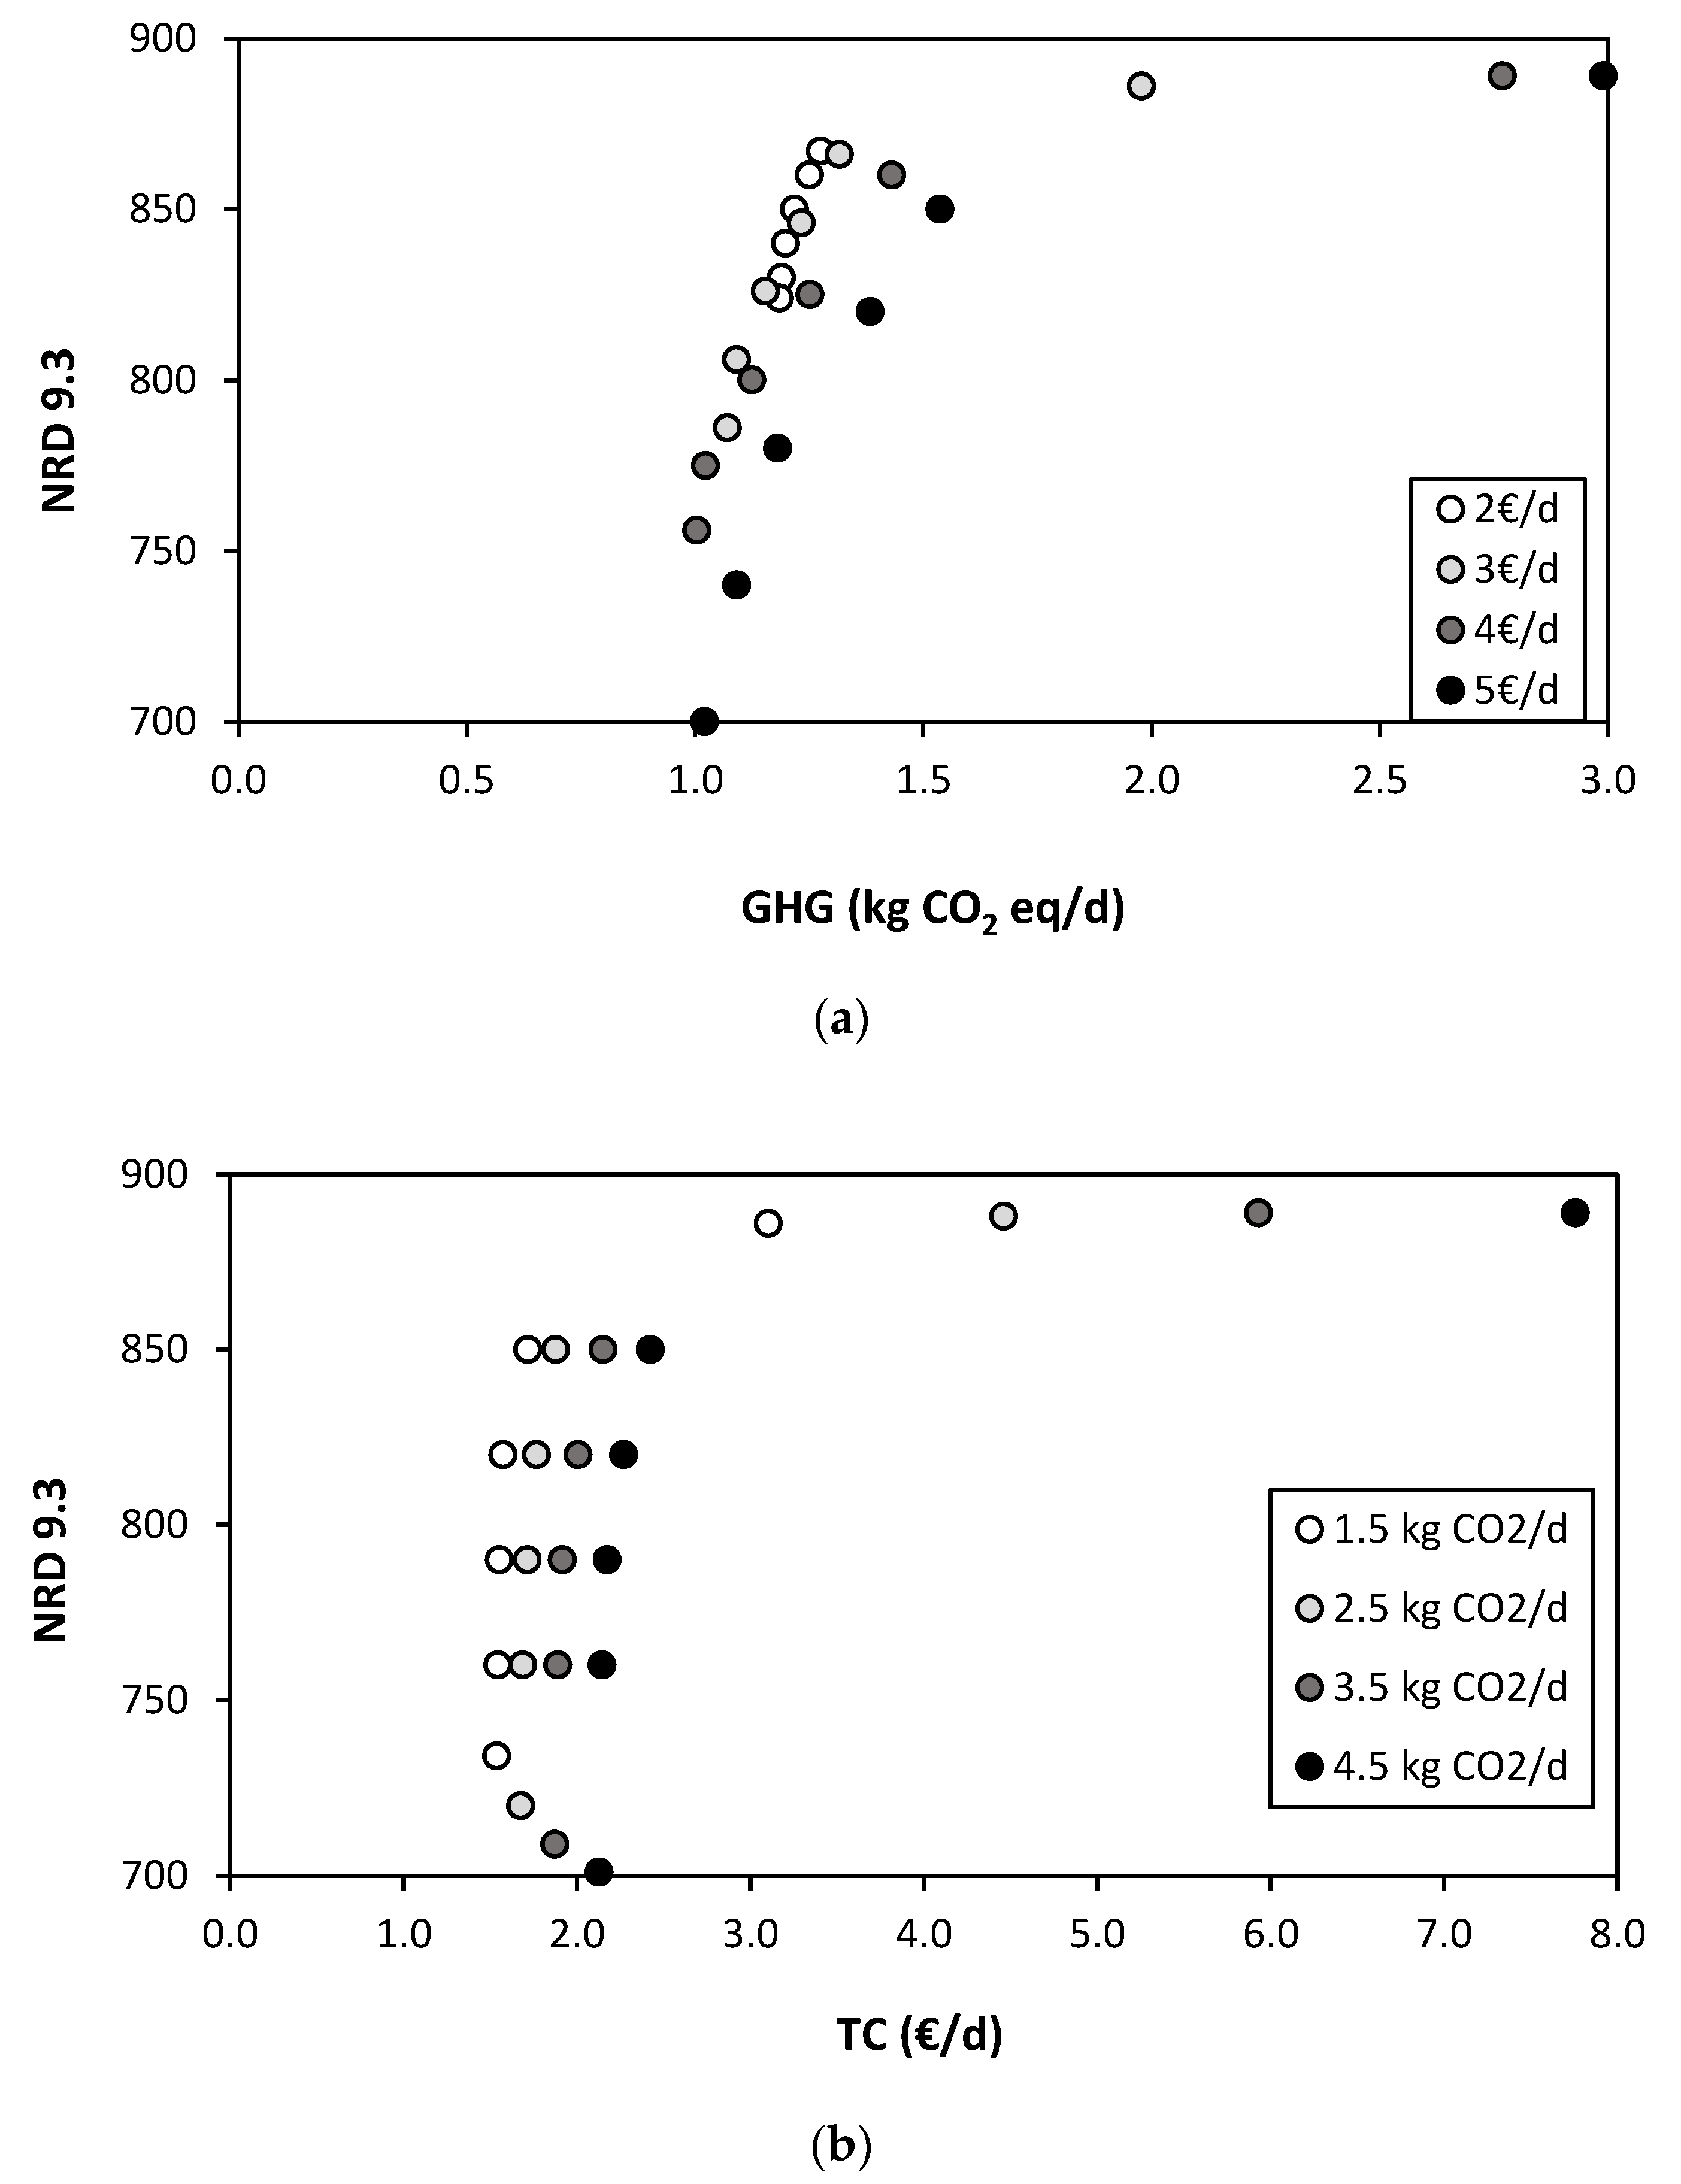
- The Residual Income Score (RIS), is based on the concept of the residual income of a diet (RIdiet): the consumption income (the money left after financial obligations) that remains after diets’ cost. RIS is defined as the ratio between the RIdiet (Equation (23)) and the maximal value (RImax) (Equation (22)). RImax was set to one, assuming a zero cost, meaning that all the consumption income remains available for other purposes besides food.
- The energy score (ES), or α (Equations (24) and (25)) account for the energy intake. Since this study evaluates isocaloric daily diets, this is set to 1.
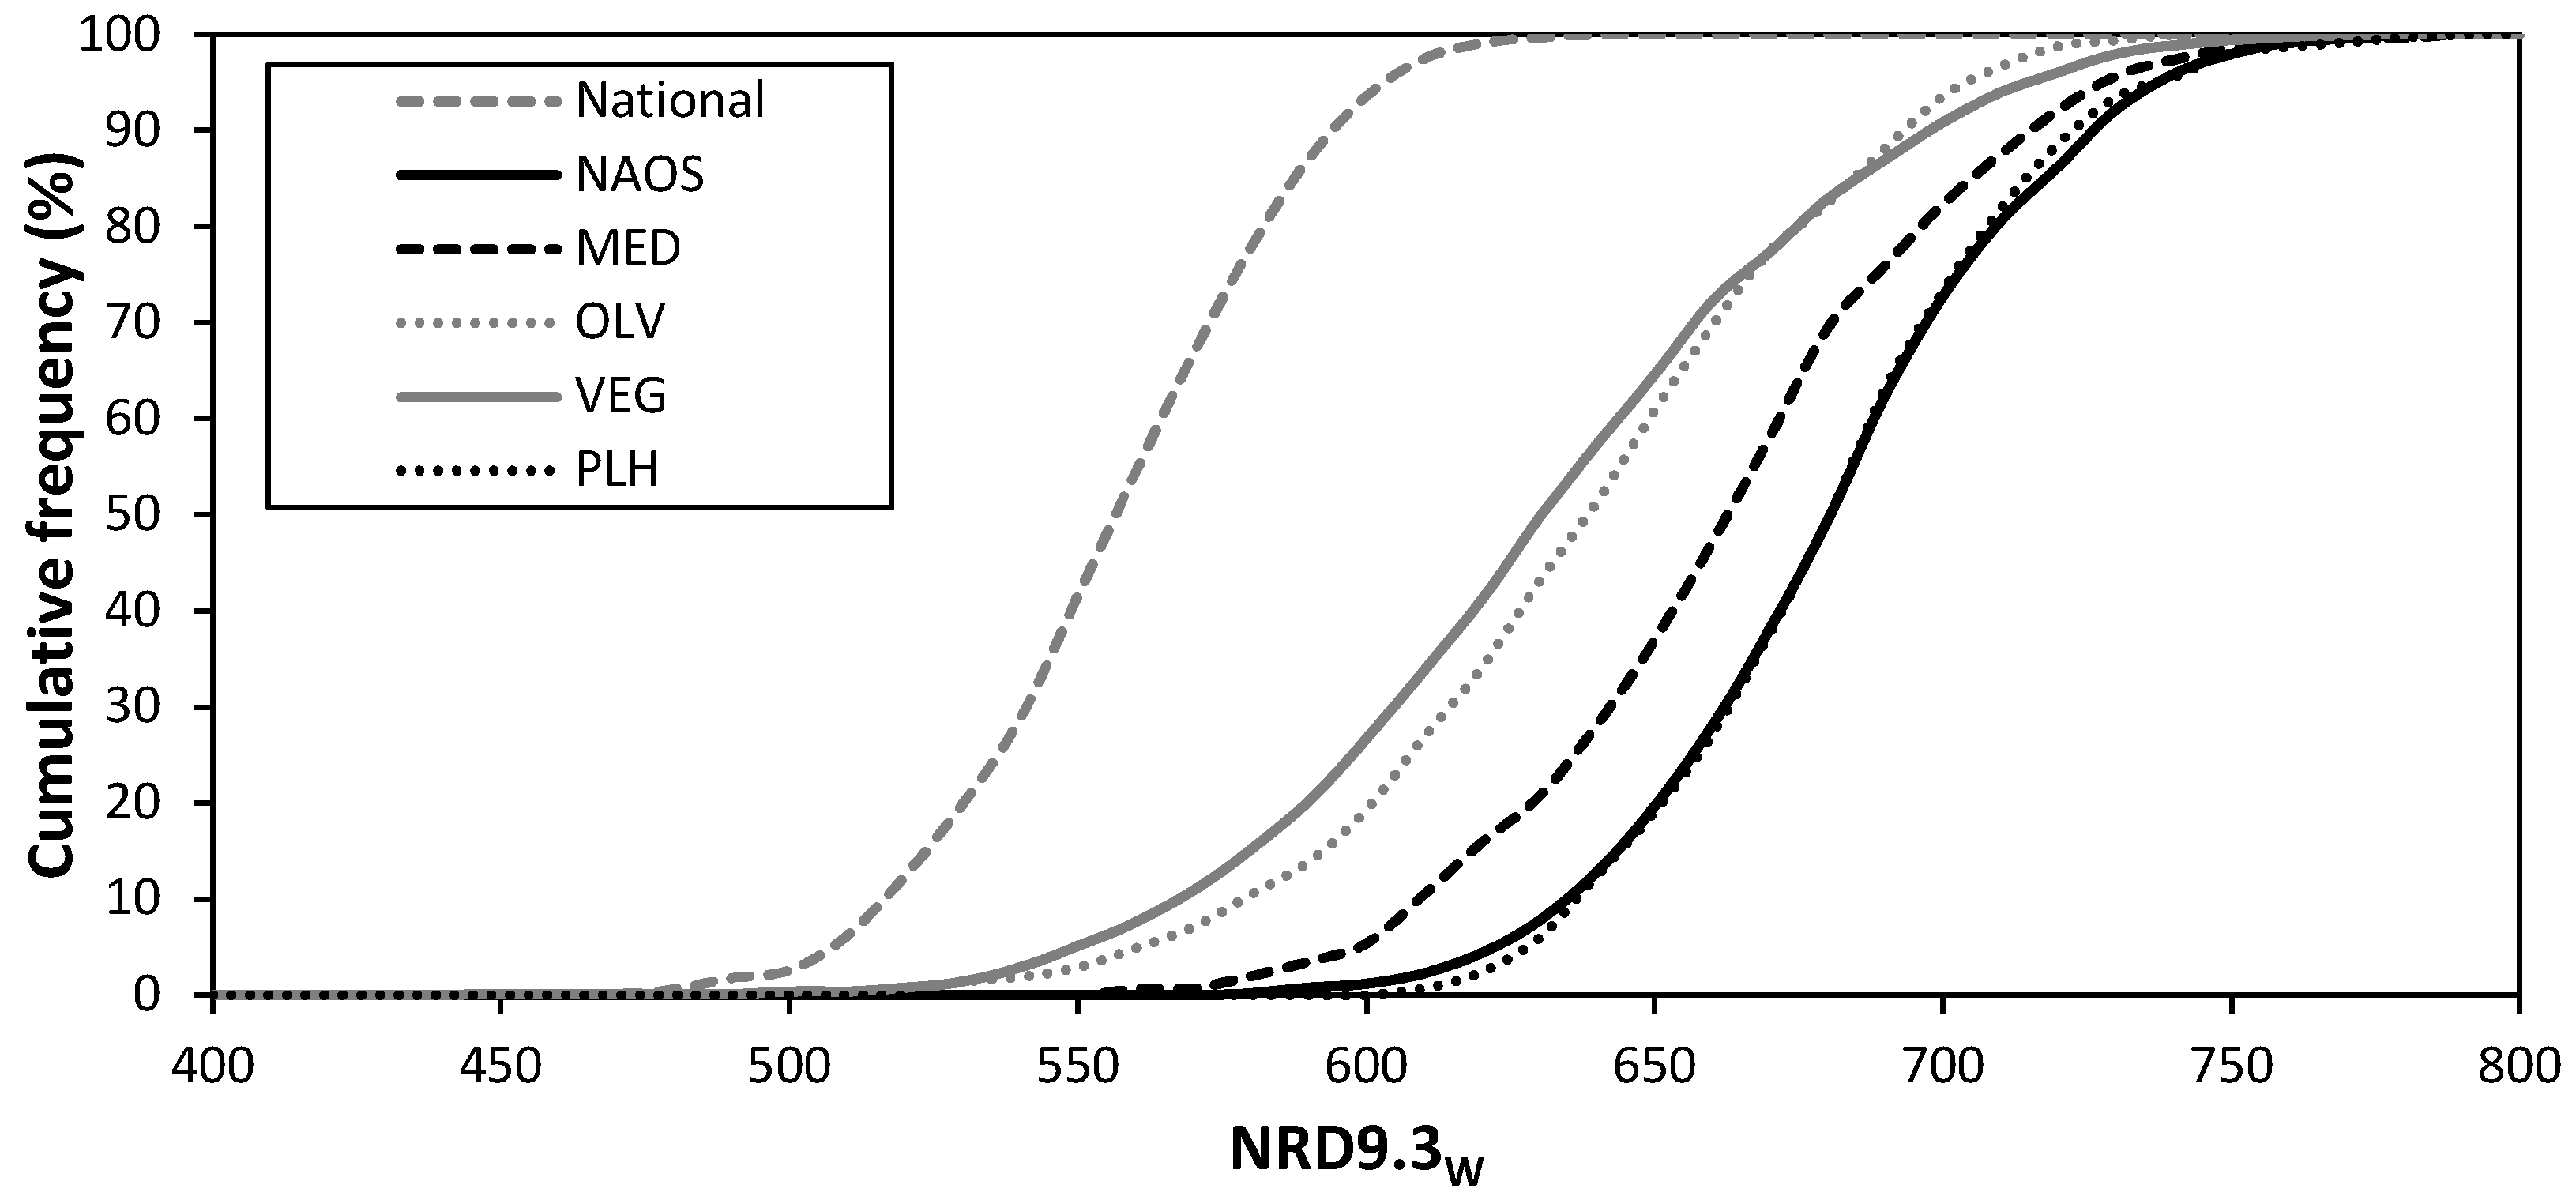
- The Nutritional Score (NS), is estimated as the ratio between the nutritional quality of a diet (NRD9.3diet) and the one of a reference diet (NRD9.3ref); in this study, the Planetary Health (PLH) diet.
2.4. Data Collection
3. Results
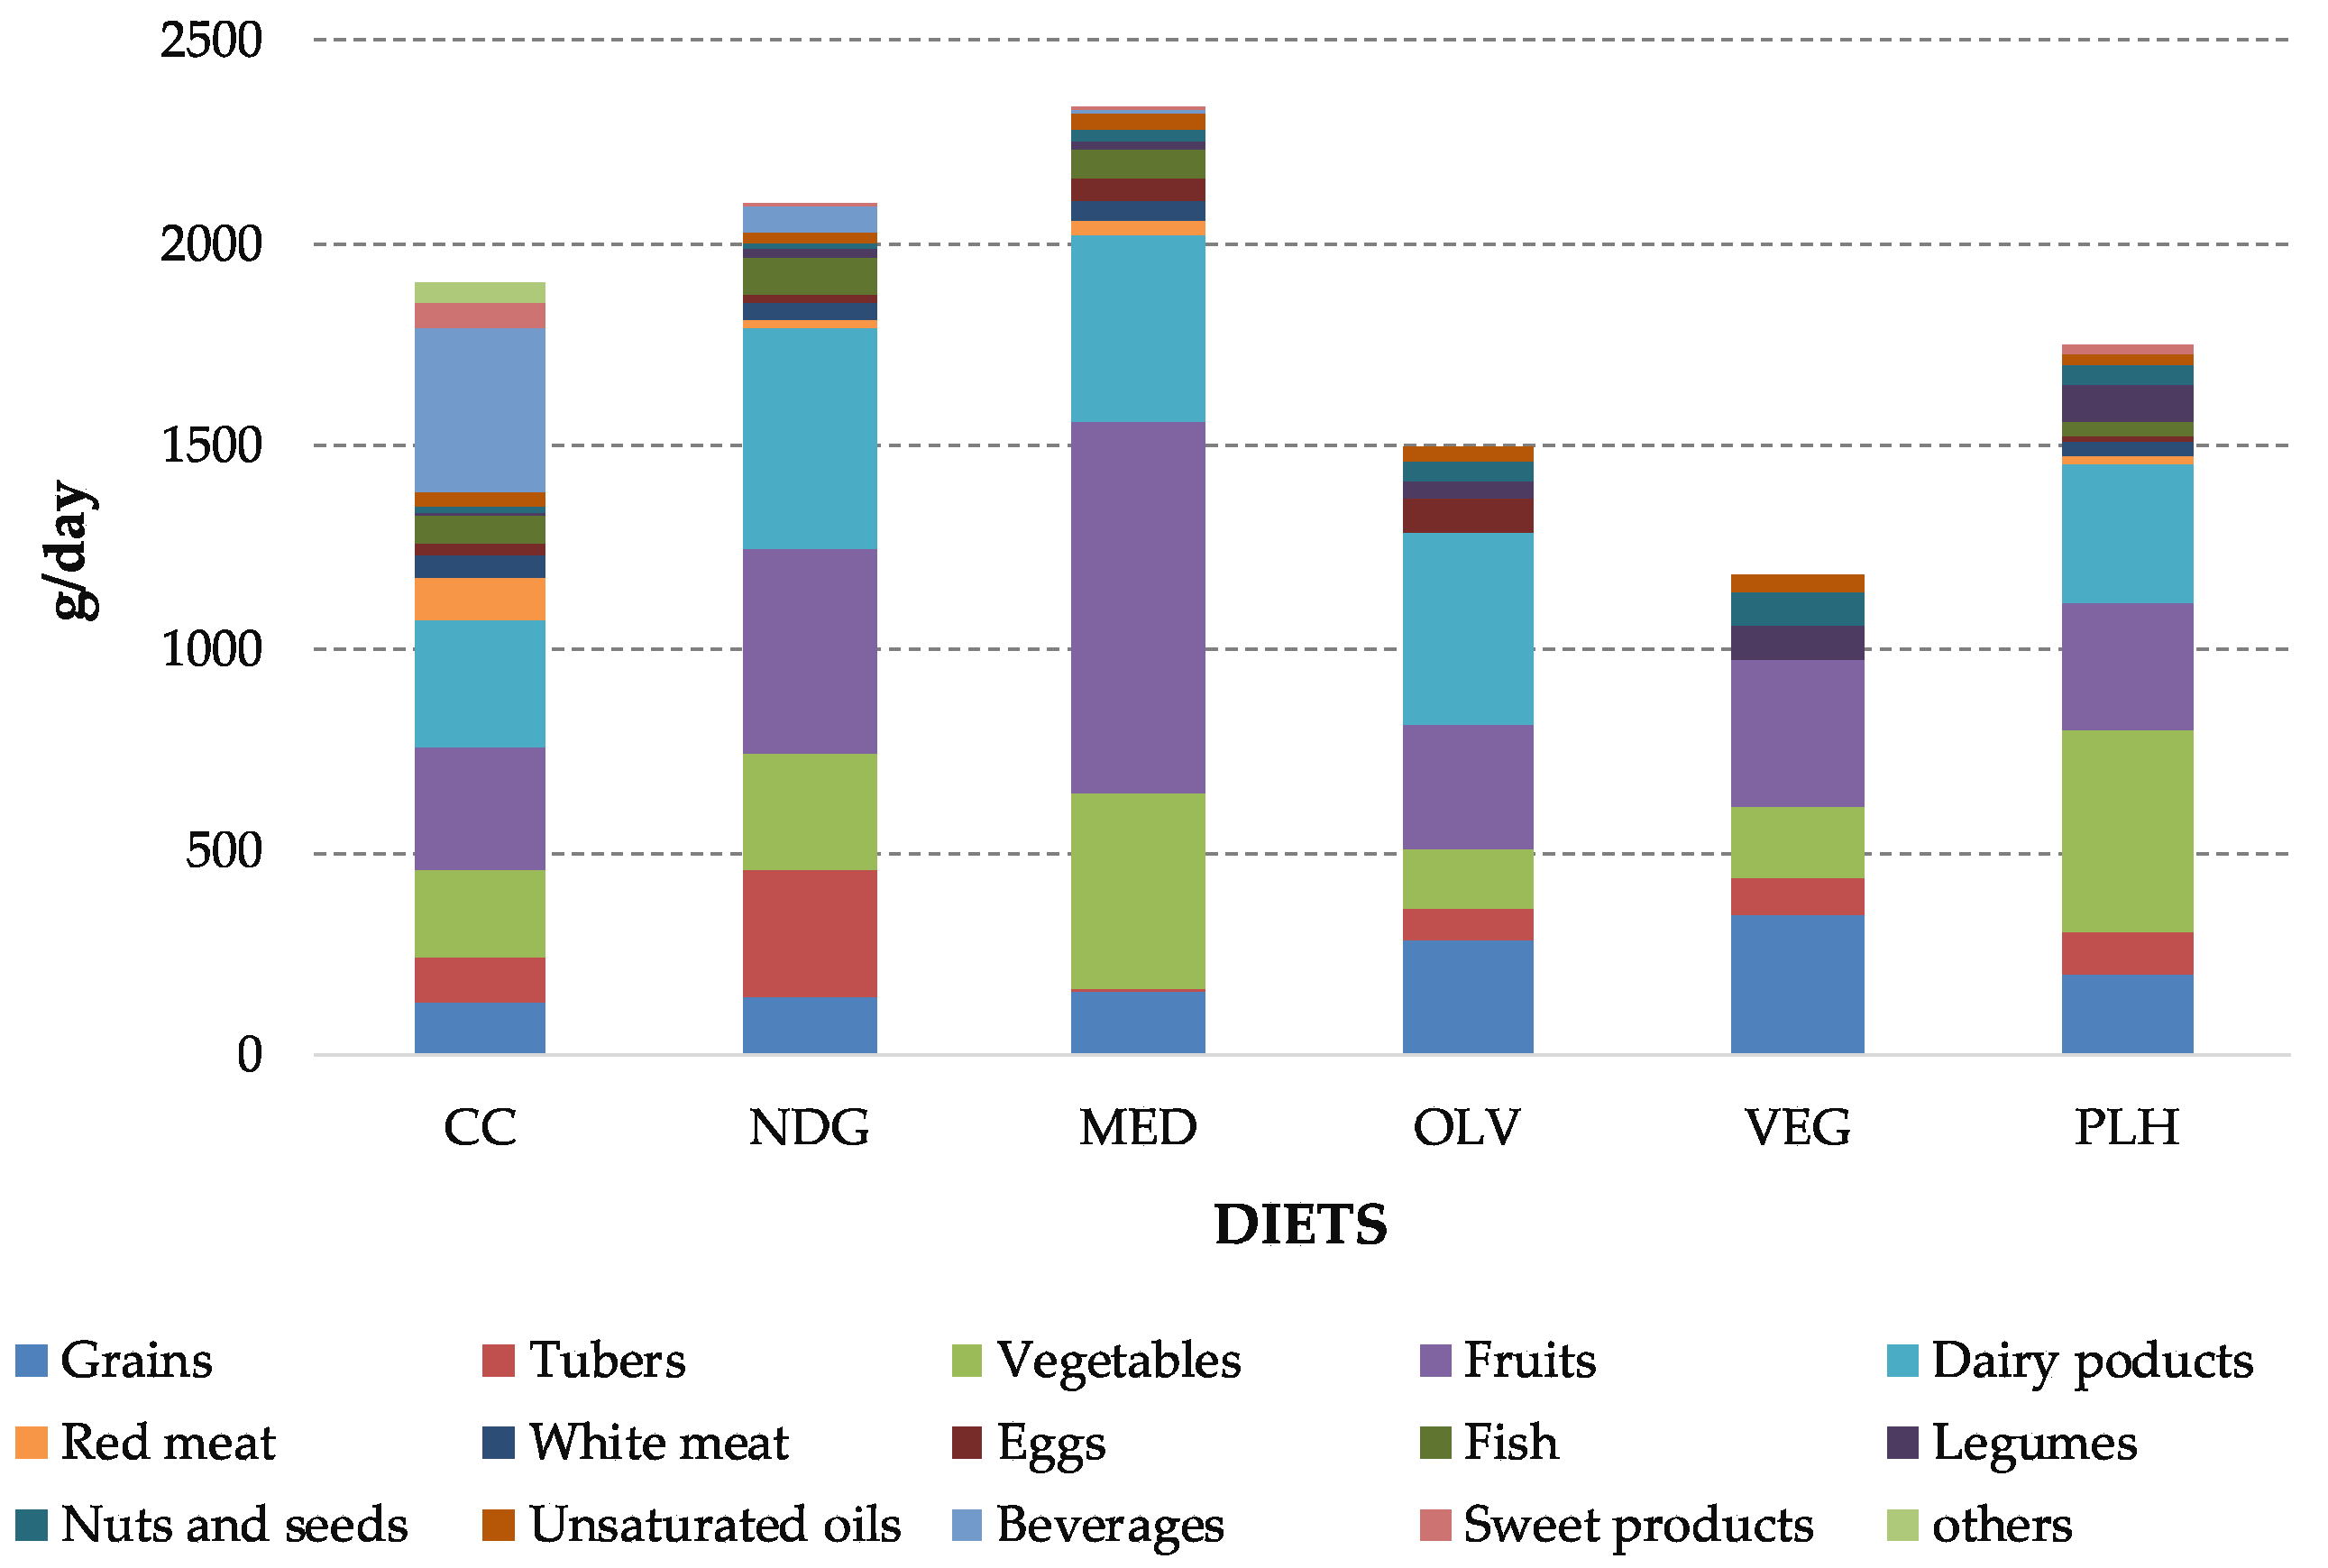
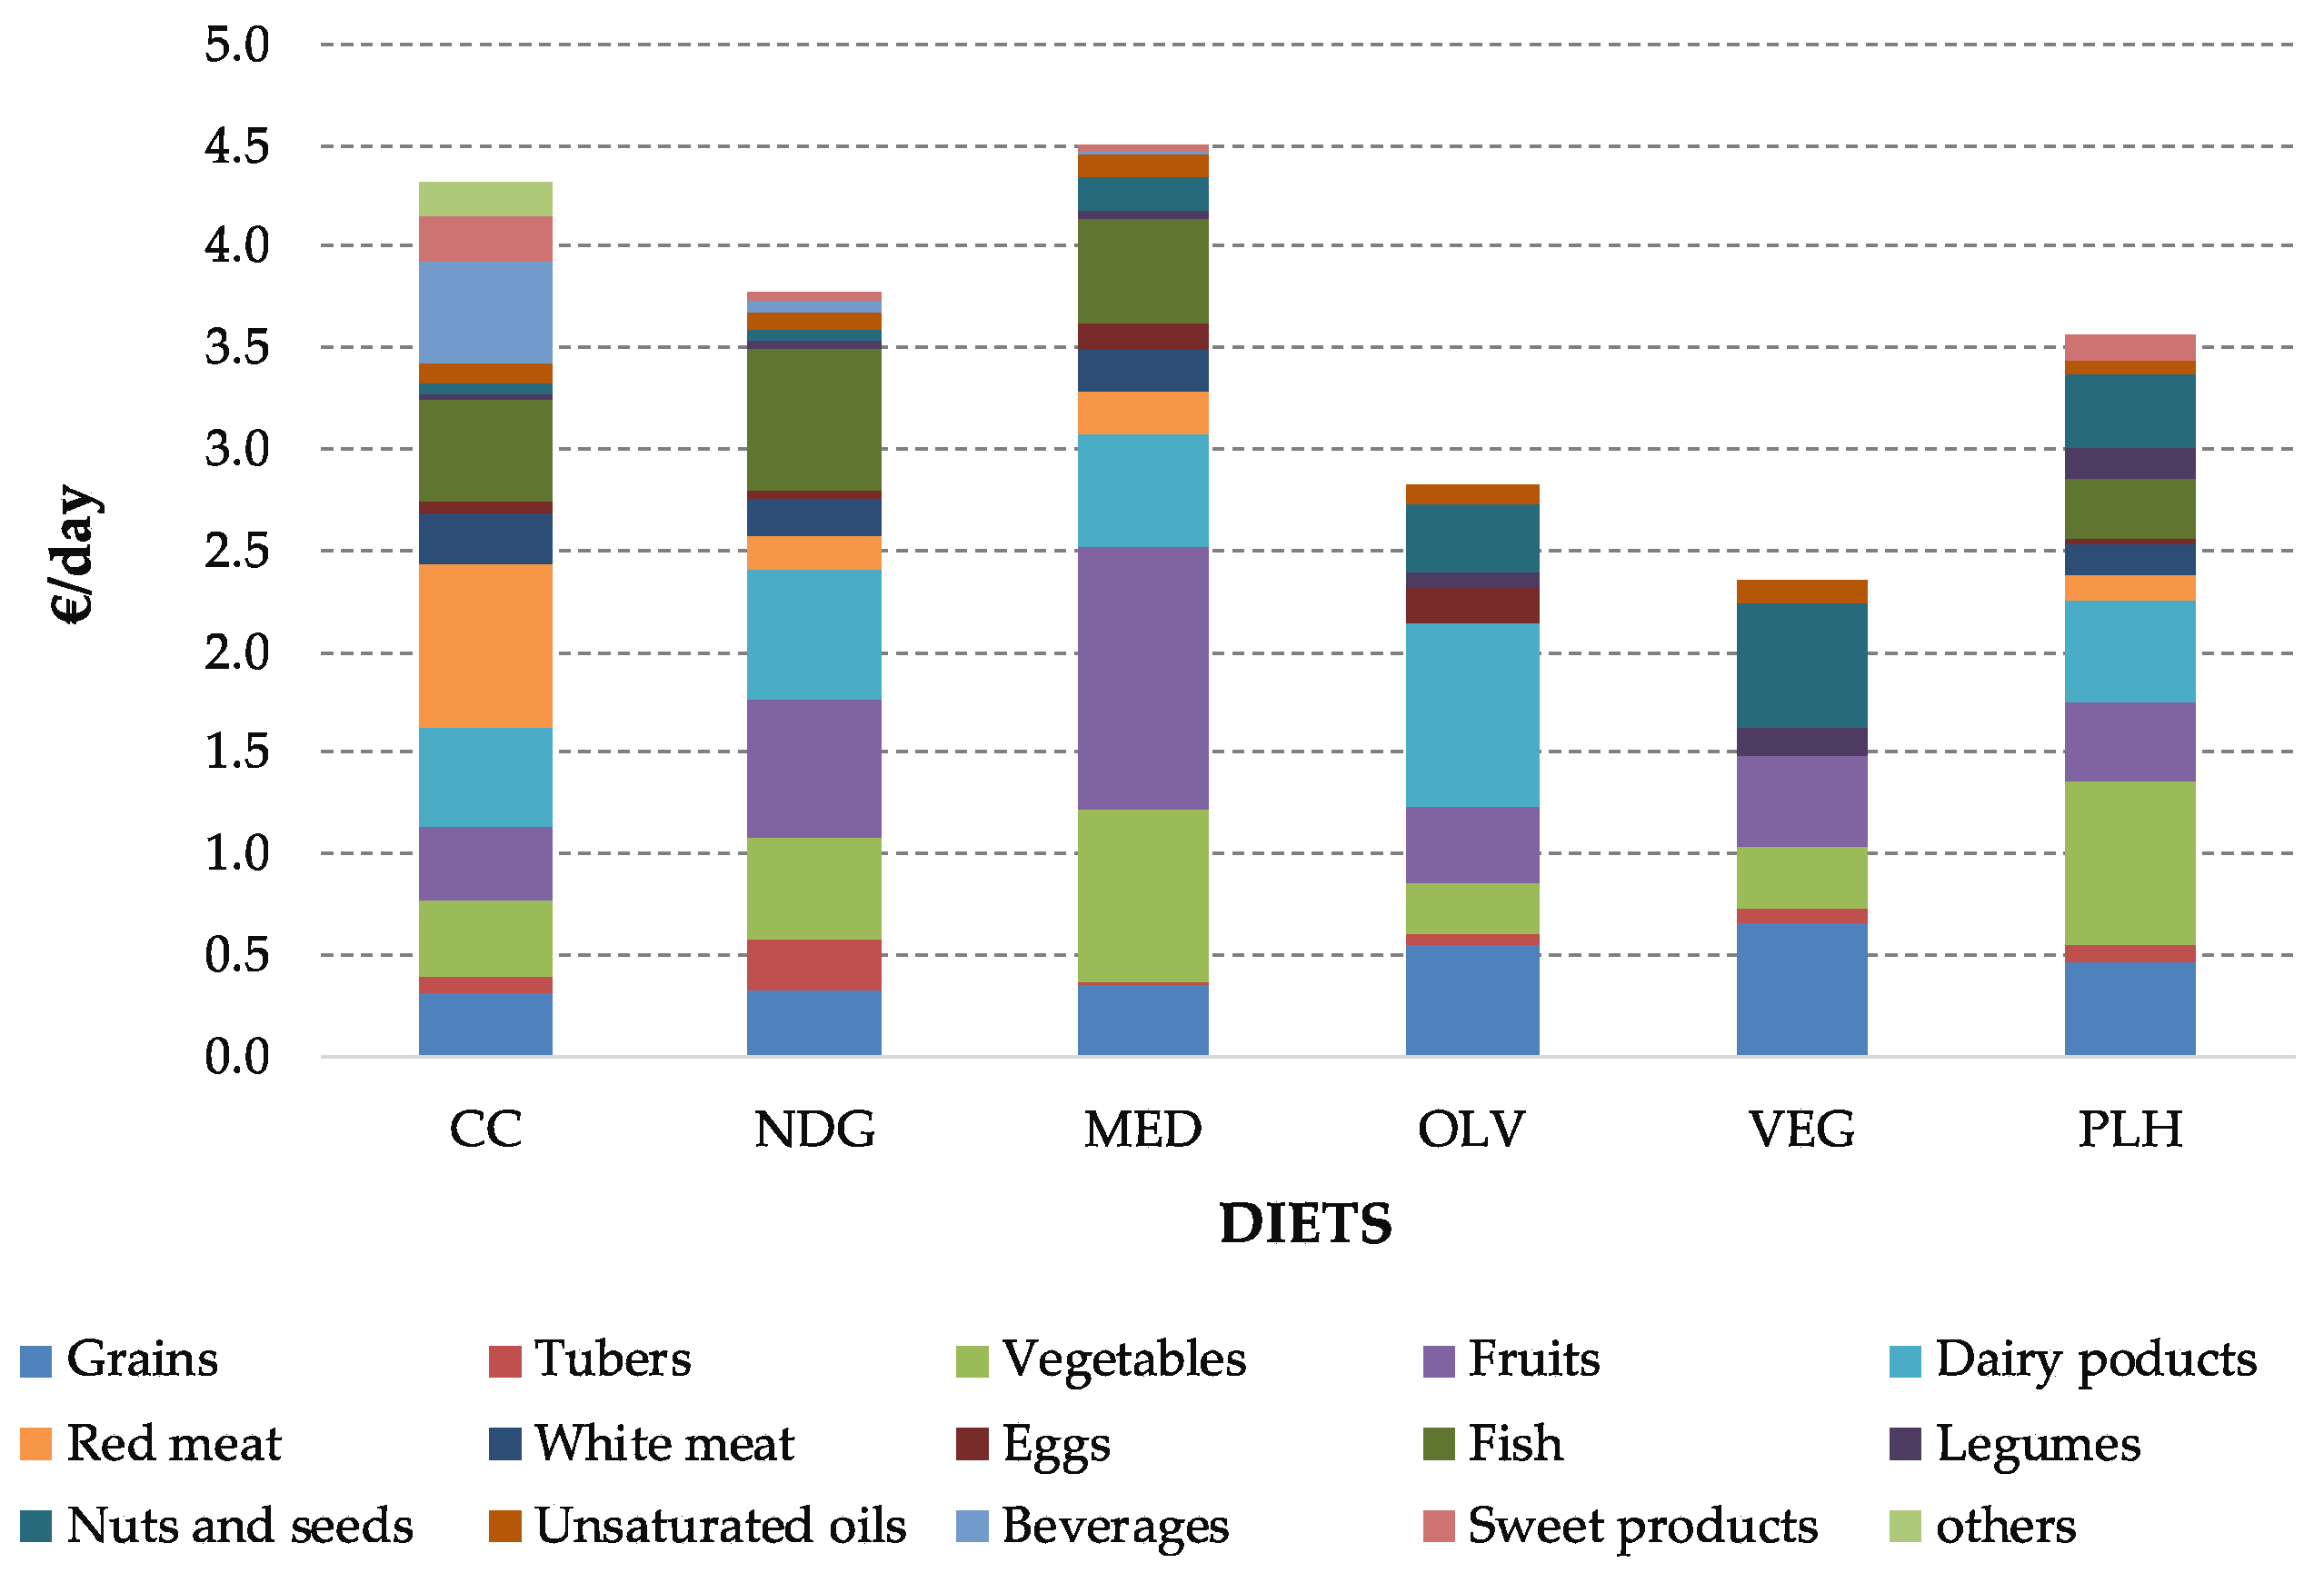
3.1. Food Intake and Sustainable Factors of the Pre-Defined Diets
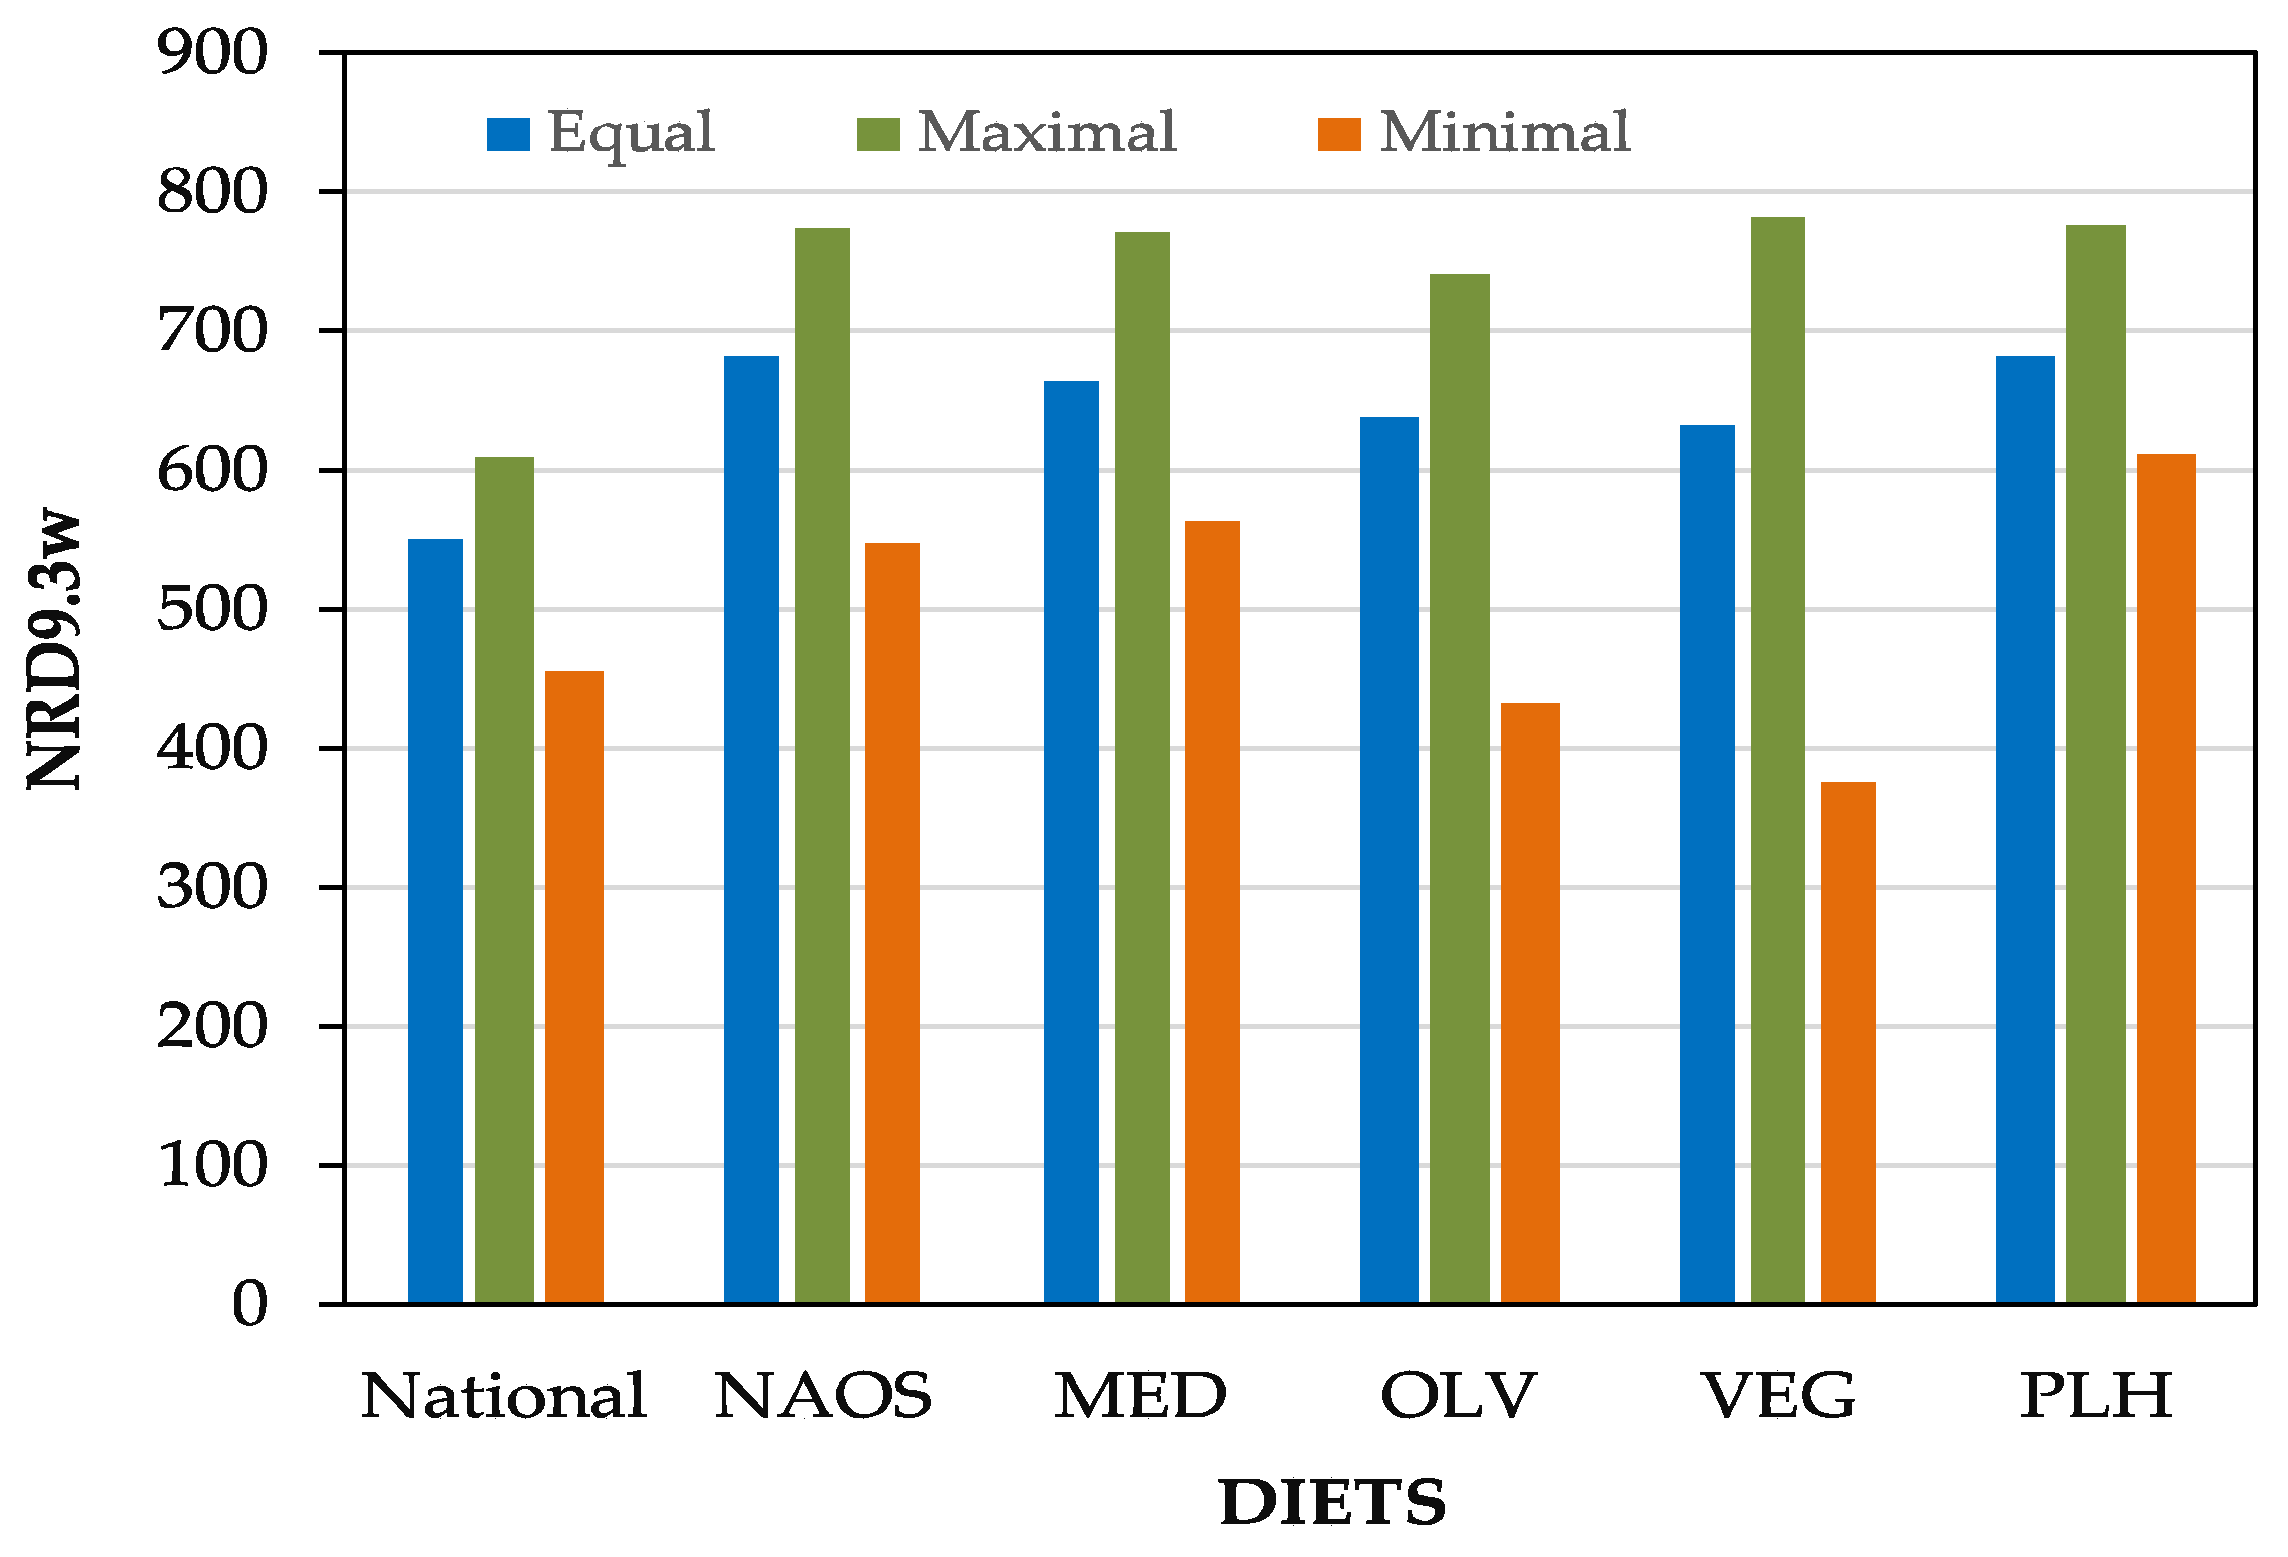
3.2. Detailed Nutritional Analysis of the Pre-Defined Diets
3.3. The Optimal Diet without Acceptability Restrictions
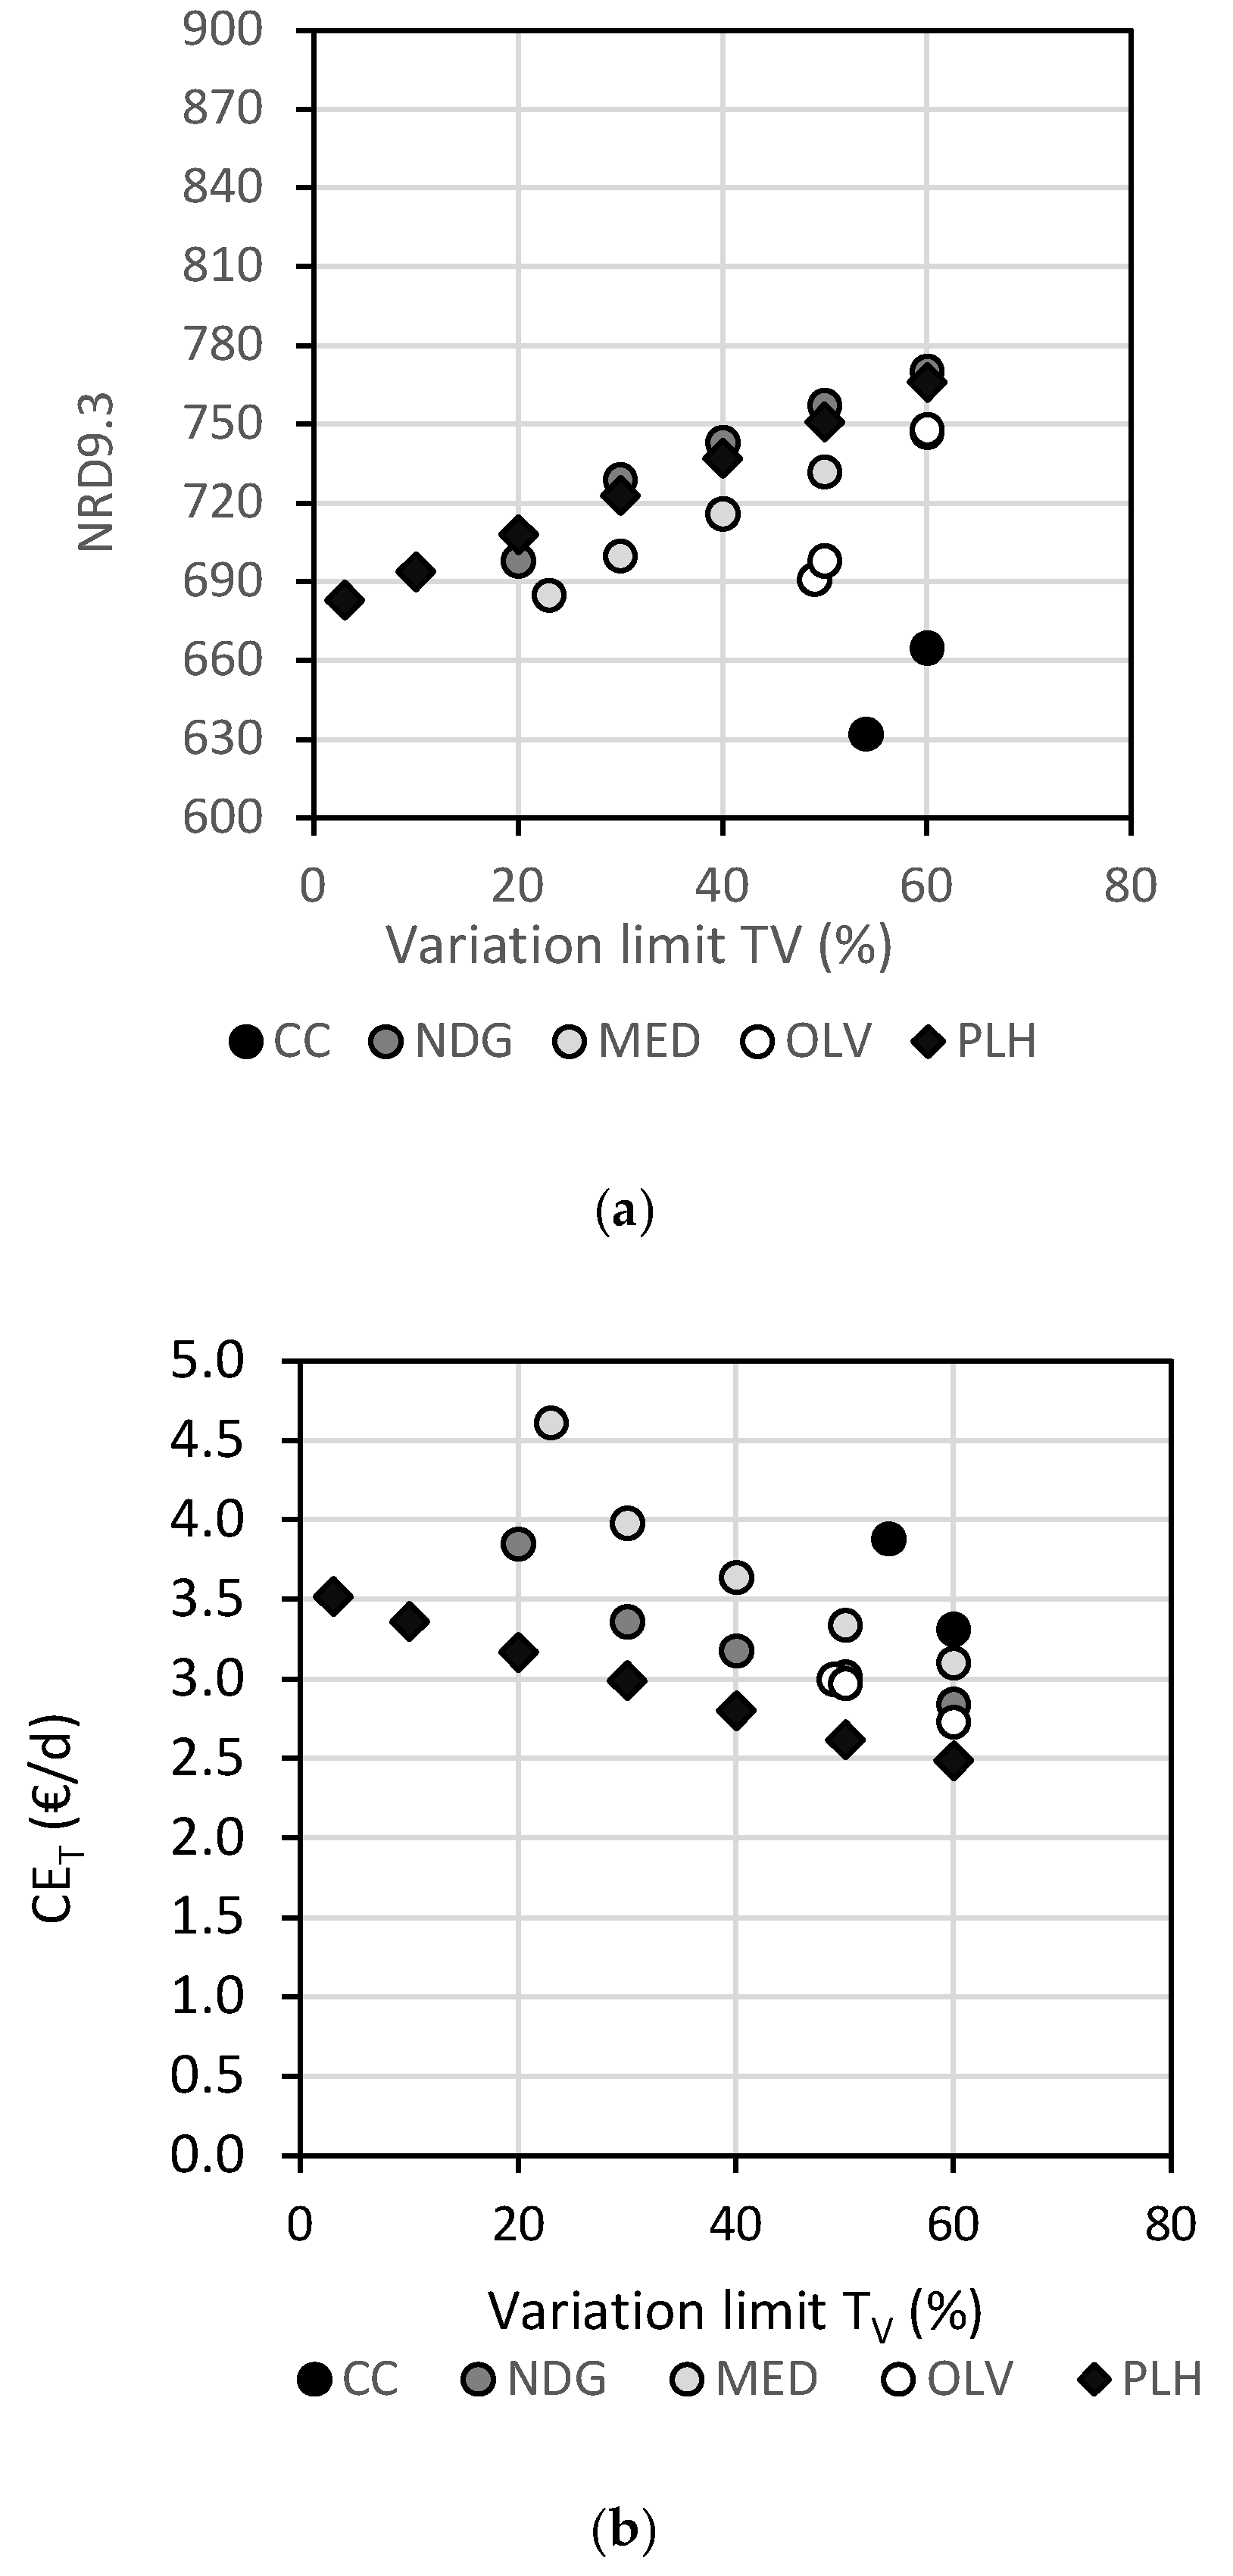
3.4. Optimal Diets with Acceptability Constraints
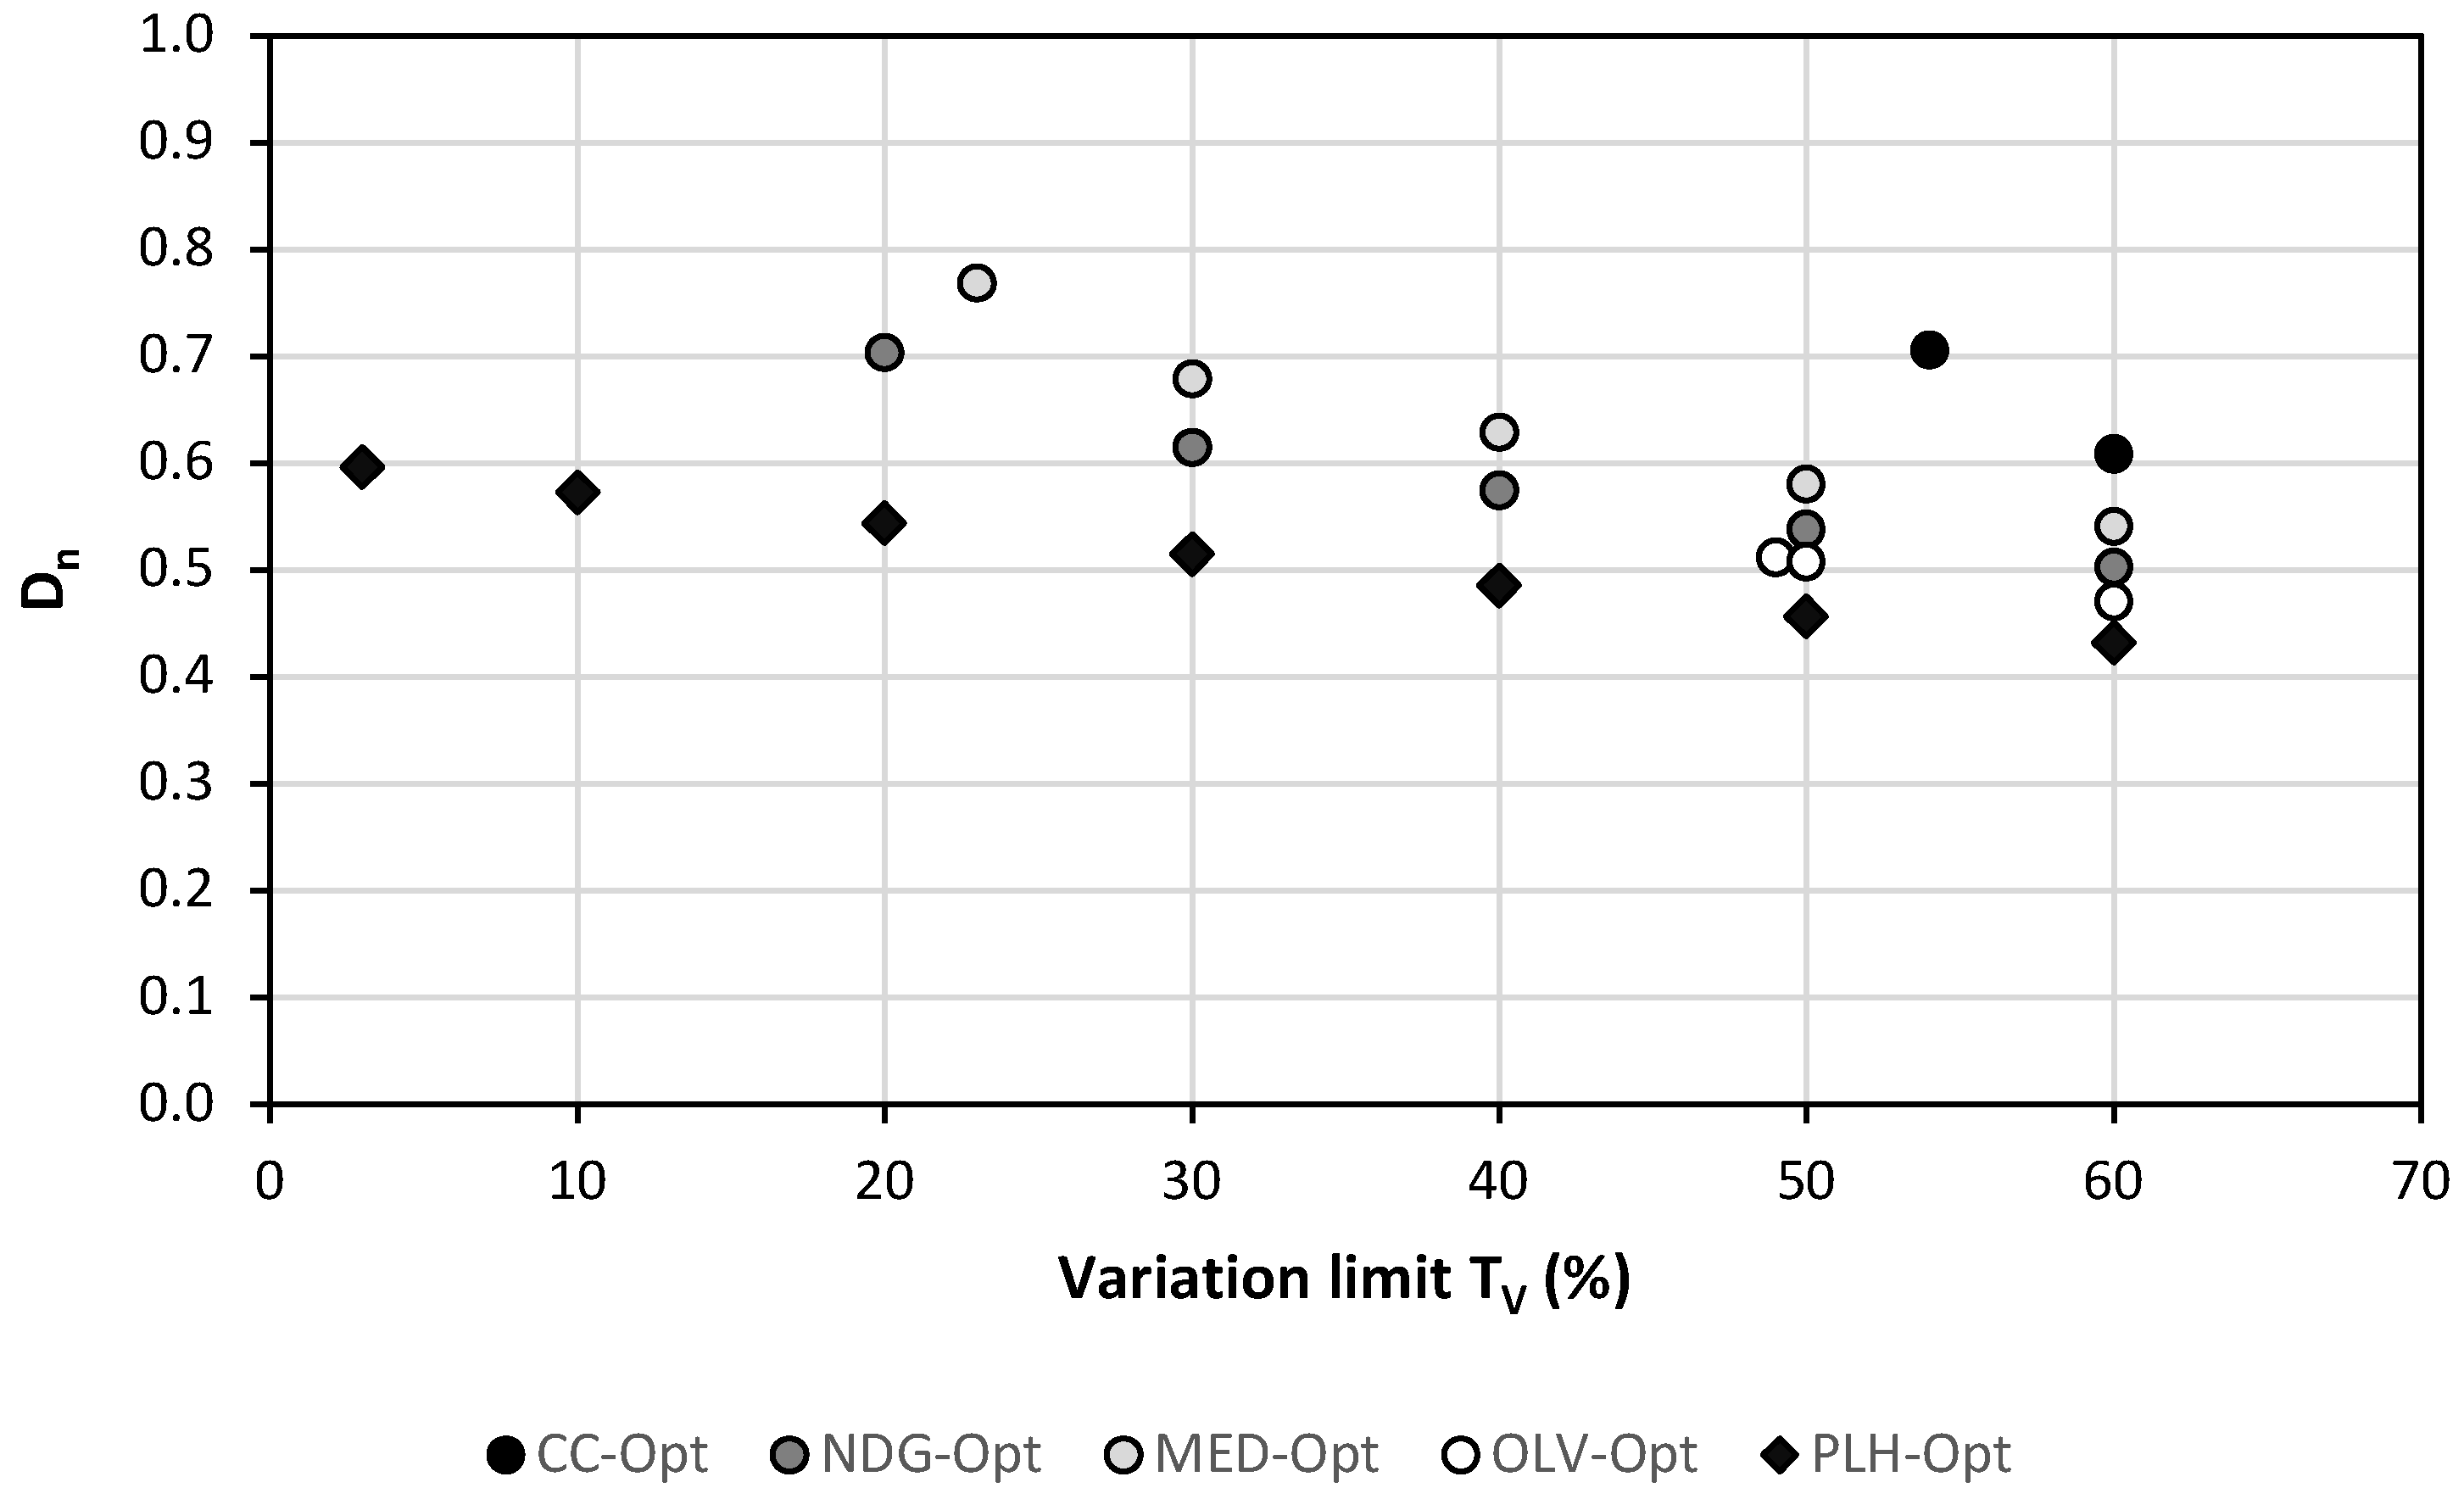
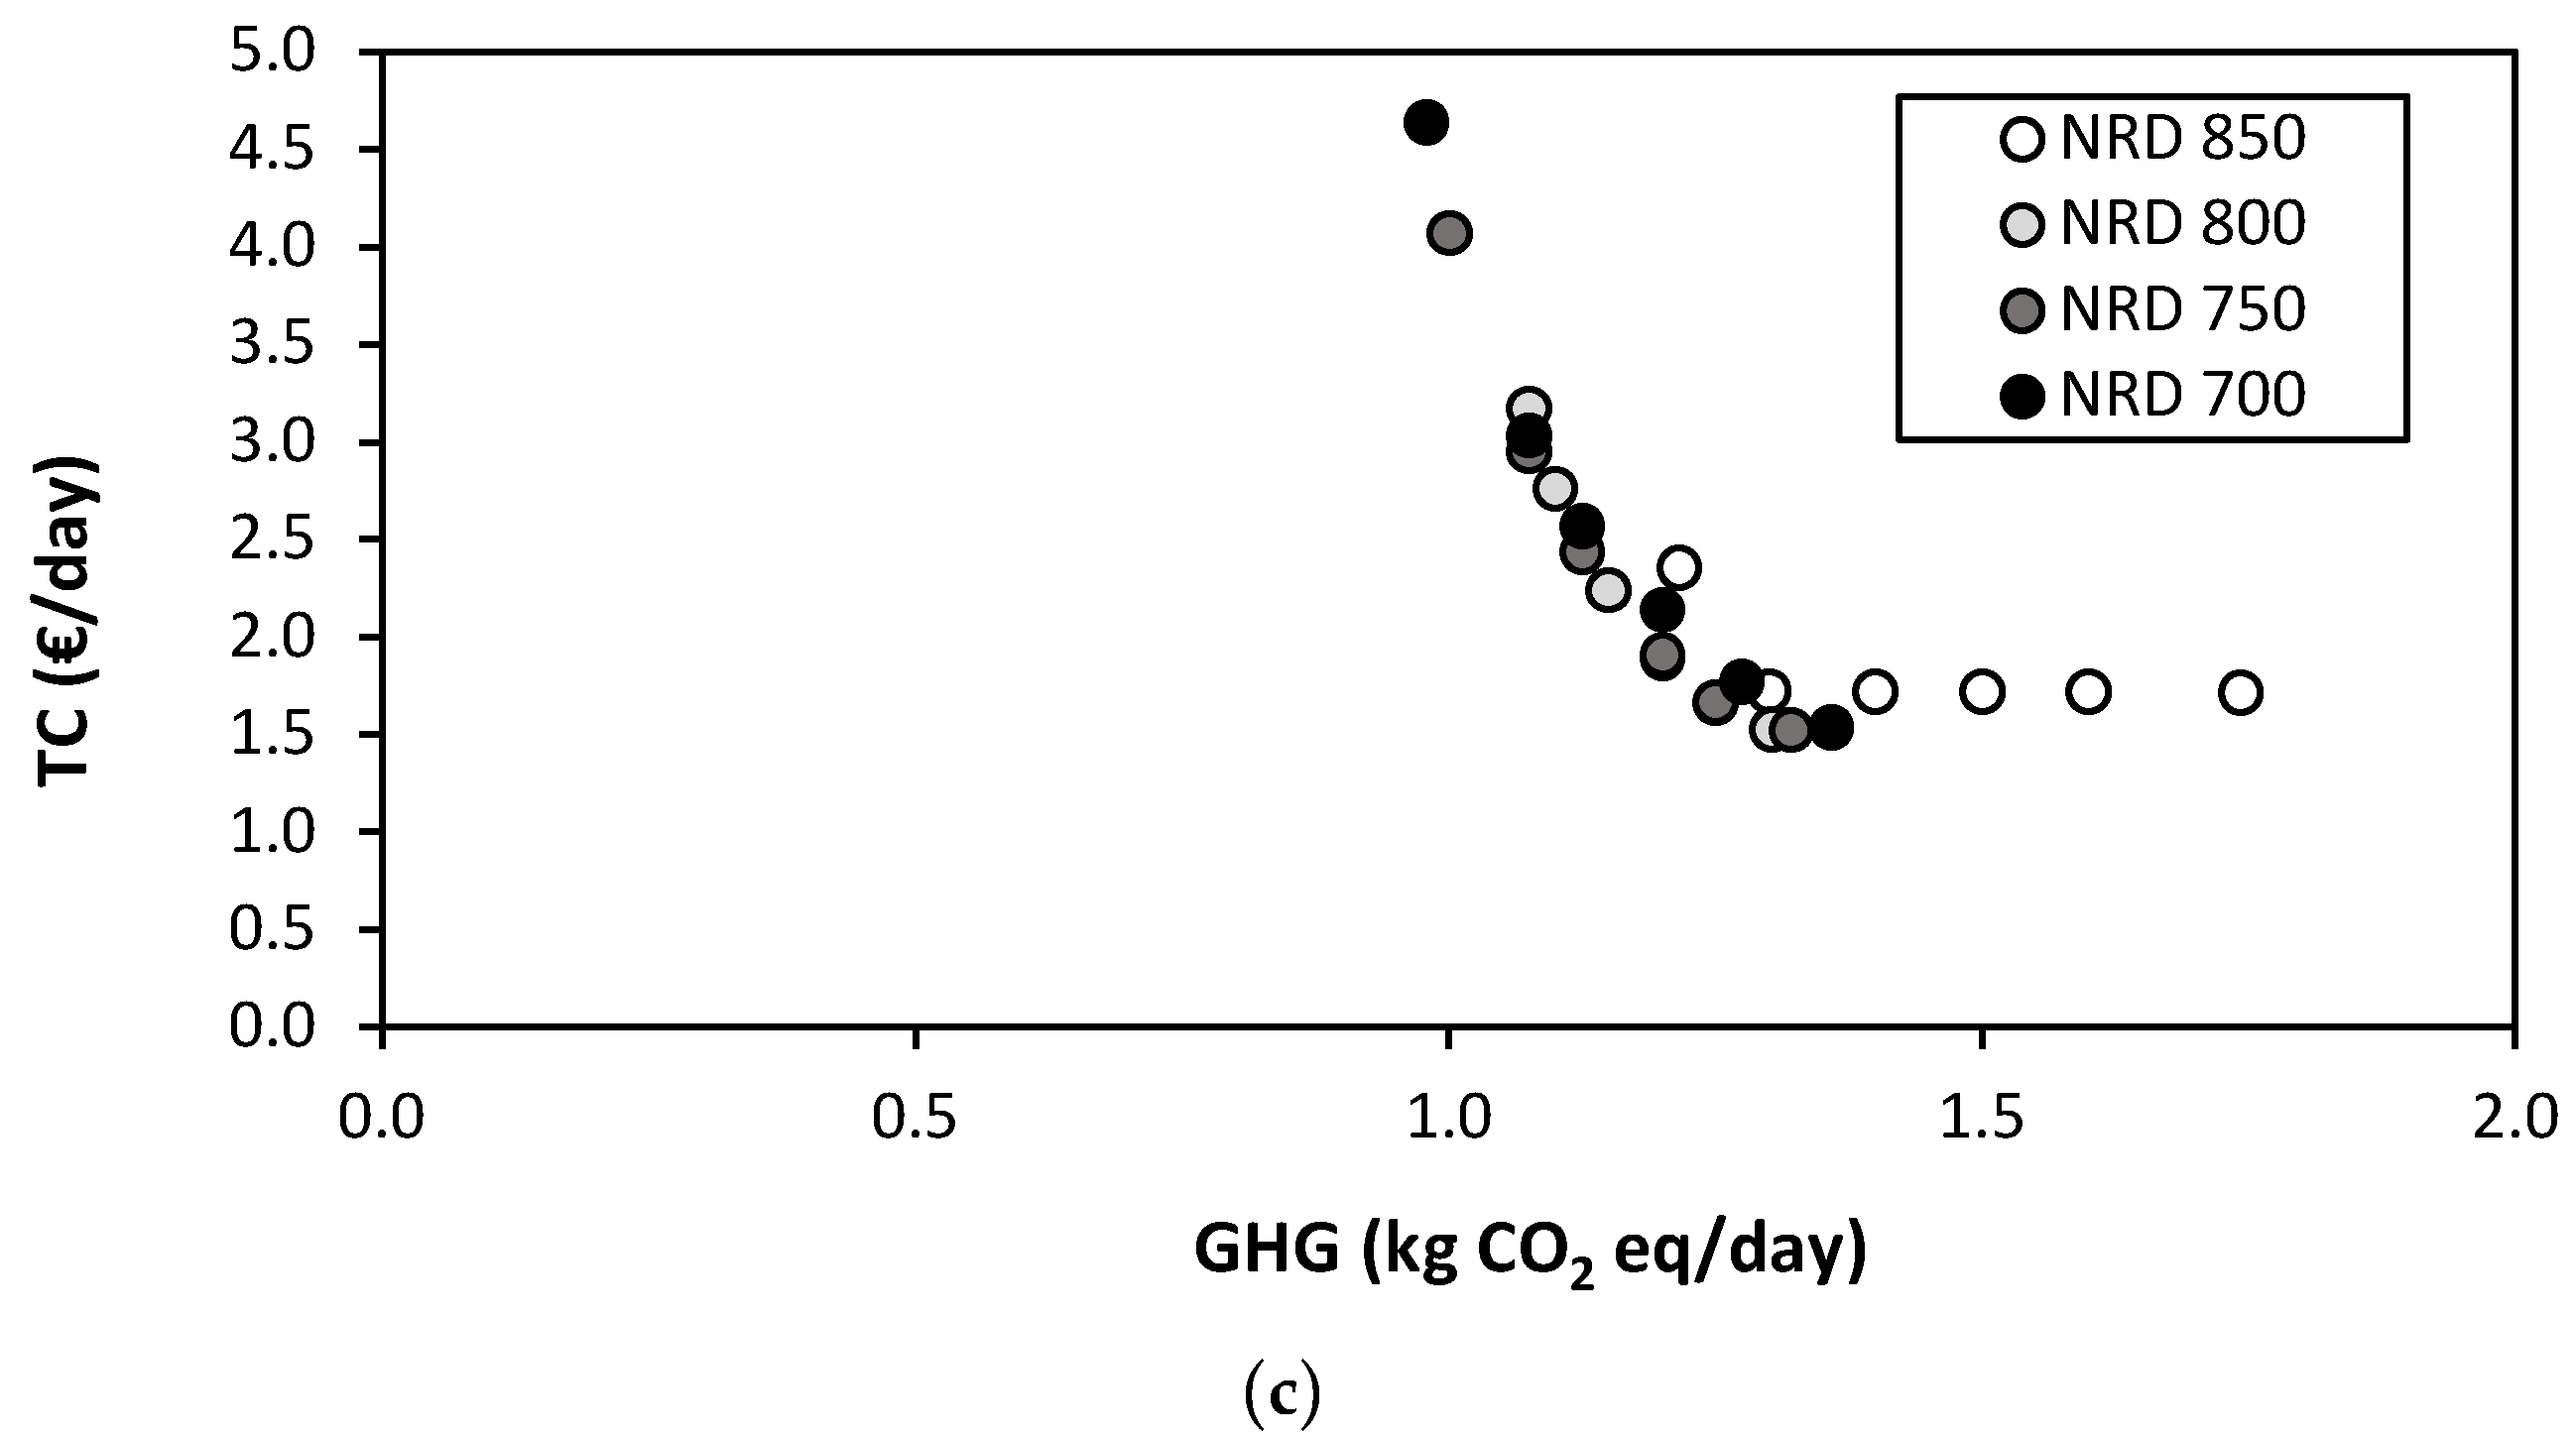
3.4.1. Variability Margins (Tv)
3.4.2. Food Intake of the Optimized Diets and Their Corrected GHG Emissions
4. Discussion and Conclusions
Author Contributions
Funding
Acknowledgments
Conflicts of Interest
Appendix A

| Nutrient | CC | NDG | MED | OLV | VEG | PLH | |
|---|---|---|---|---|---|---|---|
| TNR9 | Proteins | 100.0 | 100.0 | 100.0 | 100.0 | 82.3 | 100.0 |
| Fiber | 93.5 | 100.0 | 100.0 | 100.0 | 100.0 | 100.0 | |
| K | 94.4 | 100.0 | 100.0 | 78.2 | 72.3 | 100.0 | |
| Ca | 91.0 | 100.0 | 100.0 | 100.0 | 35.7 | 100.0 | |
| Fe | 100.0 | 100.0 | 100.0 | 100.0 | 100.0 | 100.0 | |
| Mg | 97.2 | 97.5 | 100.0 | 95.0 | 100.0 | 100.0 | |
| Vitamin A | 100.0 | 89.1 | 100.0 | 100.0 | 64.5 | 100.0 | |
| Vitamin C | 100.0 | 100.0 | 100.0 | 100.0 | 100.0 | 100.0 | |
| Vitamin E | 100.0 | 100.0 | 100.0 | 100.0 | 100.0 | 100.0 | |
| TNL3 | Saturated Fat (SAT) | 135.8 | 107.0 | 120.8 | 128.9 | 58.4 | 102.5 |
| Na | 152.9 | 67.3 | 83.3 | 65.6 | 56.6 | 84.5 | |
| Added sugar | 89.2 | 32.8 | 33.9 | 41.7 | 9.9 | 33.4 | |
| NRD9.3 | 498.1 | 679.4 | 662.0 | 637.0 | 631.8 | 679.6 |
| Product Intakes Gi (g/day) | Minimal Dn (Equally Weighted) | Minimal Dn (Inequally Weighted) |
|---|---|---|
| Canned anchovies | ||
| Milk | 509.8 | 475.8 |
| Rice | ||
| Legumes | 415.0 | 547.2 |
| Sunflower oil | 1.5 | 4.3 |
| Margarine | 54.2 | |
| Potatoes | 39.0 | |
| Other vegetables | 11.5 | 278.6 |
| Citrus fruits | 238.3 | |
| Peaches | ||
| Olives | ||
| Salt |
| Minimal Dn (Equally Weighted) | Minimal Dn (InequallyWeighted) | |
|---|---|---|
| Sustainability factors | ||
| NRD9.3 (−) | 820 | 854 |
| GHG (kg CO2eq./day) | 1.297 | 1.234 |
| TC (€/d) | 1.54 | 1.76 |
| Normalized factors | ||
| XNUTR | 0.911 | 0.949 |
| XENV | 0.288 | 0.274 |
| XEC | 0.349 | 0.399 |
| Dn | 0.266 | 0.133 |
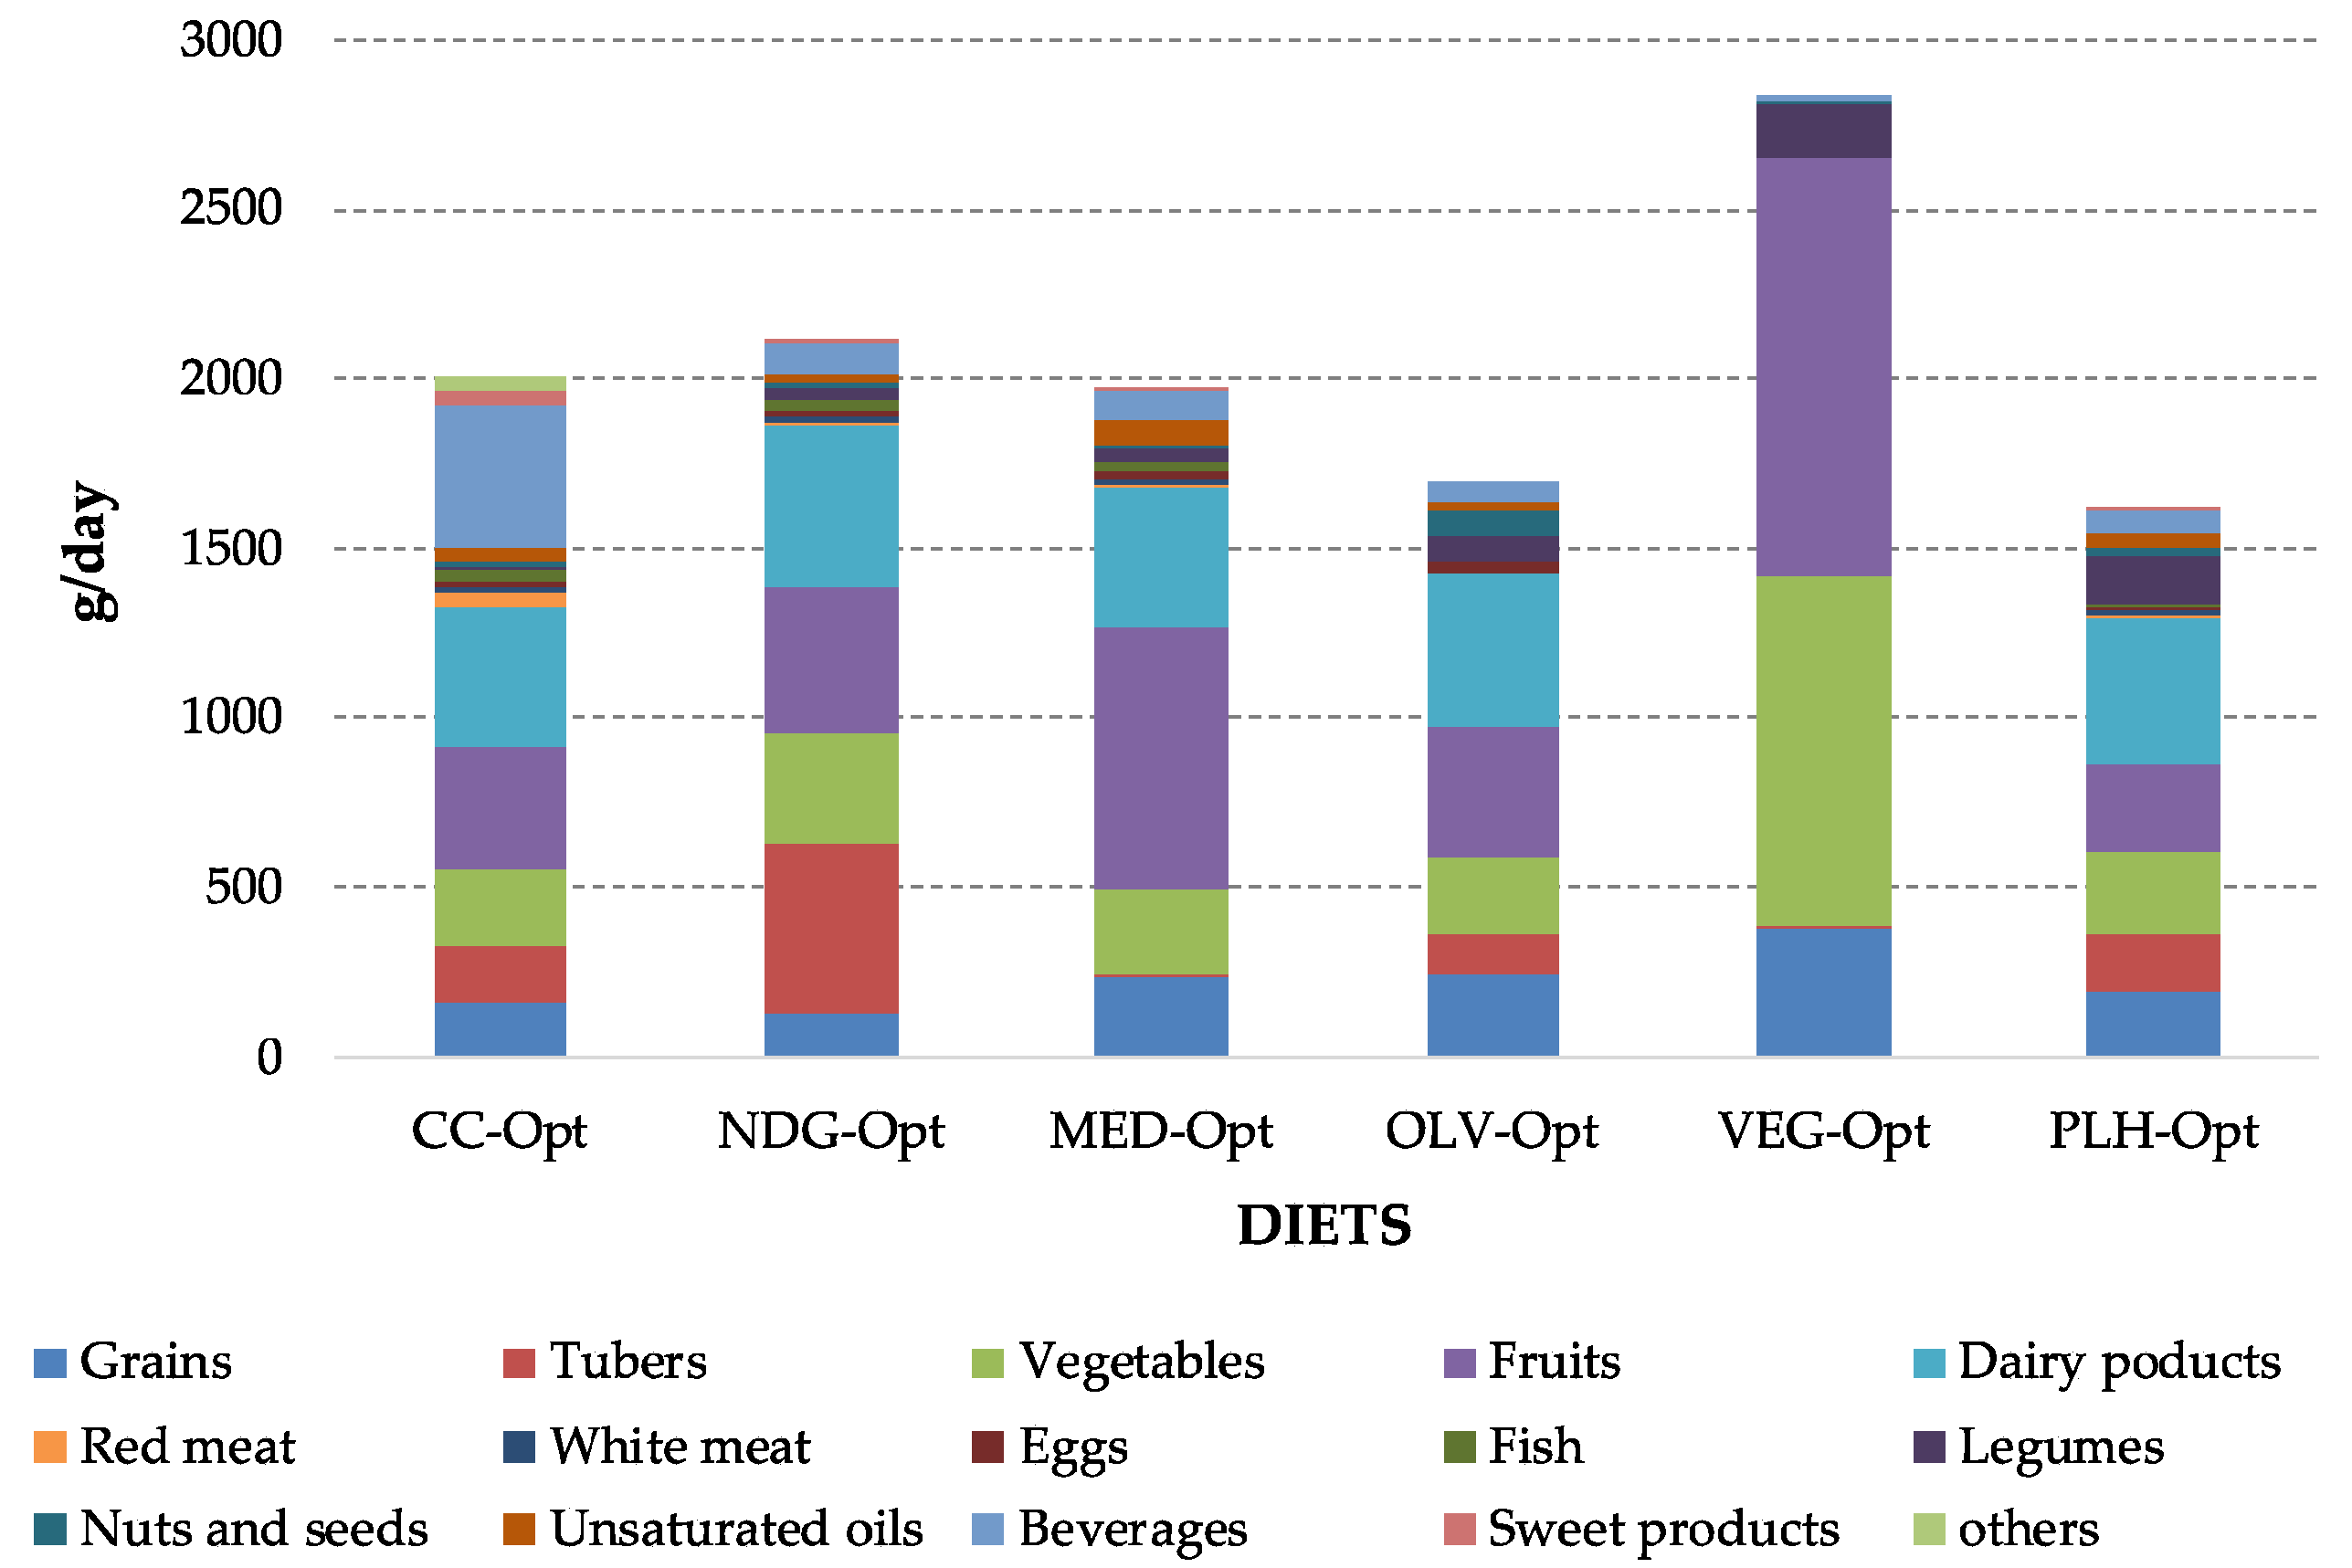
| Food Products Intake (g/day) | Pre-Defined Diets | Optimized Diets (Minimal DN) | ||||||||||
|---|---|---|---|---|---|---|---|---|---|---|---|---|
| CC | NDG | MED | OLV | VEG | PLH | CC-Opt | NDG-Opt | MED-Opt | OLV-Opt | VEG-Opt | PLH-Opt | |
| Eggs | 25.0 | 15.8 | 58.6 | 82.5 | 0.0 | 12.7 | 10.0 | 17.1 | 23.4 | 33.0 | 0.0 | 5.1 |
| Beef | 17.1 | 5.2 | 6.7 | 0.0 | 0.0 | 4.7 | 6.8 | 2.1 | 2.7 | 0.0 | 0.0 | 1.9 |
| Chicken | 55.2 | 41.0 | 45.9 | 0.0 | 0.0 | 33.3 | 22.1 | 16.4 | 18.4 | 0.0 | 0.0 | 13.3 |
| Rabbit | 3.9 | 2.9 | 3.2 | 0.0 | 0.0 | 2.3 | 1.6 | 1.2 | 1.3 | 0.0 | 0.0 | 0.9 |
| Lamb | 5.0 | 1.5 | 2.0 | 0.0 | 0.0 | 1.4 | 2.0 | 0.6 | 0.8 | 0.0 | 0.0 | 0.6 |
| Pork | 31.9 | 11.0 | 14.1 | 0.0 | 0.0 | 4.7 | 12.8 | 4.4 | 5.6 | 0.0 | 0.0 | 1.9 |
| Processed meat | 48.7 | 5.0 | 6.4 | 0.0 | 0.0 | 5.2 | 19.5 | 2.0 | 2.6 | 0.0 | 0.0 | 2.1 |
| Hake | 22.3 | 30.6 | 22.5 | 0.0 | 0.0 | 12.9 | 8.9 | 12.2 | 9.0 | 0.0 | 0.0 | 5.2 |
| Pilchard | 4.7 | 6.4 | 4.7 | 0.0 | 0.0 | 2.7 | 7.5 | 2.6 | 1.9 | 0.0 | 0.0 | 1.1 |
| Tuna | 1.8 | 2.4 | 1.8 | 0.0 | 0.0 | 1.0 | 0.7 | 1.0 | 0.7 | 0.0 | 0.0 | 0.4 |
| Atlantic mackerel | 1.2 | 1.6 | 1.2 | 0.0 | 0.0 | 0.7 | 0.5 | 0.6 | 0.5 | 0.0 | 0.0 | 0.3 |
| Salmon | 4.0 | 5.5 | 4.1 | 0.0 | 0.0 | 2.3 | 1.6 | 2.2 | 1.6 | 0.0 | 0.0 | 0.9 |
| Hake (frozen) | 8.3 | 11.5 | 8.4 | 0.0 | 0.0 | 4.8 | 3.3 | 4.6 | 3.4 | 0.0 | 0.0 | 1.9 |
| Mussels | 5.2 | 7.2 | 5.3 | 0.0 | 0.0 | 3.0 | 2.1 | 2.9 | 2.1 | 0.0 | 0.0 | 1.2 |
| Squid and octopus | 5.0 | 6.9 | 5.1 | 0.0 | 0.0 | 2.9 | 2.0 | 2.8 | 2.0 | 0.0 | 0.0 | 1.2 |
| Prawns and shrimps | 1.6 | 2.2 | 1.6 | 0.0 | 0.0 | 0.9 | 0.6 | 0.9 | 0.6 | 0.0 | 0.0 | 0.4 |
| Squid and octopus (frozen) | 2.6 | 2.8 | 2.1 | 0.0 | 0.0 | 1.2 | 1.0 | 1.1 | 0.8 | 0.0 | 0.0 | 0.5 |
| Prawns and shrimps (frozen) | 6.1 | 9.1 | 6.7 | 0.0 | 0.0 | 3.8 | 2.4 | 3.6 | 2.7 | 0.0 | 0.0 | 1.5 |
| Tuna | 5.6 | 7.7 | 5.6 | 0.0 | 0.0 | 3.2 | 2.2 | 3.1 | 2.2 | 0.0 | 0.0 | 1.3 |
| Mussels | 0.7 | 0.9 | 0.7 | 0.0 | 0.0 | 0.4 | 0.3 | 0.4 | 0.3 | 0.0 | 0.0 | 0.2 |
| Anchovies | 0.9 | 1.2 | 0.9 | 0.0 | 0.0 | 0.5 | 0.4 | 0.5 | 0.4 | 0.0 | 0.0 | 0.2 |
| Milk | 214.1 | 422.3 | 362.0 | 216.8 | 0.0 | 247.2 | 342.6 | 424.7 | 366.5 | 346.9 | 0.0 | 394.2 |
| Shakes | 10.6 | 0.0 | 0.0 | 0.0 | 0.0 | 0.0 | 17.0 | 0.0 | 0.0 | 0.0 | 0.0 | 0.0 |
| Ice cream | 9.6 | 0.0 | 0.0 | 0.0 | 0.0 | 0.0 | 3.8 | 0.0 | 0.0 | 0.0 | 0.0 | 0.0 |
| Yoghurt | 60.5 | 109.0 | 89.1 | 225.8 | 0.0 | 69.8 | 24.2 | 43.6 | 35.6 | 90.3 | 0.0 | 27.9 |
| Butter | 0.9 | 0.0 | 0.0 | 0.0 | 0.0 | 0.0 | 0.4 | 0.0 | 0.0 | 0.0 | 0.0 | 0.0 |
| Fresh cheese | 14.5 | 10.9 | 9.0 | 22.7 | 0.0 | 16.8 | 15.7 | 4.4 | 3.6 | 9.1 | 0.0 | 6.7 |
| Semi-hard cheese | 7.0 | 3.3 | 4.3 | 11.0 | 0.0 | 8.1 | 2.8 | 1.3 | 1.7 | 4.4 | 0.0 | 3.2 |
| Hard cheese | 1.6 | 0.7 | 1.0 | 2.4 | 0.0 | 1.8 | 2.6 | 0.3 | 0.4 | 1.0 | 0.0 | 0.7 |
| Bread | 103.3 | 111.3 | 133.6 | 109.7 | 132.2 | 162.5 | 114.0 | 113.5 | 213.8 | 175.5 | 358.7 | 177.6 |
| Rice | 11.4 | 16.1 | 11.2 | 87.8 | 105.7 | 18.0 | 18.2 | 6.4 | 17.9 | 35.1 | 10.6 | 7.2 |
| Pasta | 12.0 | 15.5 | 10.4 | 87.8 | 105.7 | 18.9 | 19.2 | 6.2 | 4.2 | 35.1 | 10.6 | 7.6 |
| Biscuits | 35.6 | 5.0 | 6.4 | 0.0 | 0.0 | 18.5 | 14.2 | 2.0 | 2.6 | 0.0 | 0.0 | 7.4 |
| Cereals | 4.9 | 0.7 | 0.9 | 0.0 | 0.0 | 2.5 | 7.8 | 0.3 | 0.4 | 0.0 | 0.0 | 1.0 |
| Tablet | 4.4 | 0.6 | 0.8 | 0.0 | 0.0 | 2.3 | 1.8 | 0.2 | 0.3 | 0.0 | 0.0 | 0.9 |
| Snack choco | 1.7 | 0.2 | 0.3 | 0.0 | 0.0 | 0.9 | 0.7 | 0.1 | 0.1 | 0.0 | 0.0 | 0.4 |
| Cacao powder | 4.6 | 0.6 | 0.8 | 0.0 | 0.0 | 2.4 | 7.4 | 1.0 | 1.3 | 0.0 | 0.0 | 1.0 |
| Sugar | 11.9 | 0.0 | 0.0 | 0.0 | 0.0 | 0.0 | 19.0 | 0.0 | 0.0 | 0.0 | 0.0 | 0.0 |
| Legumes | 9.3 | 20.8 | 21.4 | 45.2 | 81.6 | 85.9 | 14.9 | 33.3 | 34.2 | 72.3 | 155.4 | 137.4 |
| Olive oil | 25.2 | 22.5 | 28.9 | 31.0 | 37.3 | 17.4 | 21.0 | 9.0 | 46.2 | 27.1 | 3.7 | 27.8 |
| Sunflower oil | 12.1 | 10.8 | 13.9 | 0.0 | 0.0 | 8.4 | 19.4 | 17.3 | 22.2 | 0.0 | 0.0 | 13.4 |
| Margarine | 2.1 | 0.0 | 0.0 | 0.0 | 0.0 | 0.0 | 0.8 | 0.0 | 0.0 | 0.0 | 0.0 | 0.0 |
| Potatoes | 107.4 | 316.8 | 7.4 | 75.2 | 90.6 | 104.8 | 171.8 | 506.9 | 11.8 | 120.3 | 9.1 | 167.7 |
| Tomatoe | 41.4 | 153.8 | 264.4 | 30.9 | 37.2 | 105.1 | 16.6 | 246.1 | 162.0 | 49.4 | 30.2 | 48.2 |
| Lettuce | 12.5 | 103.1 | 177.2 | 13.3 | 16.0 | 31.7 | 5.0 | 41.2 | 70.9 | 5.3 | 110.7 | 14.6 |
| Others | 123.5 | 25.0 | 43.1 | 105.4 | 127.0 | 359.0 | 188.3 | 40.0 | 17.7 | 167.4 | 889.0 | 180.8 |
| Citric | 135.7 | 149.7 | 264.0 | 136.5 | 164.4 | 142.0 | 217.1 | 239.5 | 422.4 | 218.4 | 1150.8 | 190.6 |
| Bananas | 55.1 | 164.5 | 290.2 | 55.4 | 66.7 | 57.6 | 88.2 | 109.9 | 202.9 | 88.6 | 6.7 | 23.0 |
| Apples | 77.9 | 66.8 | 117.8 | 78.4 | 94.4 | 81.5 | 31.2 | 26.7 | 47.1 | 31.4 | 9.4 | 32.6 |
| Peach | 24.3 | 94.5 | 166.7 | 24.4 | 29.4 | 25.4 | 9.7 | 37.8 | 66.7 | 39.0 | 2.9 | 10.2 |
| Olives | 7.5 | 27.5 | 74.3 | 7.5 | 9.1 | 7.8 | 12.0 | 11.0 | 29.7 | 12.0 | 63.7 | 3.1 |
| Nuts | 8.5 | 8.5 | 22.9 | 47.2 | 85.3 | 52.4 | 13.6 | 13.6 | 15.3 | 75.5 | 8.5 | 28.4 |
| Tomato products | 38.8 | 0.0 | 0.0 | 0.0 | 0.0 | 0.0 | 15.5 | 0.0 | 0.0 | 0.0 | 0.0 | 0.0 |
| Gazpacho | 13.8 | 0.0 | 0.0 | 0.0 | 0.0 | 0.0 | 5.5 | 0.0 | 0.0 | 0.0 | 0.0 | 0.0 |
| Fabada | 24.5 | 0.0 | 0.0 | 0.0 | 0.0 | 0.0 | 28.6 | 0.0 | 0.0 | 0.0 | 0.0 | 0.0 |
| Ketchup | 8.0 | 0.0 | 0.0 | 0.0 | 0.0 | 0.0 | 3.2 | 0.0 | 0.0 | 0.0 | 0.0 | 0.0 |
| Coffee | 6.0 | 0.0 | 0.0 | 0.0 | 0.0 | 0.0 | 2.4 | 0.0 | 0.0 | 0.0 | 0.0 | 0.0 |
| Wine | 32.5 | 5.0 | 1.3 | 0.0 | 0.0 | 0.0 | 13.0 | 2.0 | 0.5 | 0.0 | 0.0 | 0.0 |
| Beer | 53.9 | 9.6 | 7.1 | 0.0 | 0.0 | 0.0 | 86.2 | 3.8 | 2.8 | 0.0 | 0.0 | 0.0 |
| Water | 29.6 | 9.4 | 0.0 | 0.0 | 0.0 | 0.0 | 62.0 | 62.0 | 62.0 | 62.0 | 0.0 | 0.0 |
| Juice | 155.0 | 0.0 | 0.0 | 0.0 | 0.0 | 0.0 | 47.4 | 3.8 | 0.0 | 0.0 | 15.5 | 62.0 |
| Soft drinks | 130.3 | 38.2 | 0.0 | 0.0 | 0.0 | 0.0 | 208.5 | 15.3 | 24.5 | 0.0 | 0.0 | 0.0 |
| Salt | 3.4 | 0.0 | 0.0 | 0.0 | 0.0 | 0.0 | 1.4 | 0.0 | 0.0 | 0.0 | 0.0 | 0.0 |
| TOTAL | 1904.0 | 2101.0 | 2337.8 | 1496.6 | 1182.7 | 1753.3 | 2003.0 | 2105.3 | 1970.4 | 1699.3 | 2835.6 | 1617.4 |


References
- Willett, W.; Rockström, J.; Loken, B.; Springmann, M.; Lang, T.; Vermeulen, S.; Garnett, T.; Tilman, D.; Declerck, F.; Wood, A.; et al. Food in the Anthropocene: The EAT–Lancet Commission on healthy diets from sustainable food systems. Lancet 2019, 393, 447–492. [Google Scholar] [CrossRef]
- Tilman, D.; Clark, M. Global diets link environmental sustainability and human health. Nat. Cell Biol. 2014, 515, 518–522. [Google Scholar] [CrossRef] [PubMed]
- Arrieta, E.; González, A.D. Impact of current, National Dietary Guidelines and alternative diets on greenhouse gas emissions in Argentina. Food Policy 2018, 79, 58–66. [Google Scholar] [CrossRef]
- Batlle-Bayer, L.; Bala, A.; García-Herrero, I.; Lemaire, E.; Song, G.; Aldaco, R.; Fullana-I-Palmer, P. The Spanish Dietary Guidelines: A potential tool to reduce greenhouse gas emissions of current dietary patterns. J. Clean. Prod. 2019, 213, 588–598. [Google Scholar] [CrossRef]
- Behrens, P.; Jong, J.C.K.-D.; Bosker, T.; Rodrigues, J.F.D.; De Koning, A.; Tukker, A. Evaluating the environmental impacts of dietary recommendations. Proc. Natl. Acad. Sci. USA 2017, 114, 13412–13417. [Google Scholar] [CrossRef] [PubMed]
- Song, G.; Gao, X.; Fullana-I-Palmer, P.; Lv, D.; Zhu, Z.; Wang, Y.; Bayer, L.B. Shift from feeding to sustainably nourishing urban China: A crossing-disciplinary methodology for global environment-food-health nexus. Sci. Total. Environ. 2019, 647, 716–724. [Google Scholar] [CrossRef]
- Hallström, E.; Carlsson-Kanyama, A.; Börjesson, P. Environmental impact of dietary change: A systematic review. J. Clean. Prod. 2015, 91, 1–11. [Google Scholar] [CrossRef]
- Batlle-Bayer, L.; Aldaco, R.; Bala, A.; Fullana-I-Palmer, P. Toward sustainable dietary patterns under a water–energy–food nexus life cycle thinking approach. Curr. Opin. Environ. Sci. Health 2020, 13, 61–67. [Google Scholar] [CrossRef]
- Springmann, M.; Spajic, L.; A Clark, M.; Poore, J.; Herforth, A.; Webb, P.; Rayner, M.; Scarborough, P. The healthiness and sustainability of national and global food based dietary guidelines: Modelling study. BMJ 2020, 370, m2322. [Google Scholar] [CrossRef]
- Van Dooren, C. A Review of the Use of Linear Programming to Optimize Diets, Nutritiously, Economically and Environmentally. Front. Nutr. 2018, 5, 48. [Google Scholar] [CrossRef]
- Ritchie, H.; Reay, D.; Higgins, P. The impact of global dietary guidelines on climate change. Glob. Environ. Chang. 2018, 49, 46–55. [Google Scholar] [CrossRef]
- Vieux, F.; Perignon, M.; Gazan, R.; Darmon, N. Dietary changes needed to improve diet sustainability: Are they similar across Europe? Eur. J. Clin. Nutr. 2018, 72, 951–960. [Google Scholar] [CrossRef] [PubMed]
- MacDiarmid, J.I.; Kyle, J.; Horgan, G.W.; Loe, J.; Fyfe, C.; Johnstone, A.; McNeill, G. Sustainable diets for the future: Can we contribute to reducing greenhouse gas emissions by eating a healthy diet? Am. J. Clin. Nutr. 2012, 96, 632–639. [Google Scholar] [CrossRef] [PubMed]
- Chungchunlam, S.M.S.; Moughan, P.J.; Garrick, D.P.; Drewnowski, A. Animal-sourced foods are required for minimum-cost nutritionally adequate food patterns for the United States. Nat. Food 2020, 1, 376–381. [Google Scholar] [CrossRef]
- Larrea-Gallegos, G.; Vázquez-Rowe, I. Optimization of the environmental performance of food diets in Peru combining linear programming and life cycle methods. Sci. Total. Environ. 2020, 699, 134231. [Google Scholar] [CrossRef]
- Van Dooren, C.; Tyszler, M.; Kramer, G.F.H.; Aiking, H. Combining Low Price, Low Climate Impact and High Nutritional Value in One Shopping Basket through Diet Optimization by Linear Programming. Sustainability 2015, 7, 12837–12855. [Google Scholar] [CrossRef]
- Donati, M.; Menozzi, D.; Zighetti, C.; Rosi, A.; Zinetti, A.; Scazzina, F. Towards a sustainable diet combining economic, environmental and nutritional objectives. Appetite 2016, 106, 48–57. [Google Scholar] [CrossRef]
- Perignon, M.; Sinfort, C.; El Ati, J.; Traissac, P.; Drogué, S.; Darmon, N.; Amiot, M.-J.; Achir, N.; Alouane, L.; Bellagha, S.; et al. How to meet nutritional recommendations and reduce diet environmental impact in the Mediterranean region? An optimization study to identify more sustainable diets in Tunisia. Glob. Food Secur. 2019, 23, 227–235. [Google Scholar] [CrossRef]
- Perignon, M.; Masset, G.; Ferrari, G.; Barré, T.; Vieux, F.; Maillot, M.; Amiot, M.; Darmon, N. How low can dietary greenhouse gas emissions be reduced without impairing nutritional adequacy, affordability and acceptability of the diet? A modelling study to guide sustainable food choices. Public Health Nutr. 2016, 19, 2662–2674. [Google Scholar] [CrossRef]
- Chaudhary, A.; Krishna, V. Country-Specific Sustainable Diets Using Optimization Algorithm. Environ. Sci. Technol. 2019, 53, 7694–7703. [Google Scholar] [CrossRef]
- Abejón, R.; Garea, A.; Irabien, A. 22 European Symposium, Multiobjective optimization of membrane processes for chemicals ultrapurification. In Computer Aided Process Engineering; Bogle, I.D.L., Fairweather, M.B.T.-C.A.C.E., Eds.; Elsevier: Amsterdam, The Netherlands, 2012; Volume 30, pp. 542–546. [Google Scholar] [CrossRef]
- Heller, M.C.; Keoleian, G.A.; Willett, W.C. Toward a Life Cycle-Based, Diet-level Framework for Food Environmental Impact and Nutritional Quality Assessment: A Critical Review. Environ. Sci. Technol. 2013, 47, 12632–12647. [Google Scholar] [CrossRef] [PubMed]
- Batlle-Bayer, L.; Bala, A.; Lemaire, E.; Albertí, J.; García-Herrero, I.; Aldaco, R.; Fullana-I-Palmer, P. An energy- and nutrient-corrected functional unit to compare LCAs of diets. Sci. Total. Environ. 2019, 671, 175–179. [Google Scholar] [CrossRef] [PubMed]
- Batlle, L.-B.; Bala, A.; Albertí, J.; Xifré, R.; Aldaco, R. Food affordability and nutritional values within the functional unit of a food LCA. An application on regional diets in Spain. Resour. Conserv. Recycl. 2020, 160, 104856. [Google Scholar] [CrossRef]
- MAPA. Base De Datos De Consumo En Hogares. Available online: https://www.mapa.gob.es/app/consumo-en-hogares/consulta.asp (accessed on 31 December 2018).
- Tur-Marí, J.; Serra-Alias, M.; Ngo-de la Cruz, J.; Vidal-Ibañez, M. Una Alimentación Sana Para Todos. Available online: http://www.aecosan.msssi.gob.es/AECOSAN/docs/documentos/nutricion/alimentacion_sana_para_todos.pdf (accessed on 12 September 2020).
- Bach-Faig, A.; Berry, E.M.; Lairon, D.; Reguant, J.; Trichopoulou, A.; Dernini, S.; Medina, F.X.; Battino, M.; Belahsen, R.; Miranda, G.; et al. Mediterranean diet pyramid today. Science and cultural updates. Public Health Nutr. 2011, 14, 2274–2284. [Google Scholar] [CrossRef] [PubMed]
- Abejón, R.; Vázquez-Rowe, I.; Bala, A.; Fullana-i-Palmer, P.; Margallo, M.; Aldaco, R. Computer Application of the “Distance to Target” Approach to the Multiobjective Optimization of Nutritional and Economic Costs due to Food Loss and Waste. Comput. Aided Chem. Eng. 2020, 48, 1681–1686. [Google Scholar] [CrossRef]
- Limleamthong, P.; Guillén-Gosálvez, G. Rigorous analysis of Pareto fronts in sustainability studies based on bilevel optimization: Application to the redesign of the UK electricity mix. J. Clean. Prod. 2017, 164, 1602–1613. [Google Scholar] [CrossRef]
- Schädler, P.; Berdugo, J.D.; Hanne, T.; Dornberger, R. A Distance-Based Pareto Evolutionary Algorithm Based on SPEA for Combinatorial Problems. In Proceedings of the 4th International Symposium on Computational and Business Intelligence, Olten, Switzerland, 5–7 September 2016; pp. 112–117. [Google Scholar]
- Van Kernebeek, H.R.J.; Oosting, S.J.; Feskens, E.J.M.; Gerber, P.J.; De Boer, I.J.M. The effect of nutritional quality on comparing environmental impacts of human diets. J. Clean. Prod. 2014, 73, 88–99. [Google Scholar] [CrossRef]
- Drewnowski, A. Defining Nutrient Density: Development and Validation of the Nutrient Rich Foods Index. J. Am. Coll. Nutr. 2009, 28, 421S–426S. [Google Scholar] [CrossRef]
- Rosenthal, R.E. GAMS—A User’s Guide; GAMS Development Corporation: Washington, DC, USA, 2008. [Google Scholar]
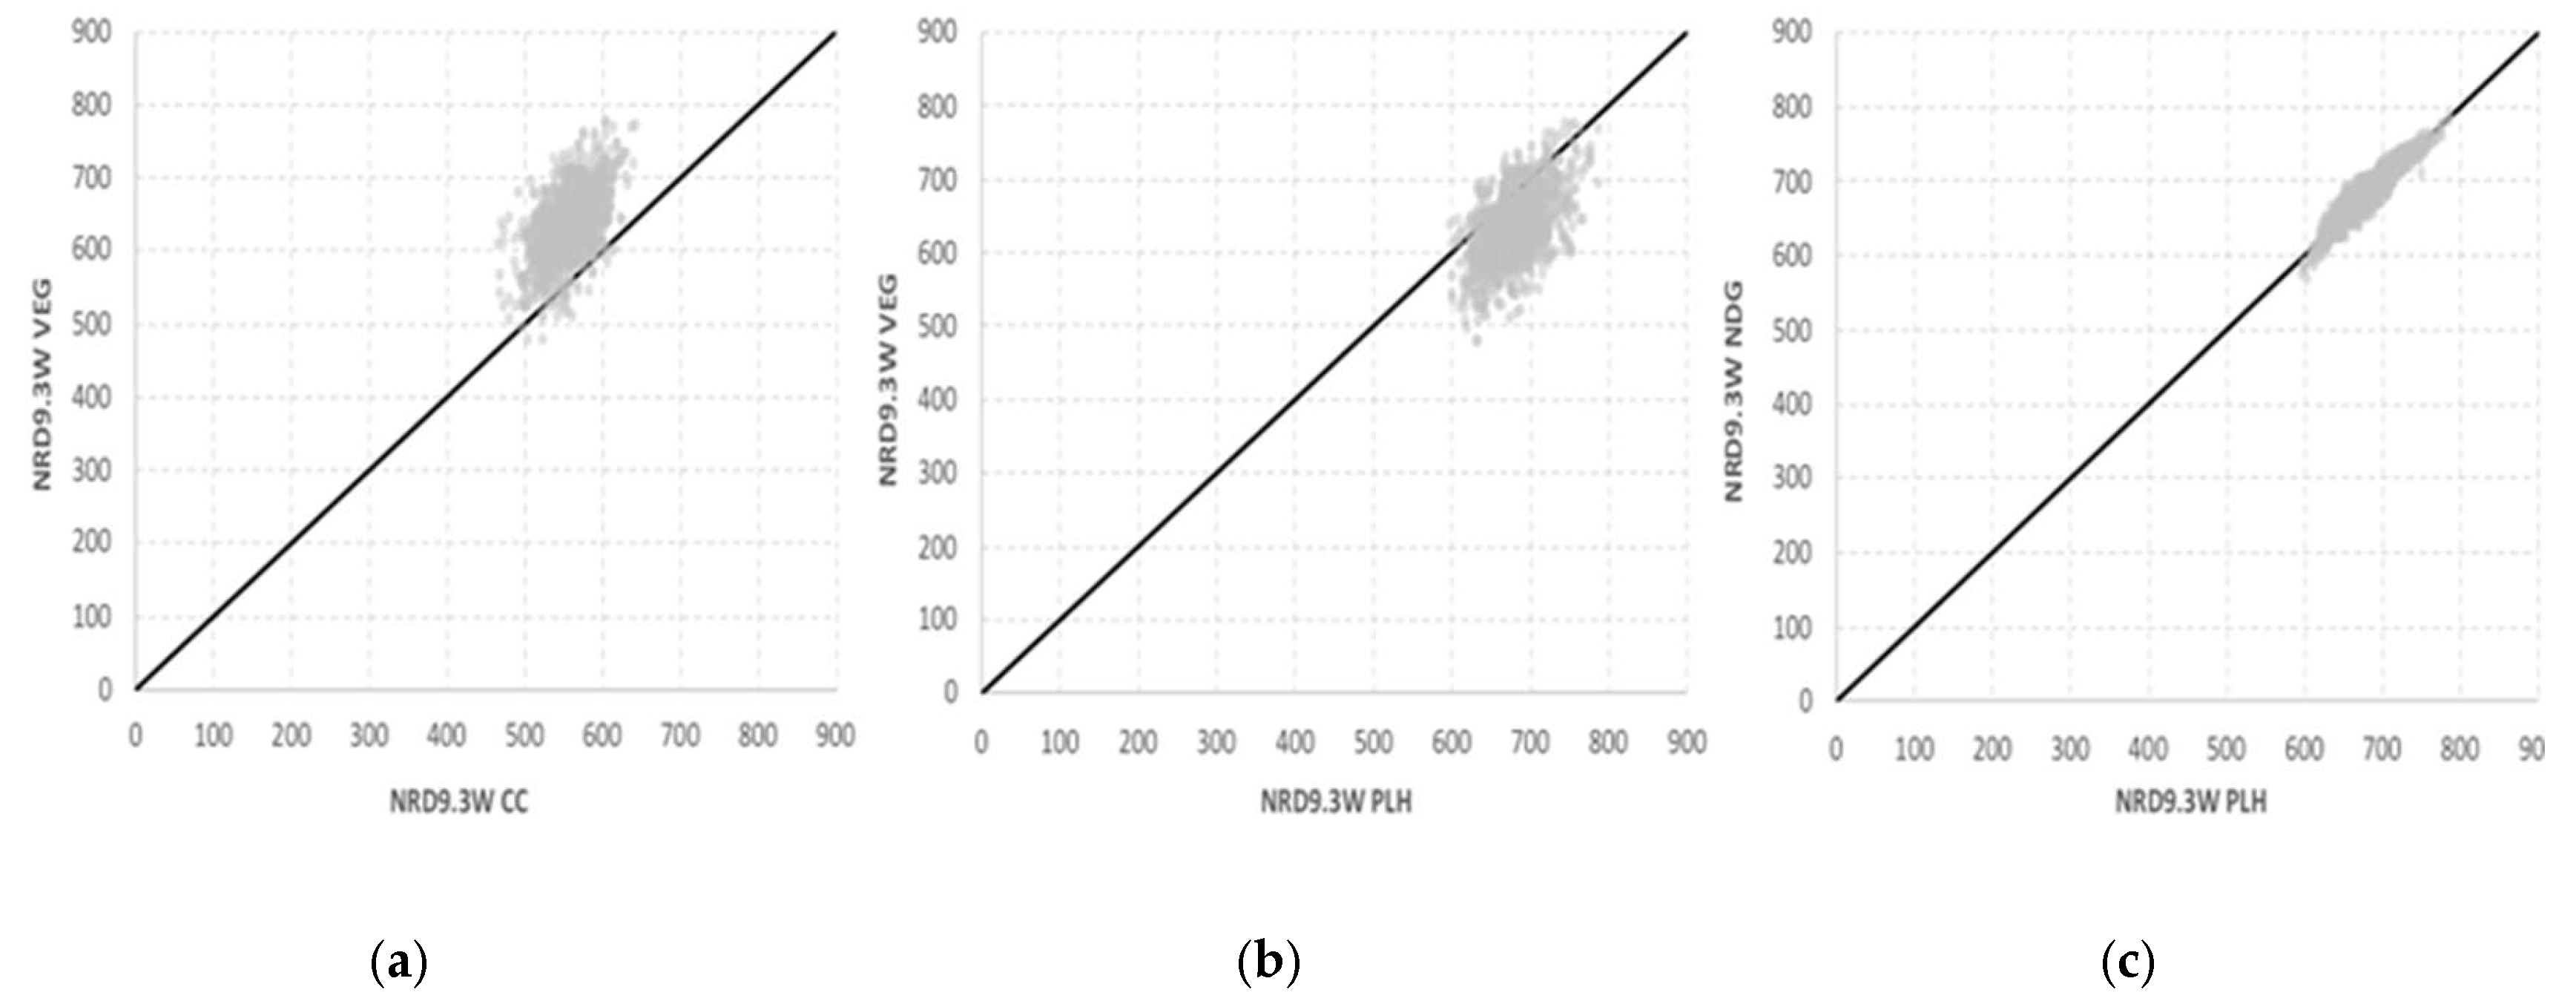
- Von Brömssen, C.; Röös, E. Why statistical testing and confidence intervals should not be used in comparative life cycle assessments based on Monte Carlo simulations. Int. J. Life Cycle Assess. 2020, 25, 2101–2105. [Google Scholar] [CrossRef]
- BEDCA Network of the Ministry of Science and Innovation. Spanish Food Composition Database. Available online: http://www.bedca.net/bdpub/index_en.php (accessed on 17 September 2020).
- Verly-Jr, E.; Sichieri, R.; Darmon, N.; Maillot, M.; Sarti, F.M. Planning dietary improvements without additional costs for low-income individuals in Brazil: Linear programming optimization as a tool for public policy in nutrition and health. Nutr. J. 2019, 18, 40. [Google Scholar] [CrossRef]
- Burlingame, B.; Dernini, S. (Eds.) Sustainable diets and biodiversity. Direction and solutions for policy, research and action. In Proceedings of the International Scientific Symposium on Biodiversity and Sustainable Diets: United Against Hunger, Rome, Italy, 3–5 November 2010; Food and Agriculture Organ: Rome, Italy, 2012. [Google Scholar]
- Jones, A.D.; Hoey, L.; Blesh, J.; Miller, L.; Green, A.; Shapiro, L.F. A Systematic Review of the Measurement of Sustainable Diets. Adv. Nutr. 2016, 7, 641–664. [Google Scholar] [CrossRef] [PubMed]
- Brons, A.; Oosterveer, P.; Wertheim-Heck, S. Feeding the melting pot: Inclusive strategies for the multi-ethnic city. Agric. Hum. Values 2020. [Google Scholar] [CrossRef]
- Seconda, L.; Baudry, J.; Allès, B.; Boizot-szantai, C.; Soler, L.; Galan, P.; Hercberg, S.; Langevin, B.; Lairon, D.; Pointereau, P.; et al. Comparing nutritional, economic, and environmental performances of diets according to their levels of greenhouse gas emissions. Clim. Chang. 2018, 148, 155–172. [Google Scholar] [CrossRef]
- Benvenuti, L.; De Santis, A.; Di Sero, A.; Franco, N. Concurrent economic and environmental impacts of food consumption: Are low emissions diets affordable? J. Clean. Prod. 2019, 236, 117645. [Google Scholar] [CrossRef]
- Asante, D.; He, Z.; Adjei, N.O.; Asante, B. Exploring the barriers to renewable energy adoption utilising MULTIMOORA-EDAS method. Energy Policy 2020, 142, 111479. [Google Scholar] [CrossRef]
- Oliveira, R.; Zanella, A.; Camanhoa, A.S. The assessment of corporate social responsibility: The construction of an industry ranking and identification of potential for improvement. Eur. J. Oper. Res. 2020, 286, 1129–1141. [Google Scholar] [CrossRef]
- D’Inverno, G.; De Witte, K. Service level provision in municipalities: A flexible directional distance composite indicator. Eur. J. Oper. Res. 2020, 286, 1129–1141. [Google Scholar] [CrossRef]
- Wheeler, J.; Páez, M.A.; Guillén-Gosálbez, G.; Mele, F.D. Combining multi-attribute decision-making methods with multi-objective optimization in the design of biomass supply chains. Comput. Aided Chem. Eng. 2018, 113, 11–31. [Google Scholar] [CrossRef]
- Barré, T.; Perignon, M.; Gazan, R.; Vieux, F.; Micard, V.; Amiot, M.; Darmon, N. Integrating nutrient bioavailability and co-production links when identifying sustainable diets: How low should we reduce meat consumption? PLoS ONE 2018, 13, e0191767. [Google Scholar] [CrossRef]
- Broekema, R.; Tyszler, M.; Veer, P.; Van Kok, F.J.; Martin, A.; Lluch, A.; Blonk, H.T.J. Future-proof and sustainable healthy diets based on current eating patterns in the Netherlands. Am. J. Clin. Nutr. 2020, 217, 1–10. [Google Scholar] [CrossRef]
- Hirvonen, K.; Bai, Y.; Headey, D.; Masters, W.A.; Bill, F.; Foundation, M.G. Affordability of the EAT—Lancet reference diet: A global analysis. Lancet Glob. Health 2020, 8, e59–e66. [Google Scholar] [CrossRef]
- Song, G.; Li, M.; Fullana-i-Palmer, P.; Williamson, D.; Wang, Y. Dietary changes to mitigate climate change and benefit public health in China. Sci. Total Environ. 2017, 577, 289–298. [Google Scholar] [CrossRef] [PubMed]
- Garcia-Herrero, I.; Hoehn, D.; Margallo, M.; Laso, J.; Bala, A.; Batlle-Bayer, L.; Fullana, P.; Vazquez-Rowe, I.; Gonzalez, M.J.; Durá, M.J.; et al. On the estimation of potential food waste reduction to support sustainable production and consumption policies. Food Policy 2018, 80, 24–38. [Google Scholar] [CrossRef]
- Vázquez-Rowe, I.; Laso, J.; Margallo, M.; Hoehn, D.; Amo-Setién, F.; Bala, A.; Abajas, R.; Sarabia, C.; Durá, M.J.; Fullana-i-Palmer, P.; et al. Food loss and waste metrics: A proposed nutritional cost footprint linking linear programming and life cycle assessment. Int. J. Life Cycle Assess. 2020, 25, 1197–1209. [Google Scholar] [CrossRef]
- Larrea-Gallegos, G.; Vázquez-Rowe, I.; Wiener, H.; Kahhat, R. Applying the technology choice model in consequential life cycle assessment: A case study in the Peruvian agricultural sector. J. Ind. Ecol. 2018, 23, 601–614. [Google Scholar] [CrossRef]
- Lehikoinen, E.; Salonen, A.O. Food Preferences in Finland: Sustainable Diets and their Differences between Groups. Sustainability 2019, 11, 1259. [Google Scholar] [CrossRef]


| Optimization Method | Objective Function | Reference |
|---|---|---|
| Linear programming (LP) | [13] | |
| Multi-objective target programming (MTP) | [17] | |
| Non-linear programming (NLP) | [20] |
| CC | NDG | MED | OLV | VEG | PLH | |
|---|---|---|---|---|---|---|
| NRD9.3 (−) | 498 | 679 | 662 | 637 | 632 | 680 |
| TC (€/day) | 4.32 | 3.77 | 4.51 | 2.83 | 2.36 | 3.56 |
| GHG (kg CO2eq./day) | 4.52 | 3.93 | 4.07 | 2.91 | 1.41 | 2.95 |
| XNUTR | 0.611 | 0.754 | 0.736 | 0.708 | 0.702 | 0.756 |
| XENV | 1.000 | 0.869 | 0.903 | 0.644 | 0.312 | 0.653 |
| XEC | 0.947 | 0.827 | 1.000 | 0.621 | 0.518 | 0.781 |
| Weighting | Distance (Dn) | |||||
|---|---|---|---|---|---|---|
| CC | NDG | MED | OLV | VEG | PLH | |
| Equally weighted | 0.826 | 0.707 | 0.793 | 0.543 | 0.389 | 0.604 |
| Maximal Dn | 0.968 | 0.840 | 0.962 | 0.625 | 0.495 | 0.749 |
| (overweighted aspect) | ENV | ENV | EC | ENV | EC | EC |
| Minimal Dn | 0.508 | 0.385 | 0.426 | 0.357 | 0.318 | 0.348 |
| (overweighted aspect) | NUTR | NUTR | NUTR | NUTR | NUTR | NUTR |
| Diet | Limiting Nutrient | Required TV or NV |
|---|---|---|
| CC-opt | Ca/Na | TV = 54% |
| NDG-opt | Vit A/STA | TV = 20% |
| MED-opt | STA | TV = 23% |
| OLV-opt | K/STA | TV = 49% |
| VEG-opt | Ca/Na | NV = 7 |
| PLH-opt | STA | TV = 3% |
| Diet Scenarios | Sustainable Factors | Residual Income Score (RIS) | Nutritional Score (NS) | c-GHG | |||
|---|---|---|---|---|---|---|---|
| Price (€/day) | Nutrition (NRD9.3) | GHG (kg CO2eq./day) | |||||
| Optimized | VEG-Opt | 4.28 | 748 | 1.81 | 0.85 | 1.10 | 1.92 |
| PLH-Opt | 2.57 | 717 | 2.12 | 0.91 | 1.06 | 2.21 | |
| OLV-Opt | 2.88 | 690 | 2.18 | 0.90 | 1.01 | 2.38 | |
| NDG-Opt | 2.92 | 728 | 2.61 | 0.90 | 1.07 | 2.71 | |
| MED-Opt | 3.17 | 684 | 2.71 | 0.89 | 1.01 | 3.02 | |
| CC-Opt | 3.33 | 620 | 3.15 | 0.89 | 0.91 | 3.90 | |
| Pre-defined | VEG | 2.36 | 632 | 1.41 | 0.92 | 0.93 | 1.65 |
| PLH | 3.56 | 680 | 2.95 | 0.88 | 1.00 | 3.36 | |
| OLV | 2.83 | 637 | 2.91 | 0.90 | 0.94 | 3.44 | |
| NDG | 3.77 | 679 | 3.93 | 0.87 | 1.00 | 4.51 | |
| MED | 4.51 | 663 | 4.07 | 0.85 | 0.97 | 4.94 | |
| CC | 4.32 | 498 | 4.52 | 0.85 | 0.73 | 7.28 | |
Publisher’s Note: MDPI stays neutral with regard to jurisdictional claims in published maps and institutional affiliations. |
© 2020 by the authors. Licensee MDPI, Basel, Switzerland. This article is an open access article distributed under the terms and conditions of the Creative Commons Attribution (CC BY) license (http://creativecommons.org/licenses/by/4.0/).
Share and Cite
Abejón, R.; Batlle-Bayer, L.; Laso, J.; Bala, A.; Vazquez-Rowe, I.; Larrea-Gallegos, G.; Margallo, M.; Cristobal, J.; Puig, R.; Fullana-i-Palmer, P.; et al. Multi-Objective Optimization of Nutritional, Environmental and Economic Aspects of Diets Applied to the Spanish Context. Foods 2020, 9, 1677. https://doi.org/10.3390/foods9111677
Abejón R, Batlle-Bayer L, Laso J, Bala A, Vazquez-Rowe I, Larrea-Gallegos G, Margallo M, Cristobal J, Puig R, Fullana-i-Palmer P, et al. Multi-Objective Optimization of Nutritional, Environmental and Economic Aspects of Diets Applied to the Spanish Context. Foods. 2020; 9(11):1677. https://doi.org/10.3390/foods9111677
Chicago/Turabian StyleAbejón, Ricardo, Laura Batlle-Bayer, Jara Laso, Alba Bala, Ian Vazquez-Rowe, Gustavo Larrea-Gallegos, María Margallo, Jorge Cristobal, Rita Puig, Pere Fullana-i-Palmer, and et al. 2020. "Multi-Objective Optimization of Nutritional, Environmental and Economic Aspects of Diets Applied to the Spanish Context" Foods 9, no. 11: 1677. https://doi.org/10.3390/foods9111677
APA StyleAbejón, R., Batlle-Bayer, L., Laso, J., Bala, A., Vazquez-Rowe, I., Larrea-Gallegos, G., Margallo, M., Cristobal, J., Puig, R., Fullana-i-Palmer, P., & Aldaco, R. (2020). Multi-Objective Optimization of Nutritional, Environmental and Economic Aspects of Diets Applied to the Spanish Context. Foods, 9(11), 1677. https://doi.org/10.3390/foods9111677