1. Introduction
Starch is the main carbohydrate in foods and is an important food ingredient for many food products. Most of the research have focused on the mainstream starches such as maize, potato, rice, cassava and wheat starches, which are the major sources used for the commercial extraction of starch globally [
1]. In recent years, there has been greater interest in the study of starch and flours from less conventional sources.
There is a growing demand for starchy foods with low glycemic index (GI), which are more slowly digested and metabolized, leading to a more gradual and smaller rise in blood glucose. Much work has been done on mainstream starches in a bid to alter the structure to influence the digestibility of the starch. However, many of the unconventional starches and flours commonly used in Asia such as sweet potato (
Ipomoea batatas), sago (
Metroxylon sagu), water chestnut
(Eleocharis dulcis) starches, red rice (
Oryza rufipogon) and kithul flour (
Caryota urens), have not been extensively characterized. Starch is extracted from the roots of the sweet potato, and the corm of the water chestnut. Sago and kithul are from the palm family and extraction from the pith of the stem yields the flour. These starches/flours are available commercially in native state but not much research has been done in terms of systematically characterizing them and studying their functional properties. Some characterization work of these starches/ flours have been carried out comparing between species after starch isolation [
2,
3,
4], or in comparison with wheat flour or rice starch [
5]. However, there is no paper that has done comprehensive physicochemical characterization looking at the structural, morphological, crystallinity, thermal, rheological and gelation properties using the same analytical instruments and parameters in a way that allows meaningful comparison of the starches/flours of interest in this paper. In addition, the properties that have been reported in different papers cannot be compared, owing to the differences such as the concentration used, the storage time and the methods of measurement. The present study aimed to look at the physicochemical characterization of unconventional starches and flours that are available commercially but not well characterized.
2. Materials and Methods
2.1. Materials
The starch and flour samples used in this study were commercial samples: tapioca starch (Ng Nam Bee Marketing, Singapore), sweet potato starch (White Swallow Brand, Singapore), sago starch (Yiak Say Hang Food Industries, Singapore), water chestnut starch (Pan Tang Brand, Guangzhou, China), high amylose maize starch (Ingredion, Singapore), red rice flour (Ruhunu Foods, Pallekale, Sri Lanka) and kithul flour (Sri Lanka). Tapioca (Manihot esculenta) starch is selected as a basis of comparison against these starches to evaluate the functional properties with a mainstream commercial starch commonly used in Asia. High amylose maize starch is selected as it is a commercial food ingredient that is used in low GI food products. All samples were sieved through a 250 µm sieve to remove impurities, and sealed in bags for future analysis. The abbreviations for the samples are in brackets: high amylose maize starch (HAMS), kithul flour (KF), red rice flour (RRF), sago starch (SGS), sweet potato starch (SPS), tapioca starch (TS) and water chestnut starch (WCS).
2.2. Chemical Composition
The chemical composition of the starches and flours were quantitatively determined by an accredited chemical laboratory (SETSCO Services Pte Ltd, Singapore) using the following methodology: Moisture (AOAC 950.46), protein (AOAC 981.10, 991.20), fat (AOAC 996.06), ash (AOAC 930.30), dietary fiber (AOAC 985.29), available carbohydrates by difference (FAO 1998) and phosphorus by inductively coupled plasma-optical emission spectrometry (ICP-OES) after microwave digestion [
6].
The total starch and amylose content of the starches and flours were determined using the megazyme amylose/amylopectin assay procedure, ultilizing the commercial kit (Megazyme Ireland International Ltd, Bray, Ireland).
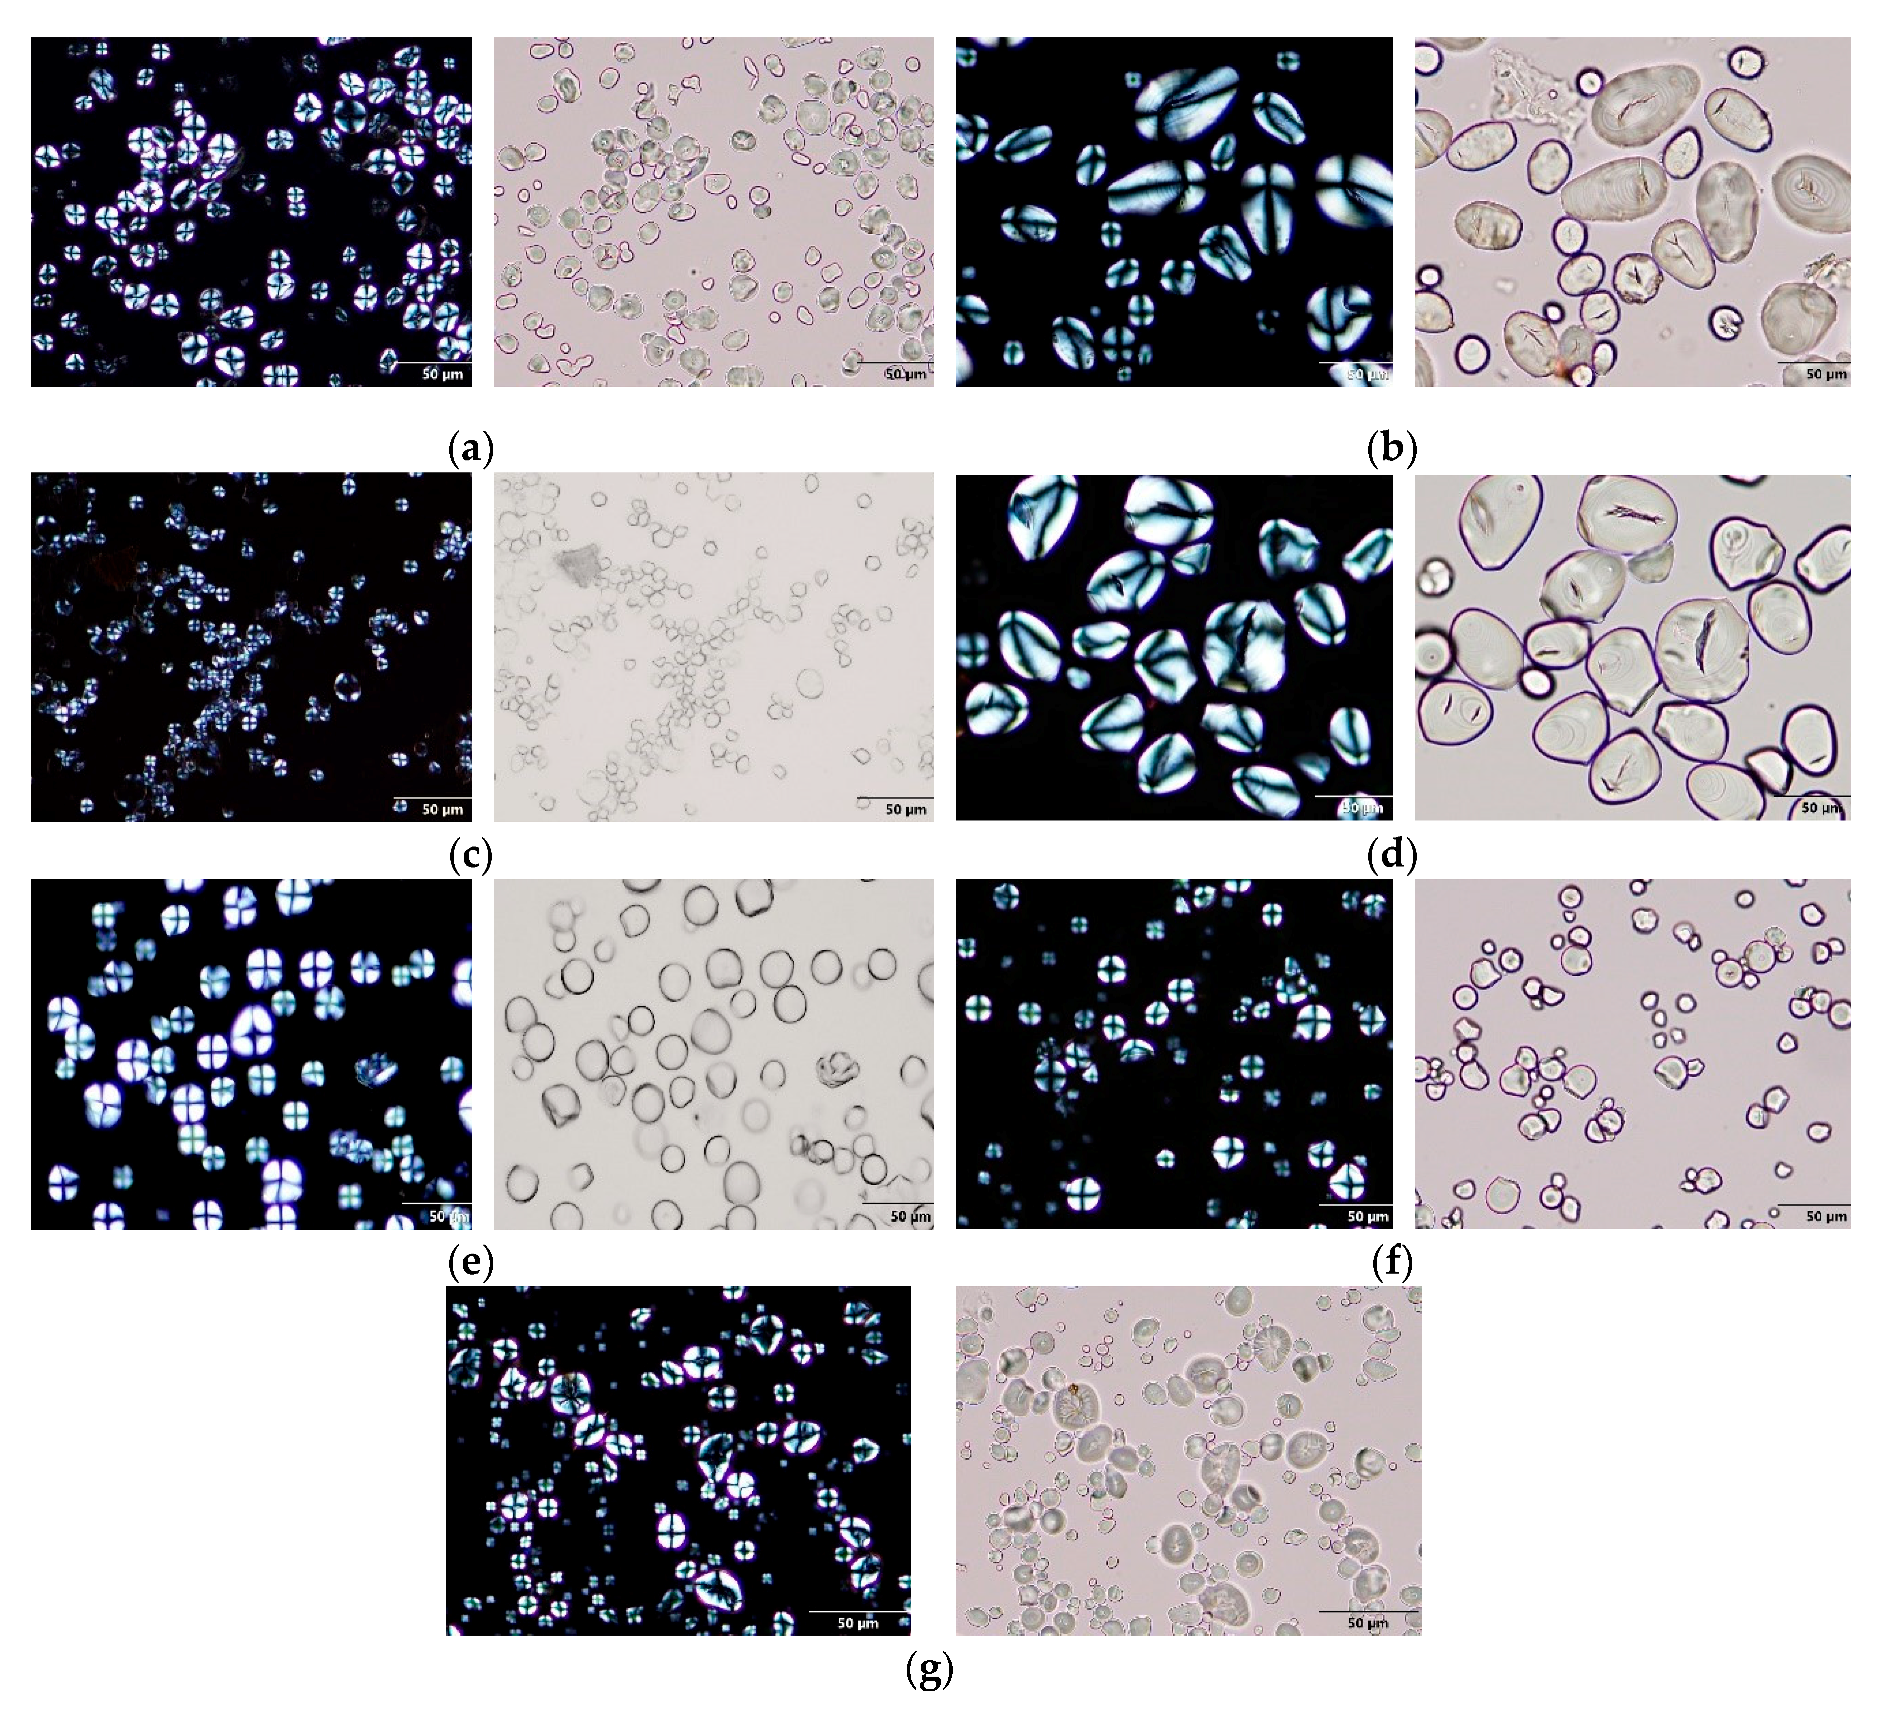
2.3. Morphological Properties
The granule shapes and “maltese cross” were viewed under a light microscope (BX53F2, Olympus, Tokyo, Japan) equipped with a CCD camera, with and without a polarizing plate, according to the method used by Cai and Wei [
7]. Starch and flour suspensions (1%) were prepared, and a drop of suspension was placed on the microscope slide and covered with a cover slip.
The granule size distribution was examined by a laser diffraction particle size analyzer (PSA1190, Anton Paar, GmbH, Graz, Austria). Starch granules were fully suspended in water and an obscuration of 15% ± 1% was achieved for all measurements. The volume-weighted mean diameter (µm), D [
3,
4], was reported as an average of three replicates.
The crystalline patterns of starches were performed using an X-ray diffractometer (D8 Discover micro XRD, Bruker, Billerica, MA, USA) equipped with a two-dimensional detector Vantec 500 and micro focus Cu source operated at 50 kV, 800 µA and 40 watt. The diffraction patterns were obtained from a scanning angle range between 3° and 30° (2θ) at a step size of 0.02°.
2.4. Functional Properties
Swelling power of starches were determined using a modified method by Leach et al. [
8]. Starch suspensions (2%, w/w db) were heated in a water bath at 95 °C for 30 min. The slurry was then cooled and centrifuged (Rotina 380, Hettich Lab, Tuttlingen, Germany) at 3000 g for 20 min. The supernatant was evaporated in an air oven at 105 °C for 3 h. The dried residue from the supernatant and sediment were weighed. The swelling power (SP) and water solubility index (WSI) were calculated using Equations (1) and (2). The mean is obtained from three replicates:
Freeze thaw stability was determined by the method of Hoover and Ratnayake [
9]. Starch suspensions (6%, w/w db) were heated in a water bath at 95 °C for 30 min with constant stirring. The slurry was poured into separate tubes and were subject to cold storage at 4 °C for 16 h and then frozen at −16 °C for 24 h. To measure freeze thaw stability, the frozen gels were thawed at 25 °C for 6 h and then refrozen at −16 °C. Five cycles of freeze thaw were performed. The tubes were centrifuged at 1000
g for 20 min and the released water (%) was measured as freeze thaw stability.
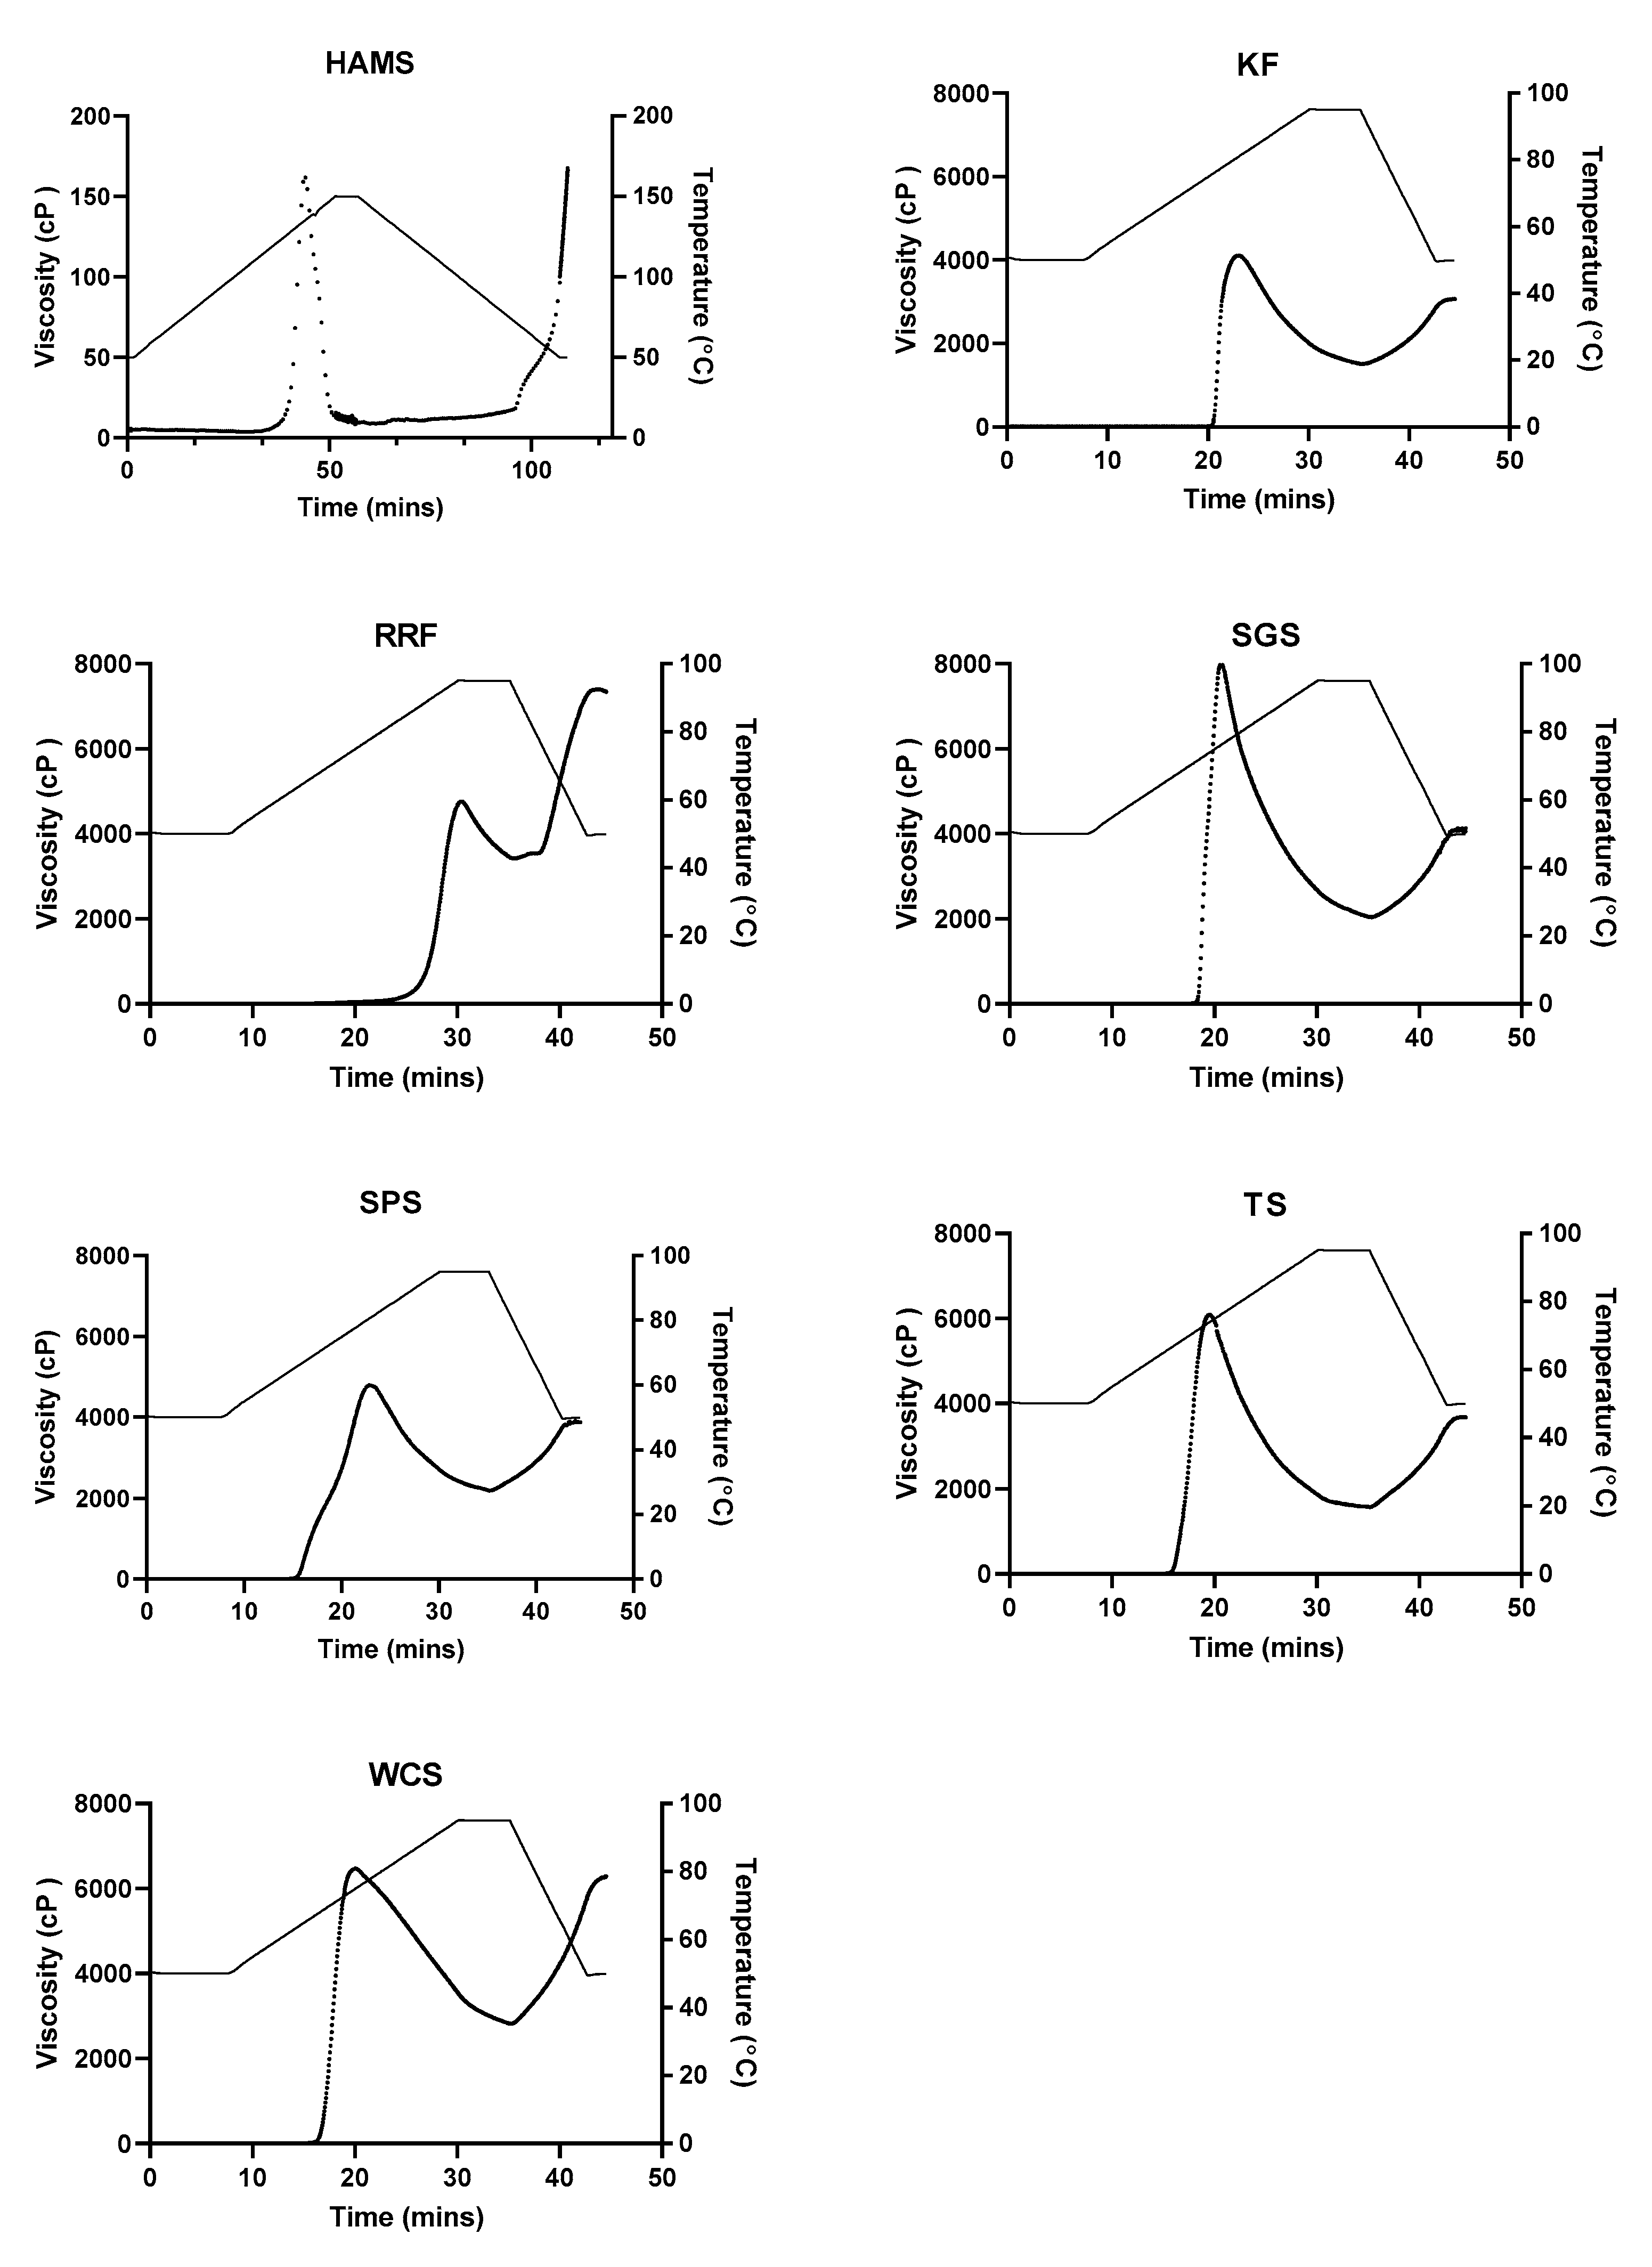
2.5. Pasting Properties
The pasting profile of the starch suspensions (10% w/w, dry weight basis) were obtained using the starch analyzer (MCR 302, Anton Paar, Graz, Austria). A total weight of 20 g starch suspension was placed in the starch cell and dispersed at a vane speed of 960 rpm, which reduced to 160 rpm after 1 min. The heating and cooling cycle was programmed according to the following: with the exception of high amylose maize starch, samples were held at 50 °C for 1 min, heated to 95 °C at a rate of 2 °C/min, maintained at 95 °C for 5 min, cooled to 50 °C and held for 2 min. A pressure cell system (Anton Paar, Graz, Austria) is required for high amylose maize starch to heat the starch above 100 °C in order for gelatinization to occur. High amylose maize starch was held at 50 °C for 1 min, heated to 150 °C at a rate of 2 °C/min, maintained at 150 °C for 5 min, cooled to 50 °C and held for 2 min. The parameters including pasting temperature, peak viscosity, trough viscosity (minimum viscosity at 95/150 °C), final viscosity (viscosity at 50 °C), breakdown value (peak viscosity–trough viscosity) and setback value (final viscosity–trough viscosity) were recorded. Duplicate pasting curves were measured.
2.6. Thermal Properties
The thermal properties of the starches were measured using a differential scanning calorimeter (DSC 204 F1, NETZSCH, Selb, Germany) according to Lan et al. [
10]. Three mg of starch and 10 Μl of water was weighed in an aluminum pan, hermetically sealed and equilibrated overnight at room temperature. An empty sealed pan served as the reference. The scanning temperature range was between 20–120 °C and at a heating rate of 2 °C/min, respectively. Onset (T
o), peak (T
p) and conclusion (T
c) temperatures (°C), and enthalpy change (J/g) were determined. Proteus® software (NETZSCH, Selb, Germany) was used to calculate the enthalpy of the endothermic peak. The onset (T
o), peak (T
p), and completed (T
c) temperatures of the gelatinization peak were determined from the intersection of tangents fitted to the leading and trailing flanks of the peak with the baseline.
2.7. Textural Properties of Gel
Gel texture properties were analyzed using methods by Wang et al. [
11] and Kaur et al. [
12] with slight modification. Starch/flour suspensions (10% w/w in water) were heated in water bath at 95 °C for 30 min. The gelatinized flour and starch paste was poured into a plastic container (Ø = 30 mm) and kept at 20 ± 2 °C for 24 h to form a solid gel. The gels were unmoulded from the containers and double compression was performed on the samples at room temperature using a texture analyzer, TA-Xtplus (Stable Micro Systems Ltd, Surrey, UK). Each gel sample was compressed to a strain of 50% with a cylindrical probe (Ø = 75 mm) at a speed of 1 mm/s with a recovery time of 10 s between the first and second compressions. From the force–time curve, the following parameters were obtained [
13]: the maximum force (N) of the first compression was recorded as the hardness of the gel; the ratio of the gel’s detected height in the second compression to the original compression distance was recorded as springiness, the ratio of the area of work of the second compression to that of the first compression was recorded as cohesiveness; and the multiplication of the hardness, cohesiveness and springiness values were recorded as the chewiness.
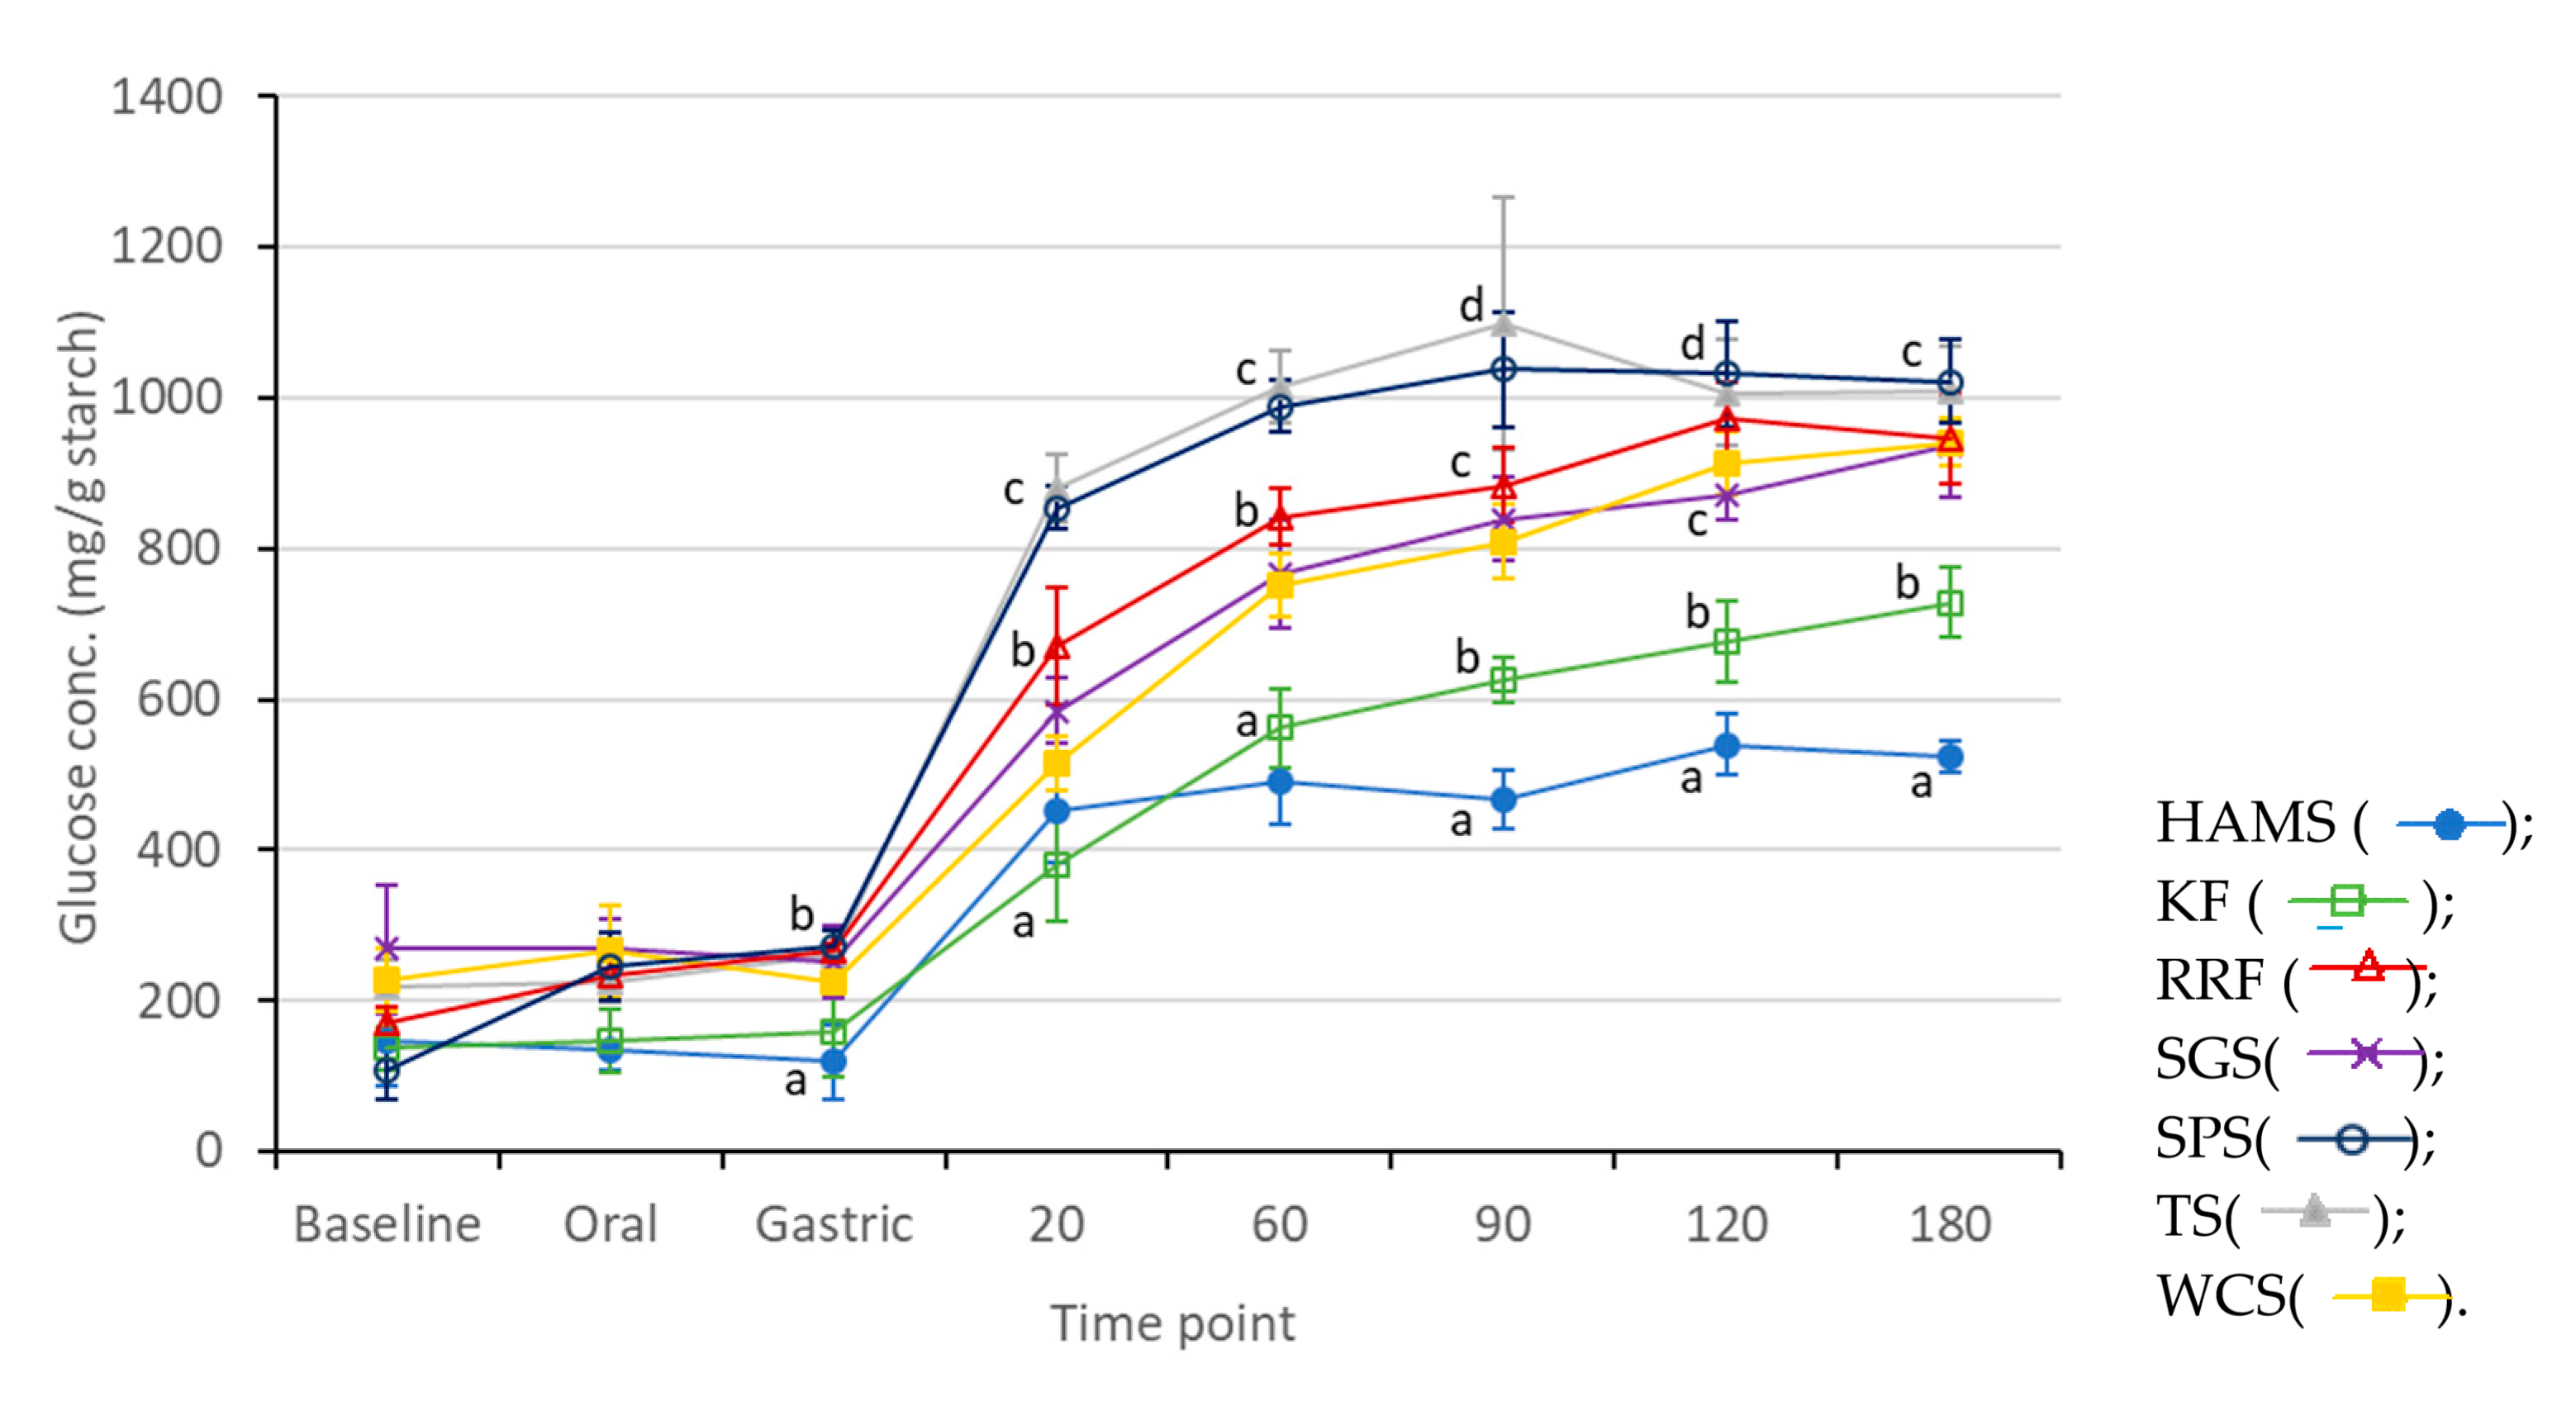
2.8. In Vitro Enzymatic Digestibility
An in vitro digestion model that mimics human gastrointestional digestion [
14,
15,
16,
17] was used to evaluate the digestibility of the starch and flour samples. Starch/flour suspensions (25% w/w in water) were heated in a water bath at 95 °C for 30 min and allowed to set overnight at 20 °C. Gel samples (2.5 g), which were in distilled water (30 Ml), were digested in containers placed in a circulating water bath at 37 °C. The samples were constantly stirred at 200 rpm.
Oral phase: After stirring for 30 min, a solution of 0.1 Ml of 10% α-amylase (≥10 units/mg solid) dissolved in distilled water was added and stirred for 1 min. A total of 0.8Ml of 1 M HCL was added to adjust the Ph to Ph 2.5 (±0.2), using a Ph meter (SevenCompact S220™, Mettler Toledo®, Columbus, OH, USA).
Gastric phase: 1 Ml of 10% pepsin (≥250 units/mg solid) dissolved in 0.05 M HCl was added. Gastric digestion was concluded after 30 min of stirring at 37 °C. For neutralizing the gastric phase HCl, 2 Ml of 1 M NaHCO3 and 5 Ml of 0.2 M maleate buffer (Ph 6) were added into the mixture. Distilled water was added to the mixture to a final volume of 55 Ml and stirred continuously at 150 rpm until the temperature of the mixture reached 37 °C.
Pancreatic phase: 0.1 Ml of amyloglucosidase (≥260 U/Ml, aqueous solution) and 1 Ml of 5% pancreatin in 0.2 M maleate buffer was added and stirred continuously.
A total of 0.5 Ml aliquots was taken at baseline (before start of oral phase), at the end of oral and gastric phase, and at 20, 60, 90, 120 and 180 min from when the pancreatic phase started. To stop the enzymatic digestion, the drawn aliquots were added to 2 Ml of ethanol. The ethanolic digesta samples were stored at 4 °C for the analysis of reducing sugar.
The analysis of reducing sugars in the ethanolic digesta samples was measured by a dinitrosalicylic acid (DNS) colourimetric method [
16,
18]. The samples were centrifuged at 1000
g for 10 min. 0.5 Ml aliquots of the supernatant were drawn and added to 0.25 Ml of 1% amyloglucosidase (≥260 U/Ml, aqueous solution) dissolved in 0.1 M acetate buffer (Ph 5.2). The mixture was vortexed and incubated at 37 °C for 10 min. Then, 0.75Ml of DNS mixture was then added. This was prepared by mixing 0.5 mg/Ml of glucose, 4 M NaOH and DNS reagent in a ratio of 1:1:5. After the mixture was heated for 15 min at 95 °C, 4 Ml of distilled water was added to each sample and cooled for 10 min. Absorbance was measured at 530 nm by a UV-VIS spectrophotometer (UV-2600, Shimadzu, Kyoto, Japan). The blank and standard was distilled water and glucose (10 mg/Ml), respectively. The results of the glucose concentration were presented as mg/g starch.
2.9. Statistical Analysis
The data reported in all the tables were mean values and standard deviations of triplicate observations unless otherwise stated. There were four replicates for both the gel texture analysis and the in vitro digestion. The comparisons between samples for the texture analysis and in vitro digestibility were analyzed by a one-way ANOVA with Tukey’s multiple comparison test (p < 0.05) using GraphPad Prism version 8.0.0 for Windows, GraphPad Software (San Diego, CA, USA).
4. Conclusions
Starches and flours that are non-mainstream but commonly used in Asia were studied. The chemical composition and structure of the starches varied, which resulted in the significant differences in the in vitro digestibility, functional, thermal, pasting and textural properties. From this study, it was discovered that kithul flour had a significantly lower rate of digestion than the other samples (except for high amylose maize starch), had a gelatinization temperature that could be achieved during cooking and had good gelling properties. It would be interesting to have a greater understanding of its chemical composition such as how the amylopectin fine structure may influence its properties. Future research on unconventional sources of starch from the tropical region enable us to secure starches with unusual rheological, sensory, nutritional or organoleptic properties.


