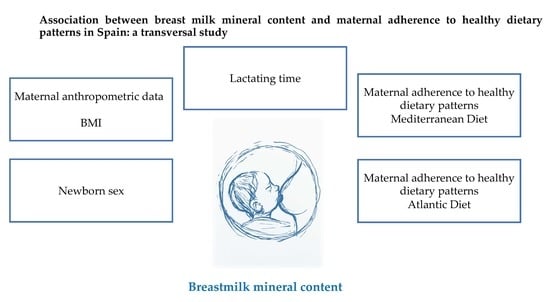
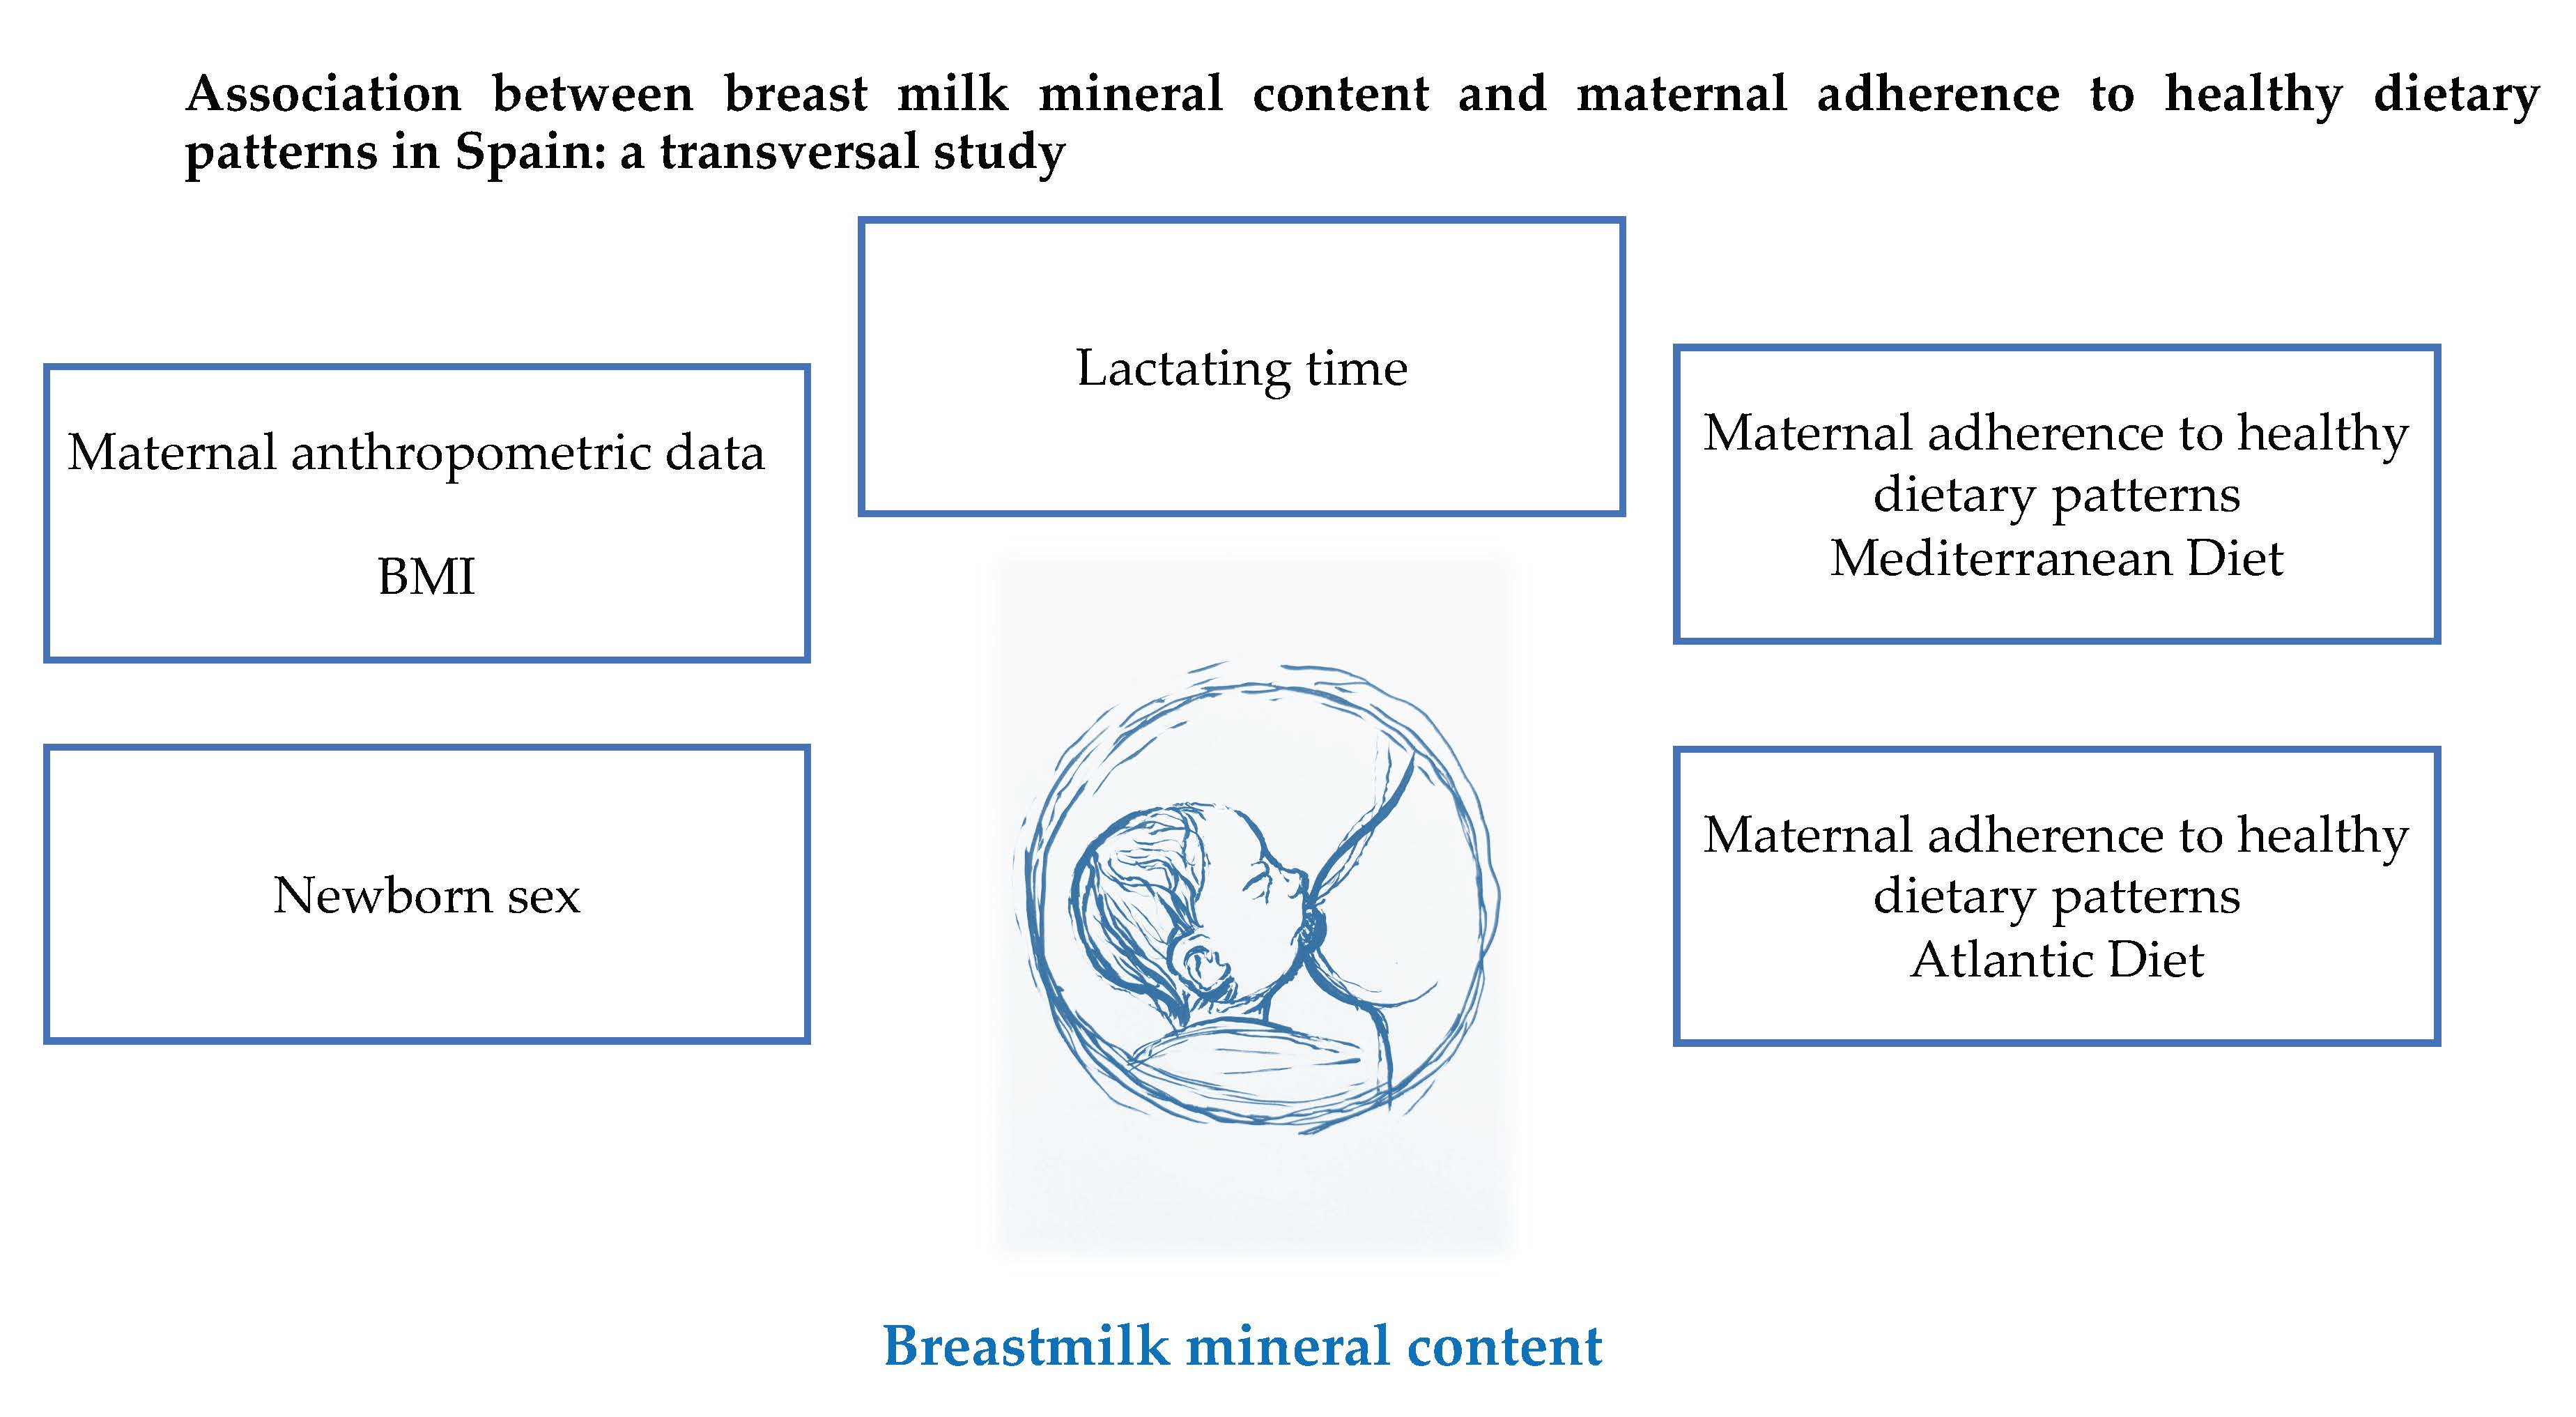
Association between Breast Milk Mineral Content and Maternal Adherence to Healthy Dietary Patterns in Spain: A Transversal Study


 , ,
, , 
Abstract
:
1. Introduction
2. Materials and Methods
2.1. Samples and Data Collection
2.2. ICP-MS Method
2.3. Statistics
3. Results and Discussion
3.1. Maternal Characteristics
3.2. Galician Human Milk Composition Compared with Worldwide
3.3. Influential Factors on Breast Milk Mineral Content
Multivariate Approach
4. Conclusions
Author Contributions
Funding
Acknowledgments
Conflicts of Interest
References
- Almarza, A.L.; Martínez, B.M. Alimentación Del Lactante Sano. In Protocolos Diagnóstico-Terapéuticos de Gastroenterología, Hepatología y Nutrición Pediátrica SEGHNP-AEP; WHO: Geneva, Switzerland, 2010; pp. 311–320. [Google Scholar]
- Hansen, K.E. Breastfeeding: A smart investment in people and in economies. Lancet 2016, 387, 416. [Google Scholar] [CrossRef]
- Collective, G.B. Nurturing the Health and Wealth of Nations: The Investment Case for Breastfeeding; World Health Organization: Geneva, Switzerland, 2017. [Google Scholar]
- Bravi, F.; Wiens, F.; DeCarli, A.; Pont, A.D.; Agostoni, C.; Ferraroni, M. Impact of maternal nutrition on breast-milk composition: A systematic review. Am. J. Clin. Nutr. 2016, 104, 646–662. [Google Scholar] [CrossRef] [PubMed] [Green Version]
- Serra-Majem, L.; Bach-Faig, A.; Raidó-Quintana, B. Nutritional and Cultural Aspects of the Mediterranean Diet. Int. J. Vitam. Nutr. Res. 2012, 82, 157–162. [Google Scholar] [CrossRef]
- Knoops, K.T.B.; De Groot, L.C.P.G.M.; Kromhout, D.; Perrin, A.-E.; Moreiras-Varela, O.; Menotti, A.; Van Staveren, W.A. Mediterranean Diet, Lifestyle Factors, and 10-Year Mortality in Elderly European Men and Women. JAMA 2004, 292, 1433–1439. [Google Scholar] [CrossRef] [PubMed]
- Romeu, M.; Aranda, N.; Giralt, M.; Ribot, B.; Nogués, M.R.; Arija, V. Diet, iron biomarkers and oxidative stress in a representative sample of Mediterranean population. Nutr. J. 2013, 12, 102. [Google Scholar] [CrossRef] [Green Version]
- Sofi, F.; Cesari, F.; Abbate, R.; Gensini, G.F.; Casini, A. Adherence to Mediterranean diet and health status: Meta-analysis. BMJ 2008, 337, a1344. [Google Scholar] [CrossRef] [Green Version]
- Moro, G.E.; Bertino, E.; Bravi, F.; Tonetto, P.; Gatta, A.; Quitadamo, P.A.; Salvatori, G.; Profeti, C.; Di Nicola, P.; DeCarli, A.; et al. Adherence to the Traditional Mediterranean Diet and Human Milk Composition: Rationale, Design, and Subject Characteristics of the MEDIDIET Study. Front. Pediatr. 2019, 7, 66. [Google Scholar] [CrossRef] [Green Version]
- Varela, G.; Moreiras, O.; Ansón, R. Consumo De Alimentos En Galicia-La Dieta Atlántica; Fundación Española de Nutrición: Madrid, Spain, 2004. [Google Scholar]
- Oliveira, A.; Lopes, C.; Rodríguez-Artalejo, F. Adherence to the Southern European Atlantic Diet and occurrence of nonfatal acute myocardial infarction. Am. J. Clin. Nutr. 2010, 92, 211–217. [Google Scholar] [CrossRef]
- Guallar-Castillon, P.; Oliveira, A.; Lopes, C.; López-García, E.; Rodríguez-Artalejo, F. The Southern European Atlantic Diet is associated with lower concentrations of markers of coronary risk. Atherosclerosis 2013, 226, 502–509. [Google Scholar] [CrossRef] [Green Version]
- Pérez-Castro, T. Adherencia De La Dieta De La Población Gallega a Los Patrones De Dieta Mediterránea Y Atlántica. Ph.D. Thesis, Universidade da Coruña, La Coruña, Sapin, 2015. [Google Scholar]
- Schröder, H.; Fíto, M.; Estruch, R.; A Martínez-González, M.; Corella, D.; Salas-Salvadó, J.; Lamuela-Raventós, R.M.; Ros, E.; Salaverría, I.; Fiol, M.; et al. A Short Screener Is Valid for Assessing Mediterranean Diet Adherence among Older Spanish Men and Women. J. Nutr. 2011, 141, 1140–1145. [Google Scholar] [CrossRef] [Green Version]
- Martínez-González, M.A.; García-Arellano, A.; Toledo, E.; Salas-Salvadó, J.; Buil-Cosiales, P.; Corella, L.; Covas, M.I.; Schröder, H.; Arós, F.; Gomez-Gracia, E.; et al. A 14-Item Mediterranean Diet Assessment Tool and Obesity Indexes among High-Risk Subjects: The PREDIMED Trial. PLoS ONE 2012, 7, e43134. [Google Scholar] [CrossRef] [PubMed] [Green Version]
- Rodríguez-Martín, C.; Garcia-Garcia, A.; Sánchez, E.R.; Maderuelo-Fernandez, C.; Lugones-Sanchez, A.; Martin-Cantera, M.S.; Soriano-Cano, J.F.; Arietaleanizbeaskoa, M.; Magdalena-Belio, J.F.; Menendez-Suarez, C.; et al. The Relationship of the Atlantic Diet with Cardiovascular Risk Factors and Markers of Arterial Stiffness in Adults without Cardiovascular Disease. Nutrients 2019, 11, 742. [Google Scholar] [CrossRef] [Green Version]
- BSI. Foodstuffs. Determination of Trace Elements. Determination of Iodine by Icp-Ms (Inductively Coupled Plasma Mass Spectrometry); BSI: London, UK, 2007. [Google Scholar]
- Atkinson, S.A.; Alston-Mills, B.P.; Lönnerdal, B.; Neville, M.C.; Thompson, M.P. Major Minerals and Ionic Constituents of Human and Bovine Milks. In Handbook of Milk Composition; Academic Press: Cambridge, MA, USA, 1995; pp. 593–622. [Google Scholar]
- Gross, S.J.; David, R.J.; Bauman, L.; Tomarelli, R. Nutritional composition of milk produced by mothers delivering preterm. J. Pediatr. 1980, 96, 641–644. [Google Scholar] [CrossRef]
- Fransson, G.; Lönnerdal, B. Distribution of Trace Elements and Minerals in Human and Cow’s Milk. Pediatr. Res. 1983, 17, 912. [Google Scholar] [CrossRef] [Green Version]
- Dewey, K.G.; Lönnerdal, B. Milk and nutrient intake of breast-fed infants from 1 to 6 months: Relation to growth and fatness. J. Pediatr. Gastroenterol. Nutr. 1983, 2, 497–506. [Google Scholar] [CrossRef]
- Garza, C.; Johnson, C.A.; Smith, E.O.; Nichols, B.L. Changes in the nutrient composition of human milk during gradual weaning. Am. J. Clin. Nutr. 1983, 37, 61–65. [Google Scholar] [CrossRef] [Green Version]
- Feeley, R.M.; Eitenmiller, R.R.; Jones, J.B., Jr.; Barnhart, H. Calcium, Phosphorus, and Magnesium Contents of Human Milk during Early Lactation. J. Pediatr. Gastroenterol. Nutr. 1983, 2, 262–267. [Google Scholar] [CrossRef]
- Dewey, K.G.; Finley, D.A.; Lonnerdal, B. Breast milk volume and composition during late lactation (7–20 months). J. Pediatr. Gastroenterol. Nutr. 1984, 3, 713–720. [Google Scholar] [CrossRef]
- Butte, N.F.; Garza, C.; Johnson, C.A.; Smith, E.; Nichols, B.L. Longitudinal changes in milk composition of mothers delivering preterm and term infants. Early Hum. Dev. 1984, 9, 153–162. [Google Scholar] [CrossRef]
- World Health Organization. Minor and Trace Elements in Breast Milk: Report of a Joint WHO/IAEA Collaborative Study; WHO: Geneva, Switzerland, 1989. [Google Scholar]
- Allen, J.C.; Keller, R.P.; Archer, P.; Neville, M.C. Studies in human lactation: Milk composition and daily secretion rates of macronutrients in the first year of lactation. Am. J. Clin. Nutr. 1991, 54, 69–80. [Google Scholar] [CrossRef]
- Dorea, J.G. Calcium and phosphorus in human milk. Nutr. Res. 1999, 19, 709–739. [Google Scholar] [CrossRef]
- Friel, J.K.; Andrews, W.L.; Jackson, S.E.; Longerich, H.P.; Mercer, C.; McDonald, A.; Dawson, B.; Sutradhar, B. Elemental composition of human milk from mothers of premature and full-term infants during the first 3 months of lactation. Boil. Trace Elem. Res. 1999, 67, 225–247. [Google Scholar] [CrossRef]
- Yamawaki, N.; Yamada, M.; Kan-No, T.; Kojima, T.; Kaneko, T.; Yonekubo, A. Macronutrient, mineral and trace element composition of breast milk from Japanese women. J. Trace Elem. Med. Boil. 2005, 19, 171–181. [Google Scholar] [CrossRef]
- Mastroeni, M.F.; Okada, I.A.; Rondo, P.R.D.C.; Duran, M.C.; Paiva, A.A.; Neto, J.M. Concentrations of Fe, K, Na, Ca, P, Zn and Mg in Maternal Colostrum and Mature Milk. J. Trop. Pediatr. 2006, 52, 272–275. [Google Scholar] [CrossRef] [Green Version]
- Thacher, T.D.; Pettifor, J.M.; Fischer, P.; Okolo, S.; Prentice, A. Case-control study of breast milk calcium in mothers of children with and without nutritional rickets. Acta Paediatr. 2006, 95, 826–832. [Google Scholar] [CrossRef]
- Shi, Y.-D.; Sun, G.-Q.; Zhang, Z.-G.; Deng, X.; Kang, X.-H.; Liu, Z.-D.; Ma, Y.; Qinghai, S. The chemical composition of human milk from Inner Mongolia of China. Food Chem. 2011, 127, 1193–1198. [Google Scholar] [CrossRef]
- Bjorklund, K.L.; Vahter, M.; Palm, B.; Grandér, M.; Lignell, S.; Berglund, M. Metals and trace element concentrations in breast milk of first time healthy mothers: A biological monitoring study. Environ. Health 2012, 11, 92. [Google Scholar] [CrossRef] [Green Version]
- Andrade, M.T.S.; Del Ciampo, I.R.L.; Ferraz, I.S.; Junior, F.B. Breast Milk Micronutrients in Lactating Mothers from Ribeirão Preto (SP), Brazil. Food Nutr. Sci. 2014, 5, 1196–1201. [Google Scholar] [CrossRef] [Green Version]
- Klein, L.; Breakey, A.A.; Scelza, B.; Valeggia, C.; Jasienska, G.; Hinde, K. Concentrations of trace elements in human milk: Comparisons among women in Argentina, Namibia, Poland, and the United States. PLoS ONE 2017, 12, e0183367. [Google Scholar] [CrossRef]
- Aumeistere, L.; Ciprovica, I.; Zavadska, D.; Bavrins, K. A preliminary study on essential minerals in human milk: Association with dietary habits. Res. Rural Dev. 2017, 1. [Google Scholar] [CrossRef]
- Perrin, M.T.; Fogleman, A.D.; Newburg, D.S.; Allen, J.C. A longitudinal study of human milk composition in the second year postpartum: Implications for human milk banking. Matern. Child Nutr. 2016, 13, e12239. [Google Scholar] [CrossRef] [Green Version]
- Butts, C.; Hedderley, D.I.; Herath, T.D.; Paturi, G.; Glyn-Jones, S.; Wiens, F.; Stahl, B.; Gopal, P.K. Human Milk Composition and Dietary Intakes of Breastfeeding Women of Different Ethnicity from the Manawatu-Wanganui Region of New Zealand. Nutrients 2018, 10, 1231. [Google Scholar] [CrossRef] [Green Version]
- Sabatier, M.; Garcia-Rodenas, C.L.; Castro, C.A.; Kastenmayer, P.; Vigo, M.; Dubascoux, S.; Andrey, D.; Nicolas, M.; Payot, J.R.; Bordier, V.; et al. Longitudinal Changes of Mineral Concentrations in Preterm and Term Human Milk from Lactating Swiss Women. Nutrients 2019, 11, 1855. [Google Scholar] [CrossRef] [Green Version]
- Daniels, L.; Gibson, R.S.; Diana, A.; Haszard, J.J.; Rahmannia, S.; Luftimas, D.E.; Hampel, D.; Shahab-Ferdows, S.; Reid, M.; Melo, L.; et al. Micronutrient intakes of lactating mothers and their association with breast milk concentrations and micronutrient adequacy of exclusively breastfed Indonesian infants. Am. J. Clin. Nutr. 2019, 110, 391–400. [Google Scholar] [CrossRef]
- EFSA Panel on Dietetic Products, Nutrition and Allergies (NDA). Scientific Opinion on nutrient requirements and dietary intakes of infants and young children in the European Union. EFSA J. 2013, 11, 3408. [Google Scholar]
- Manz, F. Why is the phosphorus content of human milk exceptionally low? Monatsschr. Kinderheilkd. 1992, 140, 35. [Google Scholar]
- Wack, R.P.; Lien, E.L.; Taft, D.; Roscelli, J.D. Electrolyte composition of human breast milk beyond the early postpartum period. Nutrition 1997, 13, 774–777. [Google Scholar] [CrossRef]
- Roy, S.; Basu, A.; Dhar, P.; Ghosh, M. Calcium, iron and essential fatty acid composition of Bengali mother’s milk: A population based cross-sectional study. Indian J. Community Heal. 2014, 26, 310–317. [Google Scholar]
- Koo, W.W.; Gupta, J.M. Breast milk sodium. Arch. Dis. Child. 1982, 57, 500–502. [Google Scholar] [CrossRef] [Green Version]
- Humenick, S.S.; Hill, P.D.; Thompson, J.; Hart, A.M. Breast-milk sodium as a predictor of breastfeeding patterns. Can. J. Nurs. Res. Arch. 1998, 30. [Google Scholar]
- Feeley, R.M.; Eitenmiller, R.R.; Jones, J.B., Jr.; Barnhart, H. Copper, iron, and zinc contents of human milk at early stages of lactation. Am. J. Clin. Nutr. 1983, 37, 443–448. [Google Scholar] [CrossRef]
- Gunshin, H.; Yoshikawa, M.; Doudou, T.; Kato, N. Trace Elements in Human Milk, Cow’s Milk, and Infant Formula. Agric. Boil. Chem. 1985, 49, 21–26. [Google Scholar] [CrossRef]
- Domellöf, M.; Lönnerdal, B.; Dewey, K.G.; Cohen, R.J.; Hernell, O. Iron, zinc, and copper concentrations in breast milk are independent of maternal mineral status. Am. J. Clin. Nutr. 2004, 79, 111–115. [Google Scholar] [CrossRef]
- Hannan, M.A.; Faraji, B.; Tanguma, J.; Longoria, N.; Rodriguez, R.C. Maternal Milk Concentration of Zinc, Iron, Selenium, and Iodine and Its Relationship to Dietary Intakes. Boil. Trace Elem. Res. 2008, 127, 6–15. [Google Scholar] [CrossRef]
- Mello-Neto, J.; Rondó, P.H.C.; Oshiiwa, M.; Morgano, M.A.; Zacari, C.Z.; dos Santos, M.L. Iron supplementation in pregnancy and breastfeeding and iron, copper and zinc status of lactating women from a human milk bank. J. Trop. Pediatr. 2012, 59, 140–144. [Google Scholar] [CrossRef] [Green Version]
- Peixoto, R.R.A.; Codo, C.R.B.; Sanches, V.L.; Guiraldelo, T.C.; Da Silva, F.F.; Ribessi, R.L.; Marba, S.T.M.; Cadore, S. Trace mineral composition of human breast milk from Brazilian mothers. J. Trace Elem. Med. Boil. 2019, 54, 199–205. [Google Scholar] [CrossRef]
- Casey, C.E.; Neville, M.C.; Hambidge, K.M. Studies in human lactation: Secretion of zinc, copper, and manganese in human milk. Am. J. Clin. Nutr. 1989, 49, 773–785. [Google Scholar] [CrossRef] [Green Version]
- Krachler, M.; Li, F.S.; Rossipal, E.; Irgolic, K. Changes in the concentrations of trace elements in human milk during lactation. J. Trace Elem. Med. Boil. 1998, 12, 159–176. [Google Scholar] [CrossRef]
- Zachara, B.A.; Pilecki, A. Selenium Concentration in the Milk of Breast-Feeding Mothers and its Geographic Distribution. Environ. Health Perspect. 2000, 108, 1043–1046. [Google Scholar] [CrossRef]
- Navarro-Blasco, Í.; Alvarez-Galindo, J. Selenium content of Spanish infant formulae and human milk: Influence of protein matrix, interactions with other trace elements and estimation of dietary intake by infants. J. Trace Elem. Med. Boil. 2004, 17, 277–289. [Google Scholar] [CrossRef] [Green Version]
- Özdemir, H.S.; Karadas, F.; Pappas, A.C.; Cassey, P.; Oto, G.; Tunçer, Ö. The Selenium Levels of Mothers and Their Neonates Using Hair, Breast Milk, Meconium, and Maternal and Umbilical Cord Blood in Van Basin. Boil. Trace Elem. Res. 2008, 122, 206–215. [Google Scholar] [CrossRef]
- Fernández-Sánchez, L.M.; Bermejo-Barrera, P.; Fraga, J.M.; Szpunar, J.; Łobiński, R. Determination of iodine in human milk and infant formulas. J. Trace Elem. Med. Boil. 2007, 21, 10–13. [Google Scholar] [CrossRef]
- Dasgupta, P.K.; Kirk, A.; Dyke, J.V.; Ohira, S.-I. Intake of Iodine and Perchlorate and Excretion in Human Milk. Environ. Sci. Technol. 2008, 42, 8115–8121. [Google Scholar] [CrossRef]
- Leung, A.M.; Pearce, E.N.; Hamilton, T.; He, X.; Pino, S.; Merewood, A.; Braverman, L.E. Colostrum iodine and perchlorate concentrations in Boston-area women: A cross-sectional study. Clin. Endocrinol. 2009, 70, 326–330. [Google Scholar] [CrossRef]
- Andersson, M.; Herter-Aeberli, I.; Wüst, N.; Piacenza, A.M.; Bucher, T.; Henschen, I.; Haldimann, M.; Zimmermann, M. The Swiss Iodized Salt Program Provides Adequate Iodine for School Children and Pregnant Women, but Weaning Infants Not Receiving Iodine-Containing Complementary Foods as well as Their Mothers Are Iodine Deficient. J. Clin. Endocrinol. Metab. 2010, 95, 5217–5224. [Google Scholar] [CrossRef] [PubMed] [Green Version]
- Andersen, S.L.; Møller, M.; Laurberg, P. Iodine Concentrations in Milk and in Urine During Breastfeeding Are Differently Affected by Maternal Fluid Intake. Thyroid 2014, 24, 764–772. [Google Scholar] [CrossRef] [PubMed] [Green Version]
- Mekrungcharas, T.; Kasemsup, R. Breast milk iodine concentrations in lactating mothers at Queen Sirikit National Institute of Child Health. J. Med Assoc. Thail. Chotmaihet Thangphaet 2014, 97, S115–S119. [Google Scholar]
- Jonsdottir, O.H.; Thorsdottir, I.; Hibberd, P.L.; Fewtrell, M.; Wells, J.; Palsson, G.I.; Lucas, A.; Gunnlaugsson, G.; Kleinman, R.E. Timing of the Introduction of Complementary Foods in Infancy: A Randomized Controlled Trial. Pediatrics 2012, 130, 1038–1045. [Google Scholar] [CrossRef] [PubMed] [Green Version]
- Domellöf, M. Iron requirements, absorption and metabolism in infancy and childhood. Curr. Opin. Clin. Nutr. Metab. Care 2007, 10, 329–335. [Google Scholar] [CrossRef]
- Hicks, P.D.; Zavaleta, N.; Chen, Z.; Abrams, S.A.; Lönnerdal, B. Iron Deficiency, but Not Anemia, Upregulates Iron Absorption in Breast-Fed Peruvian Infants. J. Nutr. 2006, 136, 2435–2438. [Google Scholar] [CrossRef]
- Dror, D.K.; Allen, L.H. Iodine in Human Milk: A Systematic Review. Adv. Nutr. 2018, 9, 347S–357S. [Google Scholar] [CrossRef] [Green Version]
- Kumpulainen, J.; Salmenperä, L.; Siimes, M.A.; Koivistoinen, P.; Perheentupa, J. Selenium status of exclusively breast-fed infants as influenced by maternal organic or inorganic selenium supplementation. Am. J. Clin. Nutr. 1985, 42, 829–835. [Google Scholar] [CrossRef]
- Dórea, J.G. Magnesium in Human Milk. J. Am. Coll. Nutr. 2000, 19, 210–219. [Google Scholar] [CrossRef]
- Kent, J.C.; Arthur, P.; Mitoulas, L.R.; Hartmann, P. Why calcium in breastmilk is independent of maternal dietary calcium and vitamin D. Breastfeed. Rev. Prof. Publ. Nurs. Mothers’ Assoc. Aust. 2009, 17, 5–11. [Google Scholar]
- Laskey, M.A.; Prentice, A.; Shaw, J.; Zachou, T.; Ceesay, S.M.; Vasquez-Velasquez, L.; Fraser, D.R. Breast-Milk Calcium Concentrations during Prolonged Lactation in British and Rural Gambian Mothers. Acta Paediatr. 1990, 79, 507–512. [Google Scholar] [CrossRef] [PubMed]
- Shehadeh, N.; Aslih, N.; Shihab, S.; Werman, M.J.; Sheinman, R.; Shamir, R. Human Milk Beyond One Year Post-partum: Lower Content of Protein, Calcium, and Saturated Very Long–chain Fatty Acids. J. Pediatr. 2006, 148, 122–124. [Google Scholar] [CrossRef] [PubMed]
- Arnaud, J.; Prual, A.; Preziosi, P.; Cherouvrier, F.; Favier, A.; Galan, P.; Hercberg, S. Effect of Iron Supplementation during Pregnancy on Trace Element (Cu, Se, Zn) Concentrations in Serum and Breast Milk from Nigerian Women. Ann. Nutr. Metab. 1993, 37, 262–271. [Google Scholar] [CrossRef] [PubMed]
- Emmett, P.; Rogers, I. Properties of human milk and their relationship with maternal nutrition. Early Hum. Dev. 1997, 49, S7–S28. [Google Scholar] [CrossRef]
- Dror, D.K.; Allen, L.H. Overview of Nutrients in Human Milk. Adv. Nutr. 2018, 9, 278S–294S. [Google Scholar] [CrossRef] [Green Version]
- Morton, J.A. The clinical usefulness of breast milk sodium in the assessment of lactogenesis. Pediatrics 1994, 93, 802–806. [Google Scholar]
- Alsina-Manrique, L.; Esteban, M.; Salvià, D.; Miracle, X.; Rodríguez-Miguélez, J.; Figueras, J.; Carbonell, X. Severe hypernatremic dehydration secondary to undetected lactation failure: Usefulness of sodium levels in breast milk. Clin. Pediatr. 2006, 45, 183–186. [Google Scholar] [CrossRef] [PubMed]
- Zaki, S.A.; Mondkar, J.; Shanbag, P.; Verma, R. Hypernatremic dehydration due to lactation failure in an exclusively breastfed neonate. Saudi J. Kidney Dis. Transplant. 2012, 23, 125–128. [Google Scholar]
- Powe, C.E.; Knott, C.D.; Conklin-Brittain, N. Infant sex predicts breast milk energy content. Am. J. Hum. Boil. 2010, 22, 50–54. [Google Scholar] [CrossRef] [PubMed]
- Leotsinidis, M.; Alexopoulos, A.; Kostopoulou-Farri, E. Toxic and essential trace elements in human milk from Greek lactating women: Association with dietary habits and other factors. Chemosphere 2005, 61, 238–247. [Google Scholar] [CrossRef] [PubMed]
- Vuori, E.; Mäkinen, S.M.; Kara, R.; Kuitunen, P. The effects of the dietary intakes of copper, iron, manganese, and zinc on the trace element content of human milk. Am. J. Clin. Nutr. 1980, 33, 227–231. [Google Scholar] [CrossRef] [PubMed] [Green Version]
- Debski, B.; Finley, D.; Picciano, M.F.; Lönnerdal, B.; Milner, J. Selenium Content and Glutathione Peroxidase Activity of Milk from Vegetarian and Nonvegetarian Women. J. Nutr. 1989, 119, 215–220. [Google Scholar] [CrossRef]
- Valent, F.; Horvat, M.; Mazej, D.; Stibilj, V.; Barbone, F. Maternal Diet and Selenium Concentration in Human Milk from an Italian Population. J. Epidemiol. 2011, 21, 285–292. [Google Scholar] [CrossRef] [Green Version]
- Hu, F.B. Dietary pattern analysis: A new direction in nutritional epidemiology. Curr. Opin. Lipidol. 2002, 13, 3–9. [Google Scholar] [CrossRef]
- Moser, P.B.; Reynolds, R.D.; Acharya, S.; Howard, M.P.; Andon, M.B.; Lewis, S.A. Copper, iron, zinc, and selenium dietary intake and status of Nepalese lactating women and their breast-fed infants. Am. J. Clin. Nutr. 1988, 47, 729–734. [Google Scholar] [CrossRef] [Green Version]
- Brätter, P.; Brätter, V.E.; Gawlik, D.; Alvarez, N.; Jaffé, W.F. Selenium in human monitors related to the regional dietary intake levels in Venezuela. J. Trace Elem. Med. Biol. 1993, 7, 111–112. [Google Scholar]

| Plasma Parameters | Ion Lenses (V) | Octopole Parameters (V) | |||
|---|---|---|---|---|---|
| RF Power (W) | 1550 | Extract 1 | 0 | OctP RF | 180 |
| Sample Depth | 8 | Extract 2 | −175 | OctP Bias | −18 |
| Carrier Gas (L/min) | 1.1 | Omega Bias | −100 | Reaction Cell (mL/min) | |
| Nebulizer Pump (rps) | 0.1 | Omega Lens | 12.6 | He Gas | 3.6 |
| S/C Temp (°C) | 2 | Cell Entrance | −40 | Detector Parameters | |
| Cell Exit | −60 | Discriminator (mV) | 4.5 | ||
| Deflect | 0.4 | Analog HV (V) | 1730 | ||
| Plate Bias | −60 | Pulse HV (V) | 954 | ||
| QP Bias | −15 | ||||
| Maternal Data | Mean | Median | SD | Min | Max |
|---|---|---|---|---|---|
| Pregnancy Time (weeks) | 39.91 | 40.00 | 1.29 | 36.00 | 42.29 |
| Maternal Age (years) | 35.50 | 35.00 | 3.99 | 27.00 | 46.00 |
| Maternal Height (m) | 1.65 | 1.65 | 0.05 | 1.53 | 1.77 |
| Maternal BMI (kg/m2) | 24.11 | 23.34 | 3.88 | 17.99 | 35.03 |
| Lactating time (months) | 8.02 | 3.72 | 10.43 | 0.77 | 58.97 |
| MD adherence (score) | 9.00 | 8.00 | 2.26 | 2.00 | 12.00 |
| AD adherence (score) | 3.87 | 4.00 | 1.52 | 0.00 | 7.00 |
| Infant gender: n ♂ (%)/n ♀ (%) | 33 (44.00)/42 (56.00) | C-section delivery (%) | 12.00 | ||
| Time lactation < 6 months (%) | 64.00 | Parity number 1st child (%) | 60.00 | ||
| Mineral | Authors, Year, Reference, Country | Mean | SD | Range | Units |
|---|---|---|---|---|---|
| Calcium | |||||
| Gross et al., 1980, [19], USA | 249.8 | mg/L | |||
| Fransson & Lonnerdal, 1983, [20], USA | 279 | 28.6 | mg/L | ||
| Dewey & Lonnerdal, 1983, [21], USA | 253.0 | mg/L | |||
| Garza et al., 1983, [22], USA | 213.4 | mg/L | |||
| Feeley et al., 1983, [23], USA | 262.0 | mg/L | |||
| Dewey et al., 1984, [24], USA | 229.4 | 40.1 | mg/L | ||
| Butte et al., 1984, [25], USA | 154.9 | mg/L | |||
| WHO & IAEA, 1989, [26] | 220.0–300.0 | mg/L | |||
| Allen et al., 1991, [27], USA | 280.7 | 20.1 | mg/L | ||
| Dorea et al., 1999, [28], Gambia | 208.93 | 24 | mg/L | ||
| Friel et al., 1999, [29], USA | 279.6 | mg/L | |||
| Yamawaki et al., 2005, [30], Japan | 249.0 | 16.52 | mg/L | ||
| Mastroeni et al., 2006, [31], Brazil | 250 | 31.0 | mg/L | ||
| Thacher et al., 2006, [32], Nigeria | 186 | 41 | mg/L | ||
| Shi et al., 2011, [33], China | 334.00 | 70.00 | mg/L | ||
| Björklund et al., 2012, [34], Sweden | 305.00 | 45.00 | mg/L | ||
| Andrade et al., 2104, [35] Brazil | 142.30 | 21.60 | mg/L | ||
| Klein et al., 2017, [36], USA | 268.7 | 59.34 | mg/L | ||
| Klein et al., 2017, [36], Namibia | 143.83 | 64.67 | mg/L | ||
| Klein et al., 2017, [36], Poland | 227.06 | 36.72 | mg/L | ||
| Klein et al., 2017, [36], Argentina | 231.79 | 37.47 | mg/L | ||
| Aumeistere et al., 2017, [37], Latvia | 227.52–398.34 | mg/L | |||
| Perrin et al., 2017, [38], USA | 194.0 | mg/L | |||
| Butts et al., 2018, [39], New Zealand | 275–309 | mg/L | |||
| Sabatier et al., 2019, [40], Switzerland | 286 | 47 | mg/L | ||
| Daniels et al., 2019, [41], Indonesia | 247–300 | mg/L | |||
| Present study, 2019, NW Spain | 279.99 | 136.44–463.26 | mg/L | ||
| Phosphorus | |||||
| Gross et al., 1980, [19], USA | 150.8 | mg/L | |||
| Feeley et al., 1983, [23], USA | 133.0 | mg/L | |||
| Butte et al., 1984, [25], USA | 144.4 | mg/L | |||
| Mastroeni et al., 2006, [31], Brazil | 137.0 | 20.0 | mg/L | ||
| Thacher et al., 2006, [32], Nigeria | 126.81 | 32.99 | mg/L | ||
| Sabatier et al., 2019, [40], Switzerland | 148 | 30 | mg/L | ||
| Daniels et al., 2019, [41], Indonesia | 119–145 | mg/L | |||
| Present study, 2019, NW Spain | 126.46 | 73.00–219.57 | mg/L | ||
| Magnesium | |||||
| Gross et al., 1980, [19], USA | 26.2 | mg/L | |||
| Fransson & Lonnerdal, 1983, [20], USA | 35.04 | 2.46 | mg/L | ||
| Dewey & Lonnerdal, 1983, [21] USA | 31.7 | mg/L | |||
| Feeley et al., 1983, [23], USA | 50 | mg/L | |||
| Dewey et al., 1984, [24], USA | 31.2 | 5.6 | mg/L | ||
| Butte et al., 1984, [25] USA | 34.6 | mg/L | |||
| WHO & IAEA, 1989, [26] | 29.00–38.00 | mg/L | |||
| Allen et al., 1991, [27], USA | 38.7 | 2.4 | mg/L | ||
| Friel et al., 1999, [29], USA | 29.1 | mg/L | |||
| Yamawaki et al., 2005, [30], Japan | 28.33 | 4.16 | mg/L | ||
| Mastroeni et al., 2006, [31], Brazil | 29.9 | 5.00 | mg/L | ||
| Shi et al., 2011, [33], China | 37.00 | 10.00 | mg/L | ||
| Björklund et al., 2012, [34], Sweden | 28.00 | 4.80 | mg/L | ||
| Andrade et al., 2104, [35], Brazil | 39.80 | 4.20 | mg/L | ||
| Aumeistere et al., 2017, [37], Latvia | 25.73–49.52 | mg/L | |||
| Butts et al., 2018, [39], New Zealand | 10.2–30.8 | mg/L | |||
| Sabatier et al., 2019, [40], Switzerland | 32 | 7 | mg/L | ||
| Daniels et al., 2019, [41], Indonesia | 26.3–35.9 | mg/L | |||
| Present study, 2019, NW Spain | 33.22 | 19.86–50.83 | mg/L | ||
| Electrolyte | Authors, Year, Reference, Country | Mean | SD | Range | Units |
|---|---|---|---|---|---|
| Sodium | |||||
| Gross et al., 1980, [19], USA | 215.3 | mg/L | |||
| Dewey & Lonnerdal, 1983, [21], USA | 185.9 | mg/L | |||
| Garza et al., 1983, [22], USA | 131.9 | mg/L | |||
| Dewey et al., 1984, [24], USA | 94.6 | 51.4 | mg/L | ||
| Butte et al., 1984, [25], USA | 154.9 | mg/L | |||
| WHO & IAEA, 1989, [26] | 90.0–130.0 | mg/L | |||
| Allen et al., 1991, [27], USA | 154.8 | 28.50 | mg/L | ||
| Wack et al., 1997, [44], USA | 144.5–124.5 | mg/L | |||
| Yamawaki et al., 2005, [30], Japan | 120.67 | 16.50 | mg/L | ||
| Mastroeni et al., 2006, [31], Brazil | 205.0 | 156.00 | mg/L | ||
| Björklund et al., 2012, [34], Sweden | 217.00 | 77.00 | mg/L | ||
| Roy et al., 2014, [45], India | 527.40 | 199.00 | mg/L | ||
| Aumeistere et al., 2017, [37], Latvia | 58.56–256.38 | mg/L | |||
| Perrin et al., 2017, [38], USA | 67.9 | mg/L | |||
| Sabatier et al., 2019, [40], Switzerland | 235.0 | 237 | mg/L | ||
| Daniels et al., 2019, [40], Indonesia | 101–193 | mg/L | |||
| Present study, 2019, NW Spain | 176.94 | 44.75–942.67 | mg/L | ||
| Potasium | |||||
| Gross et al., 1980, [19], USA | 582.5 | mg/L | |||
| Dewey & Lonnerdal, 1983, [21], USA | 457.2 | mg/L | |||
| Dewey et al., 1984, [24], USA | 397.7 | 71.0 | mg/L | ||
| WHO & IAEA, 1989 [26] | 410.0–550.0 | mg/L | |||
| Allen et al., 1991 [27], USA | 542.9 | 48.2 | mg/L | ||
| Wack et al., 1997, [44], USA | 504.4–448.8 | mg/L | |||
| Yamawaki et al., 2005, [30], Japan | 437.33 | 7.57 | mg/L | ||
| Mastroeni et al., 2006, [31], Brazil | 462 | 84 | mg/L | ||
| Shi et al., 2011, [33], China | 540.00 | 146 | mg/L | ||
| Björklund et al., 2012, [34], Sweden | 633.00 | 40 | mg/L | ||
| Aumeistere et al., 2017, [37], Latvia | 445.33–736.71 | mg/L | |||
| Perrin et al., 2017, [38], USA | 363.7 | mg/L | |||
| Sabatier et al., 2019, [40], Switzerland | 575 | 92 | mg/L | ||
| Daniels et al., 2019, [41], Indonesia | 402–499 | mg/L | |||
| Present study, 2019, NW Spain | 456.62 | 342.98–622.25 | mg/L | ||
| Mineral | Authors, Year, Reference, Country | Mean | SD | Range | Units |
|---|---|---|---|---|---|
| Iron | |||||
| Fransson & Lonnerdal, 1983, [20], USA | 0.36 | 0.19 | mg/L | ||
| Dewey & Lonnerdal, 1983, [21], USA | 0.2 | mg/L | |||
| Garza et al., 1983, [22], USA | 0.3 | mg/L | |||
| Feeley et al., 1983, [48], USA | 0.76 | mg/L | |||
| Dewey et al., 1984, [24], USA | 0.2 | 0.1 | mg/L | ||
| Gunshin et al., 1985, [49], Japan | 0.32 | 0.16 | mg/L | ||
| WHO & IAEA, 1989 [26] | 0.07–0.35 | mg/L | |||
| Domellöf et al., 2004, [50], Honduras | 0.29 | 0.21 | mg/L | ||
| Yamawaki et al., 2005, [30], Japan | 1.19 | 2.51 | mg/L | ||
| Mastroeni et al., 2006, [31], Brazil | 0.90 | 0.5 | mg/L | ||
| Hannan et al., 2009, [51], USA | 0.5 | 1.0 | mg/L | ||
| Shi et al., 2011, [33], China | 0.50 | 0.2 | mg/L | ||
| Mello-Neto et al., 2012, [52], Brazil | 0.3 | 0.2 | mg/L | ||
| Björklund et al., 2012, [34], Sweden | 0.33 | 0.19 | mg/L | ||
| Roy et al., 2014, [45], India | 0.162 | 0.06 | mg/L | ||
| Andrade et al., 2104, [35], Brazil | 0.27 | 0.4 | mg/L | ||
| Klein et al., 2017, [36], USA | 1.27 | 0.26 | mg/L | ||
| Klein et al., 2017, [36], Namibia | 1.53 | 0.86 | mg/L | ||
| Klein et al., 2017, [36] Poland | 1 | 0.15 | mg/L | ||
| Klein et al., 2017, [36], Argentina | 0.99 | 0.21 | mg/L | ||
| Aumeistere et al., 2017, [37], Latvia | 0.31 | mg/L | |||
| Perrin et al., 2017, [38], USA | 0.20 | mg/L | |||
| Sabatier et al., 2019, [40], Switzerland | 0.44 | 0.26 | mg/L | ||
| Daniels et al., 2019, [41], Indonesia | 0.33 | mg/L | |||
| Peixoto et al., 2019, [53] Brazil | 0.01–0.52 | mg/L | |||
| Present study, 2019, NW Spain | 0.23 | 0.06–0.75 | mg/L | ||
| Selenium | |||||
| WHO & IAEA, 1989 [26] | 13.0–33.0 | µg/L | |||
| Casey et al., 1989, [54], USA | 7–20.0 | µg/L | |||
| Krachler et al., 1998, [55], Austria | 17 | µg/L | |||
| Zachara & Pilecki, 2000, [56], Poland | 8.81–11.58 | µg/L | |||
| Navarro-Blasco & Alvarez-Galindo, 2004, [57], Spain | 16.3 | 4.7 | µg/L | ||
| Yamawaki et al., 2005, [30], Japan | 15.3 | 2.5 | µg/L | ||
| Özdemir et al., 2008, [58], Turkey | 68.63 | 7.78 | µg/L | ||
| Hannan et al., 2009, [51], USA | 15.9 | 4.1 | µg/L | ||
| Shi et al., 2011, [33], China | 15.0 | 6.0 | µg/L | ||
| Björklund et al., 2012, [34], Sweden | 13.00 | 2.6 | µg/L | ||
| Butts et al., 2018, [39], New Zealand | 13–16 | µg/L | |||
| Sabatier et al., 2019, [40], Switzerland | 15.0 | 4.2 | µg/L | ||
| Daniels et al., 2019, [41], Indonesia | 8.7–12.9 | µg/L | |||
| Peixoto et al., 2019, [53] Brazil | 2.5–70.6 | µg/L | |||
| Present study, 2019, NW Spain | 15.13 | 4.37–148.97 | µg/L | ||
| Iodine | |||||
| Fernández Sánchez et al., 2007, [59], Spain | 144 | 93.2 | µg/L | ||
| Dasgupta et al., 2008, [60], USA | 110 | µg/L | |||
| Leung et al., 2009, [61], USA | 51.4 | µg/L | |||
| Hannan et al., 2009, [51], USA | 47.8 | 17.1 | µg/L | ||
| Andersson et al., 2010, [62], Switzerland | 49 | µg/L | |||
| Andersen et al., 2014, [63], Denmark | 83 | µg/L | |||
| Mekrungcharas et al., 2014, [64], Thailand | 129.7 | µg/L | |||
| Sabatier et al., 2019, [40] Switzerland | 87 | 41 | µg/L | ||
| Present study, 2019, NW Spain | 95.44 | 11.25–247.63 | µg/L | ||
| Mineral | Statistic | LT < 6 Months (n = 48) | LT ≥ 6 Months (n = 27) | BMI < 25 kg/m2 (n = 41) | BMI ≥ 25 kg/m2 (n = 34) | Infant Gender ♂ (n = 33) | Infant Gender ♀ (n = 42) |
|---|---|---|---|---|---|---|---|
| Na (mg/L) | Mean | 133.53 | 256.37 | 132.37 * | 205 * | 212.39 * | 131.30 * |
| SD | 55.16 | 242.31 | 66.72 | 156.08 | 200.60 | 30 | |
| Range | 44.75–303.88 | 46.81–942.67 | 44.75–371.21 | 69.71–942.67 | 44.75–389.21 | 68.04–942.67 | |
| K (mg/L) | Mean | 465.37 | 438.03 | 449.00 | 476.86 | 450.42 | 463.60 |
| SD | 64.57 | 60.29 | 58.49 | 77.01 | 65.54 | 282.96 | |
| Range | 345.57–622.25 | 342.98–550.27 | 345.57–579.69 | 342.98–622.25 | 353.34–622.25 | 342.98–599.71 | |
| Ca (mg/L) | Mean | 295.15 * | 251.94 * | 281.93 | 275.09 | 282.96 | 278.69 |
| SD | 55.18 | 58.24 | 59.72 | 56.90 | 63.94 | 55.28 | |
| Range | 196.1–463.26 | 136.44–383.5 | 192.60–463.26 | 136.44–382.50 | 197.81–381.38 | 136.44–463.26 | |
| P (mg/L) | Mean | 126.79 | 127.02 | 133.38 | 120 | 122.38 * | 132.66 * |
| SD | 26.56 | 34.10 | 29.47 | 30.07 | 32.35 | 23.44 | |
| Range | 79.82–177.95 | 73–219.57 | 83.93–210.57 | 73.00–177.95 | 82.50–177.95 | 73–219.57 | |
| Ca/P (ratio) | Mean | 2.39 * | 2.07 * | 2.17 | 2.39 | 2.41 * | 2.13 * |
| SD | 0.55 | 0.54 | 0.55 | 0.60 | 0.65 | 0.42 | |
| Range | 1.34–4.44 | 1.16–3.36 | 1.29–4.44 | 1.16–3.44 | 1.29–3.14 | 1.16–4.44 | |
| Mg (mg/L) | Mean | 32.96 | 33.63 | 33.38 | 33.20 | 34.56 | 31.78 |
| SD | 6.82 | 5.75 | 7.08 | 4.85 | 6.43 | 6.28 | |
| Range | 19.86–50.83 | 20.77–44.78 | 19.86–50.83 | 20.77–44.78 | 19.86–44.78 | 20.77–50.83 | |
| Fe (mg/L) | Mean | 0.22 | 0.24 | 0.22 | 0.24 | 0.21 | 0.24 |
| SD | 0.10 | 0.17 | 0.09 | 0.15 | 0.10 | 0.14 | |
| Range | 0.10–0.45 | 0.06–0.75 | 0.06–0.42 | 0.06–0.75 | 0.06–0.45 | 0.06–0.74 | |
| Se (µg/L) | Mean | 11.41 | 21.99 | 11.60 | 12.07 | 18.95 | 10.66 |
| SD | 5.00 | 33.55 | 5.65 | 4.85 | 27.44 | 4.21 | |
| Range | 4.37–25.85 | 6.18–148.97 | 4.37–28.13 | 5.30–148.97 | 4.37–21.14 | 6.18–148.97 | |
| I (µg/L) | Mean | 110.92 * | 75.27 * | 104.83 | 97 | 96.03 | 99.16 |
| SD | 53.61 | 61.61 | 62.09 | 53.36 | 68.01 | 52.72 | |
| Range | 26.71–233.19 | 11.25–247.63 | 11.25–247.63 | 26.71–233.19 | 26,71–247.63 | 11.25–233.19 |
| Breast Milk Minerals (Dependent Variable) | Maternal Characteristics (Independent Variables) | ß | ß SE | ß C.I. (95%) | p | Adjusted R2 | ANOVA for the Model (p) |
|---|---|---|---|---|---|---|---|
| Na | Constant | 2.77 | 0.53 | 1.72–3.82 | 0.000 | 0.231 | 0.000 |
| Lactating time | 0.20 | 0.06 | 0.09–0.31 | 0.001 | |||
| Newborn sex | 0.38 | 0.13 | 0.13–0.64 | 0.003 | |||
| BMI | 0.04 | 0.02 | 0.01–0.07 | 0.022 | |||
| K | Constant | 402.49 | 62.70 | 277.50–527.49 | 0.000 | 0.170 | 0.000 |
| Lactating time | −25.59 | 6.66 | −38.85–−12.32 | 0.000 | |||
| Maternal age | 5.11 | 1.84 | 1.44–8.77 | 0.007 | |||
| Ca | Constant | 359.64 | 31.32 | 297.22–422.06 | 0.000 | 0.072 | 0.011 |
| Lactating time | −16.00 | 6.15 | −28.26–−3.75 | 0.011 | |||
| Ca/P | Constant | 3.17 | 0.33 | 2.52–3.83 | 0.000 | 0.099 | 0.006 |
| Lactating time | −0.18 | 0.06 | −0.31–−0.06 | 0.006 | |||
| Mg | Constant | 19.08 | 6.61 | 5.91–32.26 | 0.005 | 0.047 | 0.035 |
| Maternal age | 0.40 | 0.19 | 0.03–0.77 | 0.035 | |||
| Fe | Constant | 0.15 | 0.03 | 0.09–0.22 | 0.000 | 0.046 | 0.047 |
| AD score | 0.05 | 0.02 | 0.00–0.10 | 0.047 | |||
| Se | Constant | −14.31 | 7.61 | −29.52–0.90 | 0.065 | 0.148 | 0.005 |
| BMI | 0.60 | 0.21 | 0.19–1.01 | 0.005 | |||
| MD score | 4.88 | 2.30 | 0.28–9.47 | 0.038 | |||
| Newborn sex | 3.01 | 1.48 | 0.06–5.97 | 0.046 |
© 2020 by the authors. Licensee MDPI, Basel, Switzerland. This article is an open access article distributed under the terms and conditions of the Creative Commons Attribution (CC BY) license (http://creativecommons.org/licenses/by/4.0/).
Share and Cite
Sánchez, C.; Fente, C.; Barreiro, R.; López-Racamonde, O.; Cepeda, A.; Regal, P. Association between Breast Milk Mineral Content and Maternal Adherence to Healthy Dietary Patterns in Spain: A Transversal Study. Foods 2020, 9, 659. https://doi.org/10.3390/foods9050659
Sánchez C, Fente C, Barreiro R, López-Racamonde O, Cepeda A, Regal P. Association between Breast Milk Mineral Content and Maternal Adherence to Healthy Dietary Patterns in Spain: A Transversal Study. Foods. 2020; 9(5):659. https://doi.org/10.3390/foods9050659
Chicago/Turabian StyleSánchez, Cristina, Cristina Fente, Rocío Barreiro, Olga López-Racamonde, Alberto Cepeda, and Patricia Regal. 2020. "Association between Breast Milk Mineral Content and Maternal Adherence to Healthy Dietary Patterns in Spain: A Transversal Study" Foods 9, no. 5: 659. https://doi.org/10.3390/foods9050659