Article

The Relationship between In Vitro and In Vivo Starch Digestion Kinetics of Breads Varying in Dietary Fibre

by
Patricia Rojas-Bonzi
,
Cecilie Toft Vangsøe
,
Kirstine Lykke Nielsen
,
Helle Nygaard Lærke
,
Mette Skou Hedemann
and
Knud Erik Bach Knudsen
*
Department of Animal Science, Aarhus University, DK-8830 Tjele, Denmark
*
Author to whom correspondence should be addressed.
Foods 2020, 9(9), 1337; https://doi.org/10.3390/foods9091337
Submission received: 29 August 2020 / Revised: 16 September 2020 / Accepted: 18 September 2020 / Published: 22 September 2020
(This article belongs to the Special Issue Advanced Research in Food Digestion)

Abstract

:
The relationship between in vitro and in vivo starch digestion kinetics was studied in portal vein catheterised pigs fed breads varying in dietary fibre (DF) content and composition. The breads were a low DF white wheat bread, two high DF whole grain rye breads without and with whole kernels and two experimental breads with added arabinoxylan or oat β-glucan concentrates, respectively. In vitro, samples were collected at 0, 5, 10, 15, 30, 60, 120 and 180 min and the cumulative hydrolysis curve for starch was modelled, whereas the in vivo cumulative absorption models for starch were based on samples taken every 15 min up to 60 min and then every 30 min up to 240 min. The starch hydrolysis rate in vitro (0.07 to 0.16%/min) was far higher than the rate of glucose appearance in vivo (0.017 to 0.023% absorbed starch/min). However, the ranking of the breads was the same in vitro and in vivo and there was a strong relationship between the kinetic parameters.

Graphical Abstract

1. Introduction

Bread is a stable carbohydrate rich food consumed in various forms around the world (white wheat bread, brown bread, whole grain breads, bran enriched breads, etc.). In Denmark, bread accounts for ~17% of dietary energy intake [1] and along with other cereal products, for ~60% of the intake of dietary fibre (DF) [2]. It is known that the glycaemic response expressed in the glycaemic index (GI) varies widely depending on the type of foods. GI is a system for the exchange of carbohydrates between foods and is defined as the area under the blood glucose curve following the ingestion of a test food, expressed as a percentage of the corresponding area following an equivalent load of a reference carbohydrate, either glucose or white wheat bread [3]. In an extensive review of Atkinson et al. [4] the GI of breads varied from 34 for barley bread with 80% scalded intact kernels to 87–89 for white flour breads from different countries. The variability reflects different rates of starch digestion, where the porous structure of white wheat bread makes it easily destructed in the mouth, stomach and small intestine [5], leading to the high glycaemic response. On the other hand, starch from bread containing intact kernels is digested more slowly due to the intact botanical structure that protects encapsulated starch in the kernel against hydrolysis by enzymes in the gastrointestinal tract [6].
The presence of DF in cereals, either occurring naturally or added as concentrates, can influence the glycaemic response due to its physicochemical properties in the gastrointestinal tract. Soluble DF may form viscous solutions or gels in the stomach that delay gastric emptying and physically inhibit the rate of digestion and absorption of starch in the small intestine, (see review of Geman et al. [7]) thereby causing lower postprandial glucose and insulin responses [8,9]. The main soluble DF in oats and barley are (1→3)(1→4)-β-d-glucan (referred to as β-glucan), which has been approved by the Food and Drug Administration in the US [10] and the European Food Safety Authorities in the European Union [11] for health claims. In rye and wheat, arabinoxylan is the main soluble DF component and concentrates of arabinoxylan have been shown to reduce both glucose and insulin responses [8,12], similar to that of β-glucan [9,13].
The glycaemic response is related to the rate of starch digestion in the intestine and the GI values of cereal products have been positively and negatively related to rapidly available glucose and slowly available glucose, respectively, determined in vitro [14,15]. In the present study, we used a modification of the in vitro model for the classification of nutritionally important starch fractions [16] which has been applied to model the portal appearance of glucose in pigs [17]. In the current study, the in vitro procedure [17] was further modified by sampling more frequently (0, 5, 10, 15, 30 and 60 min compared to 0, 20, 40 and 60 min) the first 60 min and restricted the total length of incubation to 180 min rather than 360 min. The main objective of this investigation was to study the in vitro digestion kinetics of breads varying in DF content and composition. In order to evaluate the reliability of the in vitro assay as a predictor of in vivo events, in vivo data from a study with portal vein catheterised pigs [18] fed the actual breads were used.

2. Materials and Methods

2.1. Breads

The breads studied were kept frozen from a previous in vivo kinetic study with portal vein catheterised pigs [18]. They consisted of 5 breads—low DF white wheat bread (WWB), two high DF whole grain breads provided without (WRB) and with whole kernels (WRBK) and two experimental high DF breads based on wheat flour with arabinoxylan concentrate (AXB) or oat β-glucan (BGB). WWB, WRB and WRBK were commercial breads whereas AXB and BGB were the experimental breads prepared specifically for the project; for more details of the breads, see Christensen et al. [18]. The chemical composition of the breads is shown in Table 1.

2.2. Chemical Analysis

The breads were freeze-dried and ground to a particle size less than 0.5 mm to make the samples homogenous for chemical analyses. All analyses were performed in duplicate. Dry matter (DM) was determined by drying to a constant weight at 103 °C for 20 h, ash was analysed by the AOAC method (923.03; AOAC) [19], protein (N × 6.25) by element analysis according to the DUMAS method [20], and fat according to the Stoldt procedure [21]. β-glucan was analysed by the enzymatic-colorimetric method of McCleary and Glennie-Holmes [22], the Klason lignin as described by Theander and Åman [23], and the low molecular weight sugars as described by Kasprzak et al. [24]. Starch and non-starch polysaccharides (NSP) were analysed essentially as described by Bach Knudsen [25]; 2 M H2SO4 for 1 h was used instead of 1 M H2SO4 for 2 h for the NSP analysis. The content of non-digestible carbohydrates (NDC) was determined by direct acid hydrolysis without starch removal and alcohol precipitation and NDC calculated by the subtraction of the starch content. The content of low molecular weight ((LMW) NDC) was calculated as
LMW NDC = total carbohydrates − NSP − starch
The content of resistant starch (RS) in the breads was calculated as
RS = NSPglucose − (cellulose + β-glucan)

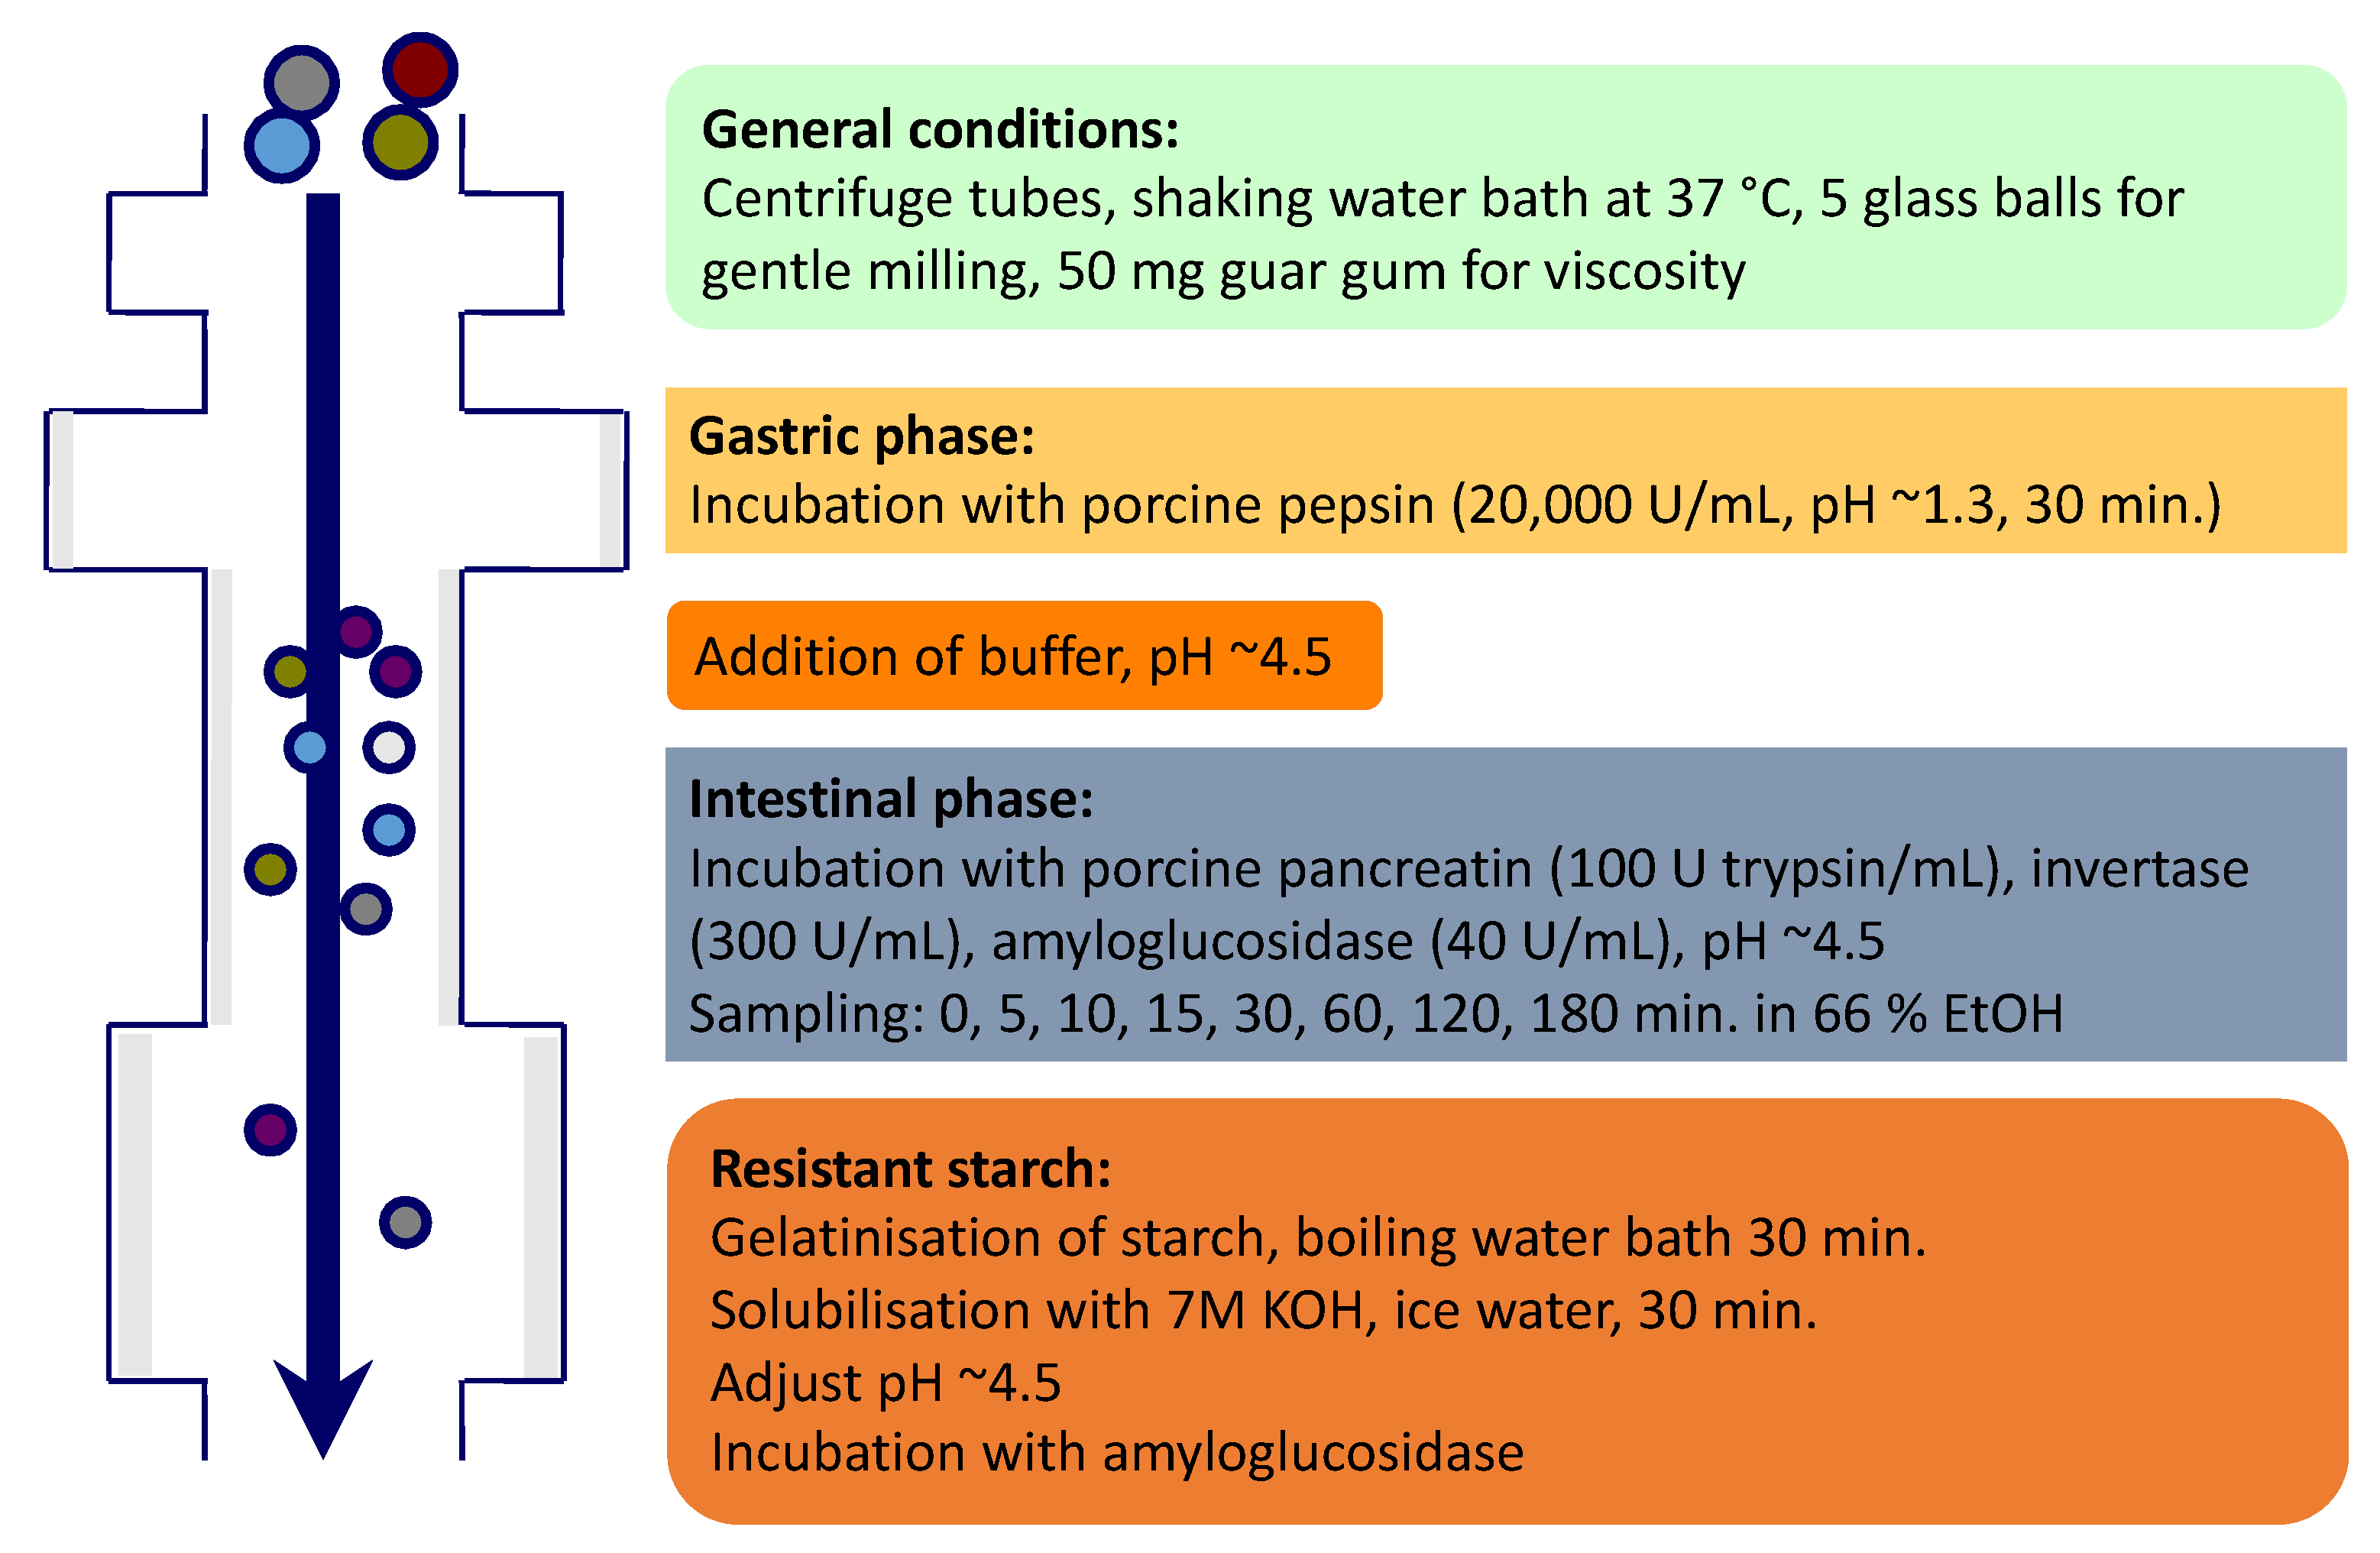
2.3. In Vitro Starch Digestion

A modification of the in vitro starch digestion assay of Vangsøe et al. [17] and Englyst et al. [16] was used (Figure 1). Sampling was performed at 0, 5, 10, 15, 30, 60,120 and 180 min. The idea of sampling every 5 min at the beginning was to better understand the kinetics of the digestion in the early phase of the digestion. The total incubation time was chosen to be 180 min, to ensure a full digestion of the breads.
All the reactions and sample preparations were performed in Greiner 50 mL centrifuge tubes (In vitro, Fredensborg, Denmark). Before the analysis, the frozen beads (stored at −20 °C) were partially defrosted and ground (Moulinex Coffee grinder A848, Moulinex, France) for 20 s at the same speed and constant rhythm. The in vitro analyses were performed in triplicates by weighing 800 mg breads (245–360 mg of starch) into the centrifuge tubes and 50 mg guar gum (Sigma G-4129, Sigma-Aldrich, Brøndby, Denmark) to ensure similar viscosity in all the samples. Potato starch (Merck CAT No 1252, Hellerup, Denmark) was used as a reference. Glucose standards (Merck Cat No.8337, Merck Hellerup, Denmark, for 0, 10 and 30 g/Glucose/L), dissolved in 0.1 M sodium acetate buffer (Merck Cat No. 6268, Hellerup, Denmark) with 4 mM CaCl2 (Merck Cat No 2382, Hellerup, Denmark) were prepared in duplicates, except the blank standard which was prepared in singular.
All samples received 5 glass balls to enhance agitation and provide grinding action. Initially, the samples were incubated horizontally in a 10 mL Pepsin solution (Sigma P-7000, Brøndby, Denmark, with 50 mg of Pepsin dissolved on 10 mL 0.05 M HCl) for 30 min in a water bath at 37 °C to mimic gastric digestion. After that, 10 mL of 0.25 M sodium acetate buffer was added to neutralize the acidity, and the samples were incubated for 10 min under the same conditions. In an arranged scheme for precise timing in the collection points, an enzyme mix containing Pancreatin (Sigma P 7545, Brøndby, Denmark), amyloglucosidase (EC 3.2.1.3. Megazyme, Wicklow, Ireland, 3260 U/mL) and Invertase (EC 3.2.1.26, Megazyme, Wicklow, Ireland, 200 U/mL) was added as described by Kasprzak et al. [26]. Incubation was carried in a shaking water bath at 160 strokes/min with a stroke length of 35 mm to mimic peristaltic and segmenting movements, at 37 °C. At each sampling point, a 0.5 mL aliquot was taken out and transferred to a centrifuge tube with 35 mL of 66% ethanol to stop enzymatic digestion. Once the incubation period was over after the last sampling, samples were removed from the water bath to proceed to total starch determination. Samples were first mixed and incubated in a boiling water bath for 30 min to achieve gelatinization, then to an ice-water bath (≤5 °C) for 20 min. After cooling, 10 mL of 7 M potassium hydroxide (Merck Cat No.5000, Hellerup, Denmark) was added and the samples were again placed horizontally on an ice-water bath for 30 min to disperse any retrograded starch. After that, 1 mL of each sample was transferred to a tube containing 10 mL of 0.5 M acetic acid with 4 mM CaCl2. To hydrolyse the starch to glucose, 200 µL of amyloglucosidase (EC 3.2.1.3, Megazyme, Wicklow, Ireland, 408 U/mL) diluted in 5 mL of water was added to each sample and incubated in a water bath at 70 °C for 30 min. After the 30 min, the samples were placed in boiling water for 10 min, diluted in 35 mL of water and centrifuged at 2980× g for 10 min. The timed aliquots in the 66% ethanol solution were centrifuged at 2980× g for 10 min before glucose determination using a glucose oxidase kit (GODPOD, K-GLUC, Megazyme, Wicklow, Ireland) after adding 260 µL of GOD-POD to 25 µL of the sample in a microplate and incubated for 20 min in a 40 °C oven before measuring in a plate-reader (Plate Count Reader, Bio-tek EL808i, Bad Friedrichshall, Germany) at 510 nm.
The content of free glucose was determined separately, by weighting duplicated samples of 500 mg into a centrifuge tube, adding 25 mL of acetate buffer (0.1 M at pH 5.0) and incubating for 60 min in a water bath at 65 °C. After cooling to room temperature, the samples were centrifuged at 2980× g for 10 min and glucose was determined in a coupled reaction with NADP+ as described by Larsson and Bengtsson [27].

2.4. Reference In Vivo Data

The in vivo data were obtained from the study of Christensen et al. [18] where the glycaemic effects of breads high in DF were compared to a low-DF white wheat bread (WWB) in porto-arterial catheterised pigs. In brief, the pigs were fed each of the five experimental breads on separate days in a randomized 5 × 6 incomplete crossover design with washout periods in between to have 6 observations per bread. On the sampling days (Monday and Thursday) the morning meal was replaced with a pulse dose of one of the breads portioned to give approx. 200 g of available carbohydrate to be eaten within 15 min. For further details, see the protocol described by Christensen et al. [18].

2.5. Calculations and Statistical Analysis

The proportion of hydrolysed starch (%) over time in vitro was obtained from the released glucose multiplied by a factor of 0.9 to convert to anhydro sugars:
Hydrolysed   starch = ( C t C 0 ) × 0.9 TS   × 100
where Ct is the glucose released at time t, C0 is the glucose released at time 0, and TS is total starch. The hydrolysis of starch in the time frames 0–5 min, 5–10 min and 10–15 min were calculated by taking the cumulative starch hydrolysed at the end of the periods, at 5, 10 and 15 min, and subtracting the cumulated starch at the start, 0, 5 and 10 min, respectively.
The absorbed starch in vivo was calculated based on absorbed glucose to the portal vein, as described by [18] and converted to starch by the factor 0.9:
Absorbed   starch   =   ( Cp Ca ) × F ( dt ) × 0.9 TS   ×   100
Q =   0 t 240 q
where q is the amount of starch absorbed within the time period dt, Cp is the concentration of glucose in the portal vein, Ca is the concentration of glucose in the mesenteric artery, F is the blood flow in the portal vein at time period dt, Q is the cumulative amount of starch absorbed from t0 to t300 and TS is the total starch.
The data from the in vitro studies were analysed by a one-way analysis of variance model for each time point of the hydrolysis curve and for the generated variable:
Yij = μ + αi + εij
where μ is the overall mean, αi is the effect of diet (i.e., WWB, WRB, WRBK, AXB, BGB) and εij describes the random error. Levels of significance were reported as being significant when p < 0.05.
The data from the in vivo study were analysed by a two-way analysis of variance model for each time point of the hydrolysis curve and for the generated variable:
Yijk = μ + αi + βj + εijk
where μ is the overall mean, αi is the effect of diet (i.e., WWB, WRB, WRBK, AXB, BGB), βj the effect of the pig and εijk describes the random error. Levels of significance were reported as being significant when p < 0.05.
The relationship between the cumulated hydrolysis of starch in vitro and time was described by a mechanistic growth model:
Y = α (1 − βe−cT)
where Y is the dependent variable (cumulated starch hydrolysis at time T), α is the asymptotic value, c the growth rate, β the scale and T is the time.
The relationship between the cumulated hydrolysis of starch in vivo and time was described by a Gomperts 3P model:
Y = α e e β ( T c )
where y is the dependent variable (cumulated starch absorption at time T), α the asymptotic value, β the growth rate, c the inflection point, and T is time.
The relationship between the k values obtained in vitro and in vivo was analysed by a linear regression model:
Yij = μ + βi × X+ εij
where μ is the intercept, βi is the slope and εij describes the random error.
All statistical analyses were carried out using JMP®, Version 13.2, (SAS Institute Inc., Cary, NC, USA).

3. Results

3.1. Dietary Composition

The WWB bread had the highest total starch content (711 g/kg DM), whereas the content was lower in all high DF breads (514–612 g/kg DM) (Table 1). The breads also contained 23–58 g/kg of sugars. Total DF was 77 g/kg DM in the WWB and 199–220 g/kg DM in the high DF breads, which also had higher contents of soluble DF (50–86 g/kg DM) than the low DF bread. The type of total and soluble DF, however, varied greatly between the high DF breads with BGB being high in total and soluble β-glucan and WRB, WRBK and AXB being high in total and soluble arabinoxylan.

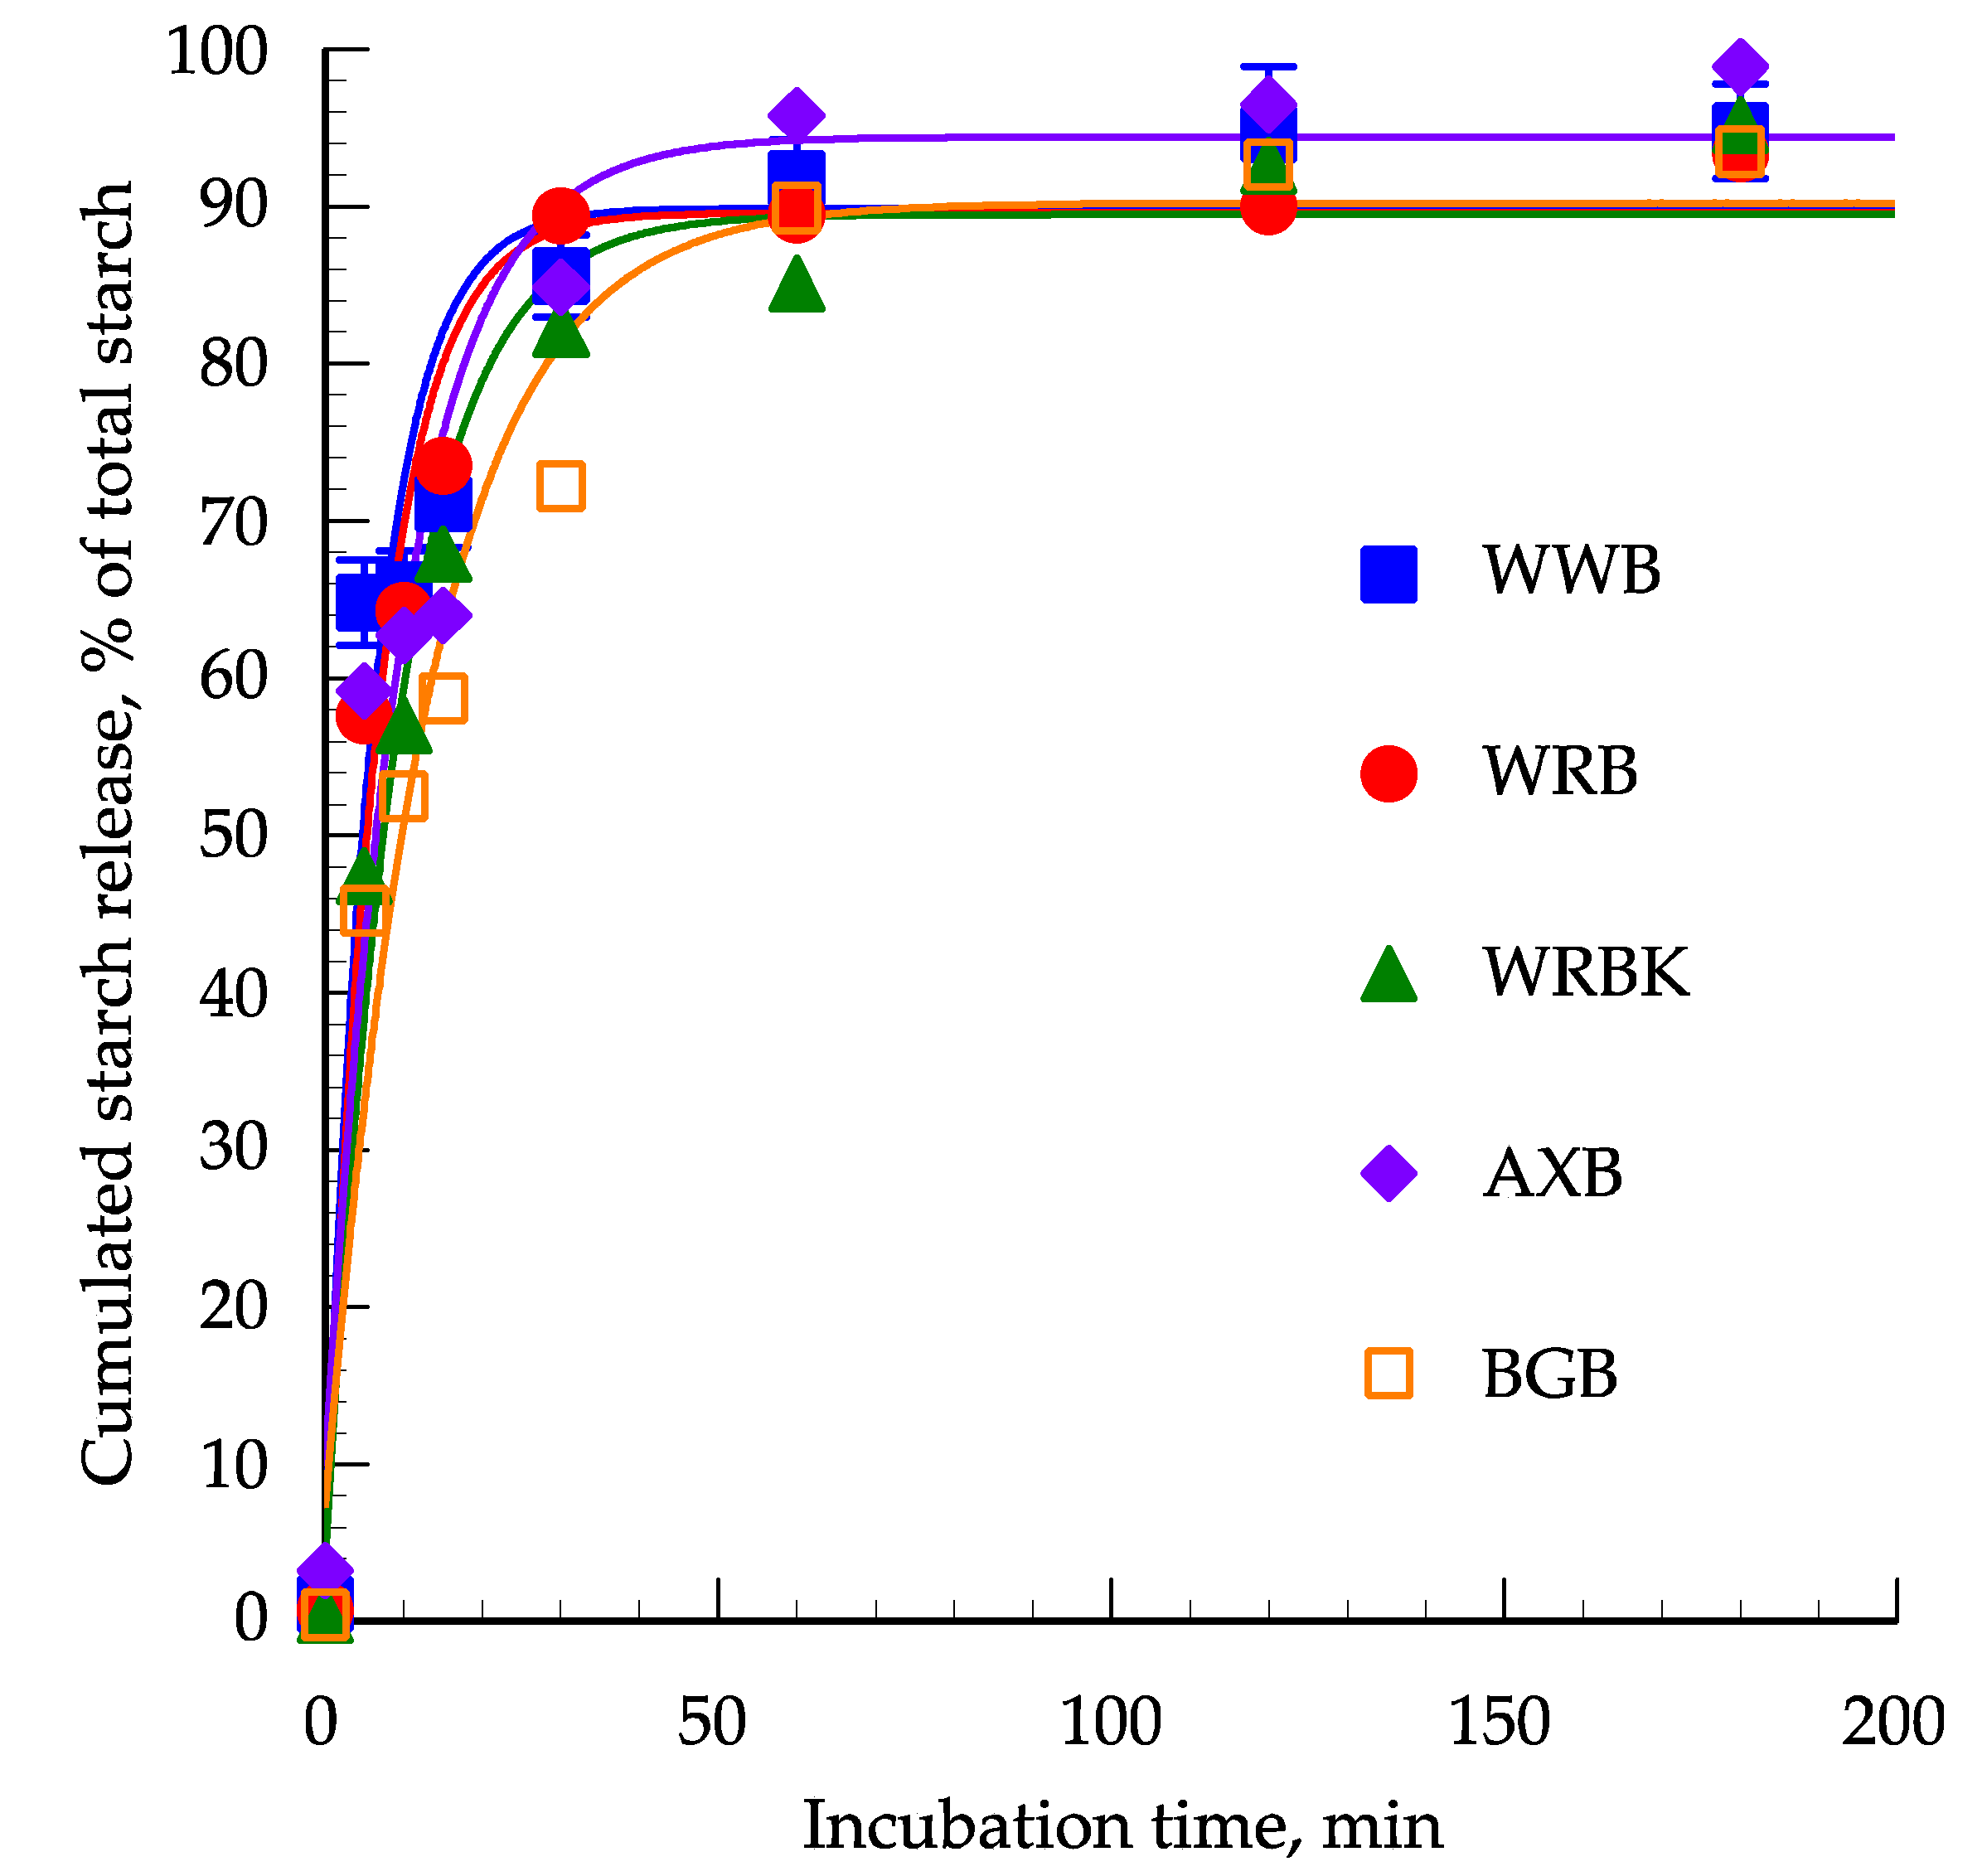
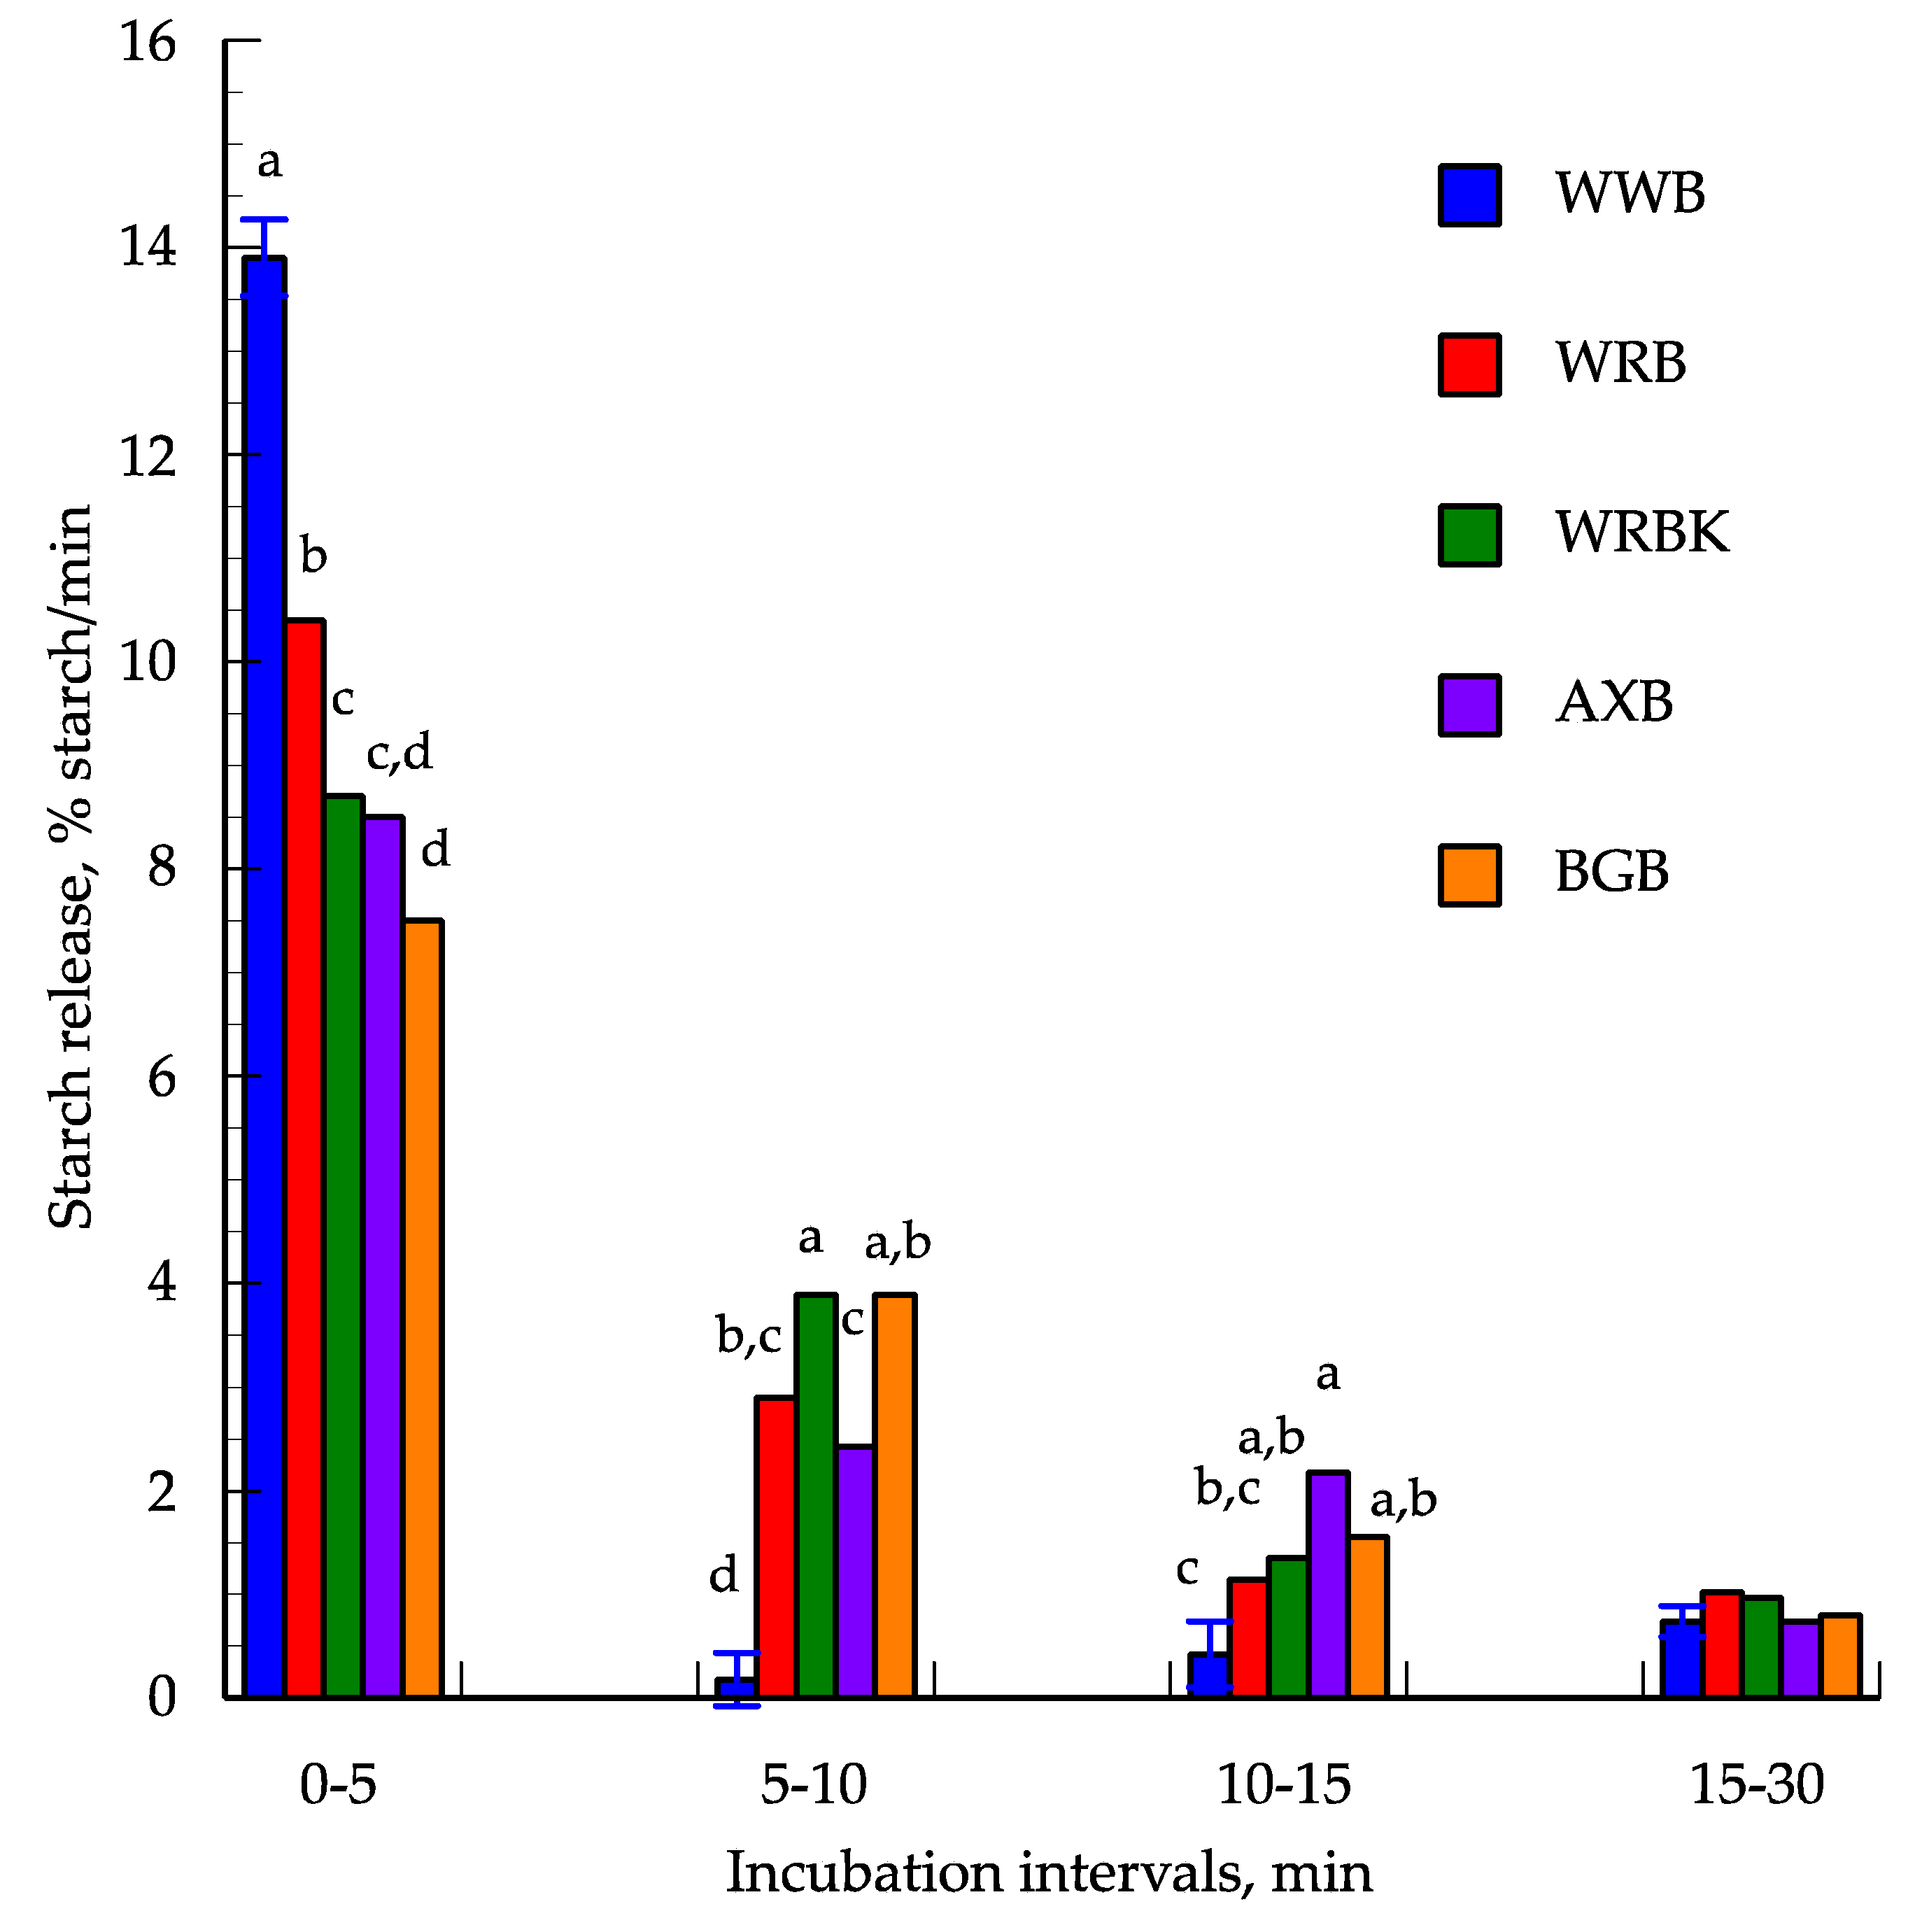
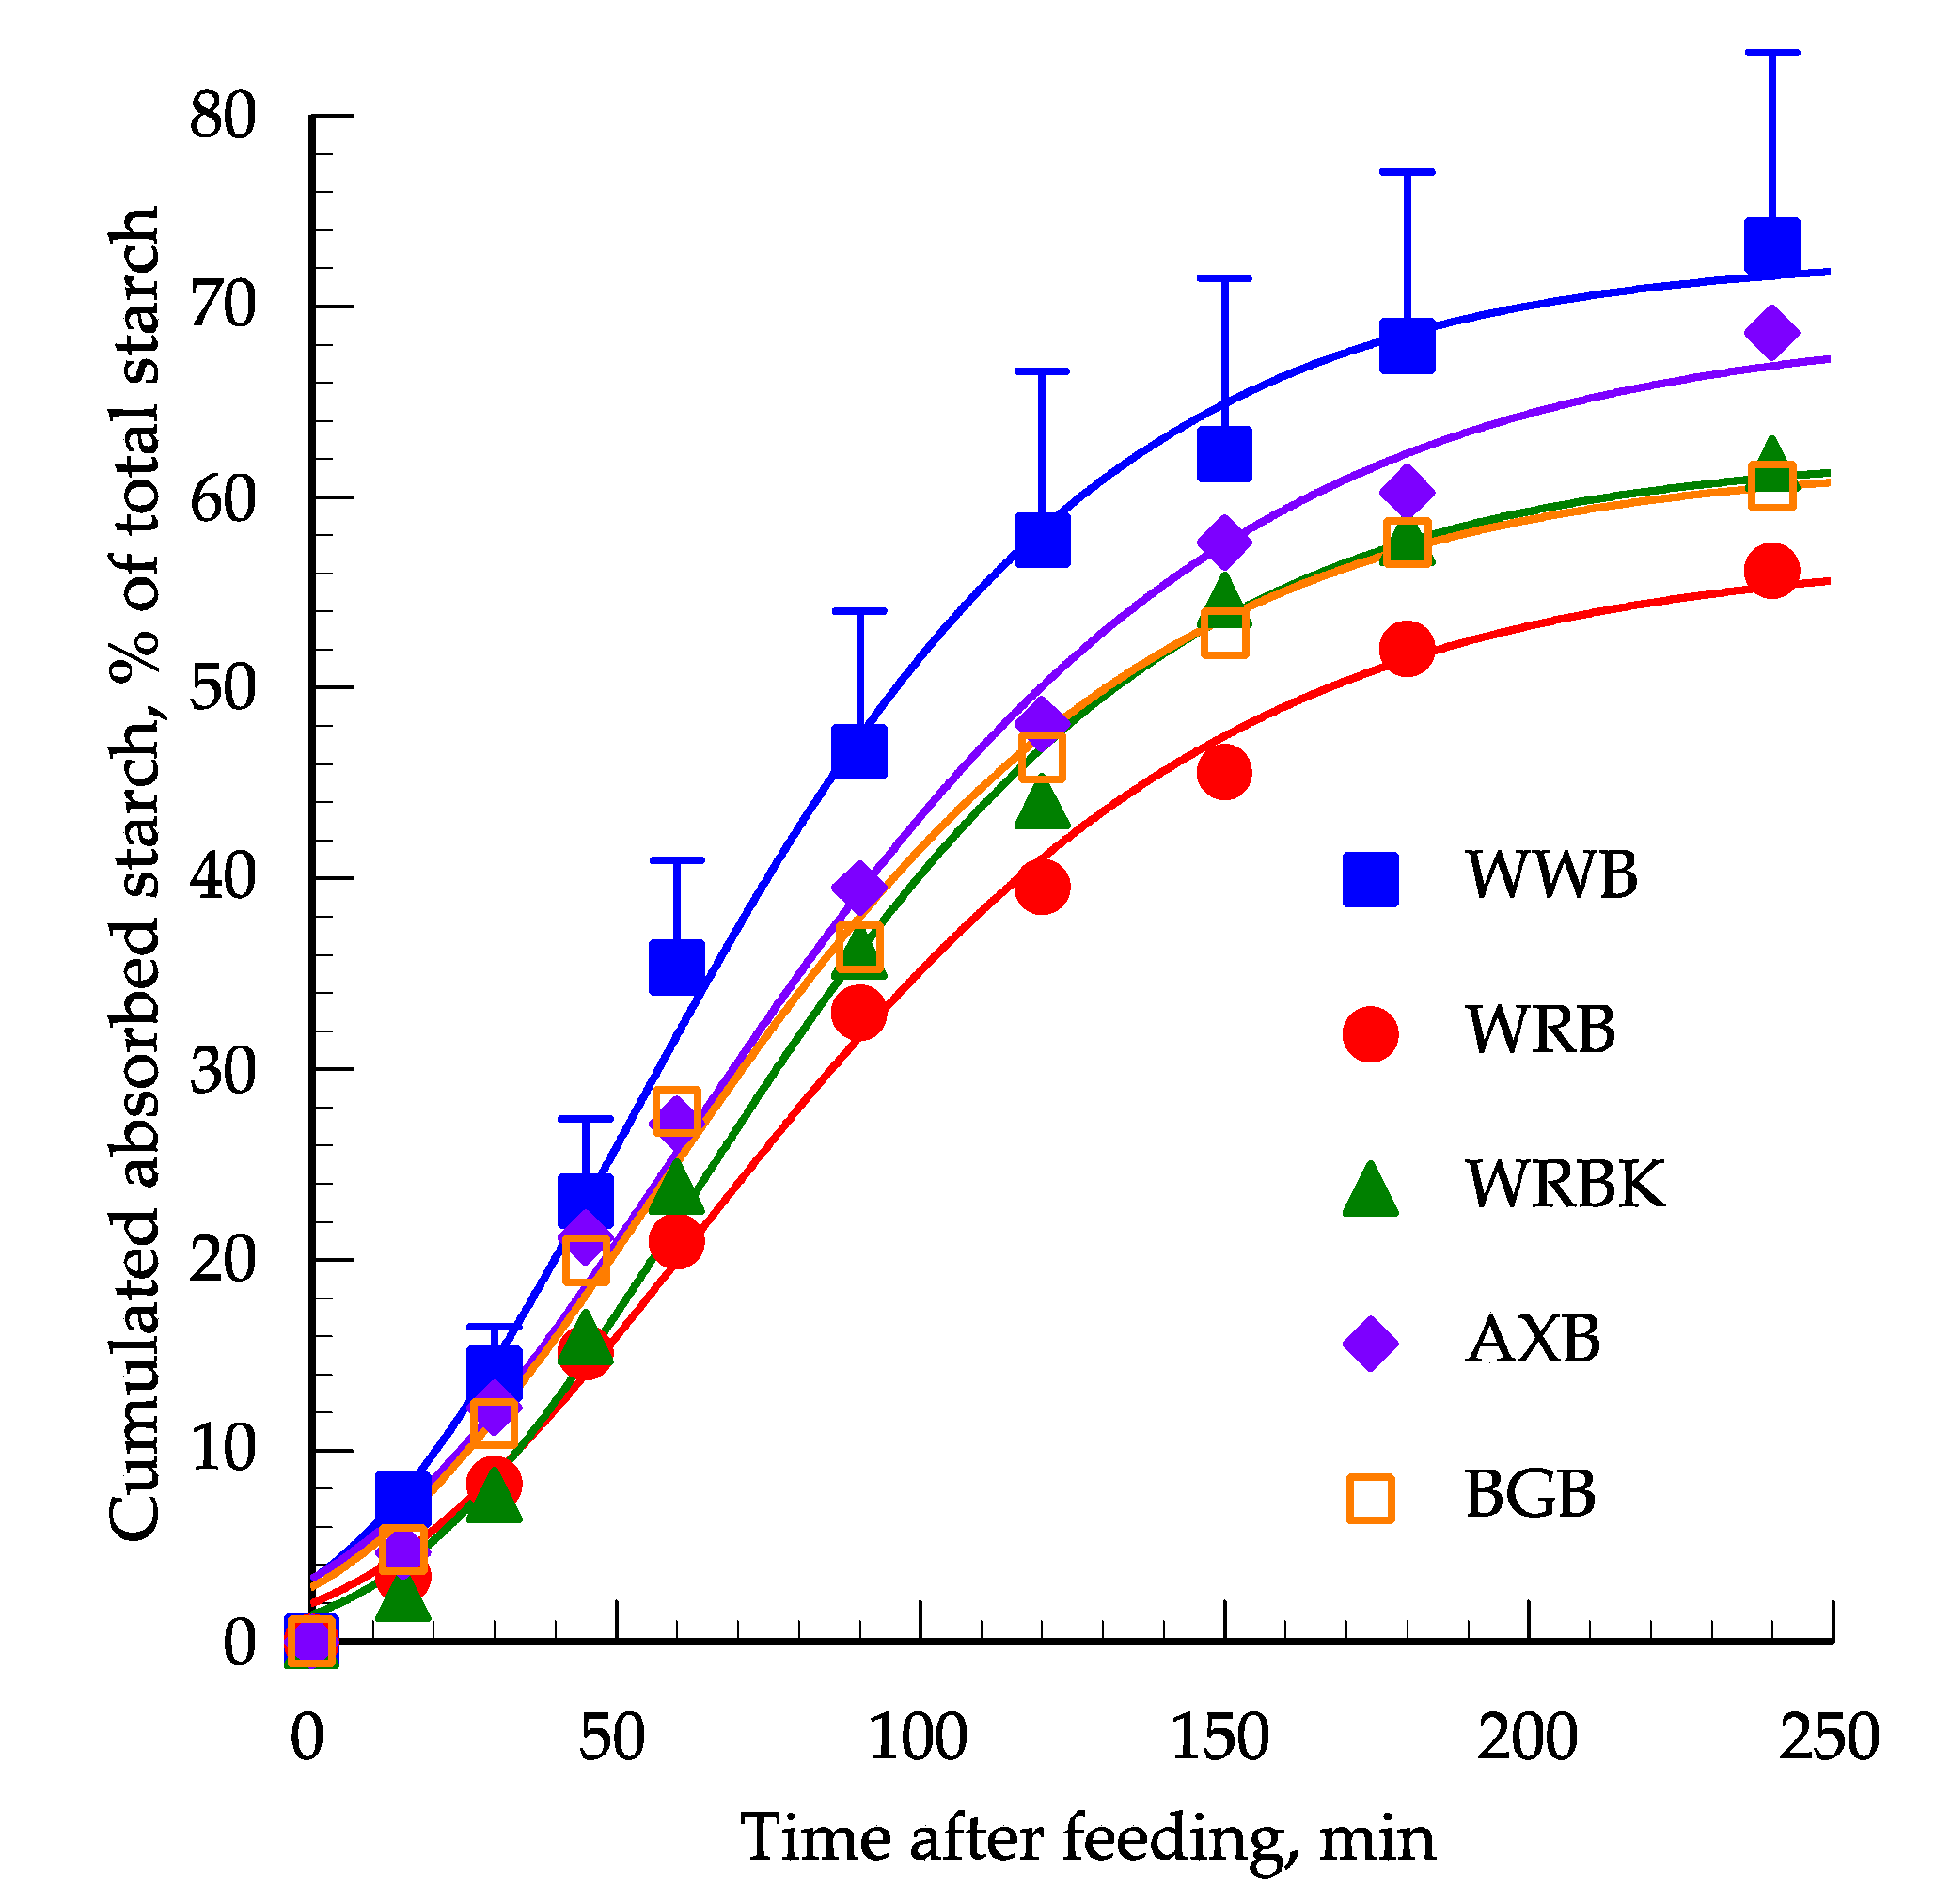
3.2. In Vitro Starch Digestion

The content of free glucose at time T = 0 was significantly different (p < 0.05) between breads, being highest for AXB, followed by WWB, WRB and lowest for WRBK and BGB; the last two breads were not significantly different (Table 2). In vitro starch hydrolysis was described by a mechanistic growth model (R2 > 0.93) following first order kinetics. The rate of hydrolysis differed between the breads up to 30 min with the highest hydrolysis rate for WWB and the lowest for BGB, and with the other breads in between (Figure 2); for details on significance, see Table S1.
The highest hydrolysis rate was between 0 and 5 min and with decreasing rates thereafter. In this period, the highest hydrolysis rate was found for WWB (13.9% starch/min), followed by WRB (10.4% starch/min), WRBK (8.7% starch/min) and finally AXB and BGB (7.4–8.5% starch/min) (Figure 3). From 5 to 10 min there was a marked drop in the hydrolysis rate particularly for WWB (0.18% starch/min) whereas RBK in this period had the highest value (3.9% starch/min) and with AXB, WRB and BGB in between (2.4–3.6% starch/min). The picture was almost the same although with different ranking from 10 to 15 min with the lowest value for WWB (0.4% starch/min) but with the highest value for AXB (2.2% starch/min) and with the other diets in between (1.2–1.6% starch/min). From 15 min and onward the hydrolysis rate was generally low (<1% starch/min) and it was only at 60 min that BGB had a higher value than the other breads (Table S1). The hydrolysis plateaus (89–94%) were reached at 60 min and although numerically lower for WRBK (85.1%) and the other breads the difference was not significant.

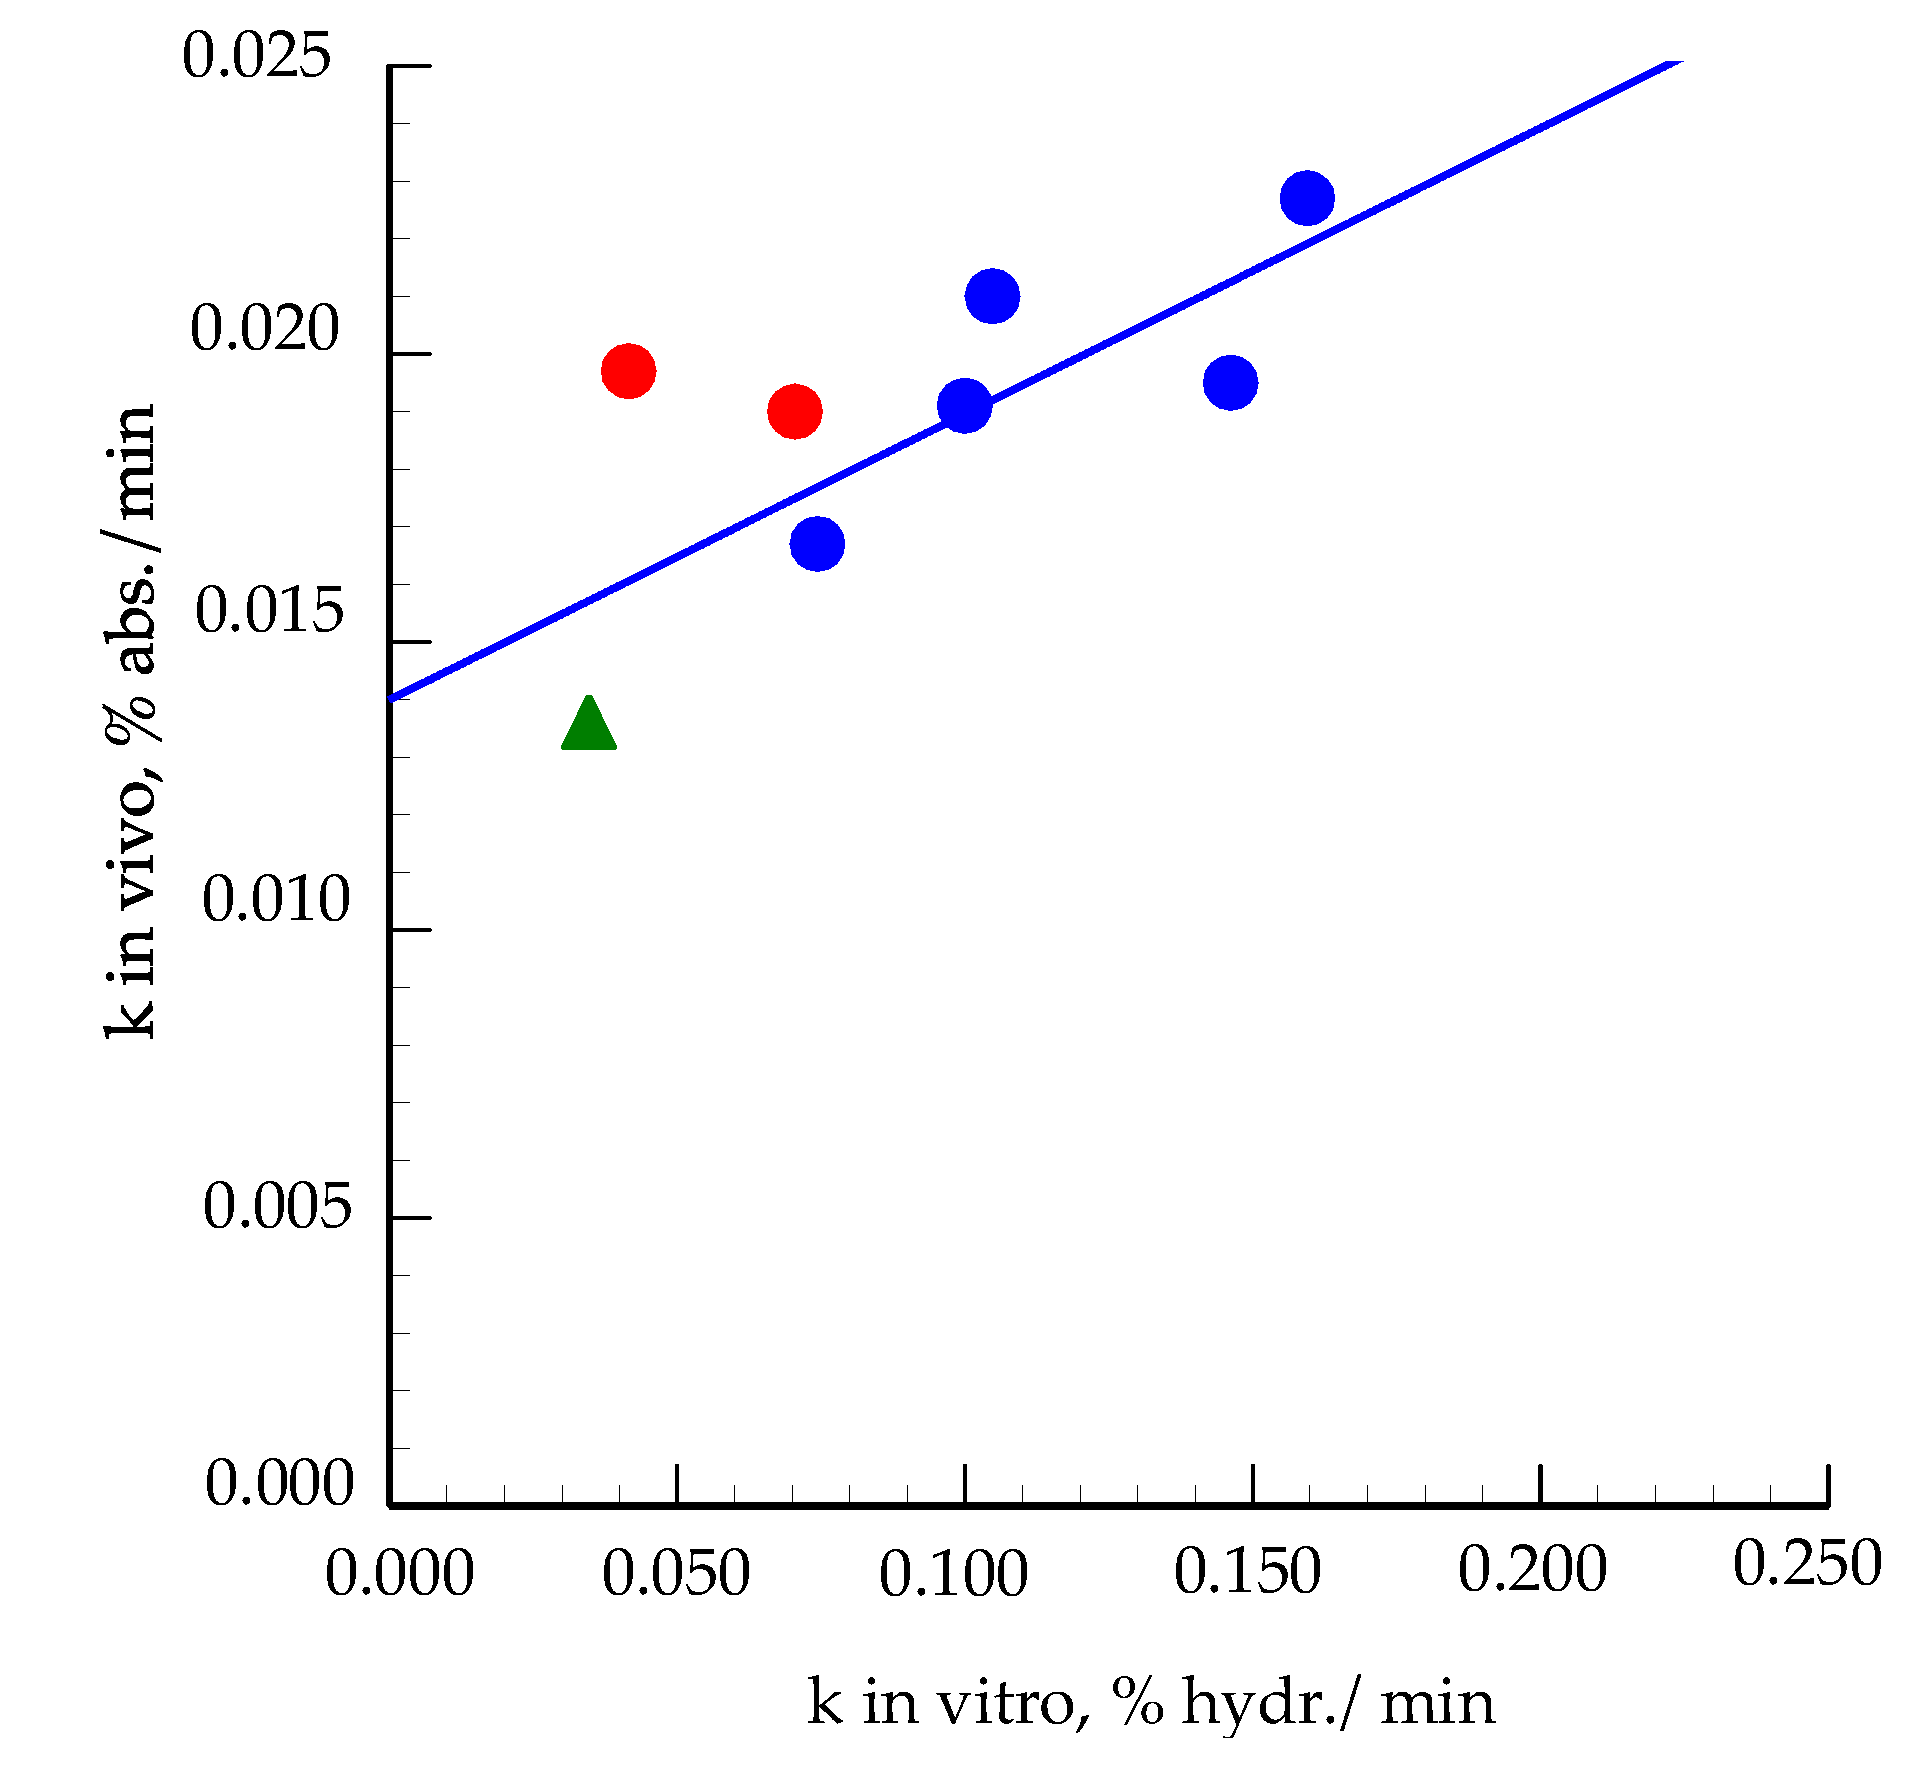
3.3. Comparison to In Vivo Results

The cumulative portal glucose appearance expressed in units of hydrolysed starch per 100 g of dry starch is shown in Figure 4. Data points were described by a Gompertz 3P model, which gave a good fit to the data (R2 ˃ 0.98). The cumulative starch hydrolysis after 15 min was highest for WWB and the lowest was from WRB and WRBK, with AXB and BGB in between (p < 0.05). At 30 min and onwards, there was no significant difference between the hydrolysis rates between the breads but the WWB continued to give the highest numeric values and WRBK and WRB the lowest ones. The cumulated starch hydrolysis approached the asymptotic values (57–72%) at approximately 240 min for all breads and with no difference between the breads.
The k values in vitro varied from 0.0744 to 0.1595% hydrolysis/min with significant differences between WWB and BGB (Table 2). The k values in vivo showed no significant difference between breads but there was a trend for a higher k value for WWB than the other breads. The correlation between the in vitro and in vivo k values in this study was r = 0,78 (p = 0.122) and when the data were combined with the data from the previous study of Vangsøe et al. [17] the correlation between the k values was r = 0.71 (p < 0.05) (Figure 5).

4. Discussion

The current study investigated the in vitro starch digestion kinetics of breads varying in total DF and the proportion between soluble and insoluble DF. Compared to the previous study of Vangsøe et al. [17], samples were taken more frequently in the first 30 min of in vitro digestion, which enables a better modelling of the digestion kinetics, particularly in the early phase of the in vitro digestion. A common feature of white wheat flour breads is its porous physical structure which makes it easily destructible [5] as seen by the very high hydrolysis rate of WWB within the first 5 min of in vitro digestion. In this way, the present study corroborates the study of Péronnet et al. [15] when substituting extruded cereals high in rapidly digestible starch with biscuits with a high content of slowly digestible starch. The presence of DF, naturally in the cell walls (WRB, WRBK) or added (AXB, BGB), delayed the in vitro digestion by decreasing the hydrolysis rate in the first 5 min but increasing it in the following 10 min relative to WWB. The strongest effect was seen for BGB, presumably because the added high MW β-glucan [28] resulted in the higher viscosity of BGB compared to the other breads [24]. Due to the linear structure, barley and oat β-glucans are very sensitive to depolymerisation, both during the technological process (baking) but also during passage of stomach and small intestine which reduces their viscosity in vivo [28]. Arabinoxylan concentrate with a more branched structure than β-glucan [29,30] also reduced the rate of in vitro digestion within the first 5 min but in contrast to β-glucan, arabinoxylan is less sensitive to modification during the passage of the stomach and small intestine. Furthermore, while the viscosity of AXB is lower than that of BGB, the viscosity of the digesta after consuming AXB at ileum is higher than that of BGB [28]. In vivo, the consequence of that is a stronger effect of AXB than BGB on the glucose flux in pigs [18] and glucose metabolism in Zucker Diabetic Fatty rats [31]. In human subjects with metabolic syndrome, however, BGB appears more efficient than AXB in influencing the glycaemic response [32], possibly because β-glucan is less modified in the upper guts of humans than that of most animals.
The WRB also resulted in a lower rate of hydrolysis the first 5 min of incubation, which corroborates with Juntunen et al. [33], who found that the hydrolysis rate of rye endosperm bread, traditional rye bread and high DF rye bread all were lower than that of the reference white wheat bread. The reason for the difference between the wheat and rye types of breads in this and the study of Juntunen et al. [33] is most likely the bread processing that gives white wheat bread a more porous structure [5] compared to the more compact structure of rye bread [33].
The inclusion of intact kernels into breads have been shown as an efficient way of regulating the rate of starch hydrolysis because the insoluble fibrous network surrounds starch, and thereby forms a physical barrier to α-amylases and limits the degree of starch gelatinization [6,34]. In the current study, the starch hydrolysis rate during the first 5 min was lower than that of WRBK, WRB and WWB as was the in vivo glucose flux 15 min post feeding [18]. In a study where the same batches of breads were fed to human subjects with metabolic syndrome, the postprandial glucose response and incremental area under the curve were also lower when consuming the WRBK than the WWB bread [32]. Our in vitro and in vivo results [18,32] are, thus, in concert with other studies, although the effect of including intact barley kernels appears to be stronger than found with rye [6].
The in vivo cumulated absorption of glucose found in this and other studies [18,35,36] are slower than the in vitro hydrolysis because food components such as fat, protein and soluble DF affect gastric emptying [37,38] through the release of cholecystokinin hormones [39]. The viscous nature of soluble DF may further increase the viscosity of the digesta, especially the thickness of the unstirred layer at the intestinal mucosa surface, which limits the diffusion and delays the absorption of glucose through the epithelial cells [40,41]. These factors, rather than the absorption rate to the portal vein, appear to be the main reason for the slower glucose absorption in vivo than in vitro, as glucose from free dietary glucose is present in the portal vein within minutes of ingestion and with a peak level after 30 min, whereas peak level is not reached until after 120 min when glucose is provided as raw maize starch [42]. In the studies of Rerat et al. [43], it was also concluded that it was not the α-amylase activity per se that limited glucose absorption but the starch structure, as can also be noticed when comparing the in vitro k-values of the breads in the current study with the in vitro k values of the raw diets in the study of Vangsøe et al. [17]; the higher hydrolysis rate of the breads most likely reflects the porous structure and gelatinization of the starch in the breads, making their digestion more rapid than that of the raw ingredients [5]. In spite of these differences between the in vitro and in vivo models, the strong relationship between the k values in vitro and in vivo obtained not only with the breads of the current study but also with the raw diets of the study of Vangsøe et al. [17] is encouraging.
For all diets, the in vivo starch digestion displayed lower digestion asymptotic values than in vitro and slightly lower than the values reported in the study of Vangsøe et al. [17]. The lower values found in vivo than in vitro in both studies were without any doubt caused by glucose utilization by the intestinal epithelium as also reported in other studies [36,44].

5. Conclusions

The in vitro method ranked the breads in a similar manner as in vivo but the rate of glucose release was much faster in vitro than in vivo in portal vein catheterised pigs. Although the in vivo model is more complex than the in vitro model used, it is encouraging that there is a strong correlation between the k values obtained in vitro and in vivo, not only with breads in this study but also when including data from a previous study, indicating that the in vitro model can provide valuable information about the digestion rate in the gastrointestinal tract of value not only in a pig model but rather in general.

Supplementary Materials

The following are available online at https://www.mdpi.com/2304-8158/9/9/1337/s1, Table S1: In vitro cumulative starch hydrolysis expressed in % of dry starch, digestion rate k and asymptote digestion value.

Author Contributions

P.R.-B. performed the in vitro experiment and performed the statistical analysis of the in vitro data; C.T.V. provided the in vitro methodology consulting; K.L.N., H.N.L. and M.S.H. performed the animal in vivo experiment; K.E.B.K. wrote the paper and acquired the funding. All authors have read and agreed to the published version of the manuscript.

Funding

The present research was financially supported by The Danish Strategic Research Council, project “BioFunctional Carbohydrates—BioFunCarb” (Project No. 2101-08-0068). The Danish Strategic Research Council had no role in the design, analysis or writing of this article.

Acknowledgments

The authors thank Winnie Østergaard, Lisbeth Märcher and Stina Greis Handberg for excellent technical assistance.

Conflicts of Interest

The authors declare no conflict of interest.

References

  1. Fagt, S.; Matthiessen, J.; Biltoft-Jensen, A.; Groth, M.V.; Christensen, T.; Hinsch, H.-J.; Hartkopp, H.; Trolle, E.; Lyhne, N.; Møller, A. Udviklingen i Danskernes Kost 1985-2001 Med Fokus på Sukker Alkohol Samt Motivation Og Barrierer for Sund Livsstil; Danish Institute for Food and Veterinary Research: Copenhagen, Denmark, 2004; p. 127. [Google Scholar]
  2. Sørensen, A.-M.; Fagt, S.; Møller, A. Dietary fibre intake in Denmark. In Dietary Fibre Intakes in Europe; Cummings, J.H., Frølich, W., Eds.; Directorate-General Science, Research and Development: Brussel, Belgium, 1993; pp. 37–39. [Google Scholar]
  3. Jenkins, D.J.; Wolever, T.M.; Taylor, R.H.; Barker, H.; Fielden, H.; Baldwin, J.M.; Bowling, A.C.; Newman, H.C.; Jenkins, A.L.; Goff, D.V. Glycemic index of foods: A physiological basis for carbohydrate exchange. Am. J. Clin. Nutr. 1981, 34, 362–366. [Google Scholar] [CrossRef] [PubMed] [Green Version]
  4. Atkinson, F.S.; Foster-Powell, K.; Brand-Miller, J.C. International Tables of Glycemic Index and Glycemic Load Values: 2008. Diabetes Care 2008, 31, 2281–2283. [Google Scholar] [CrossRef] [Green Version]
  5. Fardet, A.; Leenhardt, F.; Lioger, D.; Scalbert, A.; Rémésy, C. Parameters controlling the glycaemic response to breads. Nutr. Res. Rev. 2006, 19, 18–25. [Google Scholar] [CrossRef]
  6. Liljeberg, H.; Granfeldt, Y.; Björck, I. Metabolic responses to starch in bread containing intact kernels versus milled flour. Eur. J. Clin. Nutr. 1992, 46, 561–575. [Google Scholar]
  7. Gemen, R.; De Vries, J.F.; Slavin, J.L. Relationship between molecular structure of cereal dietary fiber and health effects: Focus on glucose/insulin response and gut health. Nutr. Rev. 2011, 69, 22–33. [Google Scholar] [CrossRef]
  8. Lu, Z.X.; Walker, K.Z.; Muir, J.G.; Mascara, T.; O’Dea, K. Arabinoxylan fiber, a byproduct of wheat flour processing, reduces the postprandial glucose response in normoglycemic subjects. Am. J. Clin. Nutr. 2000, 71, 1123–1128. [Google Scholar] [CrossRef]
  9. Tosh, S.M. Review of human studies investigating the post-prandial blood-glucose lowering ability of oat and barley food products. Eur. J. Clin. Nutr. 2013, 67, 310–317. [Google Scholar] [CrossRef] [Green Version]
  10. FDA. Guidiance for Industry: A food Labelling Guide, aa. Appendix C: Health Claims, Requirements for Health Claims Made in Labelling; U.S. Food and Drug Administration, Office of Nutritional Products, Labelling and Dietary Supplements: Washington, DC, USA, 2009.
  11. EFSA. Panel on Dietic Products—Nutrition and Allergies. Scientific Opinion: β-glucans from oats and barley related health claims. Appendix C. EFSA J. 2011, 9. [Google Scholar] [CrossRef] [Green Version]
  12. Lu, Z.X.; Walker, K.Z.; Muir, J.G.; O’Dea, K. Arabinoxylan fibre improves metabolic control in people with Type II diabetes. Eur. J. Clin. Nutr. 2004, 58, 621–628. [Google Scholar] [CrossRef] [Green Version]
  13. Wood, P.J.; Beer, M.U.; Butler, G. Evaluation of role of concentration and molecular weight of oat beta-glucan in determining effect of viscosity on plasma glucose and insulin following an oral glucose load. Br. J. Nutr. 2000, 84, 19–23. [Google Scholar] [CrossRef] [Green Version]
  14. Englyst, K.; Vinoy, S.; Englyst, H.N.; Lang, V. Glycaemic index of cereal products explained by their content of rapidly and slowly available glucose. Br. J. Nutr. 2003, 89, 329–339. [Google Scholar] [CrossRef] [PubMed]
  15. Péronnet, F.; Meynier, A.; Sauvinet, V.; Normand, S.; Bourdon, E.; Mignault, D.; St-Pierre, D.H.; Laville, M.; Rabasa-Lhoret, R.; Vinoy, S. Plasma glucose kinetics and response of insulin and GIP following a cereal breakfast in female subjects: Effect of starch digestibility. Eur. J. Clin. Nutr. 2015, 69, 740–745. [Google Scholar] [CrossRef] [Green Version]
  16. Englyst, H.N.; Kingman, S.M.; Cummings, J.H. Classification and measurement of nutritionally important starch fractions. Eur. J. Clin. Nutr. 1992, 46, S33–S50. [Google Scholar] [PubMed]
  17. Vangsøe, C.T.; Ingerslev, A.K.; Theil, P.K.; Hedemann, M.S.; Lærke, H.N.; Knudsen, K.E.B. In vitro starch digestion kinetics of diets varying in resistant starch and arabinoxylan compared with in vivo portal appearance of glucose in pigs. Food Res. Int. 2016, 88, 199–206. [Google Scholar] [CrossRef]
  18. Christensen, K.L.; Hedemann, M.S.; Lærke, H.N.; Jørgensen, H.; Mutt, S.J.; Herzig, K.-H.; Knudsen, K.E.B. Concentrated Arabinoxylan but Not Concentrated β-Glucan in Wheat Bread Has Similar Effects on Postprandial Insulin as Whole-Grain Rye in Porto-arterial Catheterized Pigs. J. Agric. Food Chem. 2013, 61, 7760–7768. [Google Scholar] [CrossRef]
  19. Association of Official Analytical Chemists. Official Methods of Analysis; Association of Official Analytical Chemists: Washington, DC, USA, 1990; p. 1298. [Google Scholar]
  20. Hansen, B. Determination of Nitrogen as Elementary N, an Alternative to Kjeldahl. Acta Agric. Scand. 1989, 39, 113–118. [Google Scholar] [CrossRef]
  21. Stoldt, W. Vorschlag zur Vereinheitlichung der Fettbestimmung in Lebensmitteln (Suggestion to standardise the determination of fat in foodstuffs). Fette Seifen Anstrichm. 1952, 54, 206–207. [Google Scholar] [CrossRef]
  22. McCleary, B.V.; Glennie-Holmes, M. Enzymic quantification of (1-3), (1-4)-ß-D-glucan in barley and malt. J. Inst. Brew. 1985, 91, 285–295. [Google Scholar] [CrossRef]
  23. Theander, O.; Åman, P. Studies on dietary fibre. 1. Analysis and chemical characterization of water-soluble and water-insoluble dietary fibres. Swed. J. Agric. Res. 1979, 9, 97–106. [Google Scholar]
  24. Kasprzak, M.M.; Lærke, H.N.; Knudsen, K.E.B. Effects of Isolated and Complex Dietary Fiber Matrices in Breads on Carbohydrate Digestibility and Physicochemical Properties of Ileal Effluent from Pigs. J. Agric. Food Chem. 2012, 60, 12469–12476. [Google Scholar] [CrossRef]
  25. Knudsen, K.E.B. Carbohydrate and lignin contents of plant materials used in animal feeding. Anim. Feed. Sci. Technol. 1997, 67, 319–338. [Google Scholar] [CrossRef]
  26. Kasprzak, M.M.; Lærke, H.N.; Larsen, F.H.; Knudsen, K.E.B.; Pedersen, S.; Jørgensen, A.S. Effect of Enzymatic Treatment of Different Starch Sources on the in Vitro Rate and Extent of Starch Digestion. Int. J. Mol. Sci. 2012, 13, 929–942. [Google Scholar] [CrossRef]
  27. Larsson, K.; Bengtsson, S. Bestämning av Lättilgängeliga Kolhydrater i Växtmaterial (Determination of Readily Available Carbohydrates in Plant Material); Methods Report no. 22; National Laboratory of Agricultural Chemistry: Uppsala, Sweden, 1983. [Google Scholar]
  28. Kasprzak, M.M.; Lærke, H.N.; Knudsen, K.E.B. Changes in Molecular Characteristics of Cereal Carbohydrates after Processing and Digestion. Int. J. Mol. Sci. 2012, 13, 16833–16852. [Google Scholar] [CrossRef] [Green Version]
  29. Izydorczyk, M.S.; Biliaderis, C.G. Cereal arabinoxylans: Advances in structure and physicochemical properties. Carbohydr. Polym. 1995, 28, 33–48. [Google Scholar] [CrossRef]
  30. Wood, P.J. REVIEW: Oat and Rye β-Glucan: Properties and Function. Cereal Chem. J. 2010, 87, 315–330. [Google Scholar] [CrossRef]
  31. Hartvigsen, M.L.; Jeppesen, P.B.; Lærke, H.N.; Njabe, E.N.; Knudsen, K.E.B.; Hermansen, K. Concentrated Arabinoxylan in Wheat Bread Has Beneficial Effects as Rye Breads on Glucose and Changes in Gene Expressions in Insulin-Sensitive Tissues of Zucker Diabetic Fatty (ZDF) Rats. J. Agric. Food Chem. 2013, 61, 5054–5063. [Google Scholar] [CrossRef]
  32. Hartvigsen, M.L.; Gregersen, S.; Lærke, H.N.; Holst, J.J.; Knudsen, K.E.B.; Hermansen, K. Effects of concentrated arabinoxylan and β-glucan compared with refined wheat and whole grain rye on glucose and appetite in subjects with the metabolic syndrome: A randomized study. Eur. J. Clin. Nutr. 2013, 68, 84–90. [Google Scholar] [CrossRef] [Green Version]
  33. Juntunen, K.S.; E Laaksonen, D.; Autio, K.; Niskanen, L.K.; Holst, J.J.; E Savolainen, K.; Liukkonen, K.-H.; Poutanen, K.S.; Mykkänen, H.M. Structural differences between rye and wheat breads but not total fiber content may explain the lower postprandial insulin response to rye bread. Am. J. Clin. Nutr. 2003, 78, 957–964. [Google Scholar] [CrossRef]
  34. Liljeberg, H.; Björck, I. Bioavailability of starch in bread products. Postprandial glucose and insulin responses in healthy subjects and in vitro resistant starch content. Eur. J. Clin. Nutr. 1994, 48, 151–163. [Google Scholar] [PubMed]
  35. Ingerslev, A.K.; Theil, P.K.; Hedemann, M.S.; Lærke, H.N.; Knudsen, K.E.B. Resistant starch and arabinoxylan augment SCFA absorption, but affect postprandial glucose and insulin responses differently. Br. J. Nutr. 2014, 111, 1564–1576. [Google Scholar] [CrossRef] [Green Version]
  36. Van Kempen, T.A.T.G.; Regmi, P.R.; Matte, J.J.; Zijlstra, R.T. In Vitro Starch Digestion Kinetics, Corrected for Estimated Gastric Emptying, Predict Portal Glucose Appearance in Pigs. J. Nutr. 2010, 140, 1227–1233. [Google Scholar] [CrossRef] [PubMed] [Green Version]
  37. Camilleri, M.; Malagelada, J.R.; Brown, M.L.; Becker, G.; Zinsmeister, A.R. Relation between antral motility and gastric emptying of solids and liquids in humans. Am. J. Physiol. Liver Physiol. 1985, 249, G580–G585. [Google Scholar] [CrossRef] [PubMed]
  38. A Siegel, J.; Urbain, J.L.; Adler, L.P.; Charkes, N.D.; Maurer, A.H.; Krevsky, B.; Knight, L.C.; Fisher, R.S.; Malmud, L.S. Biphasic nature of gastric emptying. Gut 1988, 29, 85–89. [Google Scholar] [CrossRef] [PubMed] [Green Version]
  39. Furness, J.; Rivera, L.R.; Cho, H.J.; Bravo, D.M.; Callaghan, B. The gut as a sensory organ. Nat. Rev. Gastroenterol. Hepatol. 2013, 10, 729–740. [Google Scholar] [CrossRef]
  40. Low, A.G.; Zebrowska, T.; Heppell, L.M.J.; Smith, H.A. Influence of wheat bran, cellulose, pectin and low or high viscosity guar gum on glucose and water absorption from pig jejunum. Proc. Nutr. Soc. 1986, 45, A55. [Google Scholar]
  41. Lund, E.K.; Gee, J.M.; Brown, J.C.; Wood, P.J.; Johnson, I.T. Effect of oat gum on the physical properties of the gastrointestinal contents and on the uptake of D-galactose and cholesterol by rat small intestine in vitro. Br. J. Nutr. 1989, 62, 91–101. [Google Scholar] [CrossRef]
  42. Rérat, A.A.; Vaissade, P.; Vaugelade, P. Absorption kinetics of some carbohydrates in conscious pigs. 1. Qualitative aspects. Br. J. Nutr. 1984, 51, 505–515. [Google Scholar] [CrossRef] [Green Version]
  43. Rérat, A.A.; Vaissade, P.; Vaugelade, P. Absorption kinetics of some carbohydrates in conscious pigs. 2. Quantitative aspects. Br. J. Nutr. 1984, 51, 517–529. [Google Scholar] [CrossRef] [Green Version]
  44. Noah, L.; Krempf, M.; Lecannu, G.; Maugère, P.; Champ, M.M.-J. Bioavailability of starch and postprandial changes in splanchnic glucose metabolism in pigs. Am. J. Physiol. Metab. 2000, 278, E181–E188. [Google Scholar] [CrossRef] [PubMed]
Figure 1. Schematic presentation of the in vitro digestion model, modified after Vangsøe et al. [17].
Foods 09 01337 g001
Figure 2. In vitro cumulative starch hydrolysis (% of total dry starch) of the white wheat bread (WWB), whole grain rye bread (WRB), whole grain rye bread with kernels (WRBK), arabinoxylan bread (AXB) and the beta-glucan bread (BGB). Values are the means ± SEM (n = 3).
Foods 09 01337 g002
Figure 3. In vitro starch hydrolysis (% of total starch/min) in different time intervals of the white wheat bread (WWB), whole grain rye bread (WRB), whole grain rye bread with kernels (WRBK), arabinoxylan bread (AXB) and the beta-glucan bread (BGB). Values are the means ± SEM (n = 3); a, b, c, d mean values with different superscript letters were significantly different.
Foods 09 01337 g003
Figure 4. In vivo cumulative portal glucose appearance (% starch absorbed of ingested starch) of white wheat bread (WWB), whole grain rye bread (WRB), whole grain rye bread with kernels (WRBK), arabinoxylan bread (AXB) and beta-glucan bread (BGB). Values are the means ±SEM (n = 6).
Foods 09 01337 g004
Figure 5. Relationship between in vitro and in vivo k values of the investigated breads of the current study (J) and of Western style diet (J), arabinoxylan rich diet (J) and resistant starch rich diet (H) in the study of Vangsøe et al. [17]. The relationship could be expressed with: kin vivo = 0.014 + 0.043 × kin vitro, R2 = 0.504.
Foods 09 01337 g005
Table 1. Chemical composition (g/kg dry matter (DM)) of the experimental test breads, see Christensen et al. [18] for details.
Chemical CompositionWWBWRBWRBKAXBBGB
Dry matter (g/kg as is)634520543708615
Total starch 711588608514612
Total sugars4732233958
Dietary fibre
LMW non-digestible carbohydrates3052538110
Resistant starch4914718
Total NSP (soluble NSP)35 (17)134 (53)139 (50)116 (86)163 (54)
Cellulose61918653
β-Glucan (soluble β-glucan)3 (2)21 (7)19 (4)3 (2)52 (40)
AX (soluble AX)17 (13)76 (36)77 (37)78 (66)32 (9)
Total non-digestible carbohydrates a69195206204190
Klason lignin8141489
Total dietary fibre b77209220212199
WWB, white wheat bread; WRB, whole grain rye bread; WRBK, whole grain rye bread with kernels, AXB, wheat bread with arabinoxylan concentrate; BGB, wheat bread with β-glucan concentrate; a Calculated as: total non-starch polysaccharides (NSP) + low-molecular weight (LMW) non-digestible carbohydrates + resistant starch; b Calculated as: Total NSP + LMW non-digestible carbohydrates + resistant starch + lignin.
Table 2. In vitro and in vivo data of the digestion rate (k), asymptote and inflection point of breads varying in dietary fibre.
Breads
WWBWRBWRBKAXBBGBSEMp-Value
In vitro
k, % hydr./min0.1595 a0.1462 a, b0.1048 a, b0.1000 a, b0.0744 b0.020.06
Asymptote,%89.889.689.594.490.23.10.75
In vivo
k, % absorption/min0.0227 a0.0195 a0.0210.0191a0.0167 a0.0230.085
Inflection point55.466.066.060.659.87.30.82
Asymptote,%71.856.862.668.572.210.40.85
kin vitro/kin vivo7.027.504.995.234.45
WWB, white wheat bread; WRB, whole grain rye bread; WRBK, whole grain rye bread with kernels, AXB, wheat bread with arabinoxylan concentrate; BGB, wheat bread with β-glucan concentrate. a, b mean values with different superscript letters were significantly different.

