Abstract
Background: This paper addresses the common question of how service providers compare to their competitors and what their competitive advantages are. It focuses on the North Adriatic ports of Trieste, Koper, Rijeka, Venice, and Ravenna, all members of the North Adriatic Ports Association, analyzing their position, size, competitiveness, and role in the container market. Methods: The research employs three distinct methods: market structure analysis using several concentration indices, the R method for ranking terminals, and aggregation of these indices to create a combined index for port performance. Results: Based on the rankings, indicators, the BCG matrix, and future development plans for each terminal, the ports are ranked as follows: Koper, Rijeka, Trieste, Venice, and Ravenna. Koper emerges as the leader, positioned in the high market share and strong growth category. This advantageous position allows Koper to efficiently attract traffic without requiring substantial investments. Conclusions: The contribution of the work is that the specific measure indices were applied, which were not used in the analysis of the North Adriatic container terminals until now. The research provides both a broad and detailed understanding of the position, role, and condition of each terminal. This insight enables stakeholders to take timely, strategic actions aimed at boosting productivity and traffic, ultimately improving their competitive standing.
1. Introduction
The most important ports on the Adriatic, Koper, Trieste, Rijeka, Ravenna, and Venice, are members of the North Adriatic Ports Association (NAPA). The Adriatic route is the shortest and most economical maritime route connecting Central and South-Eastern Europe further with the Far East, i.e., with Japan, China, South Korea, and other Asian countries, via the Suez Canal. The ports on the Northern Adriatic are also the closest and most economical ports for certain landlocked countries in Central Europe, representing the gateway to the world for countries such as Serbia, Slovakia, the Czech Republic, Hungary, and Austria. Compared to other ports in Europe, the ports on the Northern Adriatic shorten the cargo transportation time on the transport routes between Europe and Asia by up to five days.
Although the main purpose of the NAPA is the joint appearance on the market for transport services and the strengthening of competitiveness with other ports, it is interesting to see the position of each port in the association, its share in the total market traffic, and its rank compared to other ports in the association. The terminals that are the subject of the study are in a very narrow area and have the same users and quite similar technical conditions for the provision of container ship handling services.
This paper analyzes the throughput, the position in the container traffic market structure, and the competitiveness of the North Adriatic container terminals belonging to the NAPA. The position in the market structure of container traffic was studied using the following techniques: Hirschman–Herfindahl index, K-firm concentration ratio, entropy index, Gini coefficient, and Boston Consultant Group matrix. The ranking of ports under the two aspects of users of port services and providers of services was made using the R method of ranking. In addition, the application of the aggregate ranking for the purpose of studying the port performance was carried out for the port liner shipping connectivity index (PLSCI) and the container port performance index (CPPI). In the paper, after the introductory part, which includes previous research on this topic, the second part gives an insight and information about the research object, NAPA. In the third part of the paper, the position of a particular container terminal in the NAPA is studied using several techniques. The fourth part of the paper deals with the procedure for classifying terminals from the view of port services users and from the perspective of the port as an entity that handles containers and serves users. It was carried out using the R method of ranking and, furthermore, the model of aggregated rankings after presenting the PLSC and CPP indices for the observed ports is presented, and at the end of the paper there are a discussion of results and concluding remarks.
In scientific and professional research, there have been many approaches so far to study the issues of ranking, technical efficiency, role, position, and competitiveness of terminals in the same geographical area, each from a different point of view and/or using different techniques and methods for this purpose. One group of papers examines port competitiveness by evaluating the attractiveness of ports to their users. The second group of works focuses on the study of productivity and efficiency as fundamental parts of port attractiveness.
In [1], the authors applied nonparametric models and parametric bootstrap procedures to measure and identify the key factors of ports’ technical efficiency in the SEE region, also covering ports from Italy, having a straight impact on competition in the wider Eastern Mediterranean region. The authors of the paper [2] analyze relative efficiency and competitiveness of the 22 largest Mediterranean container ports based on a cross-sectional, window analysis and panel data in a time span from 1998 and 2012 using data envelopment analysis (DEA) and also examine the market behavior and market structure. The structure of the market is assessed by measurement of the market concentration through four different methods: the Hirschman–Herfindahl index (HHI), the K-firm concentration ratio (K-CR), the generalized entropy index, the Gini coefficient (GC), and the Boston Consultant Group (BCG) matrix. Furthermore, market performance is analyzed using the nonparametric data envelopment analysis models, estimating values of relative efficiency and ranking seaports by their efficiency. In the research in [3], the main objectives were to assess the model, perform a sensitivity analysis, then evaluate the technical efficiency of interconnected medium-sized NAPA terminals. The results show, among other things, that the NAPA terminals with the top projected efficiencies are not essentially the most productive and contrariwise. In [4], the author evaluates and investigates how the degree of efficacy of an individual container port can be improved and specifically examines how certain factors affect the efficiency of the single container port, using the stochastic frontier analysis (SFA) econometric benchmarking method.
The numerous factors affecting the attractiveness of the Rijeka port and suggested measures for improving the competitiveness have been observed in [5]. Authors, in [6], emphasized that NAPA ports need to conjoin and at the same time compete in their market share, also developing a model that involves three basic features of the terminal output: relocation of container, share in the market, and relative growth.
Recent trends show that ports are increasingly seeking to develop strategies for mutually beneficial cooperation, especially ports that share a common hinterland [7]. They analyze the ports of the Northern Adriatic regarding two interrelated issues. Initially, based on shipping company surveys and patterns of port vessel service, they analyze the complementarity of ports in the market. Next, they evaluate the extent and depth of assistance among ports by mapping existing and possible forthcoming assistance by means of a “cooperation matrix” that includes stakeholder participation and depth of assistance and finally rank ports of the Northern Adriatic in the matrix. Furthermore, in their next study [8], the authors examine the significance of the existence of a national border and extend the present framework for analyzing cases of port assistance between neighboring ports.
The growth of throughput in Mediterranean container ports is studied in [9]. The main objective was to investigate whether container traffic in the area has increased or decreased and whether ports show a tendency of port concentration or deconcentration in a period of fifteen years, from 2000 to 2015. In addition, it is analyzed which ports have experienced losses/growth in container throughput and in market share. To study the concentration level of container terminals, different indices were used, including the concentration rates (CR1, CR3, and CR10), the Lorenz curve, the Gini coefficients, the Herfindahl–Hirschman index (HHI) and the new geoeconomic concentration index (GECI).
Using various concentration methods, in [10] the progression of concentration in port areas on the west and east coasts of the US between 2005 and 2015 is examined. Their findings show that port areas in the US have progressed from deconcentrated to moderately or greatly concentrated. The objective of the paper [11] was to show the degree of container ports’ concentration in the Eastern Mediterranean. The yearly container throughput was explored to determine concentration in the market using various indices, including the HHI, CR3, CR5, and shift share analysis. Finally, the port of Rijeka in Croatia holds significant but underutilized potential for economic development. Ref. [12] uses a benchmarking approach to compare Rijeka’s efficiency with the “best container port” in the region, the port of Koper. The findings reveal that Koper has significant competitive advantages across most analyzed factors.
There are several research projects dealing with role and position in the Adriatic ports market. The research project “The Role of North Adriatic Ports” (2019) offers a detailed examination of the NAPA, exploring both the collaborative trends and the challenges these ports encounter. It also emphasizes the position of North Adriatic ports within China’s Belt and Road Initiative and the China-CEEC cooperation framework [13]. Furthermore, the project [14] encompasses a review of relevant literature, an introduction to container port fundamentals, an analysis of container throughput trends in European ports, the stability of container traffic among European ports, key port characteristics, and the methodology for modeling and forecasting in NAPA ports. Additionally, it includes a statistical data analysis and an evaluation of efficiency, with possible applications to NAPA ports, and concludes with potential methods for time series modeling and forecasting. Additionally, MDS Transmodal (MDST) was contracted by the North Adriatic Ports Association to lead a study [15] on the possible freight capacity of the NA container terminals. Funded by the European Union’s TEN-T program, this study should help establish potential expansion of the NAPA container ports until 2030.
What is unique in this article and stands out from others is that the problem already mentioned and addressed in previous research is approached differently by introducing a ranking method from different points of view (users and service providers), in addition to applying concentration techniques in the container market. Moreover, a methodology for obtaining a combined index based on two or more different indices that measure the performance and key business indicators of a single terminal is proposed. In this way, new insights can be gained and the state of a single terminal can be viewed from a broader perspective that includes several different indicators. It is particularly important to point out that the methodology applied can be used in various other cases, wherever mass service systems are concerned.
The novelty of the study is that a specific segment of the container market, namely the NAPA, has been taken, where several different competition indices indicating the position of a single terminal in the common market area have been examined and implemented. Given the large volume of containerized cargo handled in the NAPA ports and the relative vicinity of all five ports, the question of competition or mutual cooperation always remains open. Considering the continuous investments in the expansion of port capacities of all five terminals, especially in Koper and Trieste, it can be concluded that competitiveness still prevails. The results of the study can indicate whether and to what extent the individual terminal still needs to invest in capacity expansion and whether in the future, given the amount of demand, it will have its full utilization.
The research objectives are as follows: (1) analyze the current state of container traffic volume at the North Adriatic container terminals, (2) determine the competitiveness of each terminal on the common market using concentration indices, (3) use the ranking method with respect to the terminal’s point of view and from the shipping lines’ point of view, based on quantitative indicators, in order to obtain the relevant ranking of each terminal, (4) calculate the combined index based on PLSC and CPP indices, (5) carry out an overall ranking of the countries to which certain terminals belong.
2. North Adriatic Ports Association (NAPA)
The North Adriatic Ports Association (NAPA) includes the Ports of Trieste and Monfalcone, Venice and Chioggi, Ravenna, Koper, and Rijeka (Figure 1). The NAPA can be of crucial importance when it comes to facing growing global competition in a context characterized by the steady growth of maritime trade in the Mediterranean and the geopolitical and strategic centrality of Central Eastern Europe. The NAPA has drafted a Position Paper which provides a contribution to the revision of the TEN-T network and provides for the recognition of the “port clusters”, the extension of the Motorways of the Sea to the neighboring countries of the Mediterranean and the investment plans of the ports from the NAPA to 2030 for the last mile in rail, energy, and digital infrastructures. In addition, projects cofunded by the European Union have been or are being implemented in one or more member ports [16].
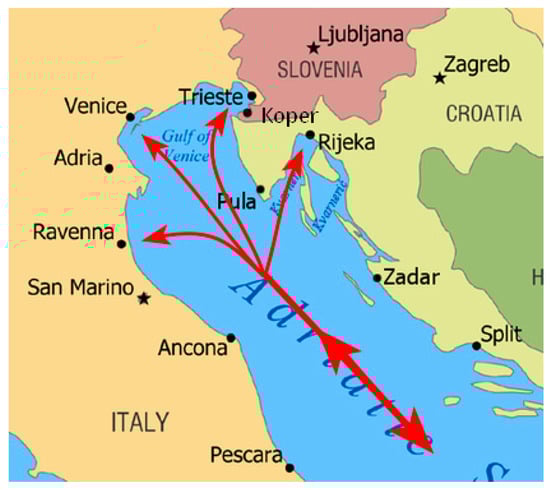
Figure 1.
Map and shipping routes of the NAPA terminals.
On the way to supporting trilateral cooperation, three priorities are: completing absent links and promoting integration in the TEN-T network, extending TEN-T and MOS to non-EU countries, and including rail cargo and maritime breadth in the European Territorial Cooperation Interreg Programmes of the Adriatic–Ionian, Central Europe, Italy–Croatia and Italy–Slovenia, 2021–2027.
In addition to preventing the Northern Adriatic ports from lagging behind the Northern Europe ports, other important objectives of the NAPA are: support in building connections to the hinterland, environmental protection, security, digitalization of data, harmonization of data, cooperation in cruise ship visits, and development of infrastructure and superstructure of rail and road transport. Comparing the traffic volume in the ports of the NAPA with other ports in Europe, can be seen that although this traffic volume is increasing every year, it still lags far behind other ports in Northern and Western Europe, which means that the ports of the Northern Adriatic have not yet exploited their geographical potential to become competitive in the European market. For example, the ports of the NAPA reached 2.48 million TEU in 2021, while the port of Rotterdam is in first place with 14.8 million TEU, followed by Antwerp with 11.8 million TEU, followed by Hamburg with 9.25 million TEU and Piraeus with 5.65 million TEU [17].
The Rijeka Adriatic Gate container terminal is located on the TEN-T network in the Mediterranean corridor and hence has a great geographical potential as it is located close to landlocked countries such as Austria, Serbia, Bosnia and Herzegovina, Hungary, etc. However, compared to other container terminals in Northern and Western Europe, the terminal still lags far behind in terms of traffic volume. The construction of the full-length berth will create a 680 m long and 20 m deep quay where container ships with more than 165,000 DWT and a length of over 366 m can moor [18,19].
The port of Koper, in the northeastern part of the Adriatic Sea, is extremely favorably located in terms of transport geography and is very well connected with the countries of Eastern and Central Europe, so it is not surprising that the port has become the most important export port for noncoastal countries in this part of Europe. Over the past two years, Koper Container Terminal has undergone significant investments; a new quay extension and extra stacking zones have been completed, while the most recent expansion was the setting up of two Super Post-Panamax STS cranes in May 2022. All investments were made while the terminal was in full operation, which is a great success. In December 2022, Koper became the first port in the Adriatic to exceed one million TEU in one year [20].
The port of Trieste, in the extreme northeast of the Adriatic Sea, due to its favorable geographical and traffic position, has become an extremely important import and export port of the Republic of Austria. The container terminal in Trieste can boast having the deepest natural draft in the entire Adriatic, which is about 18 m at the pier itself. Moreover, the container terminal in Trieste has an extremely favorable climate and the risks of delays in handling are reduced to a minimum. Due to daily rail connections to the main European destinations and industrial Europe areas, Trieste is the port with an international scope. The port has natural depth of 18 m for the latest generation of container ships, making Trieste the ideal access location for traffic to/from the Far East and for intra-Mediterranean trade [21].
The port of Venice is an ideal place for transit traffic to and from other parts of northern Italy, as well as to Slovakia, the Czech Republic, southern Germany, and Austria. On a weekly basis, the container terminal establishes direct connections with countries of the Eastern Mediterranean such as Egypt, Turkey, Israel, Cyprus, etc. The terminal is very well protected from wind and other sea and weather conditions, so port operations run smoothly, minimizing the time ships spend in port. To expand its role for container traffic, the port of Venice will increase capacity by building a new terminal that will in the beginning accommodate up to 1,400,000 TEU per year [22].
Ravenna Container Terminal is a specialized terminal for trade between Eastern Mediterranean countries such as Egypt, Israel, Cyprus, Lebanon, and Italy. The terminal is in the Ravenna industrial complex and is very well connected by rail and road to the most developed cities in Italy such as Verona, Milan, and Turin. The terminal offers a wide range of services but specializes mainly in perishable goods and refrigerated cargo. Investment plans of Ravenna Container Terminal (RCT) entail a change in platform equipment (four STS up to 18 rows) and yard (three new RMGs) and strengthening of port infrastructures: deepening of the seabed of the port up to 14.5 m, investments in the railway network, construction of a new quay of over 1000 m available to the new container terminal, and a simplified logistics zone [23].
Table 1 shows the container throughput as total TEU traffic in the NAPA terminals from 2012 to 2022. None of the ports, except Trieste, has transshipment traffic, so for those ports, the total traffic corresponds to the gateway traffic. For the port of Trieste, in addition to the total traffic, the gateway traffic is shown separately. These data are used in the calculations of the performances for evaluating the market role and competitiveness of a single terminal. Although transshipment traffic can be a more focused measure for ports vying to be major transshipment hubs, it is important to consider both transshipment and gateway cargo volumes to obtain a complete picture of a port’s competitive position, as different ports may specialize in different types of cargo handling based on their geographical and market contexts. In subsequent calculations, the data for Trieste as total TEU traffic and especially as gateway TEU traffic were taken separately.

Table 1.
Container traffic of the North Adriatic terminals from 2012 to 2022.
The above Table 1 and Figure 2 show that the port of Koper is currently the strongest port in the Northern Adriatic in terms of container traffic. It is followed by the port of Trieste, which has seen strong growth in container traffic, especially in the period between 2016 and 2019, followed by the port of Venice, which has seen a slight decrease in container traffic, especially after 2018, and then the ports of Rijeka and Ravenna, which are at the bottom. However, the constant growth of container traffic in Rijeka should be emphasized, and even during the COVID-19 pandemic the terminal maintained a positive trend of traffic growth.
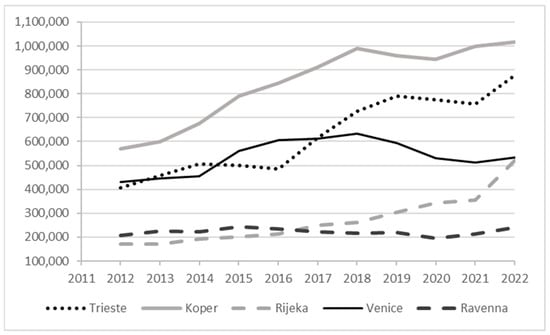
Figure 2.
Container total throughput (in TEUs) of the North Adriatic container terminals from 2012 to 2022.
Using only raw operational data provides valuable information but lacks the context and comparability required to understand market dynamics fully. Calculating market share standardizes data, offers relative performance measures, provides context, identifies trends, and delivers strategic insights, all of which are essential for a comprehensive analysis of a container port’s competitiveness and market positioning.
3. Techniques for Evaluating Share and Position on the Container Market
In this part of the paper follows a brief description of the techniques that can be applied to measure the competitiveness and efficiency of the ports. Further, the competitiveness of the container terminals of the NAPA, shares, and position on the container transport market in the period from 2012 to 2022 are evaluated. In each subsection of Section 3, there are results obtained based on the data found in Table 1 and calculated using the associated formulas.
3.1. K-Firm Concentration Ratio (CRk)
The concentration ratio of K-firms (CRk) is the share of the leading firms in an industry in the total production. A higher concentration ratio indicates a market moving closer to an oligopoly or monopoly. The concentration ratio can range from 0 to 100%, where 0% indicates a highly competitive market, while 100% means that the market is highly oligopolistic or even monopolistic if there is only one company. Between these two concentrations, there are low-, medium-, and high-concentration markets. The formula for calculating CRk is [2]:
where, in the case of port traffic, Si represents the port traffic share i in each market, while k denotes the number of ports for which the concentration ratio CRk is calculated. The CRk ratio counts only the k largest ports in a market, while ignoring the role of the other ports. To avoid certain drawbacks of the CRk coefficient the Hirschman–Herfindahl index (HHI) can also be used for calculation.
The concentration ratio CR2 measures the combined market share of the two largest companies as a percentage of the total market output. A higher CR2 ratio indicates a less competitive market, i.e., the lower the concentration ratio, the more competitive the market. If the ratio is below 40%, the market is considered competitive; if it is above 40%, the market is oligopolistic. Table 2 presents the K-firm concentration ratio, CR2, of the North Adriatic container terminals for the selected years 2012, 2015, 2018, and 2022.
Table 2.
CR2 concentration ratio of the North Adriatic terminals for years 2012, 2015, 2018, and 2022.
Table 2 shows that the container market in the Northern Adriatic is extremely oligopolistic. In 2012, the terminals in Koper and Venice had a market share of 55.94%, while in 2015 the market share increased even further to 58.81%. In 2018, taking the total traffic for Trieste, the Trieste container terminal replaced Venice, and today Koper and Trieste occupy a leading position among the container terminals of the Northern Adriatic. It is also evident that the market share of the two leading container terminals of Koper and Trieste is growing year by year, in total 60%, from which it can be concluded that the market has become less competitive or more oligopolistic in the last decade. Taking only gateway traffic for Trieste, the market share for Koper and Venice is higher, and Trieste came in second place in 2022 and not in 2018. Greater market shares are noted for Koper, they reached a maximum of 39.05% in 2018 and experienced a subsequent decline to 34.99% in 2022.
The market shares of the ports exhibit different trends over time, according to the K-firm concentration ratio (CR2) research. Koper generally holds the largest market share across all years, both in total and compared to the gateway traffic calculation for Trieste. Trieste and Rijeka have growing market shares, but Venice’s market share is trending downward. The overall CR2 values show a dynamic competitive environment among these ports, with a rising concentration from 2012 to 2018 and a modest reduction in 2022.
3.2. Hirschman–Herfindahl Index (HHI)
The Hirschman–Herfindahl index (HHI) is a calculation utilized to determine the size of a company and its relationship to its industry, as well as an indicator of the level of competition between those companies. The HHI is expressed as the sum of the squares of each port’s transportation market share. The HHI is calculated using the following formula [2]:
where Si represents the proportion of traffic handled by port i in a given market, while n stands for the total number of ports in that market. The share can vary from 1/n to 1, meaning, in the case of integers, it could go up to 10,000. If the Herfindahl–Hirschman index (HHI) is below 1000, the market is considered unconcentrated; between 1000 and 1800, it is moderately concentrated; and above 1800, it is classified as highly concentrated.
Table 3 shows that the market of the Northern Adriatic ports is highly concentrated. In all previous years, the HHI was well above 1800, and it increased year by year, peaking at 2531 in 2018. In 2022, the HHI decreased to 2378, and this decrease in the last four years indicates that there is a somewhat increased competition, but it is still extremely high, indicating that the market of the Northern Adriatic container terminals is highly concentrated, especially in the terminals of Koper and Trieste.
Table 3.
HHI of the North Adriatic terminals for 2012, 2015, 2018, and 2022.
Koper’s HHI values show a typically growing trend between 2012 and 2018, rising to 1225 in 2018, and then declining to 1017 in 2022. When accounting for gateway traffic, Trieste shows higher HHI values, rising from 1227 in 2012 to 1524 in 2018, then falling to 1224 in 2022.
Different trends in market concentration are seen throughout the ports according to the examination of the HHI values. Particularly when taking Trieste gateway traffic into account, Koper has a high and growing market concentration. While Trieste and Rijeka show rising market concentration over time, Venice and Ravenna show declining or stabilizing trends in market concentration. The aggregate total HHI figures for all ports show that market concentration generally increased between 2012 and 2018, then somewhat decreased in 2022. This means that throughout the course of the next ten years, the competitive model and market dynamics may change.
3.3. Entropy Index (EI)
The entropy index (EI) is a key statistical method used to highlight variations in distributions at specific moments and to examine changes in technology over time. In its most basic form, the first-order formula for calculating the entropy index is [2]:
In the formula, Si represents traffic share from port i, while n is the number of ports in each market. The entropy index ranges from 0 to ln(n). A value of zero indicates a monopoly, signifying that the market is dominated by a single port, whereas ln(n) indicates that container traffic is evenly distributed across all ports. The outcomes derived from the equation mentioned earlier are not comparable because the maximum value of the entropy index varies based on the number of ports, n. Therefore, the entropy index is often normalized according to the following formula:
It should be emphasized that entropy is the opposite of concentration: the higher the level of entropy measured, the higher the value of the index, and thus the lower the degree of market concentration. The entropy index is often used to evaluate the strategy of some companies. This method is very similar to the HH index, but the main difference is that the HHI method assigns a higher weight to larger shares, while the entropy index assigns a lower weight to larger shares.
In Table 4 the entropy indices for the North Adriatic ports for four selected years are presented. It can be seen that the entropy index was 1.5197 in 2012, decreased in 2015 and 2018, and then increased again in 2022 to the level of 2012, indicating that, according to this method, the market of container terminals in the NAPA in the last four years has become more competitive, i.e., has a lower degree of market concentration.
Table 4.
Entropy index of the North Adriatic terminals for 2012, 2015, 2018, and 2022.
There is a discernible variation in the entropy index values over time for both sections of the table. The patterns between the two sets of EI values are similar, however, there is a slight variation in the amount of change. When compared to the total traffic-based EI, the EI values based on gateway traffic for Trieste and total traffic for other ports are significantly lower in 2012 and 2015, but higher in 2022.
The decrease in the EI values till 2018 implies that traffic distribution became less diverse, which may point to a greater concentration of traffic in a smaller number of ports. This tendency appears to be reversing in 2022, as evidenced by the increase in EI, with a more diversified distribution of traffic among the ports.
Over time, the North Adriatic ports’ traffic distribution and diversification have changed, and these changes are reflected in the values of the entropy index. Overall, the pattern indicates that diversification decreased until 2018 and then increased in 2022. Understanding the changes in traffic patterns and the relative significance of various ports in the area is made easier with the aid of this analysis. These data can be used to guide future strategic decisions that will optimize traffic distribution and boost port operations efficiency.
3.4. Gini Coefficient (GC)
The Gini coefficient (GC) is the most important merit of inequality in the economy. From a statistical perspective, the GC is a function of the average difference and the most used formula to calculate the Gini coefficient is [2]:
The meaning of xi is cumulative share of the population of all terminals in a market (where x0i = 0 and xn = 1), and yi is the cumulative share of the demand of the variable under study, e.g., terminal traffic (where y0 = 0 and yn = 1). The Gini coefficient measures the cumulative share of traffic composed of different shares of terminal traffic in each market. The main drawback of the Gini coefficient is that the calculation does not consider the absolute number of terminals. The GC spans from 0 to 1, where zero represents complete equality and one represents complete inequality. The Gini coefficient is the area between the line of perfect equality and the Lorenz curve. The Lorenz curve can be used to explain the cumulative distribution of market shares of terminals and to calculate the degree of market concentration.
The Gini coefficient has increased year by year till 2018 (Table 5), which means that the market is becoming more unequal. The coefficient peaked in 2018, when it was 0.2847, indicating that in 2018 there was the highest inequality in the container market but there was a tendency towards equality in 2022.
Table 5.
Gini coefficient.
According to both sets of Gini coefficient values, inequality increased until 2018 and then decreased starting in 2022. In contrast to the total traffic-based GC, the GC values based on the gateway traffic for Trieste and the total traffic for other ports are consistently lower in 2022 than they are in the previous years. The GC values indicate that, until 2018, there was a rise in inequality in the traffic distribution among the North Adriatic terminals, which was then followed by a decline in inequality in 2022.
Figure 3 shows the Lorenz curve (bottom line) for 2022, where the x-axis indicates the cumulative share in the total number of observed terminals, while the y-axis indicates the cumulative shares in terminal traffic, ordered from the terminal with the lowest traffic to the port with the highest traffic. Area A shows traffic volume inequality. The distribution of traffic among the ports in 2022 is shown graphically by the Lorenz curve. The distribution is more equal the closer the Lorenz curve (bottom line) is to the diagonal line of equality (upper line). Inequality is indicated by deviations from the diagonal.
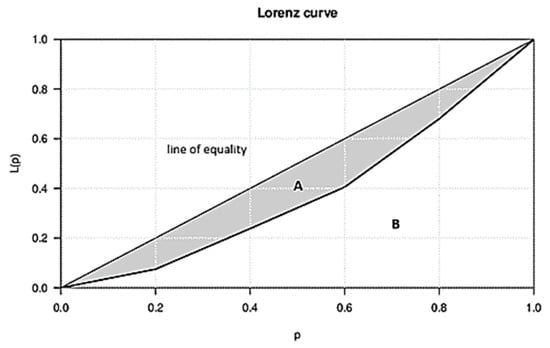
Figure 3.
Lorenz curve for 2022.
Changes in the traffic distribution among the North Adriatic terminals over time can be seen by analyzing the Lorenz curve and the Gini coefficient. Changes in traffic patterns and port utilization are suggested by the initial increase in inequality up until 2018 and the subsequent decrease in 2022. Making strategic decisions to guarantee a more equitable distribution of traffic among the terminals and comprehending the dynamics of port traffic depend heavily on this data.
Table 6 summarizes and presents the results of the previously used techniques to identify and analyze the competitiveness, position, concentration, or market shares of the observed North Adriatic container terminals.
Table 6.
Summary of all concentration indices for five North Adriatic container terminals.
At the beginning of the period, all indices indicate a higher concentration in the NAPA container market, while in the last observed year, 2022, the index values indicate a movement towards more competition, less concentration, and more equality. It should be emphasized that these values are slightly different in absolute amounts compared to the initial year and therefore these insignificant changes in relative amounts should be taken with caution.
The North Adriatic container terminals’ numerous concentration indices for the years 2012, 2015, 2018, and 2022 are compiled in this table. The concentration ratio (K-CR2), Gini coefficient, Herfindahl–Hirschman index (HHI), entropy index (EI), and normalized entropy index (normalized EI) are some of these indices. The table is split into two sections: Trieste gateway traffic and total traffic for the other ports make up the second section, while the first part is based on total traffic for each port.
According to K-CR2 and HHI, there was a rise in market concentration up until 2018, which suggests that fewer ports handled a greater proportion of traffic. The decline in 2022 suggests that traffic is being redirected among the ports.
According to the entropy index and normalized EI, there was a decline in diversification from 2018 to 2022, when there was a return to more varied traffic patterns.
The trend of the Gini coefficient, which shows rising inequality in traffic distribution up until 2018 and a notable decline in 2022, is consistent with the findings from other indices.
From 2012 to 2018, the North Adriatic container terminals saw an increase in market concentration and traffic distribution inequality, according to the analysis of the concentration indices. Nonetheless, a discernible change toward a more varied and balanced traffic distribution is seen in 2022. Port authorities and other stakeholders need to know these insights in order to plan for future developments and make sure that traffic is distributed fairly among the terminals.
3.5. Boston Consultant Group (BCG) Matrix
However, port competitiveness can also be measured by visualizing market dynamics by market share and average growth rate with the BCG matrix. The BCG growth–share matrix is a strategic management tool that helps companies determine which areas of their business to focus on and which ones they might consider divesting. The matrix is a four-quadrant chart, with the y-axis representing the market growth rate and the x-axis showing the company’s market share relative to its main competitor. Developed by the Boston Consulting Group, it was first introduced in 1970. The four cells of this matrix are: Stars, Cash Cows, Question Marks, and Dogs. The BCG believes that the matrix has not lost its value in the face of rapid and unpredictable change in today’s marketplace, but its importance has changed [25].
The BCG matrix for these ports uses 2022 as the snapshot for market share, but the growth rate takes a longer view. It reflects how much each port’s business has grown over the past decade (2012–2022). In Figure 4, the market share is on the x-axis, while the growth rate is on the y-axis, both in percentages. The specific placement of the vertical growth line follows the average market growth rate for the NAPA ports’ container traffic. The placement of horizontal share line is based on the average market share within the NAPA ports.
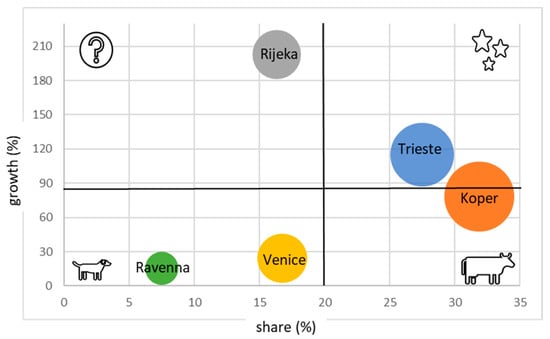
Figure 4.
BCG matrix for the northern Adriatic ports in 2022 relative to 2012.
Koper is positioned at the intersection of the Cash Cows and Stars quadrants, characterized by a high market share and a relatively high growth rate. This positioning is advantageous due to its ability to generate traffic with minimal investment. Trieste is located in the Stars quadrant, indicating that it is comparable to Koper, albeit with a slightly lower market share and a higher growth rate over the past decade. It also holds significant future potential. Rijeka is positioned in the Question Marks quadrant, characterized by a relatively low container market share compared to the leading port of Koper. However, it has experienced the highest growth rate over the past decade and exhibits a tendency to transition into the Stars quadrant. Venice and Ravenna are in the Dogs quadrant, with a relatively low market share and a low growth rate with no development perspective, the former having even lower share.
4. Ranking of the Container Terminals of NAPA
4.1. Data Collection and Statistical Analysis of Terminals’ Traffic
During the period from 1 February 2022 to 15 April 2022 (75 days), the traffic of container vessels in five ports of the NAPA (Trieste, Koper, Rijeka, Venice, and Ravenna) was recorded through the web resource VesselFinder [26] with the following data: vessel size in dwt, time at anchorage (if the vessel was at anchorage before docking), and time at berth. The purpose of this analysis is to make a comparison between the individual ports in the NAPA group, i.e., to analyze each port individually for its peculiarities. The data were collected according to the following criteria: (1) the arrival time of the vessels (at anchor and at the berth) and the departure time of the vessel, (2) their status (whether they were at anchor or went directly to the berth), and (3) the size of the vessel (expressed in the unit dwt: summer deadweight). Based on the data collected during the observation period, the following results were obtained for each port individually: total number of vessels, total number of days spent by these vessels at anchor and/or at the berth, average time spent at berth, average time spent at the terminal, proportion of a given size of vessel (in dwt).
Monitoring of traffic during the observed period revealed that in the ports of Trieste, Koper, and Ravenna vessels were moored at two berths, in Venice (with the two container terminals TIV and PSA-Vecon) vessels were moored at two and in some cases at three berths simultaneously, while in the port of Rijeka ships were moored at only one berth, although it has two possible berths with the necessary handling and transport facilities for container vessels. According to the Rijeka terminal, only one berth has been used for almost two years due to work on deepening the quay. Once completed, the work will be much easier, as two ships will be able to berth at the same time. Deepening to a depth of 16.5 m is crucial to be able to offer additional capacity. A greater depth will allow larger ships to berth, and two new gantry cranes will be needed to handle containers at the terminal. The order for the new super post-Panamax container cranes is therefore in the final stage and delivery is expected in about 18 months (from July 2023) [27].
Therefore, as an indicator of an unoccupied berth, it is considered that Trieste, Koper, and Ravenna have two berths for simultaneous handling of container vessels, Rijeka one berth, and Venice three berths. In addition, the internet source VesselFinder [26] has not recorded any data on anchoring of vessels before berthing at the quay for the container terminal in Rijeka, while it records data on anchoring for all other terminals.
All vessels are grouped into five classes: up to 10,000 dwt, from 10,000 to 30,000 dwt, from 30,000 to 45,000 dwt, from 45,000 to 120,000 dwt, and more than 120,000 dwt, since in these units’ data on vessel arrivals are available through the web sources MarineTraffic [28] and VesselFinder [26].
Usually, in different sources container vessels are classified based on their size, measured in twenty-foot equivalent units (TEU), which is the standard unit to measure a vessel’s cargo-carrying capacity. According to MagicPort, in 2003 “the main container vessels size categories are: Feeder (up to 1000 TEU), Feedermax (1000 to 3000 TEU), Panamax (3000 to 5100 TEU), Post-Panamax (5100 to 10,000 TEU), New Panamax (10,000 to 14,500 TEU) and Ultra Large Container Vessel (ULCV, 14,500 TEU and above)” [29]. From March 2023, the MSC Irina and the MSC Loreto, built by Yangzijiang Shipbuilding, hold the record for the largest container ship with a capacity of 24,346 TEU [30]. Using various examples and sizes of container vessels, it was found that the ratio between dwt and TEU is about 10.
It is observed that vessels up to 45,000 dwt arrive at the Venice and Ravenna terminals, while vessels up to 120,000 and up to 240,000 dwt arrive at the other three terminals. Since no vessels over 45,000 dwt docked in Venice and Ravenna, although a total number of port days is given in the statistical data, due to the different number of vessels by size in each terminal and the absence of ships over 45,000 dwt in Venice and Ravenna, these data were not taken into account in the ranking as they were not valid, and instead the data on the average number of port days for each vessel multiplied by the correction factor were used.
The correction factor is used for the average number of days at the quay, since the proportion of vessels of certain sizes at each terminal was not the same. Thus, in Venice and Ravenna, as 100% of vessels were up to 45,000 dwt, for these two terminals the factor is 1, while for Trieste this factor is 0.83 (determined as the proportion of vessels up to 45,000 dwt), for Koper it is 0.78, and for Rijeka it is 0.66 (determined analogously). Moreover, it should be noted that the rankings determined for the indicator average number of port days coincide with the ranking according to the median.
4.2. Evaluation of the NAPA Terminals According to the Ranking of the Individual Statistical Indicators
4.2.1. Ranking of Terminals from the Shipping Companies’ Point of View
To make a realistic comparison by evaluating the five observed terminals, each terminal is ranked according to individual statistical indicators on a scale from 1 to 5, such that rank 1 is assigned to the terminal with the best value for each indicator and rank 5 to the worst. The ranking is performed in two ways: from the perspective of the terminal users (shipping lines) and from the perspective of the terminal as a service provider. In any mass service system, there are two opposing parties, service providers and service users, and each of these parties has different factors that are important or less important and rates these factors from that point of view.
From the shipping companies’ perspective, the following indicators are ranked higher: lower tariff, a smaller number of vessels, lower percentage of vessels sailing directly to the berth without anchoring, shorter average time spent at the berth, and lower average number of days at the berth. Although the total cost of using a port is a more comprehensive measure than just the tariff levels, due to inability to collect all the relevant data/costs for the observed ports, tariffs have been considered.
Several relevant attributes were selected (in order of importance) in consultation with experts in the field. A total of six experts were consulted for their insights and evaluations, selected based on their extensive experience and involvement in relevant port projects and professional roles within the industry. These experts are members of operations departments, management departments of various ports, or port supervisory boards. Through these discussions, it was agreed that the listed indicators are the most suitable: tariffs, average number of days at berth, average time spent at anchorage, proportion of vessels sailing directly to berth without anchoring, and number of vessels during the data collection period (Table 7).
Table 7.
The indicators for evaluation and ranking from the shipping companies’ perspective.
The ranks assigned to the terminals and attributes shown in Table 8 are based on the data from Table 7. Higher ranks are associated with the following indicators: higher tariffs, a larger number of vessels, and a higher percentage of vessels sailing directly to the berth without anchoring. Conversely, lower ranks are assigned to terminals with longer average times spent at anchorage and a higher average number of days at the berth.
Table 8.
Ranks assigned to the terminals and attributes.
The ranking was carried out using the R method, a decision method based on the ranking of alternatives and attributes [31]. According to Rao and Lakshmi (2021), “the R method ranks the alternatives with respect to each of the attributes based on the corresponding performance measures. Similarly, the ranks are assigned to the attributes based on their perceived importance by the decision maker. The ranks assigned to the alternatives with respect to each attribute and the ranks assigned to the attributes are converted into corresponding weights, and the final composite scores of the alternatives are calculated using these weights”. The weights of the attributes are given in Table 9 and calculated in the following way [31].
Table 9.
Final composite ranking of terminals, weighting of individual terminals and attributes, and combined scores.
First, the following needs to be calculated: 1/reciprocals of ranks up to n, i.e., 1/(1/1 + 1/2 + … 1/n). For example, for rank 1 it is 1, for rank 2 it is 0.6667, …, for rank 5 it is 0.438. The total of all results is then 3.13. Second, the weights for all ranks are calculated, so the weight assigned to rank 1 is 1/3.13 = 0.3195 and the final weight assigned to rank 5 is 0.438/3.13 = 0.1399. Third, the composite score for alternative terminal T1 is calculated as: 0.1399 × 0.3195 + 0.1534 × 0.213 + 0.1399 × 0.1743 + 0.1399 × 0.1534 + 0.1534 × 0.1399 = 0.1447, and for the other terminals analogously.
From the composite scores of the terminals, it can be noted that the terminal designated as T3 is the first choice and T5 is the second choice, so the ranking of the terminals, with respect to the terminal service user, is the following: T3, T5, T2, T4, T1 (i.e., Rijeka, Ravenna, Koper, Venice, and Trieste).
4.2.2. Ranking of Terminals from the Terminals’ Point of View
From the combined ratings of the terminals, the terminal labeled as T3 is the first option and T5 is the second option, so ranking of the terminals in terms of the user of the terminal services is as follows: T3, T5, T2, T4, T1 (i.e., Rijeka, Ravenna, Koper, Venice, and Trieste).
Of the attributes listed, the following are selected in ranking analysis as the most important in order of importance: available capacity, number of vessels, sea depth, berth occupancy, number of cranes (berth and yard), terminal area, and railway tracks and all the stated indicators have higher ranks for bigger values except unoccupied berth (in Table 10) and ranking of attributes and the terminals is in Table 11.
Table 10.
The indicators for evaluation and ranking from the terminals’ point of view.
Table 11.
Ranking of the terminals and attributes.
Given that the terminals in Koper and Rijeka can be considered to have the same sea depth, the rank is assigned as the average mean between ranks 2 and 3, i.e., 2.5, and the same applies to the terminals in Venice and Ravenna, since the sea depth is 11.4 and 11.5, and the rank for both terminals is an average between 4 and 5, i.e., 4.5.
As far as the draught in Rijeka and Koper is concerned, Rijeka had an advantage over Koper for a long time because the natural draught was greater (11.2 m compared to 10 m in Koper). Previously, ships were sometimes unloaded in Rijeka before calling at Koper. Following the seabed dredging in Koper, the port’s draught was increased to 14.5 m, causing Rijeka to lose its position as the first port of call in the rotation along with its associated benefits. However, recent construction at the Rijeka container terminal, specifically the expansion of berth 2, has resulted in a deeper draught of 14.88 m [19,20]. Despite this, Koper has maintained its status as the first port of call due to its larger overall container traffic. In the future, ports with a draught of 18 m or more will hold a greater competitive advantage, as larger ships, such as those with capacities of 16,000 TEU or more, will be unable to dock at ports in the northern Adriatic. The only exception is Trieste with a current draught of 18 m [12]. Table 12 shows the weighting of the attributes of the terminals, the combined scores, and the composite ranks.
Table 12.
Final results of the ranking from the perspective of the terminals.
According to the implemented method of ranking from the terminal’s point of view, the calculation results in the following order: T2, T1, T4, T3, T5 (Koper, Trieste, Venice, Rijeka, and Ravenna).
4.3. Rank Aggregation for PLSCI and CPPI
In this part of the paper, two indices that monitor and evaluate container terminals are considered: port liner shipping connectivity index (PLSCI) and container port performance index (CPPI) for the year 2022. To obtain a more realistic insight into the position of the terminal from the point of view of these two different indicators, the procedure of ranks aggregation is then applied.
The PLSCI is made for more than 900 container terminals in the world. It is produced from six elements supplied by MDSTransmodal [32]:
- weekly scheduled number of ship calls;
- yearly allocated capacity in TEUs;
- count of regular liner services operating to and from the port;
- number of shipping companies providing liner services to and from the port;
- average vessel size (in TEU) used in the liner services;
- number of other ports linked to the port by direct liner services.
The index is computed by dividing each terminal’s value for each component by the highest value of that component in 2006. Then, the average of the six components for the terminal is calculated. This terminal average is subsequently divided by the highest average value in Q1 2006 and multiplied by 100, resulting in a maximum PLSCI of 100 in Q1 2006. The PLSC index is given on a quarterly basis where the maximum Q1 2006 = 100 but it is adjusted to annual average values. In Table 13 the PLSC indices for the NAPA terminals are shown for further research purposes (year 2022) but also, for comparison only, data for the two container terminals with the highest indices are separated and included in Table 13. Looking at the PLCP index, the terminals in Ravenna and Venice are in the worst position, while Trieste, Koper, and Rijeka have similar values, with Koper being the best.
Table 13.
The average yearly indices for NAPA terminals, Hong Kong, and Shanghai.
Another important index used in the research of this paper is the container port performance index (CPPI), which aims to identify opportunities for improvement that can eventually benefit all stakeholders, from shipping companies to consumers and state governments [34]. The CPPI 2022 was created on the basis of total port time for the calendar year 2022 and only includes ports that had at least 24 valid port calls within the 12-month study period, hence 348 ports are included [34].
It is noteworthy that the terminals of Rijeka, Trieste, and Koper are in the last three places when the index is considered by region (the NAPA ports are included in the Europe and North Africa region in this report). Moreover, according to the realized throughput, Venice, Trieste, and Koper belong to the group of medium terminals (between 0.5 million and 4 million TEUs per year), while Rijeka and Ravena belong to the group of small terminals (below 0.5 million TEUs per year). In the total ranking of 348 terminals, Rijeka, Koper, and Trieste are at the bottom, ranked 334, 345, and 339, respectively, Venice is slightly better placed (246), while Ravena, according to this index, occupies the best place (161) among the five observed terminals in the NAPA group [34].
The research problem in this paper is further to find a combined index based on the two indices PLCP and CPP described above. For this purpose, after the definition of the collective (combined) index, the procedure of rank aggregation is carried out.
According to Kaur et al. (2015), “rank aggregation is a method of combining multiple ranked lists into a single ranked list. Rank aggregation is needed to combine many different rankings for the same set of alternatives or candidates to obtain a better ranking. The concept of rank aggregation is especially needed in situations where the task is to rank a list of multiple alternatives based on one or more criteria. In such conditions, one of the goals of rank aggregation is to determine the best alternative” [35].
The methodology is implemented as follows. In a first step, the indices are scaled, and then the scaled indices are summed to determine the final rank, which is shown in Table 14. Variables are often normalized when performing an analysis in which various variables are measured on distinctive scales and each of the variables should have the same range. This prevents one variable from having too much influence. Therefore, each index is scaled to take on values in the interval (0, 1) using the following formula for linear transformation, normalized value zi [36]:
where m and M are the minimum and maximum value of the index, respectively, and xi is the i-th value in the dataset.
Table 14.
Aggregated rankings for five terminals with PLSC and CPP index values.
The terminal with the lowest index always receives the scaled value 0, the terminal with the highest index always receives the scaled value 1, while other terminals receive a scaled value between 0 and 1. After the indices are scaled, they are added together to obtain a combined index. In the end, the order is determined by ranking the terminals according to the combined index in descending order. Therefore, the terminal with the highest combined index is placed first and the terminal with the lowest combined index is placed last (Table 14).
The results of the overall ranking for the two indices show that Koper and Ravenna are at the top and occupy first place, Trieste and Rijeka share second place, while Venice occupies third place in this group.
Considering the different results obtained depending on the methodology used to rank and study the position of a single terminal, it is perhaps best to take a broader perspective to make the conclusion and decision on which terminal in this group does the best business and occupies first place and what positions the other terminals occupy. The broader aspect in this case involves looking at the process of transporting goods from origin to destination, with terminals being only intermediaries in this distribution chain, taking into account the logistics performance index (LPI) calculated for each country and not for each terminal individually. It was found that the LSCI correlates strongly with other measures, such as the LPI [37].
The LPI is an interactive benchmarking tool aimed at helping countries recognize the challenges and opportunities in their trade logistics and identify ways to enhance their performance. It enables comparison among 139 countries and is assessed from two perspectives: one based on the perceptions of international logistics experts evaluating their partner countries, and the other assessing the actual speed of global trade using supply chain tracking data. According to Connecting to Compete (2023) “the components of the LPI are: the efficiency of customs and border clearance, the quality of trade and transport infrastructure, the ease of organizing shipments at competitive prices, the competence and quality of logistics services, the ability to track shipments, and the frequency of on-time deliveries” [38].
In Table 15, LPI results for Italy, Slovenia, and Croatia are extracted, where the LPI score for Italy is 3.7 and for Slovenia and Croatia it is 3.3. Furthermore, for five of six components, Italy has a better score then Slovenia and Croatia, the exception is international shipments. The numbers of services, alliances, and international connections are also much higher in Italy than in Slovenia and Croatia.
Table 15.
LPI results (2023) and data on lead times from supply chain tracking systems, for container shipping (2022).
5. Conclusions
In this paper, the container terminals of Trieste, Koper, Rijeka, Venice, and Ravenna, which are members of the North Adriatic Port Association, are the focus of the study. The aim of the research is to obtain the desired results in a simple and efficient way and to apply the methods used to similar groups of subjects that have the same purpose. The analysis of the traffic of each terminal in the period from 2012 to 2022 shows that the terminal in Koper convincingly dominates container traffic in the North Adriatic region, immediately followed by the container terminal in Trieste, which has taken over this position from Venice in the last six years. At the very bottom, in terms of the number of TEUs handled, are the Rijeka and Ravenna terminals. What is significant for the terminal in Rijeka, however, is that there has been a notable increase of 200% in traffic volume in the last 10 years, while the container terminal in Ravenna has stagnated.
Initially, all indices reflect a high concentration within the North Adriatic container market (NAPA). By 2022, these indices indicate a trend towards increased competition, reduced concentration, and more equitable distribution. Although the absolute changes are relatively small compared to the starting year, these relative shifts should be interpreted with caution. The research presents various concentration indices for the North Adriatic container terminals for the years 2012, 2015, 2018, and 2022. The indices included are the concentration ratio (K-CR2), Gini coefficient, Herfindahl–Hirschman index (HHI), entropy index (EI), and normalized entropy index (normalized EI). The research has addressed total traffic for each port as well as gateway traffic for Trieste and total traffic for the remaining ports separately. The K-CR2 and HHI imply an increase in market concentration up to 2018, suggesting that a smaller number of ports managed a larger share of traffic. The decline in these indices in 2022 points to a redistribution of traffic among the ports. The entropy index and normalized EI reflect a decrease in traffic diversification until 2018, followed by a resurgence of varied traffic patterns by 2022. The trend of the Gini coefficient aligns with other indices, showing increasing inequality in traffic distribution until 2018, followed by a significant decrease in 2022. From 2012 to 2018, the North Adriatic container terminals saw heightened market concentration and traffic distribution inequality.
The research revealed that there is no significant competition, i.e., the market is rather oligopolistic. At the top, the terminals in Trieste and Koper convincingly dominate with 60% of container traffic, while the shares of Rijeka and Venice are equal with 16% each, and Ravenna brings up the rear with almost 8%. Based on the applied concentration techniques, it was found that at the beginning of the period, all indices indicate more concentration in the container market.
However, by 2022, there is a clear movement towards a more diversified and balanced traffic distribution. It should be emphasized that these values are slightly different in absolute amounts compared to the initial year and therefore these insignificant changes in relative amounts should be taken with caution.
The analysis reveals some interesting trends among the Adriatic ports. Koper stands out as a champion, occupying a sweet spot between high market share and respectable growth. This prime position allows it to attract traffic efficiently without needing major investments. Trieste is Koper’s close competitor, boasting a slightly smaller market share but with even more impressive growth over the past ten years. This suggests significant future potential for Trieste. Rijeka, on the other hand, is a bit of a wildcard. While it currently holds a lower market share compared to Koper, it has been growing the fastest over the past decade. This rapid growth indicates Rijeka has the potential to become a major player (like those in the Stars quadrant). Venice and Ravenna, unfortunately, seem to be lagging behind. They have a low market share and are not growing much, suggesting they might not be strong contenders in the future. Venice, in particular, seems to be struggling the most.
Results of the ranking method shows that with respect to the terminal’s point of view the order of terminals is Koper, Trieste, Venice, Rijeka, and Ravenna. From the shipping lines’ point of view, the order is reversed, so that for the shipping lines the most favorable terminal is in Rijeka, then Ravenna, followed by Koper, Venice, and Trieste. The results of the overall ranking for the two indices PLSC and CPP show that Koper and Ravenna are at the top and occupy first place, Trieste and Rijeka share second place, while Venice occupies third place in this group. According to LPI scores for countries, only not individually for each terminal, Italy is in first place while Slovenia and Croatia with the same values of indices are in second place. The final order, considering all the rankings performed, indicators, the BCG matrix, and the future development plans of each terminal, is: Koper, Rijeka, Trieste, Venice, and Ravenna.
The five NAPA ports are either expanding or upgrading their port facilities or have plans in place to do so. They share the objective of increasing container traffic and establishing themselves as a multi-port gateway, particularly given the dynamic economies of Asia and Central and Eastern Europe. The NAPA operates under the principle of “coopetition”, i.e., international cooperation but internal competition. The Mediterranean region is a market with strong demand that is likely to grow further in the forthcoming years. Hence, further measures and improvements are needed to exploit the natural advantages of these five ports and improve their competitiveness and overall performance.
Koper is close to its capacity limit, but it still has space and realistically plans to keep existing cargo and attract new cargo. Trieste has spare capacity and is in a strong expansion phase, and MSC, as co-owner of the terminal, is involved with almost half of the traffic. It is investing a lot in logistics, increasing the number of trains to Hungary, opening the Polish and Czech markets, and aiming to make Trieste the center for distribution and logistics of goods from the Far East, especially for the part of the flow controlled by shippers. Rijeka has an existing base and the commissioning of the new Zagreb Deep Sea container terminal is expected soon, for which it is necessary to secure and attract additional cargo to employ these new capacities. The general increase in container traffic in the Mediterranean is a great opportunity for the port of Venice to increase its market share. Ravenna container terminal serves as a crucial container gateway in the Adriatic Sea for major East Mediterranean trades. Its direct connection to transshipment hubs links it with the significant rail hub of Melzo (Milan), facilitating rapid and direct access to central and northern Italy, as well as to other parts of Europe (including connections to and from Austria, Germany, Benelux, and Great Britain).
From a shipper’s perspective, the situation in the container market is as follows. The 2M alliance is focused on Koper, while MSC is focused on Trieste. Then there is the “Ocean Alliance”, which includes Chinese Cosco, Evergreen, OOCL, and CMA CGM, where CMA CGM is focused on the terminal in Malta, and the Chinese shipping companies on Piraeus in Greece, because they built a large terminal in Greece. The alliance that includes Japanese shipping companies, UASC, Happag Lloyd, and Yang Ming has never been present with large amounts of cargo in the Adriatic.
The obtained outcomes realistically indicate the position of an individual terminal in relation to several distinct aspects and objectives of the research, and the obtained ranking can be used as an authoritative basis for further actions to maintain and/or improve the current position. The applied methodology can be used in various cases to determine the position of an individual subject in a related group. These findings are essential for port authorities and stakeholders to plan future developments and possibly promote fair traffic distribution among the terminals.
The methodology presented in this paper can also be further applied by considering other indicators not considered here, other groups of terminals operating in a narrow geographical area, and moreover by combining several related indices to calculate a collective (combined) index. The main task of future research is to provide an independent and unbiased assessment of the likely mutual needs for the current and potential port facilities on the basis of the NAPA’s combined strengths in the container market and the expected future business environment.
Author Contributions
Conceptualization, S.H. and M.H.; methodology, S.H.; software, M.H.; validation, M.H., M.N. and L.G.; formal analysis, S.H. and M.H.; investigation, S.H. and M.N.; resources, L.G.; data curation, S.H. and M.N.; writing—original draft preparation, S.H.; writing—review and editing, M.H.; visualization, L.G.; supervision, S.H., M.N. and M.H. All authors have read and agreed to the published version of the manuscript.
Funding
This research received no external funding.
Institutional Review Board Statement
Not applicable.
Informed Consent Statement
Not applicable.
Data Availability Statement
Data are available upon request. Please contact the corresponding author by email to obtain the data used in the study.
Conflicts of Interest
The authors declare no conflicts of interest.
Abbreviations
| A1 … A5 | attribute 1… attribute 5 |
| BCG | Boston consultant group |
| China-CEEC | cooperation between China and Central and Eastern European countries |
| CPPI | container port performance index |
| CRk | k-firm concentration ratio |
| DEA | data envelopment analysis |
| DWT | deadweight |
| EI | entropy index |
| GC | Gini coefficient |
| GECI | geoeconomic concentration index |
| HHI | Herfindahl–Hirschman index |
| LPI | logistics performance index |
| MDST | Maritime Data Systems Transmodal |
| MOS | Motorways of the Sea |
| NAPA | North Adriatic Ports Association |
| PLSCI | port liner shipping connectivity index |
| RMG | rail-mounted gantry |
| SFA | stochastic frontier analysis |
| STS | ship to shore |
| T1 … T5 | terminal 1 … terminal 5 |
| TEN-T network | trans-European transport network |
| TEU | twenty-feet equivalent unit |
| RCT | Ravenna Container Terminal |
| Si | share of port traffic i in each market |
| k | number of ports for which the concentration ratio CRk is calculated |
| n | total number of given ports in the market |
| Si | traffic share of port i |
| xi | cumulative share of the population of all terminals in a market (where x0i = 0 and xn = 1) |
| yi | cumulative share of the demand share of the variable under study, e.g., terminal traffic (where y0 = 0 and yn = 1) |
| zi | the ith normalized value in the dataset |
| xi | the ith value in the dataset |
| m | minimum value of index in the dataset |
| M | maximum value of index in the dataset |
References
- Niavis, S.; Tsekeris, T. Ranking and causes of inefficiency of container seaports in South-Eastern Europe. Eur. Transp. Res. Rev. 2012, 4, 235–244. [Google Scholar] [CrossRef]
- Elsayeh, M.E. The Impact of Port Technical Efficiency on Mediterranean Container Port Competitiveness. Ph.D. Thesis, University of Huddersfield, Huddersfield, UK, 2015. Available online: http://eprints.hud.ac.uk/27959/ (accessed on 15 April 2022).
- Krljan, T.; Grbčić, A.; Hess, S.; Grubisic, N. The Stochastic Frontier Model for Technical Efficiency Estimation of Interconnected Container Terminals. J. Mar. Sci. Eng. 2021, 9, 515. [Google Scholar] [CrossRef]
- Liu, Q. Efficiency Analysis of Container Ports and Terminals. Ph.D. Thesis, Department of Civil, Environmental and Geomatic Engineering, University College London, London, UK, 2010. [Google Scholar]
- Tijan, E.; Jović, M.; Žgaljić, D.; Aksentijević, S. Factors Affecting Container Seaport Competitiveness: Case Study on Port of Rijeka. J. Mar. Sci. Eng. 2022, 10, 1346. [Google Scholar] [CrossRef]
- Twrdy, E.; Batista, M. Competition between container ports in the Northern Adriatic. Int. J. Traffic Transp. Eng. 2014, 4, 363–371. [Google Scholar] [CrossRef] [PubMed]
- Stamatović, K.; de Langen, P.; Groznik, A. Port Cooperation in the North Adriatic Ports. Res. Transp. Bus. Manag. 2018, 26, 109–121. [Google Scholar] [CrossRef]
- Stamatović, K.; de Langen, P.; Groznik, A. Revisiting the Cooperation Matrix for Classifying Cases of Port Cooperation—Case Study: Northern Adriatic Ports. Econ. Bus. Rev. 2020, 22, 5. [Google Scholar] [CrossRef]
- Morata Fernández, M. Concentration Evolution of the Container Throughput in the Mediterranean Ports. Master’s Thesis, Universitat Politècnica de Catalunya, Barcelonatech, Spain, 2017. [Google Scholar]
- Chlomoudis, C.I.; Styliadis, T. Concentration of container flows in the port phase: The case of the U.S West and East Coast port ranges. Issues Bus. Manag. Econ. 2019, 7, 1–13. [Google Scholar] [CrossRef]
- Hanafy, N.A.; Labib, A.A.; EL-Haddad, E.F.; Abd-El-Salam, E.M. Analytical approach to the market of the container ports in the east Mediterranean region using the concentration ratio, HHI, shift –share analysis. Bus. Manag. Rev. 2017, 8, 192–199. Available online: https://cberuk.com/cdn/conference_proceedings/conference_94646.pdf (accessed on 29 October 2022).
- Petrlić, A.; Pavletić, N. Benchmarking Analysis of Factors Influencing Container Traffic in the Port of Rijeka. Pomorstvo 2019, 33, 119–129. [Google Scholar] [CrossRef]
- The Role of North Adriatic Ports. In Research Project Report; Xin, C., Ed.; China-CEE Institute Nonprofit Ltd.: Budapest, Hungary, 2021; Available online: https://www.china-cee.eu (accessed on 18 April 2023).
- Dejan, D.; Intihar, M.; Prah, K.; Kramberger, T. Forecasting of Maritime Cargo Flows to Support the Planning Activities in Napa Ports. The Preliminary Research Study, University of Maribor, Faculty of Logistics. 2013. Available online: https://www.researchgate.net (accessed on 8 February 2023).
- NAPA: Market Study on the Potential Cargo Capacity of the North Adriatic Ports System in the Container Sector. Final Report by MDS Transmodal Limited. 2012. Available online: https://www.assoporti.it (accessed on 26 September 2022).
- North Adriatic Ports Association. Available online: https://www.portsofnapa.com (accessed on 13 December 2022).
- ShipHub. Available online: https://www.shiphub.co/top-container-ports-in-the-eu-2021/ (accessed on 10 November 2022).
- Lučka Uprava Rijeka. Available online: https://www.portauthority.hr (accessed on 29 October 2022).
- Adriatic Gate Container Terminal. Available online: https://www.ictsi.hr (accessed on 10 November 2023).
- Luka Kopar. Available online: https://www.luka-kp.si (accessed on 10 January 2023).
- Autorità di Sistema Portuale del Mare Adriatico Orientale. Available online: https://www.porto.trieste.it (accessed on 15 February 2023).
- Porto di Venice. Available online: https://www.port.venice.it (accessed on 15 February 2023).
- Autorità di Sistema Portuale del Mare Adriatico Centro Setten Trionale. Available online: http://www.port.ravenna.it (accessed on 15 February 2023).
- Wessa, P. Concentration and Inequality (v1.0.2) in Free Statistics Software (v1.2.1), Office for Research Development and Education. 2021. Available online: http://www.wessa.net/rwasp_concentration.wasp/ (accessed on 7 November 2022).
- Boston Consulting Group. Available online: https://www.bcg.com/publications/2014/growth-share-matrix-bcg-classics-revisited (accessed on 9 November 2022).
- VesselFinder. Available online: https://www.vesselfinder.com/ (accessed on 6 January 2023).
- Novi List. Available online: https://www.novilist.hr (accessed on 4 July 2023).
- MarineTraffic. Available online: https://www.marinetraffic.com (accessed on 6 January 2023).
- MagicPort. Available online: https://community.magicport.ai/t/ship-size-categories-for-different-ship-types/744/2 (accessed on 9 May 2023).
- Wikipedia. Available online: https://en.wikipedia.org/wiki/List_of_largest_container_ships (accessed on 24 March 2023).
- Rao, R.V.; Lakshmi, J. R-method: A simple ranking method for multi-attribute decision-making in the industrial environment. J. Proj. Manag. 2021, 6, 223–230. [Google Scholar] [CrossRef]
- MDSTransmodal. Available online: https://unctadstat.unctad.org/wds/TableViewer/summary.aspx (accessed on 10 January 2023).
- UnctadStat. Available online: https://unctadstat.unctad.org/wds/ReportFolders/reportFolders.aspx (accessed on 12 January 2023).
- Humphreys, M.; Mooney, T.; Lane, A.; Guillot, D.; Ashley, G. Container Port Performance Index 2022; Technical Report CPPI 2022; World Bank: Washington, DC, USA, 2023; Available online: https://www.researchgate.net/publication/371031279_Container_Port_Performance_Index_2022_v2 (accessed on 23 December 2022).
- Kaur, M.; Kaurt, P.; Singh, M. Rank Aggregation Using Multi Objective Genetic Algorithm. In Proceedings of the 1st International Conference on Next Generation Computing Technologies (NGCT-2015), Dehradun, India, 4–5 September 2015. [Google Scholar]
- Statology. Available online: https://www.statology.org/normalize-data-between-0-and-1/ (accessed on 21 May 2023).
- Bartholdi, J.J.; Jarumaneeroj, P.; Ramudhin, A. A new connectivity index for container ports. Marit. Econ. Logist. 2016, 18, 231–249. [Google Scholar] [CrossRef]
- Connecting to Compete 2023, Trade Logistics in an Uncertain Global Economy, The Logistics Performance Index and Its Indicators, 2023 The International Bank for Reconstruction and Development/The World Bank. Available online: https://www.worldbank.org (accessed on 14 April 2023).
Disclaimer/Publisher’s Note: The statements, opinions and data contained in all publications are solely those of the individual author(s) and contributor(s) and not of MDPI and/or the editor(s). MDPI and/or the editor(s) disclaim responsibility for any injury to people or property resulting from any ideas, methods, instructions or products referred to in the content. |
© 2024 by the authors. Licensee MDPI, Basel, Switzerland. This article is an open access article distributed under the terms and conditions of the Creative Commons Attribution (CC BY) license (https://creativecommons.org/licenses/by/4.0/).