Systematic Review

Weather-Related Disruptions in Transportation and Logistics: A Systematic Literature Review and a Policy Implementation Roadmap

by
Dimos Touloumidis
1,*,
Michael Madas
1,
Vasileios Zeimpekis
2 and
Georgia Ayfantopoulou
3
1
Information Systems and e-Business Laboratory (ISeB), Department of Applied Informatics, School of Information Sciences, University of Macedonia, 546 36 Thessaloniki, Greece
2
Design, Operations and Production Systems Laboratory (DeOPSyS), Department of Financial and Management Engineering, School of Engineering, University of the Aegean, 82132 Chios, Greece
3
Centre for Research and Technology Hellas (CERTH), Hellenic Institute of Transport, 57001 Thermi, Greece
*
Author to whom correspondence should be addressed.
Logistics 2025, 9(1), 32; https://doi.org/10.3390/logistics9010032
Submission received: 21 December 2024 / Revised: 10 February 2025 / Accepted: 12 February 2025 / Published: 20 February 2025

Abstract

:
Background: The increasing frequency and severity of extreme weather events (EWEs) as a consequence of climate change pose critical challenges on the transport and logistics sector, hence requiring systematic evaluation and strategic adaptation. Methods: This study conducts a comprehensive systematic literature review (SLR) of 147 peer-reviewed articles and reports through a PRISMA framework to comprehensively identify key weather-induced challenges, quantify their operational, infrastructural and economic impacts, and explore alternative mitigation strategies. Results: With a greater focus on rainfall, flooding and snowfall, this study highlights their notable impacts causing reductions in transport efficiency, increased maintenance costs and substantial financial losses. Also, it emphasizes the role of advanced technologies, resilient infrastructure, and adaptive policy frameworks as critical enablers for enhancing sector resilience while simultaneously formulating a robust roadmap for cities and companies with actions ranging from direct operational adjustments to long-term transformational changes in policy and infrastructure. Conclusions: This work underscores the importance of using a data-driven approach to safeguard transport and logistics systems against evolving climate risks contributing to the broader goal of sustainable urban resilience and operational continuity.

1. Introduction

Climate change, primarily driven by human activity (greenhouse gas emissions), is considered one of the most critical challenges of our time. Among others, the increased occurrence of phenomena such as wildfires, floods, droughts, and heatwaves poses significant threats to public health, infrastructure, and economic resilience to modern societies [1,2,3]. The logistics sector, valued at over EUR 8.4 trillion in 2021 and projected to exceed EUR 13.7 trillion by 2027 [4], is particularly vulnerable to these threats due to its dependence on infrastructure and time-sensitive operations.
One of the most visible consequences of climate change is the alteration of the water cycle leading to increased frequency and intensity of rainfall events due to warming. Specifically, studies highlight that global precipitation can increase by approximately 1.5% for each degree of temperature rise [5,6], a trend that decreases the predictability of weather patterns. As evidence, the likelihood of experiencing severe floods like those in Louisiana in 2016 and Houston in 2017 has significantly increased in recent years [7,8].
The economic implications of such extreme weather events and their increasing trend are evident since, between 2011 and 2020, weather-related global losses were estimated at USD 2.5 trillion with the average cost per event increasing by 77% during the last 50 years [9]. For the logistics sector specifically, the direct and indirect costs of weather-related disruption include delayed shipments, infrastructure damages, and poor customer satisfaction. Flooding, for example, disrupts urban logistics systems, causing road and bridge closures, damages warehouses and vehicles, and interrupts communication systems [10]. In Europe alone, weather-induced losses of the logistics sector for the period of 1998 to 2010 were estimated in a range of EUR 1–EUR 6 billions [11].
The rapid growth of e-commerce, which was particularly accelerated by the COVID-19 pandemic, is projected to increase by 78% by 2030 [12,13]. This growth has created significant operational challenges for logistics companies, especially in urban areas where infrastructure vulnerability intersects with growing delivery demands. This situation is particularly exacerbated by extreme weather events, with flooding, for example, emerging as a major threat of urban environments which not only disrupts traffic and damages infrastructure but also directly impacts the urban logistics by affecting delivery efficiency, customer satisfaction and operational costs [14]. As consumers increasingly rely on e-commerce and expect quick and reliable deliveries, logistical networks face mounting pressure to perform under climate-induced disruptions, where even minor delays can cascade into significant operational challenges. This inefficiency highlights the critical need for constructing resilient infrastructure and adopting adaptive operational strategies.
To enhance the resilience of logistics and transport systems against climate change, a deep understanding of weather-induced impacts is crucial. This study conducts a comprehensive systematic literature review regarding the impact of extreme weather events on transport and logistics systems, with a greater focus on urban and peri-urban areas. Thus, the main goal of the review is to quantify the impact of climate-related disruptions on logistics operations and infrastructure and to explore innovative strategies that various stakeholders can implement to increase their resilience. Additionally, it offers an actionable roadmap to assist cities and companies strengthen their resilience to climate change. The principal contribution of this study lies in bridging the gap between theoretical knowledge and practical interventions supporting the development of robust and adaptable systems capable of responding to increasingly unpredictable environmental challenges.
The rest of the paper is organized as follows: Section 2 outlines the SLR methodology employed; Section 3 presents the results of the bibliometric and thematic analyses, offering detailed insights into the key trends and classifications; Section 4 proposes a policy roadmap providing actionable recommendations for enhancing the resilience of transport and logistics systems; Section 5 outlines a future research agenda identifying gaps and opportunities for further investigation; and Section 6 delivers the conclusions of the study.

2. Methods

In the context of the ongoing climate crisis, numerous studies worldwide explore the impacts of various extreme weather events on transport and logistics operations and infrastructure, while others propose drastic measures to mitigate weather-related effects.
This study employs a systematic literature review framework to identify the most threatening weather events (characterized by increased frequency and/or intensity), document their impacts—including financial losses, damages and disruptions—and discusses the most effective actions from the perspectives of different stakeholders. To ensure a structured and transparent review process, the PRISMA framework is used for journal articles selection and review ensuring compliance with recognized standards [15]. Beyond the SLR, a second outcome of the study is a roadmap designed to help cities and companies develop resilient transport and logistics infrastructure and operations.
The literature review is organized into six steps initiated by the problem definition and the establishment of inclusion criteria. The following steps structured, according to the PRISMA framework, include an extensive search for scientific articles across dedicated databases, an initial screening of article abstracts, and the selection of final publications through an in-depth full-text review. The final stages include extracting and analyzing data, drawing conclusions and presenting the findings through visualizations.

2.1. Problem Definition and Inclusion Criteria

The increased frequency of extreme weather events amplifies the uncertainty in maintaining the resilience of supply chains and transport systems. City logistics, as a crucial component of supply chains, are particularly vulnerable to weather-induced challenges which can impact them with disruptions and damages. Such challenges can subsequently escalate costs for various stakeholders including Logistics Service Providers (LSPs), companies, and city authorities. To address these challenges and enhance system resilience, the following research questions are defined in order to provide a comprehensive understanding of the interplay between climate-induced events and transport and logistics systems and to explore the efficacy of specific interventions in strengthening resilience:
  • Research Question 1: What are the key climate-induced events impacting transport and logistics, and how do they affect operational efficiency and infrastructure resilience?
  • Research Question 2: How do extreme weather events, such as heavy rainfall or snowfall disrupt transport operations and infrastructure resilience, and what are their consequences on efficiency and infrastructure?
  • Research Question 3: What are the direct and indirect economic impacts of extreme weather events on transport operations, including revenue losses, increased costs, and infrastructure maintenance?
  • Research Question 4: What strategies and policies enhance the resilience of transport and logistics systems to climate change and how effective are they in maintaining operational and economic stability?

2.2. Research Databases and Filtering Criteria Selection

The initial identification of the relevant literature is conducted using Scopus and Web of Science as the two primary databases. These databases are chosen for their extensive coverage and their broad recognition within the research community for the quality of included articles. To supplement this search, Google Scholar is also utilized to address gaps in the literature, particularly for company-related evidence. Specifically, a critical limitation arises from the scarcity of scholarly evidence on climate change impacts on logistics operations (especially economic dimensions) due to the hesitancy of companies to share their data because of competitive concerns or conflicts of interest.
To mitigate this gap, technical reports from reputable institutions (e.g., McKinsey & Company, Deloitte, World Economic Forum, and European Commission) are included in the analysis. These organizations aggregate anonymized insights from multiple industry stakeholders and publish consolidated and sector-wide figures that individual firms may withhold. While non-scholarly, these reports offer practical, real-world data and strategic analyses that complement theoretical frameworks in academia. These reports are also screened through PRISMA criteria (relevance, methodological transparency, and institutional credibility) and are excluded if they are promotional or methodologically unclear. Advanced analytics tools available within these databases are employed for filtering, while Mendeley software is used to organize the publications.
The filtering process follows a structured approach; initially, publications before 1985 and those written in languages other than English are excluded, while subsequently, the type of document is considered, retaining only those subjected to peer review (journal articles, books, book chapters, conference proceedings and formal reports).

2.3. Literature Identification and Preliminary Screening

As outlined by the PRISMA framework, the literature undergoes a preliminary screening based on two main criteria. The first criterion includes the studies that explicitly assess the impact of climate change and extreme weather events, while the second ensures the studies are closely aligned with the research areas of the study. The following table (Table 1) summarizes the search, inclusion and qualification criteria applied in the current systematic literature review.
To ensure the relevance of the publications during the initial screening stage, the title, the abstract and the keywords of each article are carefully assessed, while particular emphasis is placed on the articles focusing on logistics operations and cost-based assessments.

2.4. Literature In-Depth Screening

After the preliminary review, an in-depth evaluation is conducted to finalize the list of publications. The full text of each article is examined, and studies falling outside the scope of this research or lacking sufficient analytical depth and results are excluded. Since this step represents the final stage of the PRISMA framework, the structured process along with the inclusion and exclusion results are illustrated in the following diagram (Figure 1).
Initially, a comprehensive search is conducted using major academic databases including Scopus (85 articles identified), Web of Science (68 articles), and Google Scholar (124 articles) resulting in a total of 277 articles. During the identification phase, 8 duplicate articles are removed, 6 of which are identical duplicates and 2 represent the same article found in different databases, leaving 269 unique records. In the screening phase, 38 articles are excluded based on specific criteria: publication date (before 1985), document type (excluding conference abstracts, editorials or letters) and language (other than English), a process that results in 231 eligible articles. Further examination during the eligibility phase leads to the exclusion of 2 articles due to limited accessibility. The remaining 229 articles are reviewed in more detail, leading to the further exclusion of 82 publications (28 due to irrelevance to the study topic and 54 because they are not peer reviewed). The final set of 147 articles undergoes qualitative synthesis to analyze the data and gain insights related to the research questions. Finally, these 147 articles are included in a meta-analysis to quantitatively combine the findings and enhance the robustness and replicability of the conclusions.

2.5. Data Extraction and Analysis

The selected literature is collected and managed using dedicated software, and the basic bibliometric statistics are calculated for the list of publications. Specifically, two tools are employed; the first is Mendeley used for collecting, storing and organizing the selected publications, and the second is VOSviewer, which is an open-access program used to map the bibliographic data and generate network visualizations.

2.6. Data Synthesis and Visualization

The in-depth analysis is conducted using Excel spreadsheets and Python to synthesize the extracted data from publications and visualize the findings respectively. The bibliometric analysis is focused on mapping the general characteristics of the publications, including publication type, year, journal and area of interest. Meanwhile, the thematic analysis is aimed to synthesize and aggregate the data and results from the studies, addressing the research questions outlined in the SLR analysis.

3. Results

3.1. Bibliometric Analysis

The bibliometric analysis is organized into four main areas. The first focuses on keyword and term analysis, mapping the frequency and the co-occurrence of specific words. The second examines the publication characteristics such as the year of publication and the journals in which the articles are published. The third area involves geographic analysis exploring aspects like areas of interest. Lastly, the fourth investigates the types of analysis employed, distinguishing between quantitative, qualitative, and literature review approaches.

3.1.1. Keyword and Term Analysis

The first part of the bibliometric analysis is focused on the keyword and term analysis of the selected publications. The following figure (Figure 2) is a network visualization map generated from VOSviewer software and depicts the frequency of the occurrence of words within the final 147 publications and the different relationships between these keywords over time.
The landscape presented in the above figure provides several key insights into the interrelations of keywords, while the color gradient visually represents the temporal evolution of research focus with more recent keywords likely appearing in yellow (newer). The central and most connected node is “climate change”, underscoring its pivotal role and highlighting its strong linkages with “extreme weather events” and the “transportation system”. A dominant cluster of terms includes “transportation”, “transport network”, and “transport infrastructure” highlighting the significant focus on understanding the impacts of climate change on transport and logistics systems. This suggests that research aims to illuminate how climate change influences the design, operation, and resilience of transport operations and infrastructure.
Another distinct cluster features “weather”, “weather condition”, and “precipitation”, indicating a strong emphasis on examining the impact of meteorological factors and their influence on the sector. This implies that the research focuses on understanding how changing weather patterns and extreme weather events cause disruptions and other consequences for transport systems, with studies showing precipitation as the most dominant event impacting transport systems. Prominent emerging themes are also evident in smaller clusters and require closer attention. The “adaptation” and “resilience” cluster, for instance, reflects a growing emphasis on proactive strategies to future-proof transport systems. Similarly, the “operation”, “system”, and “framework” cluster highlights newer research into systemic approaches in transport resilience to support policymakers.

3.1.2. Publication Analysis

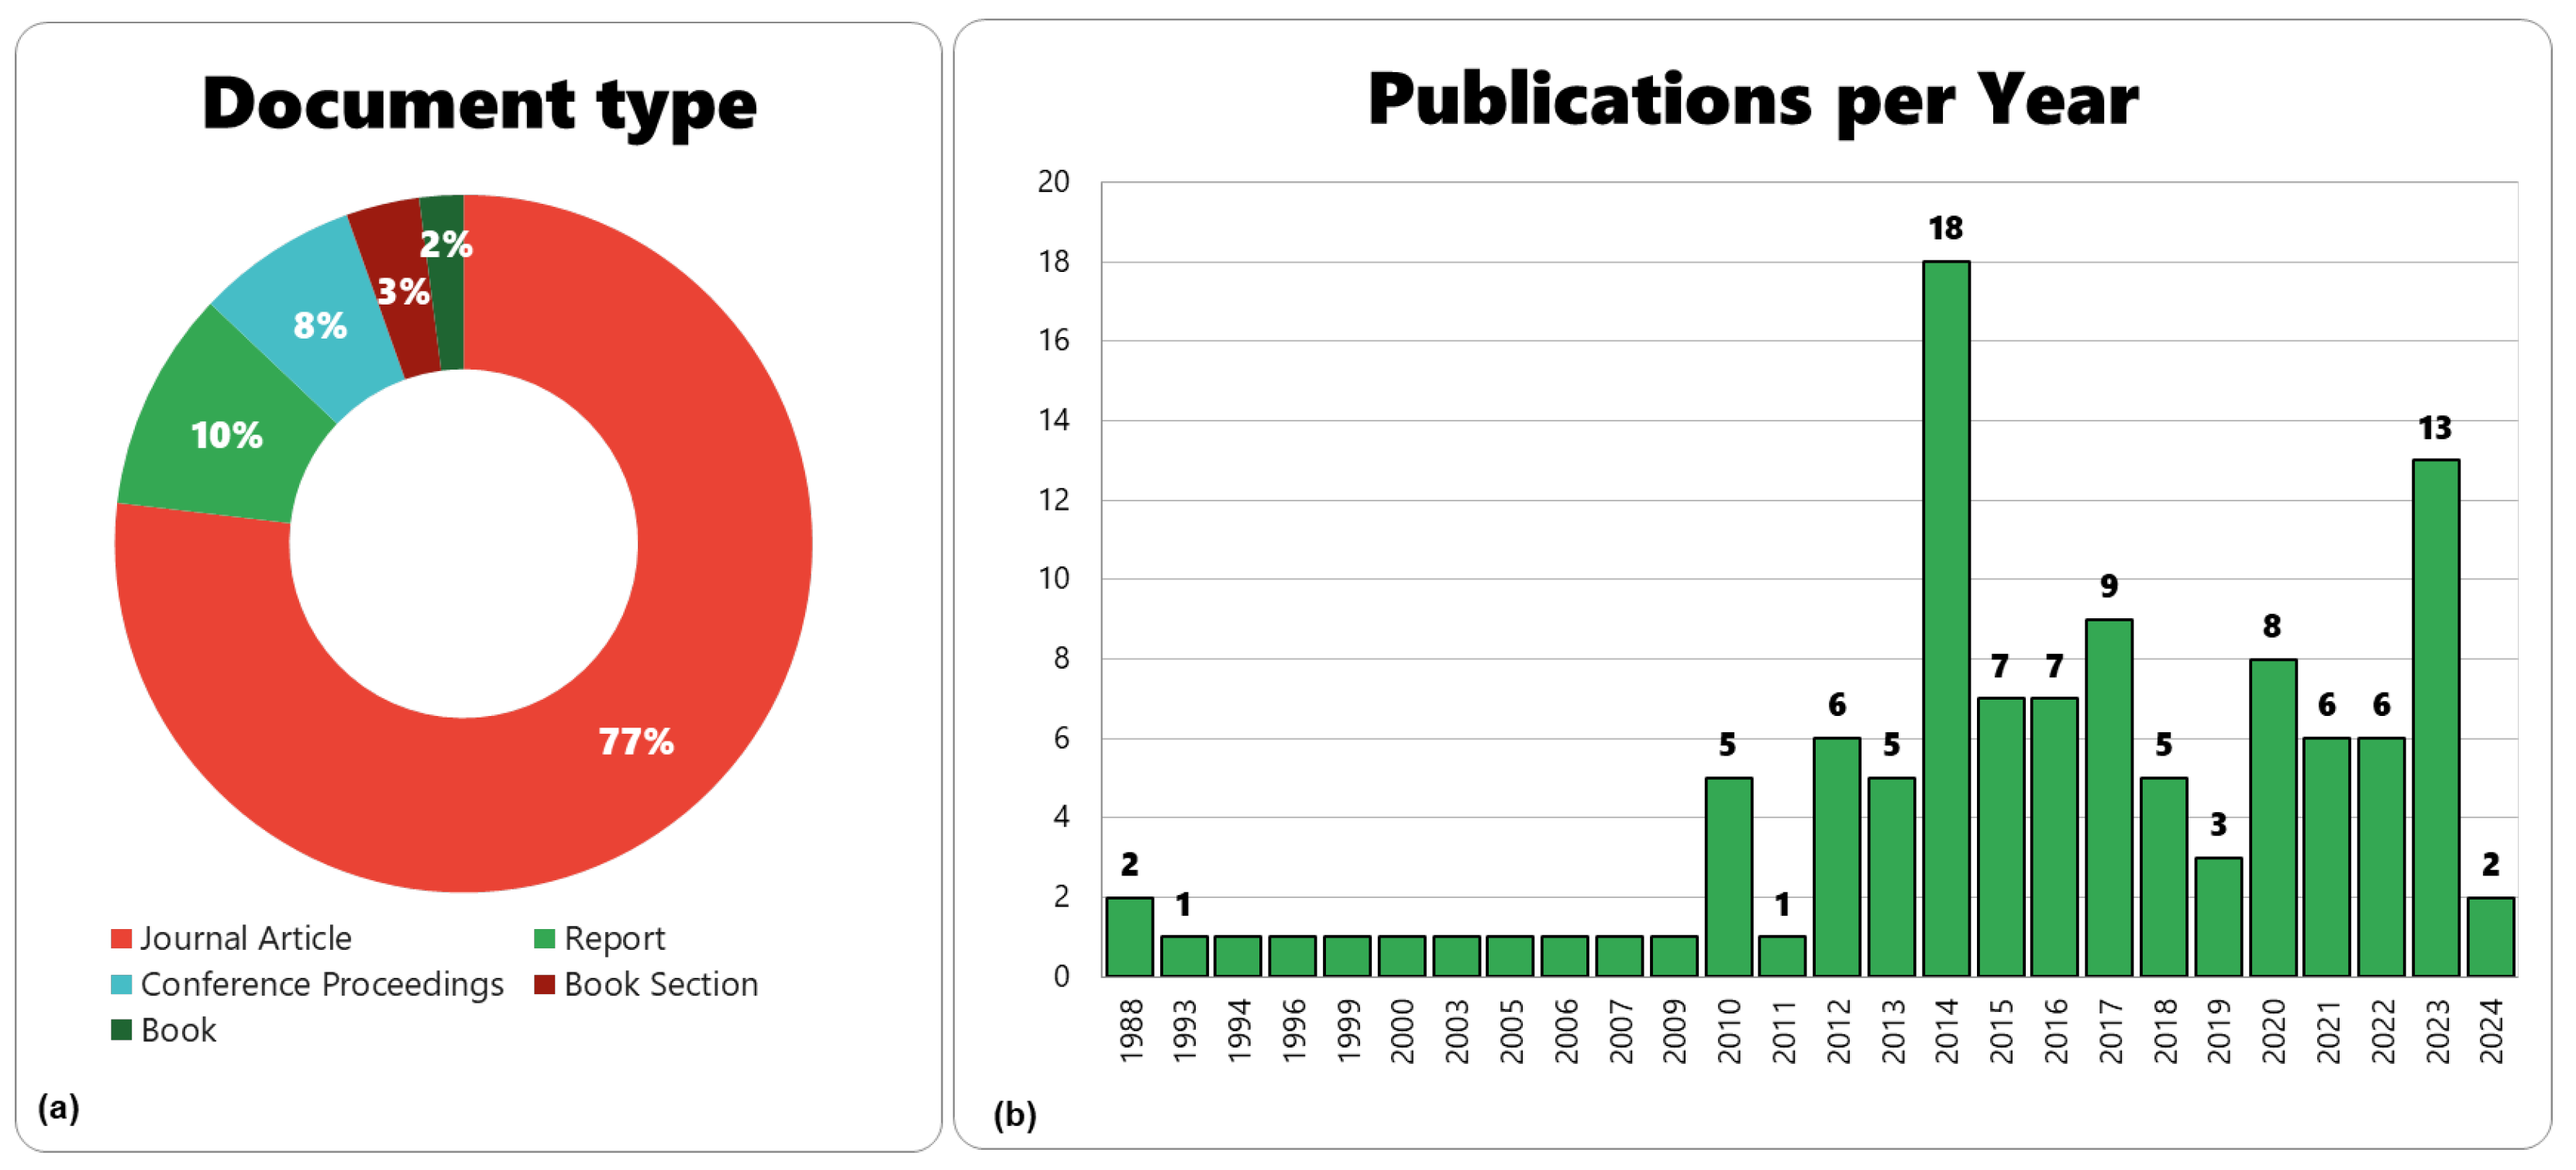
At a next step, the characteristics of the publications are further explored, including the type of documents, the main journals, and the years of publication. In more detail, the figure below (Figure 3) contains the different types of document and their year of publication. Significantly, the journal article is the predominant type of document, being 77% of the total. Following that, reports by well-known organizations and companies account for 10% and provide crucial information for supply chain and urban logistics focusing on the lessons learned from use cases across the world. Finally, conference proceedings make up 7% of the total entities, while book sections and books constitute the 3% and 2%, respectively. When it comes to the temporal distribution of the publications, low activity of 1–2 articles per year is observed until 2010, and after 2011, there is a noticeable increase, reaching the highest single-year count at 2014 with 18 publications.
The analysis show that despite the fluctuations in the spatial distribution of publications, a recent increase in the interest is observed with 13 addressed articles in 2023. Then, the following table (Table 2) illustrates the distribution of articles across various journals.
The journal Transportation Research Record leads with the highest number of publications at 13. This journal primarily features quantitative and modeling-focused articles that analyze the effects of extreme weather events on traffic parameters. Other journals with a significant number of publications include Natural Hazards with 9 publications, which is more related to articles related to the infrastructure, and Sustainability with also 9 publications which contain multiple studies, including mitigation actions.

3.1.3. Geographical Analysis

The following part of the analysis provides insights about the geographic distribution of the countries under analysis and the administrative level of focus of each study, from local to global.
Geographically (Figure 4b), the United States leads with 21 cases, followed by China (12), the United Kingdom (14), and Greece (8), while other notable contributors include Canada, Germany, and Japan, and limited representation with only a few cases is observed in Africa and South America. When it comes to the level of analysis, the most use cases focus on Municipal/City (32 studies), National/State (29), and Local (19) levels; higher-level studies are less frequent with only 4 at the federal level, 2 at continental, and 1 global scale.

3.1.4. Focus Analysis

At the final step, the analysis examines the types of studies reviewed, achieving a distinction between use cases and literature reviews. Use cases assess the impact of extreme weather on transport and logistics through statistical or conceptual analysis, while literature reviews compile and report findings from various studies.
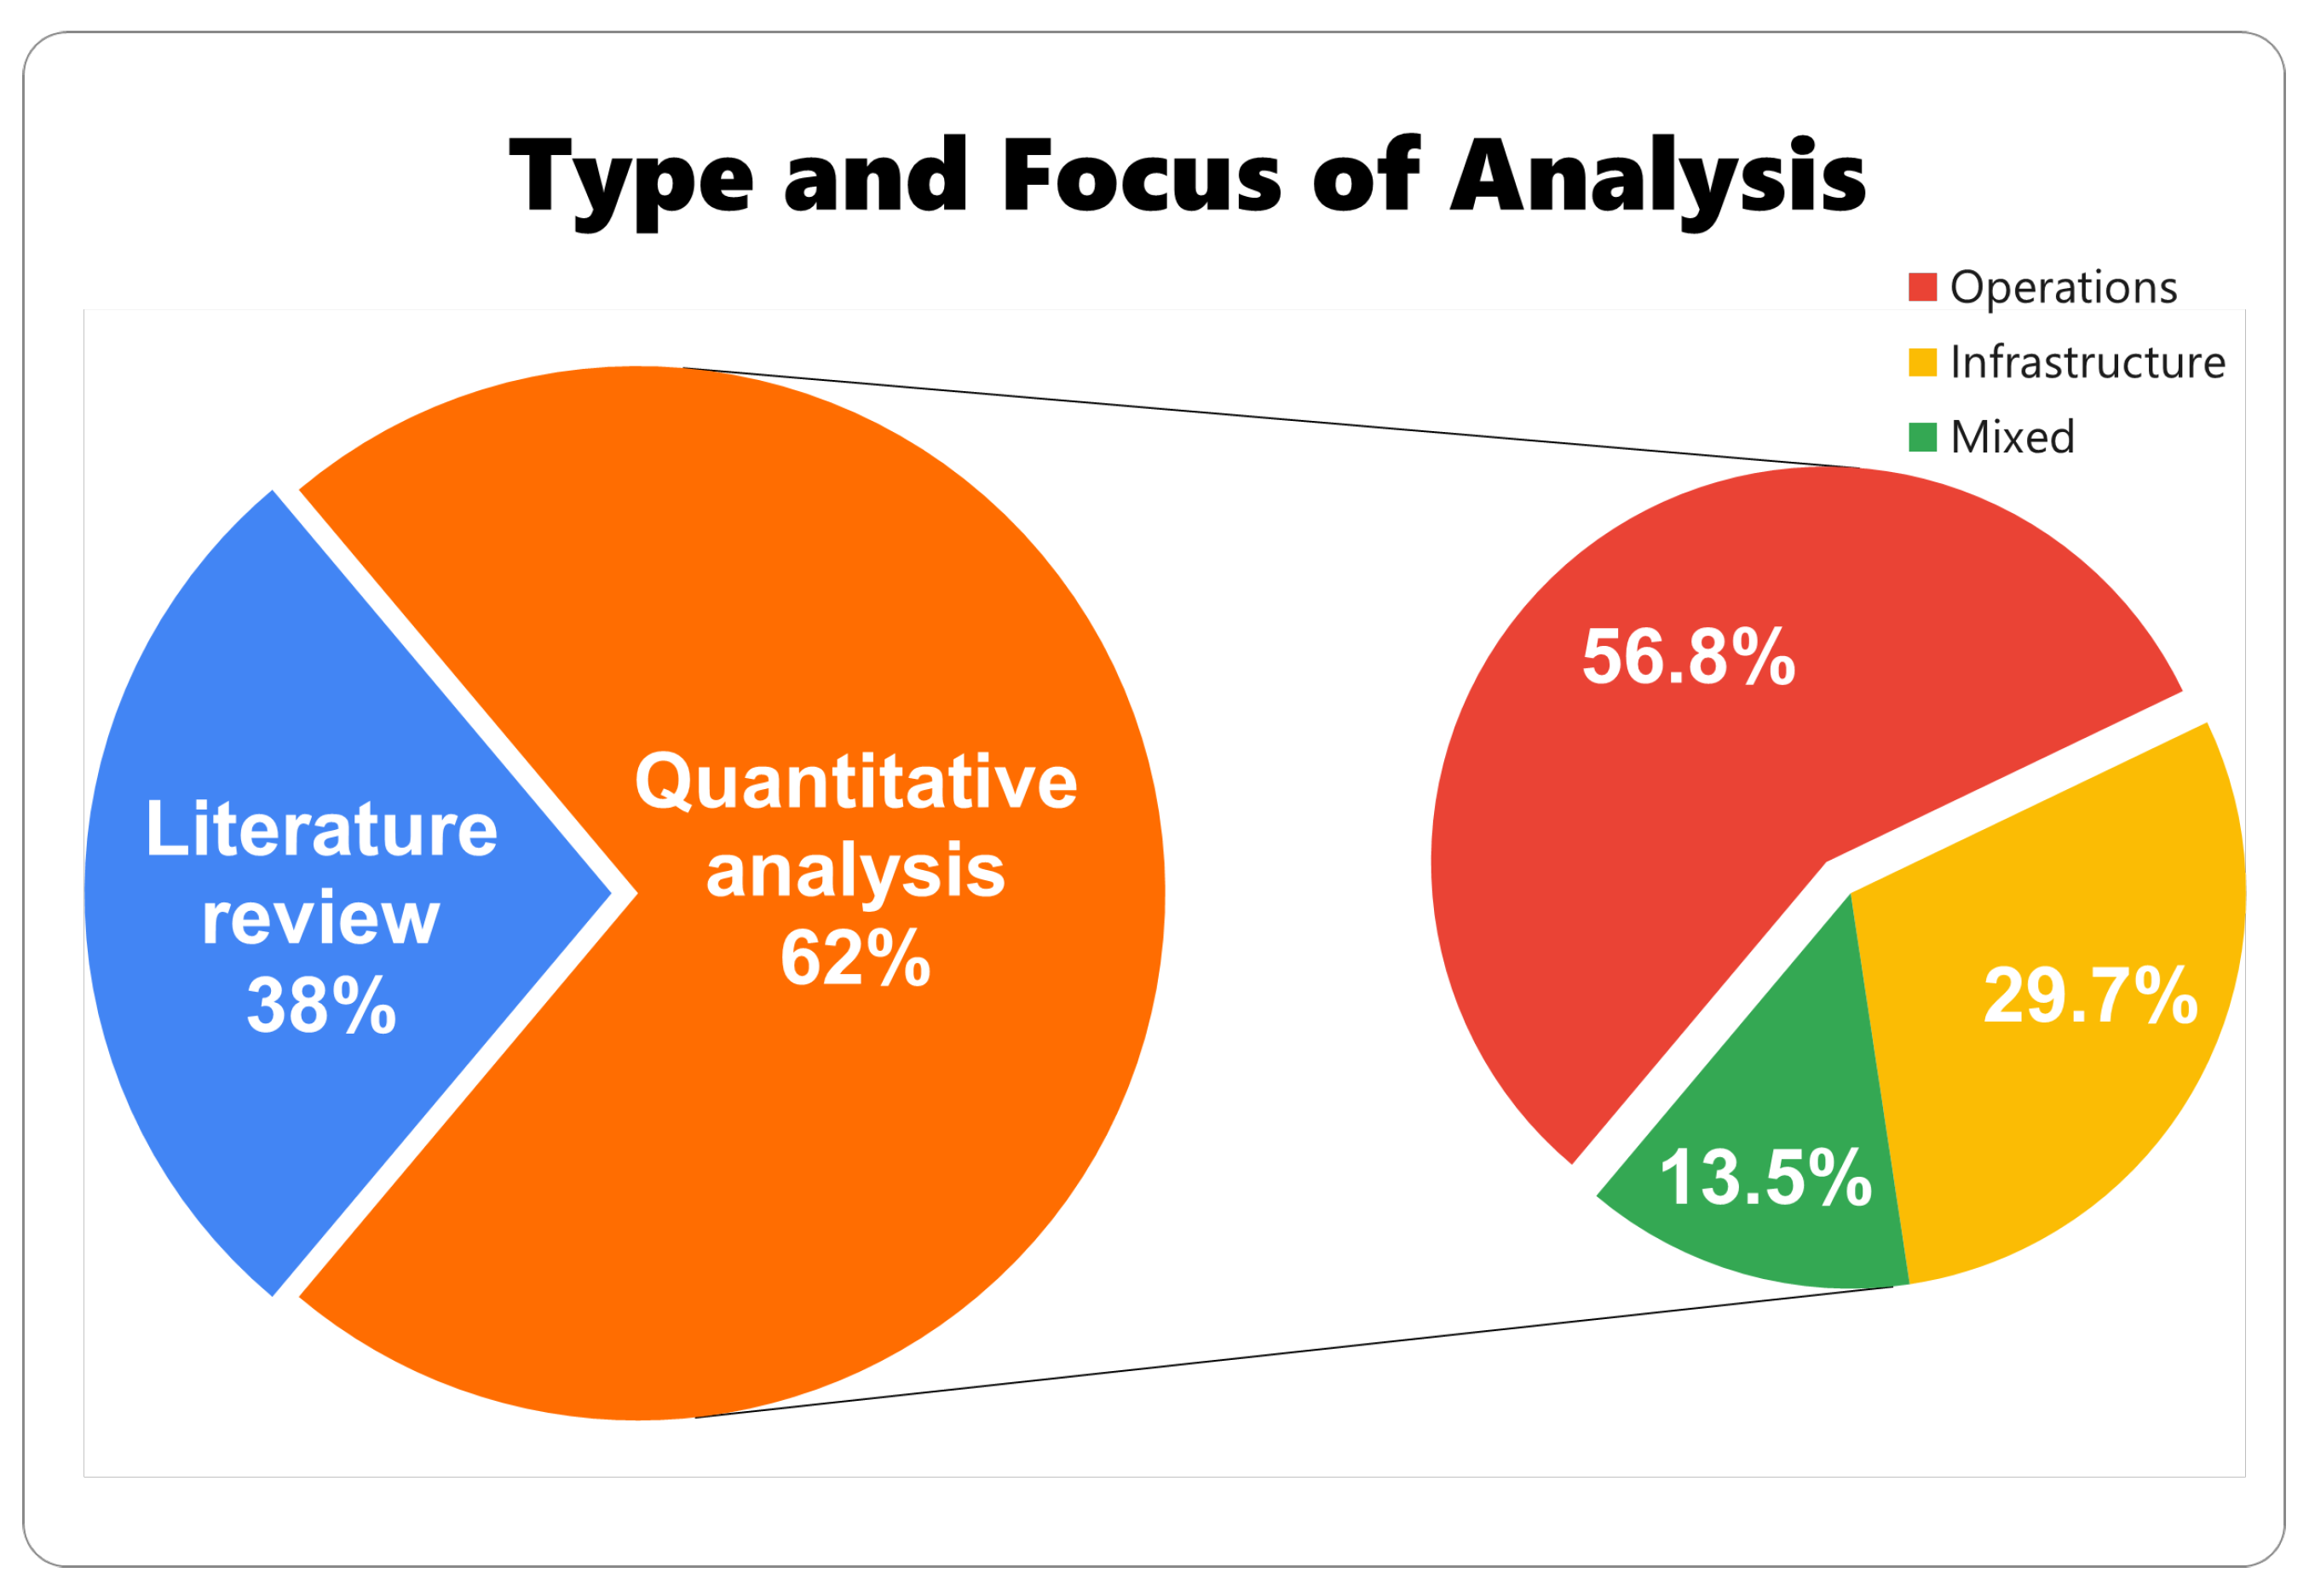
Figure 5 illustrates the distribution of research articles, with 62% focusing on use cases that emphasize practical applications and 38% consisting of literature reviews that highlight conceptual insights. Within the context of operational analysis, studies are further categorized into three areas: operations, infrastructure, and mixed approaches. The majority of studies (56.8%) address operational aspects such as system functionality and management under extreme weather conditions, and infrastructure-related studies account for 29.7%, while mixed approaches which integrate both approaches represent 13.5%.

3.2. Thematic Analysis

This section thoroughly examines the current literature to address the impacts of extreme weather events on transport and logistics, detailing both challenges and mitigation strategies. The thematic analysis considers data-driven and use cases assessment studies, identifies the most threatening weather events, and maps their quantified impact on operations and infrastructure. This is achieved through the assessment of various traffic parameters such as traffic flow and delay and also through the evaluation of damage to infrastructure (e.g., bridge collapse). Beyond these operational outcomes, the analysis also compiles the economic impacts of such events on operations and infrastructure, providing a detailed account of the costs associated with different weather intensities and events. Lastly, the section maps out the most frequent and effective actions that different stakeholders are recommended to adopt in order to mitigate the impacts of climate change and extreme weather events on transport and logistics systems. This comprehensive overview aims to arm policymakers, planners and industry leaders with the insights needed to enhance resilience and ensure continuity in the face of environmental challenges.

3.2.1. Identification of Extreme Weather Events

The analysis begins with the comprehensive identification and categorization of extreme weather events that can impact the operations and the infrastructure of transport and logistics networks as documented in the literature. Figure 6 illustrates the frequency of occurrence of eight (8) different clusters.
The distribution of weather events in scholarly studies presents a clear prioritization with rainfall extensively examined followed by snowfall and flooding. The predominance of rainfall in the literature is due to several interconnected factors that bring it into the spotlight: (1) the increasing global warming has intensified the frequency and severity of rainfall; (2) the diverse indirect effects such as flooding, fog and surface runoff; and (3) the existence of studies in regions with significant wet seasons or monsoon climates (e.g., South Asia, Southeast Asia, and Sub-Saharan Africa). Additionally, rainfall is a weather event that occurs worldwide, regardless of climate, making the investigation of its impacts important for all regions. Similarly, snowfall receives substantial attention, particularly in studies focused on higher-latitude regions where winter weather significantly impacts transport systems.
In contrast, heatwaves (9%) and cold weather events (5%) remain understudied, often due to data scarcity or unclear impact correlations. For instance, although temperature is easily quantifiable, its impact on transport operations is generally less critical than that caused by other events like rainfall and snowfall, while phenomena with significant operational impacts and risks (e.g., fog) are difficult to be quantified.

3.2.2. Impact of Extreme Weather Events on Logistics Operations and Infrastructure

A large number of publications is found to have quantified the influence of weather conditions on transport and logistics operations and infrastructure, either at a local (microscopic) or worldwide (macroscopic) scale. The quantification of these impacts is generally achieved by modeling and statistics, while certain studies employ literature review or use case examination.
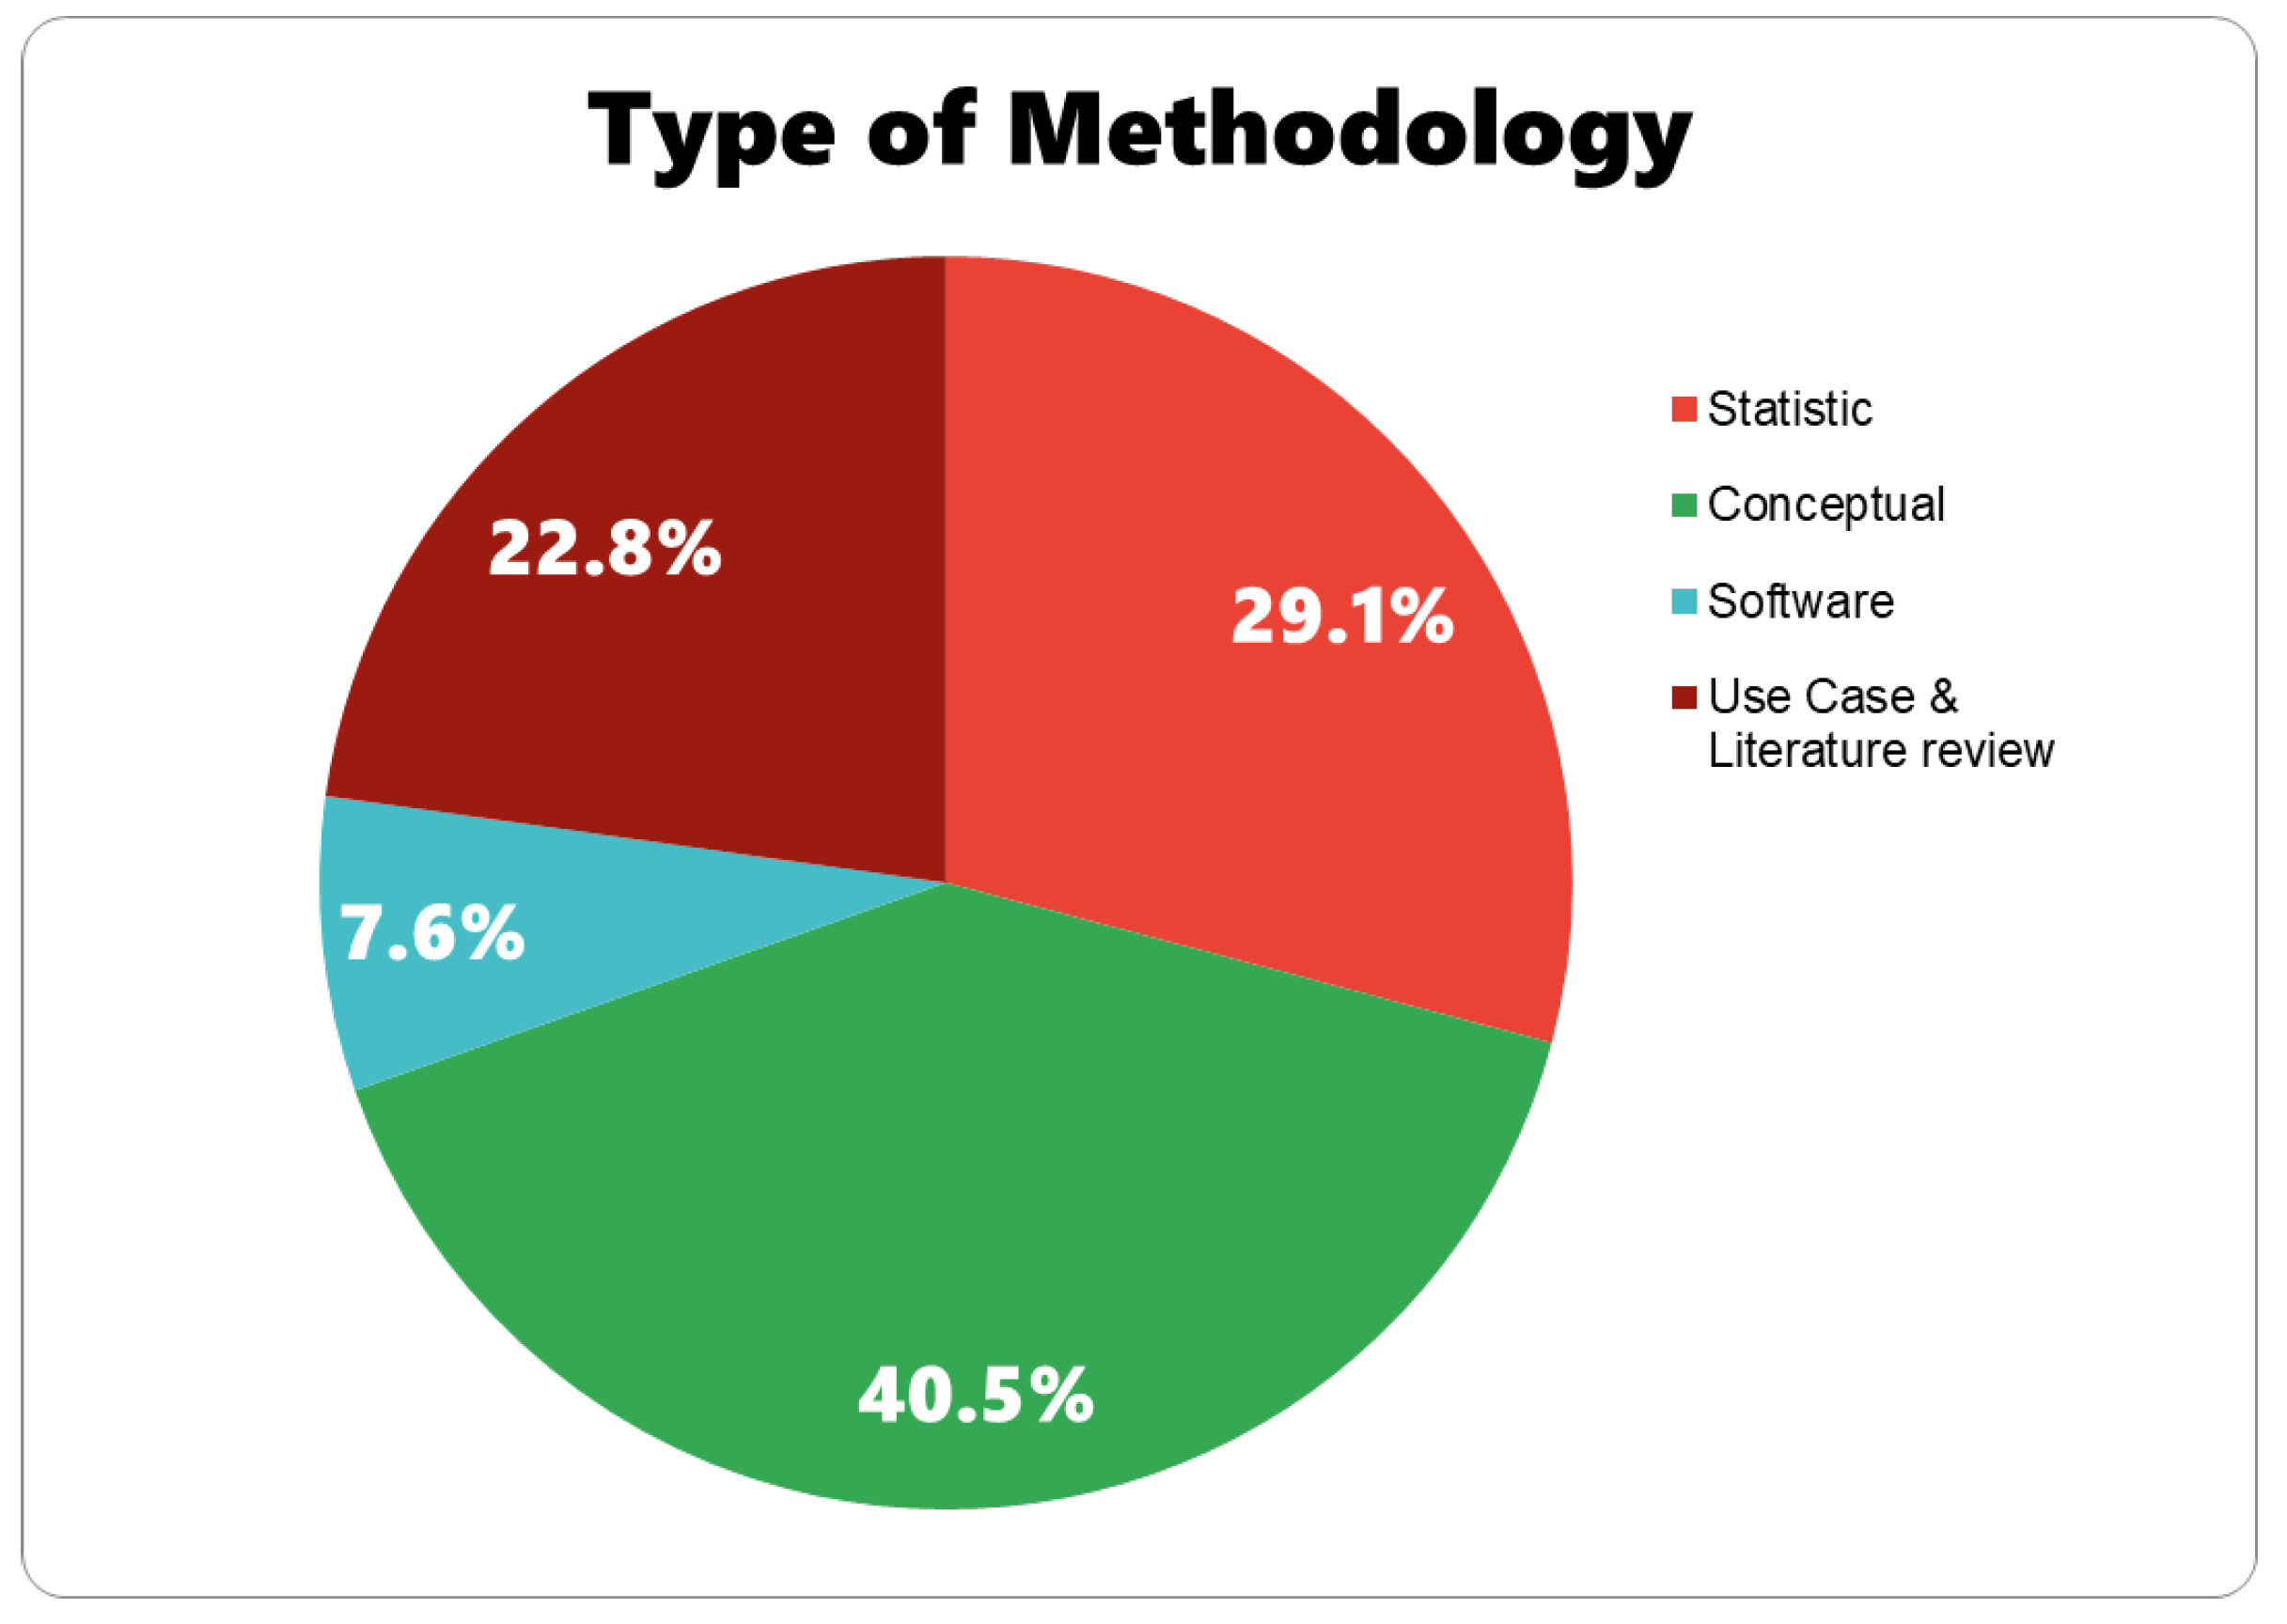
The assessment of the operational implications for rainfall and snow primarily rely on statistical analysis, with the occasional use of conceptual models and specialized software. The evaluation of the transport infrastructure involves the use of particular Key Performance Indicators (KPIs) that identify important points within the transport system. Conversely, the evaluation of the effect of flooding on infrastructure is conducted using specialized software, and in certain instances the operational consequences after flooding are examined using statistical techniques (Figure 7).
In assessing the impact of climate change and extreme weather events on the transport infrastructure, various methodologies are employed to capture and quantify such effects at both the municipal and national levels.
The literature reveals various approaches that are utilized to map and quantify the weather-related impact on the transport infrastructure. Starting with the use cases, the study of ref. [16] reported the significant rainfall events on 4 and 5 December of 2015 over Lancaster in the UK, which caused many infrastructural damages such as the closure of two major bridges and power outages affecting 61,000 residences. Two years later, in 2017, floods over Mandra (Greece) affected almost 40% of roads and 80% of bridges, with 3.4% of bridges collapsed [17]. Also, the case of the well-known and intensive Hurricane “Katrina” was found to cause significant damage to 45 bridges and roadway disruptions across Louisiana, Mississippi, and Alabama [18].
In a different approach, there are various studies that focus on the flooding impacts and vulnerability analysis in diverse geographic areas. An interesting study was conducted in Newcastle-upon-Tyne utilizing a hydrodynamic model (CityCAT 2D) to assess flood impacts within the urban environment under two weather scenarios: (a) a 10-year return period event which was found to have a flood depth of 0.13 m and a 24 min delay and (b) a 200-year event leading to an increased depth of 0.86 m and a 42 min delay. Building on these outcomes, the study interestingly developed a function which correlates water depth and safety [19]. In a similar vein, a study conducted in Australia developed the pavement performance curves using the Thornthwaite moisture index [20].
In a different context, future climate scenarios hazard maps, GIS data, and disruption functions were utilized and predicted increases in road link inundation from 14% to 18% until 2080, while targeted adaptations were found to have a positive impact for mitigation [21]. Building upon this, the study of ref. [22] identified critical water depths impacting road usability, highlighting that depths over 30 cm would make roads impassable. Interestingly, the resilience of Thessaloniki, which is a coastal city, against the sea level rise (SLR) was assessed under future climate scenarios of CMIP5 (RCP4.5: 0.5 m SLR and RCP8.5: 1 m SLR by 2100). Specifically, they found that in the intermediate scenario, 1.87% of the coastal road network would be affected, while the inundation impact factor for the whole city was calculated at 12.30%. For the worst-case scenario, 3.07% of the coastal network would be affected, and the impact factor would be further increased to 13.34% [23].
A third approach involves the use of metrics and KPIs to quantify impacts on transport networks. The impact of a 4.6 m local flooding level from the Ping River in Chiang Mai was found to affect over 6.33% of the population [24]. Significantly, the critical vulnerabilities of the New York transport network were assessed in the study of ref. [25], which found that a removal of 25% of network nodes reduced the connectivity of the nodes by 50%, while a 20% node removal reduced the betweenness centrality almost entirely. In a different environment, a simulated Category 3 hurricane resulted in flooding 13% of the network nodes, which spiked the average shortest path length by 155% and affected critical network nodes severely [26].
Building on national-level assessments, other studies employed exposure and vulnerability mapping alongside advanced analytical methods. The impact of the 1997 floods on the road network of Czech Republic was found to have a 30% reduction in serviceability and a 33% decrease in the weighted network efficiency index. The study also reported that 1.3% of the population of Moravskoslezský was isolated, while for the case of Olomoucký, the same metric (population isolation) was 6.1% of the citizens, while only 2.7% of road links were damaged [27].
In a different approach, spatial data were utilized through dedicated software such as ArcGIS and SedInConnect to predict road flooding in Sweden. The prediction significantly explained the 85% variation in flood occurrences and achieved 88% accuracy in predicting flood locations [28]. A study regarding the resilience of the Chinese road network that used future climate projections (CMIP5) and Open Street Map (OSM) road data predicted substantial disruptions from extreme rainfall over 10,000 km of highways and 4000 intersections by 2030 and 2050. The analysis highlighted significant risks in Guangdong and Guangxi provinces, where more than 80% of the highway road network was found to be vulnerable to extreme precipitation events [29]. In Norway, almost 30% of the total road network was characterized to be vulnerable to snow avalanches and rockfalls/slides [30]. The novel study of ref. [31] assessed the effects of climate change on the global transport infrastructure, using CMIP5 climate projections and OSM data through a probabilistic approach (Generalized Extreme Value). The results forecasted that about 43.6% of global transport assets could experience at least a 25% reduction in design return periods with a 2 °C warming by the mid-21st century (increased rainfall), escalating to 69.9% with a 4 °C warming at the late century. Particularly vulnerable areas included parts of North and South America, Central Africa, and Asia.
Apart from the significant infrastructural damages related to adverse weather events, the literature highlights significant impacts on the regular working conditions of the urban transport systems with a greater focus on traffic parameters, such as road capacity, traffic flow, and safety. For example, an interesting study in Iowa and Minnesota illustrated that severe weather could escalate costs by up to 30 times and reduce traffic volumes by 7–56%, with winter conditions leading to an 80% traffic reduction under severe visibility constraints [32]. Complementary findings of a different place in the USA, Virginia, showed that rainfall decreased the freeway capacity of roads by 4–10% for light rain and by 25–30% for heavy rain together with speed reductions of 5.0–6.5% [33].
Moving to Greece, the intense and impactful Mandra flooding was found to affect 22% of basin roads (flooding), significantly increasing travel time by 67.6–117% [17], while in Arkansas, a runoff of 100 mm was correlated with 77% reduction in freight volumes [34]. In Malaysia, varying intensities of rainfall reduced road capacity by 2–32% [35] and another study in Alberta found that snowfall led to a direct decrease in traffic volumes (1–2% per centimeter of snow), while extreme cold led to a decrease in traffic volume of up to 31% [36]. A study in Istanbul evidenced that light snow was associated with a substantial 65–66% reduction in traffic volume [37].
A study conducted in Chicago found that potential increases in rainfall could spike traffic accidents in suburban areas by 30% [38]. The detailed analysis of ref. [39] revealed widespread reductions in traffic volumes and flow rates by 6–30% under adverse conditions. Interestingly, the results of a flood model implemented in Newcastle suggested that strategic adaptation could improve city-wide travel times by 3–22% [40]. When it comes to winter storms, a detailed analysis in Iowa identified a clear decrement in road capacity by 2.8% for every additional 0.254 mm/h of snowfall, with overall traffic volume reductions averaging 29% during winter storm events [41]. Moving to Manchester, the study of ref. [42] expanded the analysis to more weather parameters and revealed that heavy rainfall (greater than 4.0 mm/hr) reduced average traffic speed by 9.7% during peak hours while temperatures above 20 °C significantly slowed traffic speed by 36.5% during peak hours but increased traffic volume by 6.6% (inverse effect for off-peak hours).
A study in Athens [43] revealed many impacts of the transport system under varying conditions; specifically, daily vehicle flows decreased from 5.0% to 30.4% during rainfall, with a maximum reduction of 52.3%. Vehicle speeds dropped by up to 57.1%, and road occupancy saw wide fluctuations, from −21.9% to +88.2% in extreme conditions. For freight vehicles, speed reductions ranged from 10% to 37% daily and 5.5% to 23.1% during rainfall, with the greatest decrease at 67.8%. Flooding reduced freight kilometers by 24%, highlighting the substantial effects of heavy rain on transport and logistics. In a similar vein, a direct correlation between rainfall intensity and speed reduction was addressed: light rainfall (0.25–1 mm/h) decreased speeds by up to 13.3%, moderate rainfall (1–4 mm/h) by up to 19.2%, and heavy rainfall (>4–16 mm/h) led to speed reductions of up to 28.3%. On major arterial roads, precipitation exceeding 3 mm/h consistently reduced speeds by at least 4 km/h, while impacts on secondary roads were less pronounced [44].
Another study showed that storm days resulted in travel delays ranging from 15 min to more than three hours, with a staggering increase of 600% in delay times and a reduction in traffic volumes by up to 100% [45]. The study conducted in Lothian, Scotland, noted that snow presence led to a 10% decrease in weekday traffic and 15% on weekends while high rainfall resulted in traffic decreases of 0.82% on weekdays and 4.6% on weekends. Less sunshine hours saw slight traffic reductions of 0.17% on weekdays and 2.69% on weekends, while extreme temperatures also affected traffic; unseasonably low maximum temperatures decreased traffic by 2.75% on weekdays and 4.21% on weekends and higher-than-usual rain further reduced weekday traffic by 0.82% and by 4.73% at weekend [46].
A pivotal study conducted at Queen Elizabeth Way in Ontario, Canada highlighted that heavy rainfall and snowfall could dramatically reduce traffic flow rates by up to 50% and decrease free-flow speeds by even 50 km/hr [47], while another study in Canada but in Alberta found that heavy snowfall (e.g., 15 cm or more) combined with extreme cold (below −20 °C) drastically reduced passenger car traffic [48]. Regarding the relationship between weather events and traffic safety, the review of ref. [49] indicated that across the United States, nearly 47% of all weather-related traffic accidents were attributed to rain, while in the United Kingdom, snow accounted for approximately 2.8% of total roadway crashes, rising to as much as 5.9% in some northern regions.
The impact of extreme weather events on transport networks varies significantly across different studies since it is influenced by factors related to the event (e.g., intensity, time of occurrence, and area of interest) and the methodological approach. A key challenge in synthesizing these findings lies in the lack of standardized criteria for classifying and assessing same events, a fact which complicates cross-study comparisons. The following paragraph identifies and discusses trends that were derived from many studies regarding the impact of rainfall, flooding, and snow on traffic parameters.
Starting with rainfall, the intensity of precipitation is directly proportional to its impact on transport systems. Heavier rainfall tends to cause more severe disruptions in traffic flow and road capacity due to reduced visibility, slippery road surfaces and increased risk of accidents. Temporal factors also play a critical role, as traffic volumes are often more affected during nighttime due to changing drivers patters (avoiding non-essential travel). During daytime, peak hours experience higher increase in travel times compared to off-peak hours, with morning peaks generally experiencing greater delays than evening peaks, likely following the commuter densities. Geographically, dense urban areas tend to suffer more from rainfall compared to rural regions due to higher traffic volumes, complex road networks, and the limited capacity for water drainage in urban environments.
In the case of flooding, the severity of travel delays correlates with the depth and extent of flooded areas since water makes roads impassable, necessitating detours and causing significant disruptions and delays. Similarly, snowfall intensity has a proportional effect on traffic volume; light snowfall may lead to minor reductions in traffic due to cautious driving behavior while severe snowstorms, which are combined by limited visibility, can result in extensive traffic disruptions. The temporal dimension of snow-related impacts reveals that extreme cold and snowfall have a greater influence during off-peak hours on commuter roads, possibly due to reduced road maintenance activities and lower traffic-induced snow compaction. Interestingly, the severity of snow-related traffic disruptions is more pronounced during weekend morning peak hours compared to weekdays since drivers are more willing to postpone or cancel non-essential trips. Rural highways experience significant reductions in traffic volume during snowy conditions, exacerbated by factors such as high winds and poor visibility, while recreational roads are particularly vulnerable, as discretionary travel is often avoided during adverse weather.
The following figure (Figure 8) presents a boxplot analysis illustrating the impacts of significant weather events—rainfall, snow and flooding—on key traffic variables commonly explored in the literature, including volume, speed, capacity, flow, travel time, delay and occupancy. The x-axis represents these traffic variables, while the y-axis quantifies the impact in percentage terms, where positive values indicate an increase and negative values signify a decrease relative to normal conditions. The data are synthesized from multiple studies analyzed within the systematic literature review capturing a range of results across different studies for each weather event.
Extreme weather events significantly influence various traffic parameters, with their effects ranging from significant reductions to dramatic increases depending on the context and severity of the event. For rainfall, the impacts on traffic volume, speed and capacity are generally moderate with reductions of up to 10%, while in some instances, there are observed also increases in both volume and speed during rainfall. The median impact on flow from rainfall is a reduction of approximately 30%, while it causes increases in travel time and delays by about 5% and 25%, respectively. Flooding exhibits a more pronounced effect, reducing traffic volume and speed by median values of around 25% and also results in a substantial increase in travel time (up to 90%) and occupancy (median value around 40%) with considerable variations observed across different instances. Snowfall’s impact is marked by a more significant reduction in volume compared to the other weather events (~30%), though its effect on flow is lesser (~20%). It also increases travel time by more than 15% with wide variations. Notably, there are some outliers worth mentioning: a complete reduction (100%) in volume due to rainfall, a 150% increase in travel time due to snow, a 50% increment of travel time due to rainfall, and a 600% increase in delay caused by the same event.
Recent studies have highlighted the varied impacts of extreme weather events on supply chain and companies operations. Utilizing the emergency events database (EM-DAT), a study conducted in China analyzed the heterogeneous effects of extreme weather on firm productivity using longitudinal financial data and regression models [50]. The findings indicated that operational slack, the implementation of digital technology, and cash hedging can assist firms in stabilizing material, information, and financial flows, respectively, helping them having fewer productivity losses during extreme weather events. Moreover, a study conducted in Chicago investigated urban freight management challenges through simulation software and demonstrated that adverse weather can significantly increase travel times (40–50% during heavy rain events) and disrupt service delivery, with some events doubling travel times, while the weather-aware optimal routing could substantially decrease late penalties [51].

3.2.3. Economic Burden of Extreme Weather Events on Transport and Logistics Operations and Infrastructure

The economic aspect of extreme rainfall on logistics operations is also investigated by reporting significant financial impacts associated with weather-related disruptions and damages. In a comprehensive analysis conducted in this study, the impacts of extreme weather events on infrastructure and transport are reported, revealing a wide range of direct and indirect economic consequences. In the most of the cases, the studies report the economic impacts through literature review and use case examination, while in some cases these costs are calculated through modeling.
In recent years, comprehensive studies have highlighted the significant economic impacts of extreme weather events on the global transport-related infrastructure. For instance, the immense economic impact of 2007 floods in Bangladesh accounted for 34% of total infrastructure damage, equivalent to roughly USD 363 million while Indonesia experienced approximately USD 35 million in damages (about 25% of its total infrastructure costs) [52]. Another study pointed out that the South Indian floods occurred during December 2015 caused losses around ₹100,000 due to transport delays and infrastructure damages, while the 2014 floods in Kashmir mirrored same losses (₹100,000) due to analogous reasons [53].
The report of ITF [54] estimated that the economic impacts of extreme weather from 1998 to 2010 resulted in extra annual costs of approximately EUR 2.5 billion on the transport sector of the EU alone with additional indirect costs of EUR 1 billion impacting other sectors. This was echoed in later studies, where simulation models were used to project a dramatic increase in travel costs by 223% to 370% during flood events in Newcastle [45]. In addition to that, the interesting report by UN [55] outlined the heavy financial burdens of adverse weather conditions, estimating the direct annual costs on the EU transport sector at EUR 2.5 billion, primarily for infrastructure repair and vehicle damage. Since 1980, EU Member States have suffered over EUR 360 billion in damages from extreme weather events, while damages to the transport infrastructure resulting from extreme precipitation due to climate change may rise by 50% by 2040, potentially reaching approximately EUR 930 million annually [56].
Remaining at Europe, a detailed analysis of financial impacts due to weather-related hazards on transport systems was applied and estimated annual costs of EUR 2.4 billion [57]. These findings are supported by similar assessments for the Czech Republic [27] but also for broader European contexts [58], pointing to substantial damages to the transport infrastructure and elevated operational costs. Lastly, within the Asian continent, the study of ref. [31] discussed the economic implications of damages to road and railway assets in China with annual costs ranging between CNY 3.1 billion and CNY 22 billion, and finally, in the USA, ref. [18] estimated 108 USD billion as a result of hurricane Katrina.
In addition to that, an interesting study of ref. [59] explored the weather-induced costs and found that traffic breakdowns and delivery delays can add roughly 10% (or EUR 3 million) to the operational costs of a company. Additionally, the study of ref. [60] indicated that the increased extreme rainfall expected in southeastern China by 2030 could reduce global production by 20% during a disaster year and highlighted that storms could cause revenue losses up to 35% for unprepared businesses. The key study of ref. [61] analyzed the economic impact of July 2020 heavy rainfall over Japan using supply chain data from 1.6 million firms. Over 200 days, the total value-added loss was estimated at YEN 74.6 billion. Scenario analyses included: “Damage at once” with a similar YEN 74.6 billion loss; “Firm shuffle” projecting YEN 300 billion loss due to supply chain reshuffling; “Damaged firm shuffle” with YEN 150 billion loss from directly damaged firms; and “Damage at once” scenario estimating YEN 90 billion loss from concentrated damage.
The economic burden of extreme weather events varies significantly across different regions, influenced by geographical, climatic and socio-economic factors. The majority of studies focus on the impacts of extreme weather events on the transport and logistics sector. The uniqueness of each case, often resulting from co-occurring events (e.g., rainfall combined with extreme wind), makes it challenging to isolate the costs associated with individual events. Additionally, there is limited information on the maintenance and repair costs due to weather-related damages. Compounding these issues is the fact that each country operates with its own currency, making the standardization of cost assessments a complex task which requires a dedicated analysis; however, interesting insights are gained from the review.
In many low-income Asian countries, the prevalence of extreme weather events (e.g., monsoonal rainfall) imposes substantial economic costs which often constitute a significant proportion of the national GDP, exacerbating existing economic vulnerabilities due to limited adaptive capacities and a fragile infrastructure. In the United States, and especially at the coastal areas, the occurrence of impactful extreme weather phenomena (e.g., hurricanes and floods) results in extensive damage and necessitate considerable financial expenditure for recovery and mitigation efforts. In Europe, the economic impact of extreme weather varies by region; Central Europe faces significant costs from icy conditions, while the Mediterranean and Scandinavia are more affected by rainfall and flooding, particularly in coastal areas vulnerable to climate-induced precipitation changes. France and the UK experience a balanced impact, with rainfall and floods outweighing ice and snow-related damages. Although storms generally contribute less to economic losses across Europe, Eastern European countries incur relatively higher costs from such events due to infrastructure vulnerabilities.
The figures of the above table (Table 3) provide a strong argument to understand that the cost for maintenance and repair due to weather induced events such as rainfalls and floodings is even comparable to the huge damage cost of hurricanes. These facts urges cities and companies to adopt climate-proof strategies to mitigate such economic impacts. The following section collects the suggested actions and measures from the point of view of different stakeholders (companies and city authorities).

3.2.4. Policy Frameworks for Climate Resilient Logistics

In addressing the multifaceted challenges posed by climate change on transport and logistics, a systematic review of the literature reveals a variety of strategic actions crucial for enhancing their resilience. This analysis highlights the most significant actions, supported by empirical findings and expert recommendations from a range of studies.
The deployment of intelligent transport systems (ITSs) and real-time data analytics emerges as a pivotal strategy for enhancing the efficiency and resilience of transport operations [17,62]. ITSs are instrumental in optimizing traffic flow and reducing congestion, which not only mitigates greenhouse gas emissions but also enhances the responsiveness of transport networks during climate-induced events [63]. Furthermore, real-time data analytics facilitate strategic decision-making, allowing for timely adjustments in operations and emergency responses [34]. Apart from proactive measures, investments in green infrastructure are recognized for their dual benefits of enhancing urban resilience and providing environmental co-benefits [64,65]. The use of permeable pavements, green roofs, and rain gardens not only aids in managing stormwater but also reduces urban heat islands [19,66]. Crucial interventions concern the regular maintenance of infrastructure, including roads, bridges, and drainage systems, which is considered essential to prevent disruptions and ensure operational integrity during extreme weather events [17,52]. Proactive measures such as the frequent clearing of drainage systems and maintenance of protective structures are necessary to prevent costly damages in the face of flooding and extreme rainfall.
The formulation and implementation of comprehensive emergency response and risk management plans are essential adaptive measures highlighted across studies [54,67]. These plans include the development of evacuation protocols, traffic diversion strategies during disruptions, and the prioritization of critical infrastructure protection. Effective planning ensures that transport systems can maintain functionality during adverse conditions, safeguarding operations stability but also public safety. The adaptation of policy and regulatory frameworks to incorporate climate considerations is important in ensuring the long-term resilience of transport infrastructure during the planning phase [68,69]. Updating the design standards to reflect the current and future climatic conditions and integrating climate risk assessments into urban planning and building codes are transformational measures that secure cities and industries for sustainable operations towards climate uncertainty. Finally, the stakeholders’ and citizens’ engagement through targeted awareness campaigns and educational programs is essential for fostering a culture of resilience and proactive climate adaptation [32,70]. These initiatives enhance community preparedness, inform policy developments and ensure that climate adaptation measures are broadly supported and effectively implemented.
The actions are categorized into five strategic measure types based on their major type: Low-Regrets Measures focus on cost-effective interventions with broad societal benefits; Win–Win Measures deliver direct climate mitigation advantages alongside significant co-benefits; Adaptive Measures enhance community and infrastructure resilience by preparing for current and future climate conditions; Transformational Measures drive large-scale, structural changes requiring substantial long-term investments; and Cost-Bearing Measures address critical high-vulnerability infrastructure protection through high-cost, essential risk mitigation strategies. Table 4 contains the aforementioned actions with their characterization.
A coordinated implementation of these actions requires integrating stakeholder efforts to address the complexities of extreme weather impacts. City authorities must prioritize risk assessments and resource allocation, companies should adopt adaptive technologies and sustainable practices, and research institutes must advance resilience-focused studies and innovations.
The identified measures synergistically establish a multi-layered defense mechanism against weather-induced disruptions ensuring that transport systems remain operational and economically stable under the unpredictability of climate change. The integrated deployment of ITS and real-time data analytics enables companies to anticipate and efficiently manage potential disruptions by providing early warnings, optimizing routes during adverse conditions and enabling time-sensitive operational adjustments; this approach addresses issues of reduced traffic flow and increased delays, particularly during rainfall events. Investments in green infrastructure, such as permeable pavements and green roofs, enhance resilience by improving water absorption and runoff management, and they address the infrastructure vulnerabilities and reduce the likelihood of road closures.
Adaptive design standards and enhanced materials ensure that new and retrofitted infrastructures can withstand worsening climatic conditions, specifically addressing critical infrastructure damages such as bridge failures and road damage, thereby preventing costly repairs and operational disruptions. Additionally, comprehensive emergency response plans and risk management strategies are crucial during extreme weather events, maintaining operational continuity through established traffic management protocols and alternative routing, which also help to mitigate increased travel times and minimize economic impacts. Furthermore, data-driven and technology-enhanced decision-making prioritizes infrastructure resilience and optimizes land use in weather-resilient areas, such as elevated regions, to prevent costly repairs and avoid operational disruptions.

4. Policy Roadmap

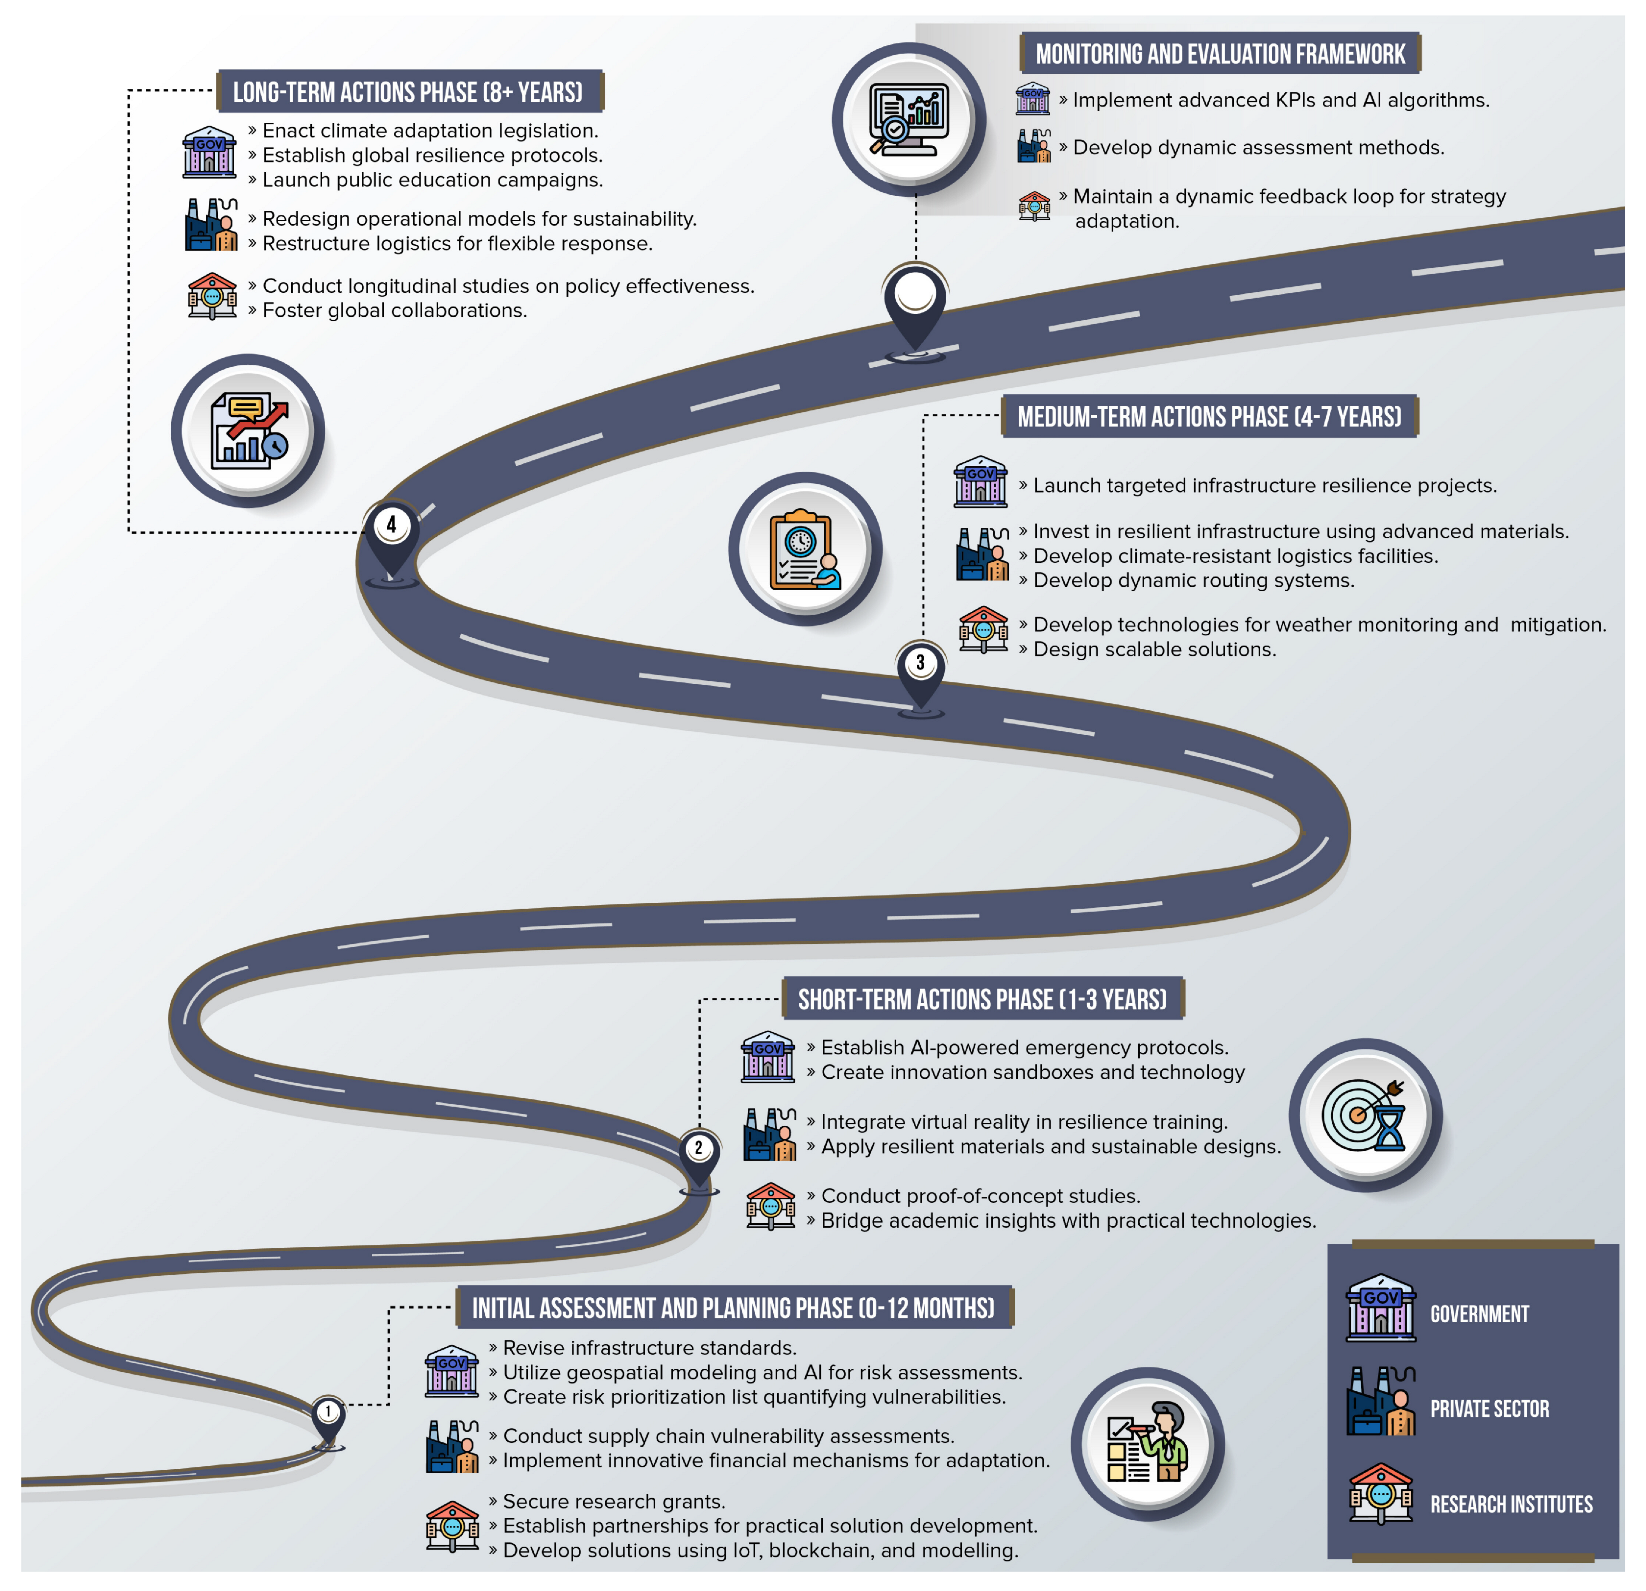
The increased frequency and severity of extreme weather events due to climate change pose significant challenges to transport and logistics systems, hence threatening their infrastructure integrity, operational efficiency and economic stability. To effectively address these impacts, a strategic and systemic approach, to enhance resilience and ensure continuity in the face of climate uncertainties, is necessary. This roadmap presents a comprehensive set of actions ranging from immediate, practical measures to long-term transformational changes, all designed to mitigate the impact of adverse climate events. By integrating innovative technologies, sustainable practices and collaborative policies, the proposed roadmap, included in Figure 9, aims to safeguard critical systems and adapt to evolving climate risks effectively.
The Initial Assessment and Planning Phase (0–12 Months) represents a critical initial period which, through a holistic approach, combines technological readiness, capacity building and predictive analytics. Interestingly, government regulators will not only revise infrastructure standards but they will also utilize advanced geospatial modeling and Artificial Intelligence (AI) algorithms to develop dynamic and predictive risk assessments for the urban areas with a special focus on flood-prone places and coastal zones. Critically, this will introduce a comprehensive risk prioritization list for the current infrastructure that considers climate threats and facilitates evidence-based mitigation measures. Concurrently, private companies will assess their supply chain processes through comprehensive and data-driven vulnerability assessments to address potential weather-induced disruptions and damages. The results will be complemented by innovative financial mechanisms such as investment incentives and new public–private financing models, to support adaptation efforts. Research institutions will play a transformative role by securing focused research grants and establishing interdisciplinary partnerships that aim to develop practical and innovative solutions and systemic approaches that integrate cutting-edge technologies such as Internet of Things (IoT) sensors, blockchain for transparent tracking, and advanced modeling techniques.
During the Short-Term Actions Phase (1–3 Years), stakeholder efforts will become more structured and technologically advanced. Specifically, academic insights will be transformed into actionable strategies, with a strong emphasis on digital innovation, in order to develop adaptive and real-time and data-driven systems capable of providing dynamic responses and predictions. The approach will exceed regular risk mitigation by designing infrastructure which can dynamically adapt to the evolving weather-related challenges. Significantly, government bodies will establish emergency response protocols-based advanced AI-powered prediction systems in order to create standardized guidelines that can dynamically adjust to complex and weather-changing scenarios. Also, they will develop dedicated innovation sandboxes and technology transfer protocols specifically designed to ensure that strategies can ensure security and interoperability. Simultaneously, the private sector will implement resilience training programs utilizing virtual reality technologies and specialized software. These tools will support the evaluation of infrastructure adaptation strategies (e.g., use of advanced materials and sustainable design principles) in order to create flexible and responsive solutions that can handle unpredictable (extreme) weather conditions. Research institutions will complement these efforts by developing interdisciplinary proof-of-concept studies and establishing collaborative platforms that bridge academic insights with practical climate adaptation technologies.
The Medium-Term Actions Phase (4–7 Years) marks a significant scaling of collaborative efforts characterized by substantial infrastructure transformation and technological integration. Government bodies can launch targeted infrastructure resilience projects, such as elevated road systems and the integration of intelligent transport networks (that can dynamically reconfigure), that can reshape and upgrade transport systems. When it comes to the industry, private companies will make substantial investments in infrastructure resilience utilizing advanced materials like self-healing concrete, developing waterproof and resistant logistics facilities and implementing AI-driven routing systems that can dynamically adjust based on real-time weather forecasting. Public–private partnerships will be enhanced utilizing technologies like blockchain to ensure transparent, fair and accountable funding, and the implementation of critical resilience initiatives. The role of research institutes is of great importance in developing advanced technologies, while they will not only monitor weather conditions but also predict and mitigate potential disruptions with an emphasis on designing scalable solutions.
The Long-Term Actions Phase (8+ Years) represents an approach that transforms the entire ecosystem of transport and logistics, enhancing its resilience. Specifically, it creates global knowledge-sharing platforms and accelerates technology transfer between resilient and “suffering” regions. At first, government bodies will enact comprehensive climate-adaptation legislation that integrates long-term resilience planning across all sectors and will create regulatory frameworks that incentivize innovative and sustainable practices. This will include the establishment of international governance mechanisms and standardized global resilience protocols while extensive public education campaigns will raise awareness and promote a culture of climate adaptation, embedding resilience into societal consciousness. Private companies will fundamentally redesign their operational models (both for long haul and last mile logistics) by integrating collaboration, sustainability, and climate resilience into corporate governance strategies, and they will consider the proactive design of business models that contribute to global climate mitigation efforts. Research institutes will conduct longitudinal studies that provide unprecedented insights into the effectiveness of implemented policies and technologies. These studies will extend beyond national boundaries fostering global collaborations to develop comprehensive strategies for mitigating climate-related challenges.
A robust Monitoring and Evaluation Framework will be the strategic backbone of this roadmap, utilizing advanced KPIs that go far beyond traditional metrics. Dedicated AI and Machine Learning (ML) algorithms will continuously track reductions in disruption times, infrastructure repair expenses, and the adoption of resilient technologies. The framework will introduce more dynamic assessment methods that capture not just infrastructure performance but also social and economic resilience indicators, while a dynamic feedback loop will ensure that the strategy remains responsive to emerging climate risks, providing a living document for adaptive framework of global transport resilience.

5. Future Research Agenda

The increasing impact of climate change on urban logistics necessitates the application of a multidimensional approach from multiple disciplines. This agenda proposes guiding directions to researchers in order to map climate-related disruptions and address potential ways to tackle crucial weather-induced challenges on urban logistics and transport systems. It extents beyond the conventional methodologies integrating cutting-edge technologies, economic analyses, social considerations, and proactive policy actions. The four streams outlined in this research agenda aim to provide a holistic and systemic approach to transform urban logistics systems, enhancing their resilience and adaptability and equipping them to manage climate-related disruptions while maintaining operational efficiency and securing the resilience of transport infrastructure.
First, Advanced Modeling Stream suggests the development/integration of advanced logistics modeling techniques such as AI, system dynamics, and probabilistic modeling to assess the impact of climate change and extreme weather events in the complex logistics system [71,72]. Researchers should conduct extreme value theories (e.g., Gumbel) on historical local rainfall and consider future climate models (e.g., CMIP5 and CMIP6) to develop extreme weather scenarios with different return periods [73]. Additionally, implement advanced stochastic models that integrate historical climate data with predictive scenarios and develop granular probabilistic frameworks to capture complex interactions between weather patterns and logistics systems. This stream also recommends developing models that capture the complex relationships between weather parameters such as rainfall intensity, snowfall accumulation, flood depths, and traffic variables (e.g., vehicle speeds, road capacity, and travel delays) to analytically model the logistics and transport system. Researchers should create multi-layered modeling approaches that account for regional variations in climate impacts and design high-resolution simulation environments that model the cascading effects of extreme weather events. These efforts will help in understanding how weather-induced impacts are propagated in the system and identifying the affected elements [34]. Additionally, it suggests the definition of dedicated KPIs, including social, economical and environmental dimensions, to consider the weather aspect to assess operations efficiency and infrastructure vulnerability, while these KPIs serve as metrics for prioritizing the critical areas of transport systems [74]. Furthermore, it suggests quantifying the economic impacts of weather-related disruptions by analyzing both immediate and cascading effects on cargo movement, transport costs, and service delays, as well as projecting these economic consequences by incorporating future climate patterns [75]. The outcomes will assist city authorities and companies in understanding the impact of climate change on efficiency, security, and finance to support them in building more resilient systems.
The next stream, Technology Stream, focuses on developing adaptive and intelligent infrastructure technologies. Specifically, researchers are suggested to explore the utilization of IoT devices and real-time data to develop advanced technological solutions such as AI- and ML-driven and weather-aware routing algorithms and autonomous transport systems to strengthen the resilience and the flexibility of the operations [76]. It also suggests studies to explore sustainable infrastructure design, considering the use of modular and flexible infrastructure and the integration of green technologies under the circular economy principles [77]. Complementing these digital innovations, researchers should explore traditional engineering approaches such as the use of permeable pavements, green roofs, and improved drainage systems to enhance physical resilience. Researchers should also investigate circular economy principles in infrastructure design, develop technologies that minimize the carbon footprint while maximizing system resilience, and create scalable green technology solutions adaptable to diverse urban environments. Such technological and traditional solutions aim to steer companies, research organizations, and city authorities on which technologies to invest to increase their resilience.
Governance and Policy Stream recommends conducting comparative analyses of popular resilience policies and actions in order to construct adaptive regulatory frameworks that are both flexible and robust [78]. It also suggests studies to use evidence from data and define new design standards to guide cities and companies to restructure their system. The future studies are also suggested to explore the use of optimal and innovative public–private partnership models to strengthen logistics resilience. This stream also suggests the application of socio-economic impact assessments on strategies (e.g., long-term economic analysis, social vulnerability mapping and equity considerations) to ensure their fairness and inclusivity [79]. Furthermore, future studies should utilize economic mechanisms such as cost–benefit analyses to assess the selection of alternative adaptive strategies and design incentives to promote resilient logistics practices. In cost-related analyses, the economic impact of extreme weather events on transport and logistics can influence the selection of adaptive measures. However, cost estimates are not directly comparable across regions due to differing economic conditions. To address this, researchers should account for region-specific economic factors (e.g., currency values, interest rates, and unemployment rates) and development levels (e.g., GDP) to standardize findings and enhance their applicability in diverse contexts.
Finally, Interdisciplinary Stream recommends future research regarding the facilitation of comparative case studies across diverse urban contexts to understand their variability in similar challenges [80]. For the aforementioned comparative analysis, the standardization process is also suggested. It also emphasizes the importance of interdisciplinary research collaborations that bring together various fields, while it advises exploring knowledge transfer and scalability assessments to ensure that effective practices can be adapted and scaled across different environments. Lastly, it encourages the development of universal resilience principles to guide policy and operational decisions globally. This approach aims to enhance the collective understanding and capacity of urban centers worldwide to respond effectively to weather-induced challenges in logistics.
Overall, this research agenda suggests fundamentally transforming urban logistics systems to make them more resilient and adaptive in the face of escalating climate challenges. By providing a holistic approach that integrates technological innovation, economic analysis, policy development, and social considerations, the research aims to create actionable strategies for global implementation, thus reducing climate-related disruptions and improving economic and social outcomes.

6. Conclusions

This study addresses the increasing challenges posed by climate change on the transport and logistics sectors, particularly as a result of the more frequent and severe weather events. It aims to systematically review the literature to identify key weather-induced challenges, quantify their impacts on the operational, infrastructural, and economic aspects, and evaluate the existing mitigation strategies. As a second outcome, this study aims to provide a comprehensive roadmap that can help different stakeholders to enhance their resilience. The main key outcomes are drawn from the current systematic literature review, and are concluded in the following points:
  • The study demonstrates that extreme weather events like heavy rainfall and snowfall critically impact traffic parameters and logistics operations. For instance, severe weather conditions are shown to decrease road capacity and increase travel delays disrupting operational continuity in transport and logistics sectors.
  • It is highlighted that maintenance costs for damaged infrastructure can be a large part of the expenses for cities underscoring the urgent need for adaptive design strategies. This includes upgrading and adopting the current infrastructure, enhancing the resilience of transport paths against weather-induced events.
  • The financial losses due to climate-related disruptions are substantial also for companies within the supply chain with some regions experiencing total economic impacts. Apart from the profound direct costs associated with infrastructure repair, there are also indirect costs due to operational downtime and lost business opportunities.
  • The research emphasizes the critical role of advanced technologies, intelligent transport systems, and data analytics in building climate-resilient infrastructure. They not only enhance operational efficiency but also provide critical real-time data that can be used to adapt and respond to weather-related disruptions more effectively.
  • The study underscores the necessity for comprehensive forward-looking policy frameworks that integrate climate adaptation strategies into urban planning and logistics systems, highlighting as one crucial factor the revision of infrastructure standards to incorporate climate resilience from the design phase.
  • Lastly, the importance of multi-stakeholder approaches is exposed, involving collaboration among public, private, and academic sectors. This collaboration is essential for pooling resources, sharing knowledge, and driving innovations that address the complex weather-related challenges.
Future research should focus on enhancing the resilience of urban logistics systems against climate change through a multidisciplinary approach that merges advanced modeling techniques, adaptive technologies, governance improvements and interdisciplinary collaborations. Developing AI-based logistics models will allow for more accurate simulations of climate impacts on urban logistics efficiency; including the economic aspect with the implementation of IoT and AI-driven infrastructure can improve real-time responsiveness to environmental changes. Crafting adaptable policy frameworks through comparative analysis will help establish guidelines that can be tailored to different urban contexts, while promoting universal resilience principles and conducting cross-city comparative studies are essential for understanding and applying effective strategies universally.

Author Contributions

D.T.: conceptualization, methodology, resources, data curation, software, formal analysis, investigation, validation, writing—original draft preparation, writing—review and editing, and visualization. M.M.: conceptualization, methodology, validation, resources, writing—review and editing, supervision, and project administration. V.Z.: methodology, validation, review and editing, supervision. G.A.: conceptualization, investigation, validation, review and editing, supervision. All authors have read and agreed to the published version of the manuscript.

Funding

This research received no external funding.

Data Availability Statement

Data are contained within the article.

Conflicts of Interest

The authors declare no conflicts of interest.

References

  1. Ritchie, H.; Roser, M.; Rosado, P. CO2 and Greenhouse Gas Emissions; Our World Data: Oxford, UK, 2020. [Google Scholar]
  2. IPCC. Global Warming of 1.5 °C: IPCC Special Report on Impacts of Global Warming of 1.5 °C Above Pre-industrial Levels in Context of Strengthening Response to Climate Change, Sustainable Development, and Efforts to Eradicate Poverty; Cambridge University Press: Cambridge, UK, 2022. [Google Scholar]
  3. United Nations. Climate: World Getting ‘Measurably Closer’ to 1.5-Degree Threshold. Available online: https://news.un.org/en/story/2022/05/1117842 (accessed on 27 June 2023).
  4. Statista. Logistics Industry Worldwide—Statistics & Facts. Available online: https://www.statista.com/topics/5691/logistics-industry-worldwide/ (accessed on 24 July 2023).
  5. US EPA. Climate Change Indicators: Heavy Precipitation. Available online: https://www.epa.gov/climate-indicators/climate-change-indicators-heavy-precipitation (accessed on 30 August 2023).
  6. IPCC. Climate Change 2021: The Physical Science Basis. Contribution of Working Group I to the Sixth Assessment Report of the Intergovernmental Panel on Climate Change. Available online: https://www.ipcc.ch/report/ar6/wg1 (accessed on 28 August 2021).
  7. van der Wiel, K.; Kapnick, S.B.; van Oldenborgh, G.J.; Whan, K.; Philip, S.; Vecchi, G.A.; Singh, R.K.; Arrighi, J.; Cullen, H. Rapid Attribution of the August 2016 Flood-Inducing Extreme Precipitation in South Louisiana to Climate Change. Hydrol. Earth Syst. Sci. 2017, 21, 897–921. [Google Scholar] [CrossRef]
  8. Risser, M.D.; Wehner, M.F. Attributable Human-Induced Changes in the Likelihood and Magnitude of the Observed Extreme Precipitation during Hurricane Harvey. Geophys. Res. Lett. 2017, 44, 12457–12464. [Google Scholar] [CrossRef]
  9. Barclays Investment Bank. Gloomy Forecast: The Economic Costs of Extreme Weather. Available online: https://www.cib.barclays/our-insights/extreme-weather/The-economic-costs-of-extreme-weather.html (accessed on 19 September 2023).
  10. US EPA. Climate Impacts on Transportation. Available online: https://19january2017snapshot.epa.gov/climate-impacts/climate-impacts-transportation_.html (accessed on 6 September 2023).
  11. Christodoulou, A.; Demirel, H. Impacts of Climate Change on Transport: A Focus on Airports, Seaports and Inland Waterways; EUR 28896 EN; Publications Office of the European Union: Luxembourg, 2018; ISBN 978-92-79-97039-9. [Google Scholar]
  12. Forbes. What Will Last Mile Delivery Look like Post-Coronavirus. Available online: https://www.forbes.com/sites/stevebanker/2020/07/24/what-will-last-mile-delivery-look-like-post-coronavirus/?sh=64665a8d3b22 (accessed on 14 October 2023).
  13. WEF. The Future of the Last-Mile Ecosystem. Available online: https://www3.weforum.org/docs/WEF_Future_of_the_last_mile_ecosystem.pdf (accessed on 21 August 2024).
  14. Kotz, M.; Levermann, A.; Wenz, L. The Effect of Rainfall Changes on Economic Production. Nature 2022, 601, 223–227. [Google Scholar] [CrossRef] [PubMed]
  15. Page, M.J.; Moher, D.; Bossuyt, P.M.; Boutron, I.; Hoffmann, T.C.; Mulrow, C.D.; Shamseer, L.; Tetzlaff, J.M.; Akl, E.A.; Brennan, S.E.; et al. PRISMA 2020 explanation and elaboration: Updated guidance and exemplars for reporting systematic reviews. BMJ 2021, 372, n160. [Google Scholar] [CrossRef] [PubMed]
  16. Ferranti, E.; Chapman, L.; Whyatt, D. A Perfect Storm? The collapse of Lancaster’s critical infrastructure networks following intense rainfall on 4/5 December 2015. Weather 2017, 72, 3–7. [Google Scholar] [CrossRef]
  17. Diakakis, M.; Boufidis, N.; Salanova Grau, J.M.; Andreadakis, E.; Stamos, I. A systematic assessment of the effects of extreme flash floods on transportation infrastructure and circulation: The example of the 2017 Mandra flood. Int. J. Disaster Risk Reduct 2020, 47, 101542. [Google Scholar] [CrossRef]
  18. Shen, G.; Aydin, S.G. Highway freight transportation disruptions under an extreme environmental event: The case of Hurricane Katrina. Int. J. Environ. Sci. Technol. 2014, 11, 2387–2402. [Google Scholar] [CrossRef]
  19. Pregnolato, M.; Ford, A.C.; Dawson, R.J.; Ford, A.; Dawson, R. Analysis of the risk of transport infrastructure disruption from extreme rainfall. In Proceedings of the 12th International Conference on Applications of Statistics and Probability in Civil Engineering, ICASP12, Vancouver, BC, Canada, 12 July 2015. [Google Scholar] [CrossRef]
  20. Zareie, A.; Amin, S.R.; Amador-Jiménez, L.E. Thornthwaite moisture index modeling to estimate the implication of climate change on pavement deterioration. J. Transp. Eng. 2016, 142, 04016007. [Google Scholar] [CrossRef]
  21. Pregnolato, M.; Ford, A.; Glenis, V.; Wilkinson, S.; Dawson, R. Impact of Climate Change on Disruption to Urban Transport Networks from Pluvial Flooding. J. Infrastruct. Syst. 2017, 23, 04017015. [Google Scholar] [CrossRef]
  22. Pregnolato, M.; Ford, A.; Wilkinson, S.M.; Dawson, R.J. The impact of flooding on road transport: A depth-disruption function. Transp. Res. D: Transp. Environ. 2017, 55, 67–81. [Google Scholar] [CrossRef]
  23. Papagiannakis, A.; Ntafos, K. Impact Assessment of Climate Change on Coastal Transport Systems in the Greater Thessaloniki Area. In Advances in Mobility-as-a-Service Systems; Nathanail, G., Adamos, E.G., Eds.; Springer: Berlin/Heidelberg, Germany, 2021; pp. 751–759. [Google Scholar]
  24. Tachaudomdach, S.; Upayokin, A.; Kronprasert, N.; Arunotayanun, K. Quantifying road-network robustness toward flood-resilient transportation systems. Sustainability 2021, 13, 3172. [Google Scholar] [CrossRef]
  25. Testa, A.C.; Furtado, M.N.; Alipour, A. Resilience of coastal transportation networks faced with extreme climatic events. Transp. Res. Rec. 2015, 2532, 29–36. [Google Scholar] [CrossRef]
  26. Shah, V.P.; Stern, A.D.; Goodwin, L.; Pisano, P. Analysis of Weather Impacts on Traffic Flow in Metropolitan Washington, DC; Federal Highway Administration (U.S.): Washington, DC, USA, 2003. [Google Scholar]
  27. Bíl, M.; Vodák, R.; Kubeček, J.; Bílová, M.; Sedoník, J. Evaluating road network damage caused by natural disasters in the Czech Republic between 1997 and 2010. Transp. Res. A Policy Pract. 2015, 80, 90–103. [Google Scholar] [CrossRef]
  28. Kalantari, Z.; Cavalli, M.; Cantone, C.; Crema, S.; Destouni, G. Flood probability quantification for road infrastructure: Data-driven spatial-statistical approach and case study applications. Sci. Total Environ. 2017, 581–582, 386–398. [Google Scholar] [CrossRef] [PubMed]
  29. Jia, L.; Yang, S.; Wang, W.; Zhang, X. Impact analysis of highways in China under future extreme precipitation. Nat. Hazards 2022, 110, 1097–1113. [Google Scholar] [CrossRef]
  30. Frauenfelder, R.; Solheim, A.; Isaksen, K.; Romstad, B.; Dyrrdal, A.; Ekseth, K.; Harbitz, A.; Harbitz, C.; Haugen, J.E.; Hygen, H.O.; et al. Impacts of extreme weather events on transport infrastructure in Norway. NHESS 2017, 18, 1–24. [Google Scholar]
  31. Liu, K.; Wang, Q.; Wang, M.; Koks, E.E. Global transportation infrastructure exposure to the change of precipitation in a warmer world. Nat. Commun. 2023, 14, 2541. [Google Scholar] [CrossRef] [PubMed]
  32. Maze, T.H.; Crum, M.R.; Burchett, G. An Investigation of User Costs and Benefits of Winter Road Closures. 2005. Available online: http://lib.dr.iastate.edu/intrans_reports/21 (accessed on 20 February 2021).
  33. Smith, B.L.; Byrne, K.G.; Copperman, R.B.; Hennessy, S.M.; Goodall, N.J. An investigation into the impact of rainfall on freeway traffic flow. In Proceedings of the 83rd Annual Meeting of the Transportation Research Board, Washington, DC, USA, 11–15 January 2004. [Google Scholar] [CrossRef]
  34. Akter, T.; Mitra, S.K.; Hernandez, S.; Corro-Diaz, K. A spatial panel regression model to measure the effect of weather events on freight truck traffic. Transp. A Transp. Sci. 2020, 16, 910–929. [Google Scholar] [CrossRef]
  35. Mashros, N.; Ben-Edigbe, J.; Hassan, S.A.; Hassan, N.A.; Yunus, N.Z.M. Impact of rainfall condition on traffic flow and speed: A case study in Johor and Terengganu. J. Teknol. 2014, 70, 65–69. [Google Scholar] [CrossRef]
  36. Datla, S.; Sharma, S. Variation of impact of cold temperature and snowfall and their interaction on traffic volume. Transp. Res. Rec. 2010, 2169, 107–115. [Google Scholar] [CrossRef]
  37. Akin, D.; Sisiopiku, V.P.; Skabardonis, A. Impacts of Weather on Traffic Flow Characteristics of Urban Freeways in Istanbul. Procedia Soc. Behav. Sci. 2011, 16, 89–99. [Google Scholar] [CrossRef]
  38. Changnon, S.A. Effects of summer precipitation on urban transportation. Clim. Chang. 1996, 32, 481–494. [Google Scholar] [CrossRef]
  39. Goodwin, L.C. Weather Impacts on Arterial Traffic Flow; Road Weather Management Program: Washington, DC, USA, 2002. [Google Scholar]
  40. Pregnolato, M.; Ford, A.; Robson, C.; Glenis, V.; Barr, S.; Dawson, R. Assessing urban strategies for reducing the impacts of extreme weather on infrastructure networks. R. Soc. Open Sci. 2016, 3, 160023. [Google Scholar] [CrossRef]
  41. Knapp, K.K.; Smithson, L.D.; Knapp, K.K. Winter Storm Event Volume Impact Analysis Using Multiple-Source Archived Monitoring Data. Transp. Res. Rec. 2000, 1700, 10–16. [Google Scholar] [CrossRef]
  42. Essien, A.; Petrounias, I.; Sampaio, P.; Sampaio, S. The Impact of Rainfall and Temperature on Peak and Off-Peak Urban Traffic. In Database and Expert Systems Applications; Hartmann, S., Ma, H., Hameurlain, A., Pernul, G., Wagner, R., Eds.; Springer: Cham, Switzerlands, 2018. [Google Scholar]
  43. Mitsakis, E.; Stamos, I.; Diakakis, M.; Salanova Grau, J.M. Impacts of high-intensity storms on urban transportation: Applying traffic flow control methodologies for quantifying the effects. Int. J. Environ. Sci. Technol. 2014, 11, 2145–2154. [Google Scholar] [CrossRef]
  44. Stamos, I.; Salanova, J.M.G.; Mitsakis, E.; Ayfantopoulou, G. Modeling Effects of Precipitation on Vehicle Speed: A Floating Car Data Approach. Transp. Res. Rec. 2016, 2551, 100–110. [Google Scholar] [CrossRef]
  45. Wolf, K.; Dawson, R.J.; Mills, J.P.; Blythe, P.; Robson, C.; Morley, J. Assessing the impact of heavy rainfall on the Newcastle upon Tyne transport network using a geospatial data infrastructure. Resilient Cities Struct. 2023, 2, 24–41. [Google Scholar] [CrossRef]
  46. Hassan, Y.A.; Barker, D.J. The impact of unseasonable or extreme weather on traffic activity within Lothian region, Scotland. J. Transp. Geogr. 1999, 7, 209–213. [Google Scholar] [CrossRef]
  47. Ibrahim, A.T.; Hall, F.L. Effect of adverse weather conditions on speed-flow-occupancy relationships. Transp. Res. Rec. 1994, 1457, 184–191. [Google Scholar]
  48. Roh, H.-J.; Datla, S.; Sharma, S. Effect of Snow, Temperature and Their Interaction on Highway Truck Traffic. J. Transp. Technol. 2013, 3, 24–38. [Google Scholar] [CrossRef]
  49. Dey, K.C.; Mishra, A.; Chowdhury, M. Potential of Intelligent Transportation Systems in Mitigating Adverse Weather Impacts on Road Mobility: A Review. IEEE Trans. Intell. Transp. Syst. 2015, 16, 1107–1119. [Google Scholar] [CrossRef]
  50. Liang, C.; Zhu, M.; Lee, P.K.C.; Cheng, T.C.E.; Yeung, A.C.L. Combating extreme weather through operations management: Evidence from a natural experiment in China. Int. J. Prod. Econ. 2024, 267, 109073. [Google Scholar] [CrossRef]
  51. Jiang, L.; Mahmassani, H. City logistics: Freight Distribution Management with Time-Dependent Travel Times and Disruptive Events. Transp. Res. Rec. 2014, 2410, 85–95. [Google Scholar] [CrossRef]
  52. Regmi, M.B.; Hanaoka, S. A survey on impacts of climate change on road transport infrastructure and adaptation strategies in Asia. Environ. Econ. Policy Stud. 2011, 13, 21–41. [Google Scholar] [CrossRef]
  53. Vajjarapu, H.; Verma, A.; Gulzar, S. Adaptation Policy Framework for Climate Change Impacts on Transportation Sector in Developing Countries. Transp. Dev. Econ 2019, 5, 3. [Google Scholar] [CrossRef]
  54. ITF. Adapting Transport to Climate Change and Extreme Weather; ITF Research Reports; OECD Publishing: Paris, France, 2016. [Google Scholar] [CrossRef]
  55. Bowyer, P.; Haensel, S.; Smalley, E.; Velegrakis, A.; Dagan, M.; Wyrowski, L. Climate Change Impacts and Adaptation for Transport Networks and Nodes; United Nations Publications: Geneva, Switzerland, 2020. [Google Scholar] [CrossRef]
  56. Tesfai, I.; Napoli, G.; Ferraro, S.; Poggioli, A.; Speranza, M. Decision-Making Support System for Crisis Operations and Logistics Aspects in Extreme Weather-Induced Events. In Advances in Hydroinformatics; Gourbesville, P., Caignaert, G., Eds.; Springer: Berlin/Heidelberg, Germany, 2020; pp. 53–64. [Google Scholar] [CrossRef]
  57. Doll, C.; Klug, S.; Enei, R. Large and small numbers: Options for quantifying the costs of extremes on transport now and in 40 years. Nat. Hazards 2014, 72, 211–239. [Google Scholar] [CrossRef]
  58. Michaelides, S.; Leviäkangas, P.; Doll, C.; Heyndrickx, C. Foreward: EU-funded projects on extreme and high-impact weather challenging European transport systems. Nat. Hazards 2014, 72, 5–22. [Google Scholar] [CrossRef]
  59. Ludvigsen, J.; Klæboe, R.; Nokkala, M.; Hietajärvi, A.-M.; Leviäkangas, P.; Oiva, K.; Athanasatos, S.; Michaelides, S.; Papadakis, M. Costs and Consequences of Extreme Weather on European Freight and Logistics Industries and Supply Chains. EWENT Deliverable 4.4. 2012. Available online: http://ewent.vtt.fi/deliverables.htm (accessed on 6 July 2023).
  60. McKinsey Sustainability. Could Climate Become the Weak Link in Your Supply Chain? Available online: https://www.mckinsey.com/capabilities/sustainability/our-insights/could-climate-become-the-weak-link-in-your-supply-chain (accessed on 27 March 2024).
  61. Inoue, H. The economic impact of heavy rain stream on supply chain. In Proceedings of the 20th Forum on Information Science and Technology, FIT2021, Online, 25–27 August 2021. [Google Scholar]
  62. Doll, C.; Trinks, C.; Sedlacek, N.; Pelikan, V.; Comes, T.; Schultmann, F. Adapting rail and road networks to weather extremes: Case studies for southern Germany and Austria. Nat. Hazards 2014, 72, 63–85. [Google Scholar] [CrossRef]
  63. Tsaples, G.; Grau, J.M.S.; Aifadopoulou, G.; Tzenos, P. A Simulation Model for the Analysis of the Consequences of Extreme Weather Conditions to the Traffic Status of the City of Thessaloniki, Greece. In Dynamics of Disasters: Impact, Risk, Resilience, and Solutions; Kotsireas, I.S., Nagurney, A., Eds.; Springer: Berlin/Heidelberg, Germany, 2021; pp. 259–272. [Google Scholar] [CrossRef]
  64. Regmi, M.B. A Review of Transport Policies in Support of Climate Actions in Asian Cities and Countries. Earth 2021, 2, 731–745. [Google Scholar] [CrossRef]
  65. Greenham, S.; Workman, R.; McPherson, K.; Ferranti, E.; Fisher, R.; Mills, S.; Street, R.; Dora, J.; Quinn, A.; Roberts, C. Are transport networks in low-income countries prepared for climate change? Barriers to preparing for climate change in Africa and South Asia. Mitig. Adapt. Strateg. Glob. Change 2023, 28, 8. [Google Scholar] [CrossRef]
  66. Moretti, L.; Loprencipe, G. Climate change and transport infrastructures: State of the art. Sustainability 2018, 10, 4098. [Google Scholar] [CrossRef]
  67. Doll, C.; Papanikolaou, A.; Maurer, H. The vulnerability of transport logistics to extreme weather events. Int. J. Shipp. Transp. Logist. 2014, 6, 293. [Google Scholar] [CrossRef]
  68. Nemry, F.; Demirel, H. Impacts of Climate Change on Transport: A Focus on Road and Rail Transport Infrastructures; EUR 25553 EN; Publications Office of the European Union: Luxembourg, 2012; ISBN 978-92-79-27037-6. [Google Scholar]
  69. Colin, M.; Palhol, F.; Leuxe, A. Adaptation of Transport Infrastructures and Networks to Climate Change. Transp. Res. Proc. 2016, 14, 86–95. [Google Scholar] [CrossRef]
  70. Mckinnon, A.; Kreie, A. Adaptive Logistics: Preparing Logistical Systems for Climate Change. In Proceedings of the Logistics Research Network Annual Conference, Harrogate, UK, 10 September 2010. [Google Scholar]
  71. Nikolaou, I.; Evangelinos, K.; Leal Filho, W. A system dynamic approach for exploring the effects of climate change risks on firms’ economic performance. J. Clean. Prod. 2015, 103, 499–506. [Google Scholar] [CrossRef]
  72. Ibrahim, B.; Rabelo, L.; Sarmiento, A.T.; Gutierrez-Franco, E. A Holistic Approach to Power Systems Using Innovative Machine Learning and System Dynamics. Energies 2023, 16, 5225. [Google Scholar] [CrossRef]
  73. Kermanshah, A.; Derrible, S.; Berkelhammer, M. Using Climate Models to Estimate Urban Vulnerability to Flash Floods. J. Appl. Meteorol. Climatol. 2017, 56, 2637–2650. [Google Scholar] [CrossRef]
  74. Diakakis, M.; Lekkas, E.; Stamos, I.; Mitsakis, E. Vulnerability of transport infrastructure to extreme weather events in small rural catchments. Eur. J. Transp. Infrastruct. Res. 2016, 16, 114–127. [Google Scholar] [CrossRef]
  75. Furrer, M.; Mostofi, H.; Spinler, S. A study on the impact of extreme weather events on the ceramic manufacturing in Egypt. Resour. Environ. Sustain. 2022, 7, 100049. [Google Scholar] [CrossRef]
  76. Sebestyén, V.; Czvetkó, T.; Abonyi, J. The Applicability of Big Data in Climate Change Research: The Importance of System of Systems Thinking. Front. Environ. Sci. 2021, 9, 619092. [Google Scholar] [CrossRef]
  77. Sajid, Z.W.; Ullah, F.; Qayyum, S.; Masood, R. Climate Change Mitigation through Modular Construction. Smart Cities 2024, 7, 566–596. [Google Scholar] [CrossRef]
  78. Ghadge, A.; Wurtmann, H.; Seuring, S. Managing climate change risks in global supply chains: A review and research agenda. Int. J. Prod. Res. 2019, 58, 44–64. [Google Scholar] [CrossRef]
  79. Browne, D.; Ryan, L. Comparative analysis of evaluation techniques for transport policies. Environ. Impact Assess. Rev. 2011, 31, 226–233. [Google Scholar] [CrossRef]
  80. Reddy, M.S.; Reddy, C.K.; Hanafiah, M.M. Climate Change Mitigation and Adaptation Strategies Enhanced by Intelligent Systems in Industry 6.0. In Maintaining a Sustainable World in the Nexus of Environmental Science and AI; Singh, B., Kaunert, C., Vig, K., Dutta, S., Eds.; IGI Global Scientific Publishing: Hershey, PA, USA, 2024; pp. 201–228. [Google Scholar] [CrossRef]
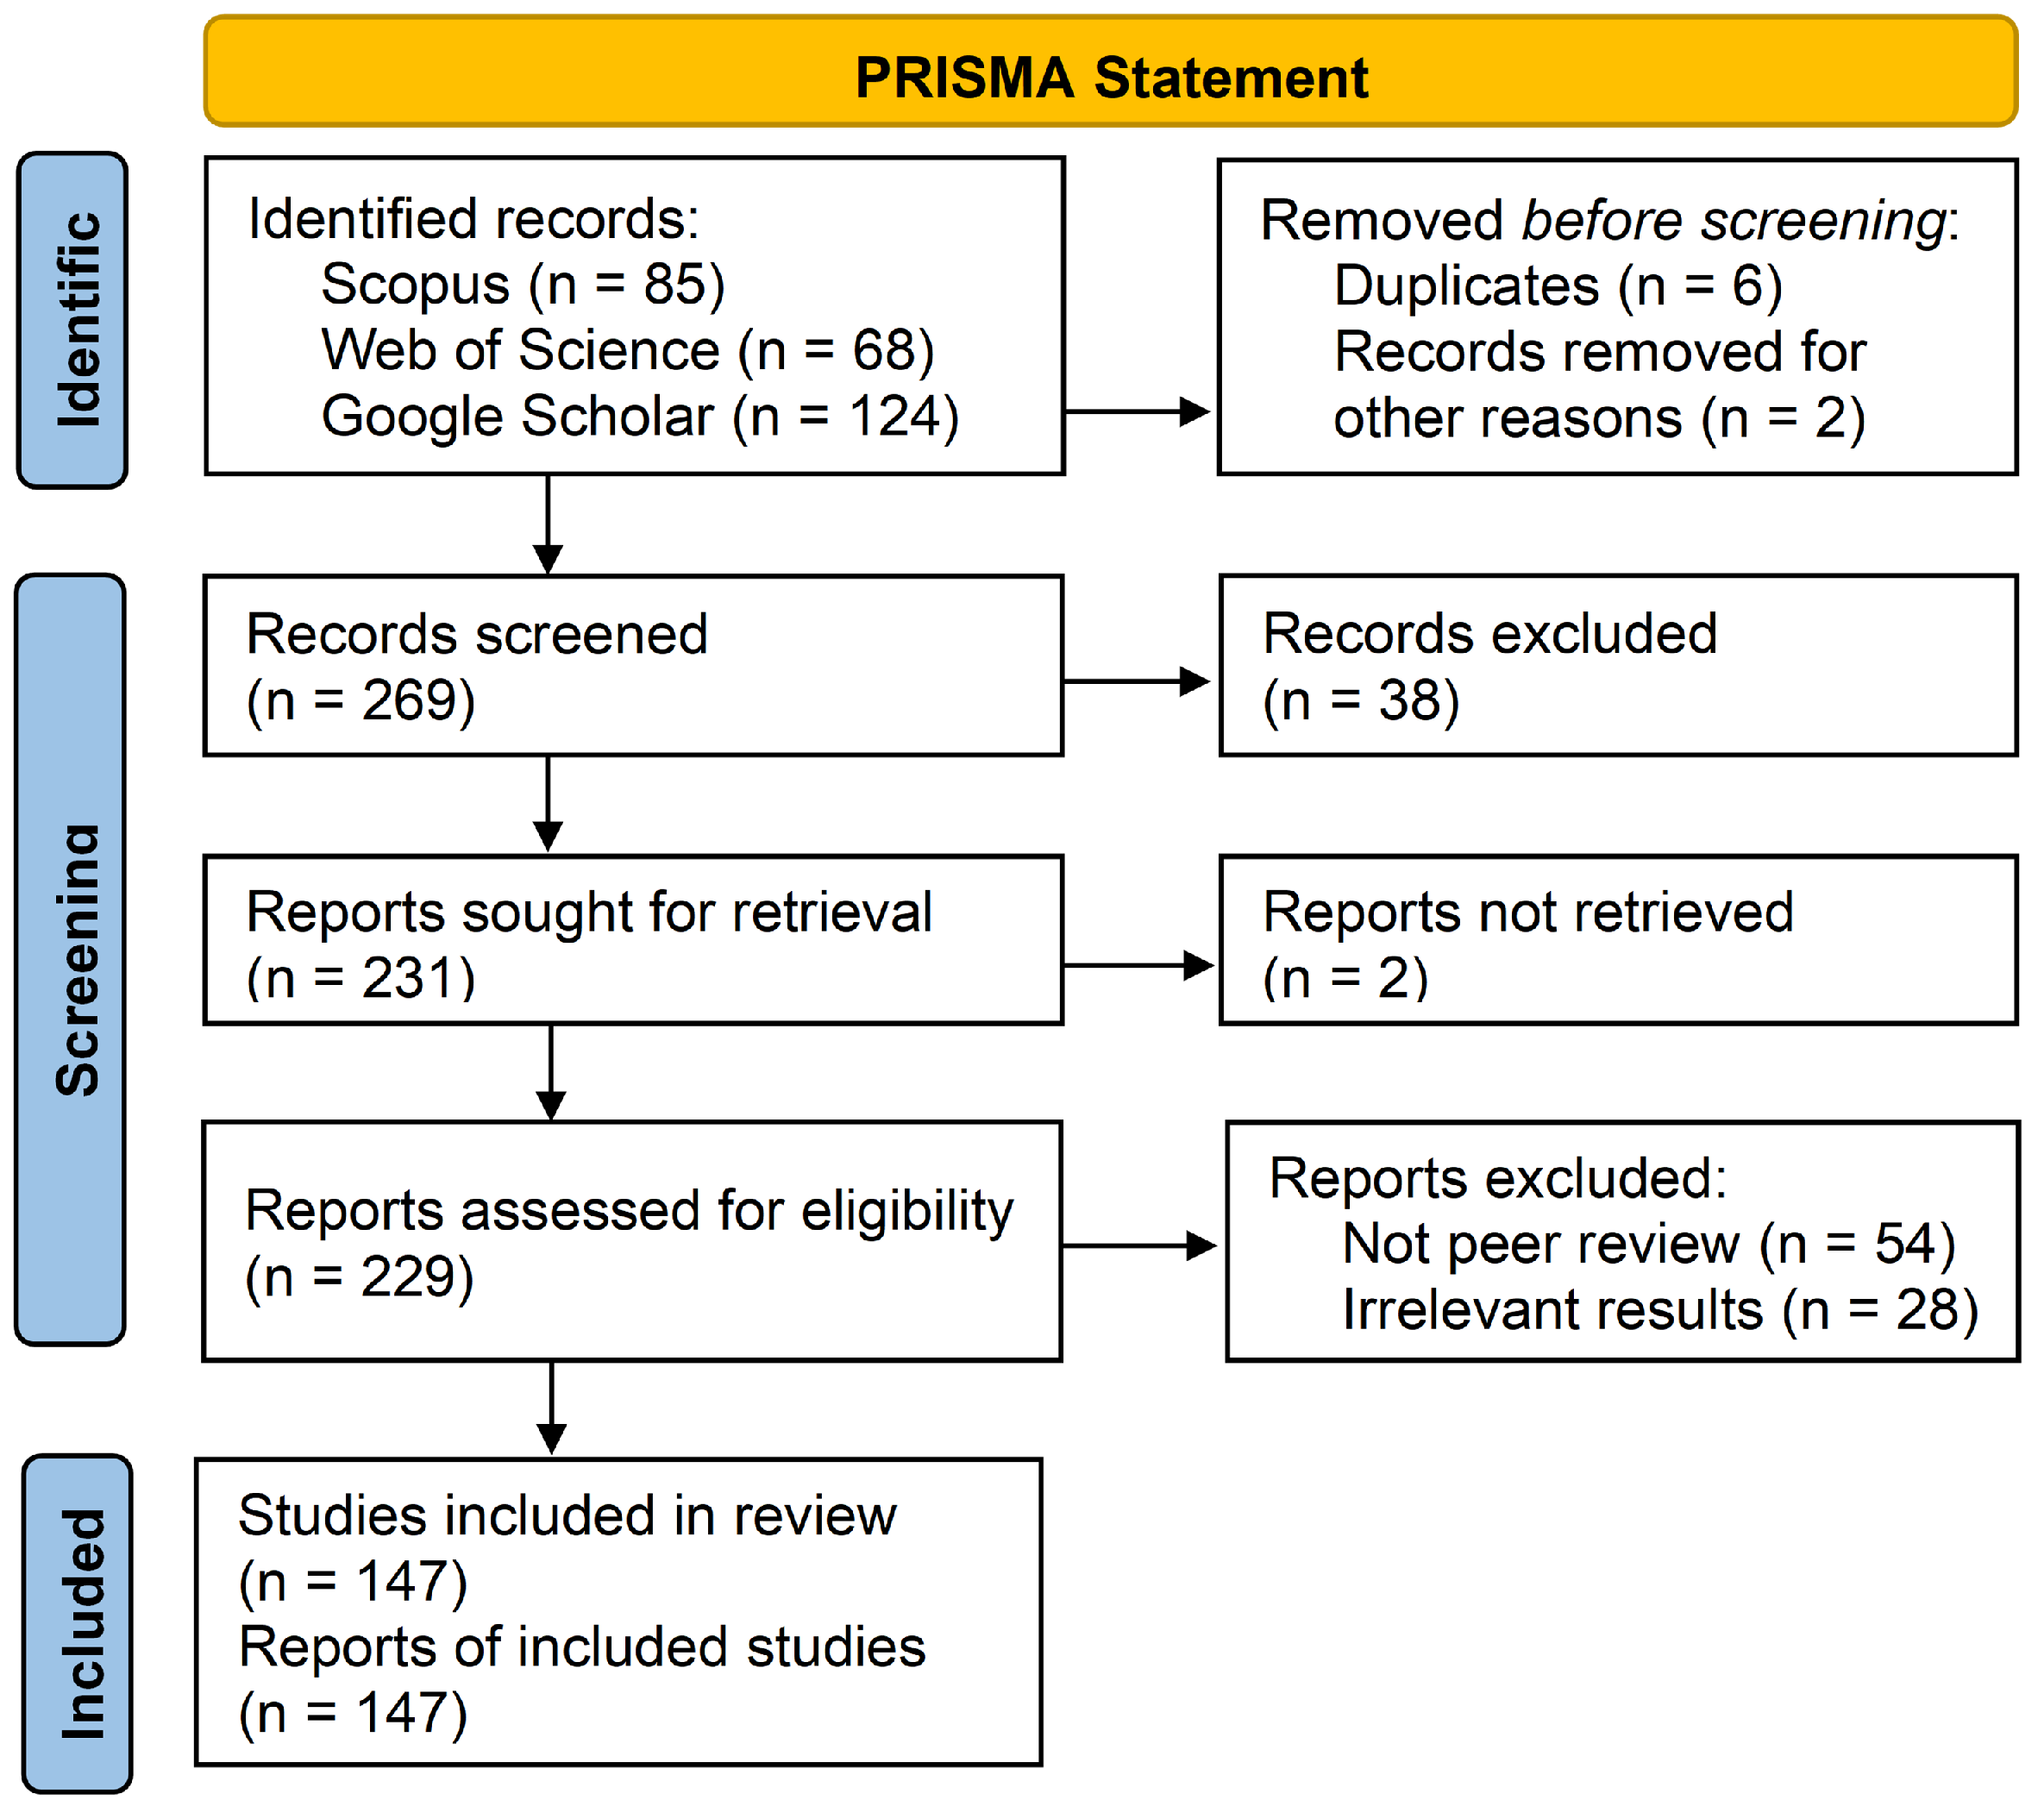
Figure 1. The PRISMA statement followed within the SLR of the current study.
Logistics 09 00032 g001
Figure 2. Network of interconnections between keywords.
Logistics 09 00032 g002
Figure 3. (a) Classification of publications based on their type and (b) temporal distribution of the selected articles’ publication year.
Logistics 09 00032 g003
Figure 4. (a) Division of studies according to jurisdiction levels and (b) division of studies by country under analysis.
Logistics 09 00032 g004
Figure 5. Division of studies by type and focus of analysis.
Logistics 09 00032 g005
Figure 6. Weather events assessed in the studies (* incl. sea level rise, humidity and sunlight hours).
Logistics 09 00032 g006
Figure 7. The methods utilized through the studies to identify/estimate the quantitative impacts of extreme weather events on transport and logistics.
Logistics 09 00032 g007
Figure 8. Impact of specific weather events on traffic variables, with diamonds indicating outliers.
Logistics 09 00032 g008
Figure 9. A comprehensive roadmap for achieving resilient urban transport and logistics systems through multi-stakeholder collaboration.
Logistics 09 00032 g009
Table 1. A summarization of the whole SLR methodology with the filters and the inclusion criteria.
CriterionDescription
DatabasesWeb of Science, Scopus and Google Scholar
TopicsWeb of Science-TS = (‘transport’ AND ‘logistics’ AND ‘rainfall’ AND ‘impact’) OR TS = (‘transport’ AND ‘logistics’ AND ‘climate’ AND ‘change AND ’impact’) OR TS = (‘transport’ AND ‘logistics’ AND ‘climate’ AND ‘change’ AND ‘policy’)
Scopus-TITLE-ABS-KEY = (‘transport’ AND ‘logistics’ AND ‘rainfall’ AND ’impact’) OR TITLE-ABS-KEY (‘transport’ AND ‘logistics’ AND ‘climate’ AND ‘change’ AND ‘impact’) OR TITLE-ABS-KEY (‘transport’ AND ‘logistics’ AND ‘climate’ AND ‘change’ AND ‘policy’)
Scholar Google-TITLE-ABS-KEY = (‘transport’ AND ‘logistics’ AND ‘rainfall’ AND ‘impact’) OR TITLE-ABS-KEY (‘transport’ AND ‘logistics’ AND ‘climate’ AND ‘change’ AND ‘impact’) OR TITLE-ABS-KEY (‘transport’ AND ‘logistics’ AND ‘climate’ AND ‘change’ AND ‘policy’)
Inclusion(I) Time of coverage: all years of the database (1945–2024), although a special focus has been given to the most current studies the last years (2000–2024); (II) Source Relevance.
Qualification(I) Does the study address the impacts of climate change on road infrastructure and/or the adaptation measures needed to minimize them? (II) Does the research present a well-founded literature review? (III) Does the study present technical innovation? (IV) Are contributions discussed? (V) Are limitations explicitly stated? and (VI) Are the results and conclusions consistent with the pre-established objectives?
Search Date2 January 2024
Table 2. Distribution of journal publications by key metrics.
Journal NameCount%PublisherIFResearch Category (WoS)
Transportation Research Record139.92%SAGE1.6Transportation Science and Technology | Engineering, Civil
Natural Hazards96.87%Springer3.3Water Resources
Sustainability96.87%MDPI3.3Green and Sustainable Science and Technology | Environmental Sciences
Transportation Research Part D: Transport and Environment64.58%Elsevier7.4Transportation Science and Technology
Journal of Transport Geography53.82%Elsevier5.7Transportation | Economics | Geography
Transportation Research Procedia43.05%ElsevierN/AN/A
Sustainable Cities and Society32.29%Elsevier10.5Green and Sustainable Science and Technology | Construction and Building Technology | Energy and Fuels
Table 3. The aggregated weather-related cost results on transport and logistics infrastructure and operations from the thematic analysis.
RegionCostDetails
EU (Transport)EUR 2.5 billion direct and EUR 1.0 billion indirect annuallyCosts include transport disruptions and repairs.
EU (Road)EUR 8–EUR 13 billion annually30–50% of road maintenance costs linked to EWE.
EU (Road)EUR 0.9 billion annuallyRoad maintenance costs in Europe.
EU (Road)EUR 10 billion annuallyCosts from weather-related road accidents.
EU (Road)EUR 50–EUR 192 million annuallyProjected increase in road transport costs.
EU (Road)EUR 0.29 per 1000 pkmThe average annual costs per passenger kilometer.
EU (Bridge)EUR 500 million annuallyProjected costs for bridge protection against flood.
EU (Delays)EUR 0.5–EUR 1 billion annually and EUR 13 per hourTime delays from EWE.
EU (Logistics)EUR 1–EUR 6 billion annuallyFreight disruptions with costs often to shippers.
EU (Flood)EUR 822 million annuallyEstimated flood damages.
EUEUR 7 billionProjected storm-related insured losses.
EUEUR 30 billionProjected storm-related insured losses.
Norway30% of maintenance budgetCosts related to avalanches and snowfalls.
GermanyEUR 0.67 billionDamages to transport systems from winter storms.
FinlandEUR EUR 412–EUR 6063 per km/yearCosts due road maintenance.
UKEUR 500 million annuallyProjected costs from extreme rainfall and floods.
UKEUR 36,000–EUR 58,000 per eventFlood events increasing travel costs.
ChinaEUR 2.9–EUR 20.5 billion annuallyDamage to roads and rail from flood and EWE.
JapanEUR 477 million annuallyEstimated costs due to heavy rains and supply chain disruptions.
USAEUR 33.5 billionProjected pavement material and maintenance costs due to temperature.
GlobalEUR 22 billion annuallyExpected damages from surface and riverine flood.
LIC *0.5–3.3% GDP annuallyCosts for new infrastructure.
* LIC: Low Income Countries.
Table 4. Consolidated actions by stakeholder with measure types characterized for each action.
Stakeholder *ActionType
City Authorities
and Government
Apply enhancing/correcting measures on the current infrastructureAdaptive
Construct protective infrastructure like walls and embankmentsCost-Bearing
Develop comprehensive emergency response and traffic diversion plansAdaptive
Implement economic instruments like carbon taxesTransformational
Develop new infrastructure design standards for climate resilienceTransformational
Implement GIS and advanced systems for real-time infrastructure monitoringAdaptive
Deploy early warning systems for weather threatsAdaptive
Employ big data analytics for strategic decision-makingAdaptive
Create new infrastructure design standardsTransformational
Prioritize and protect (e.g., elevate) critical infrastructure and flood-prone areasCost-Bearing
Enforce land use and zoning policies for climate resilienceTransformational
Establishment of dedicated departments and institutes dedicated to climate changeTransformational
CompaniesUse climate-resilient materials like enhanced concreteAdaptive
Prioritize investments in climate-proof technologiesCost-Bearing
Regularly maintain vehicles for optimal performanceLow-Regrets
Promote more resilient transport options like railTransformational
Re-allocate infrastructure to less vulnerable locationsTransformational
Research Institutions
& Universities
Conduct education and training programsWin–Win
Initiate pilot studies to evaluate strategies and technologiesLow-Regrets
* The action may be relevant for more than one stakeholder; they were categorized on the main.
Disclaimer/Publisher’s Note: The statements, opinions and data contained in all publications are solely those of the individual author(s) and contributor(s) and not of MDPI and/or the editor(s). MDPI and/or the editor(s) disclaim responsibility for any injury to people or property resulting from any ideas, methods, instructions or products referred to in the content.