
Factors Influencing the Formation of Chemical–Hemoglobin Adducts

 , and
, and
Abstract
: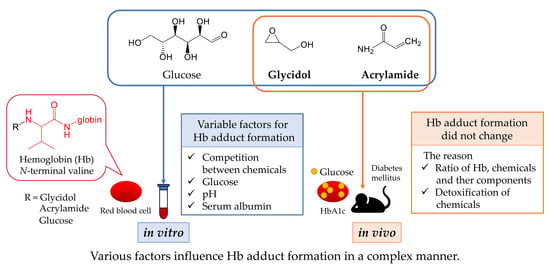
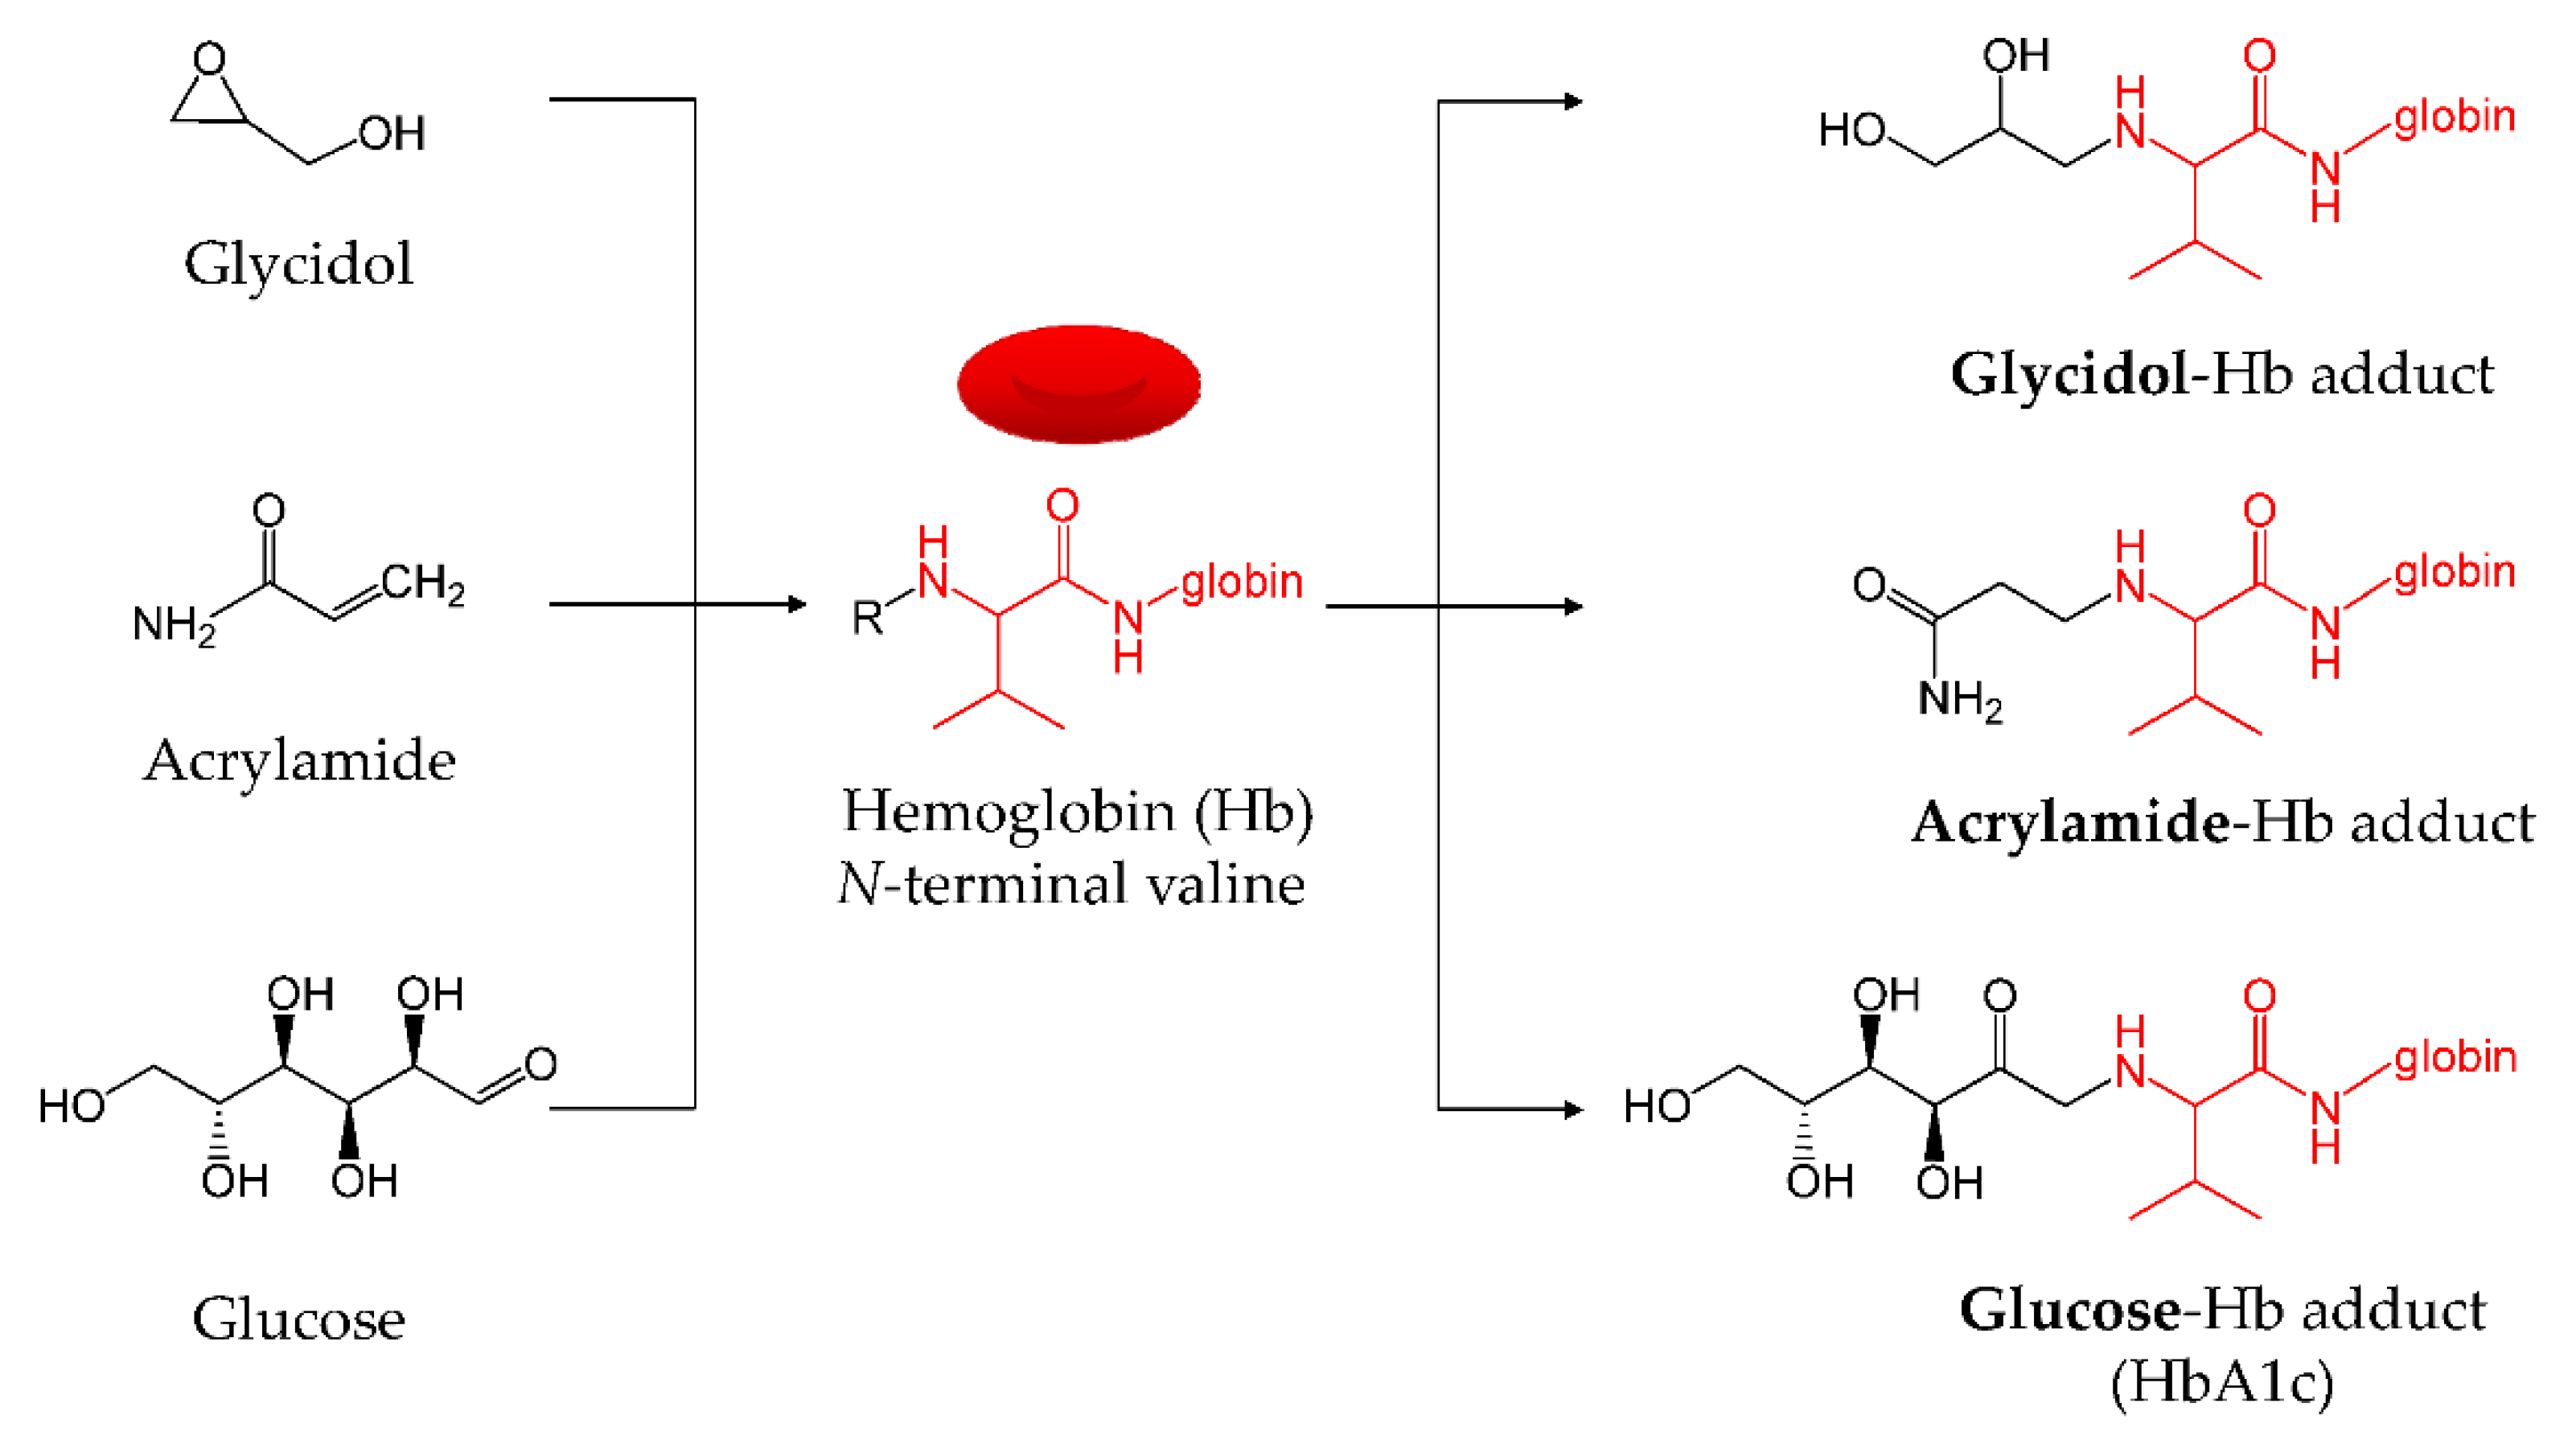
1. Introduction
2. Materials and Methods
2.1. Chemicals
2.2. Preparation for Glycidol–Hb Adduct Formation under Various Conditions (In Vitro)
2.2.1. Effect of Glycidol Concentration on Glycidol–Hb Adduct Formation
2.2.2. Effect of Reaction Time on Glycidol–Hb Adduct Formation
2.2.3. Effect of Glucose on Glycidol–Hb Adduct Formation
2.2.4. Effect of Glycated Hb on Glycidol–Hb Adduct Formation
2.2.5. Effect of pH on Glycidol–Hb Adduct Formation
2.2.6. Effect of Serum Albumin on Glycidol–Hb Adduct Production
2.3. Preparation for Hb Adduct Formation in Combined Exposure to Glycidol and Acrylamide
2.3.1. Effect of Acrylamide Concentration on Hb Adduct Formation following Combined Exposure (In Vitro)
2.3.2. Effect of Glycidol Concentration on Hb Adduct Formation following Combined Exposure (In Vitro)
2.3.3. Hb Adduct Formation in Mice Exposed to Glycidol and Acrylamide (In Vivo)
2.4. Hb Adduct Formation in Blood from Mice with Diabetes Mellitus (DM) Reacted with Glycidol and Acrylamide (Ex Vivo)
2.5. Pretreatment for Hb Adduct Measurement
2.6. Determination of Hb Adduct by LC-MS/MS
2.7. Interaction of Chemicals with Hemoglobin Using Thermal Shift Assay
2.7.1. Interaction between Hb and Glycidol or Acrylamide
2.7.2. Effect of Glucose on the Interaction of Hb with Glycidol or Acrylamide
2.7.3. Interaction with Hb during Combined Addition of Glycidol and Acrylamide
2.7.4. Protein Thermal Shift Assay
2.8. Statistical Analysis
3. Results
3.1. Effect of Glycidol Concentration and Reaction Time on Glycidol–Hb Adduct Formation (In Vitro)
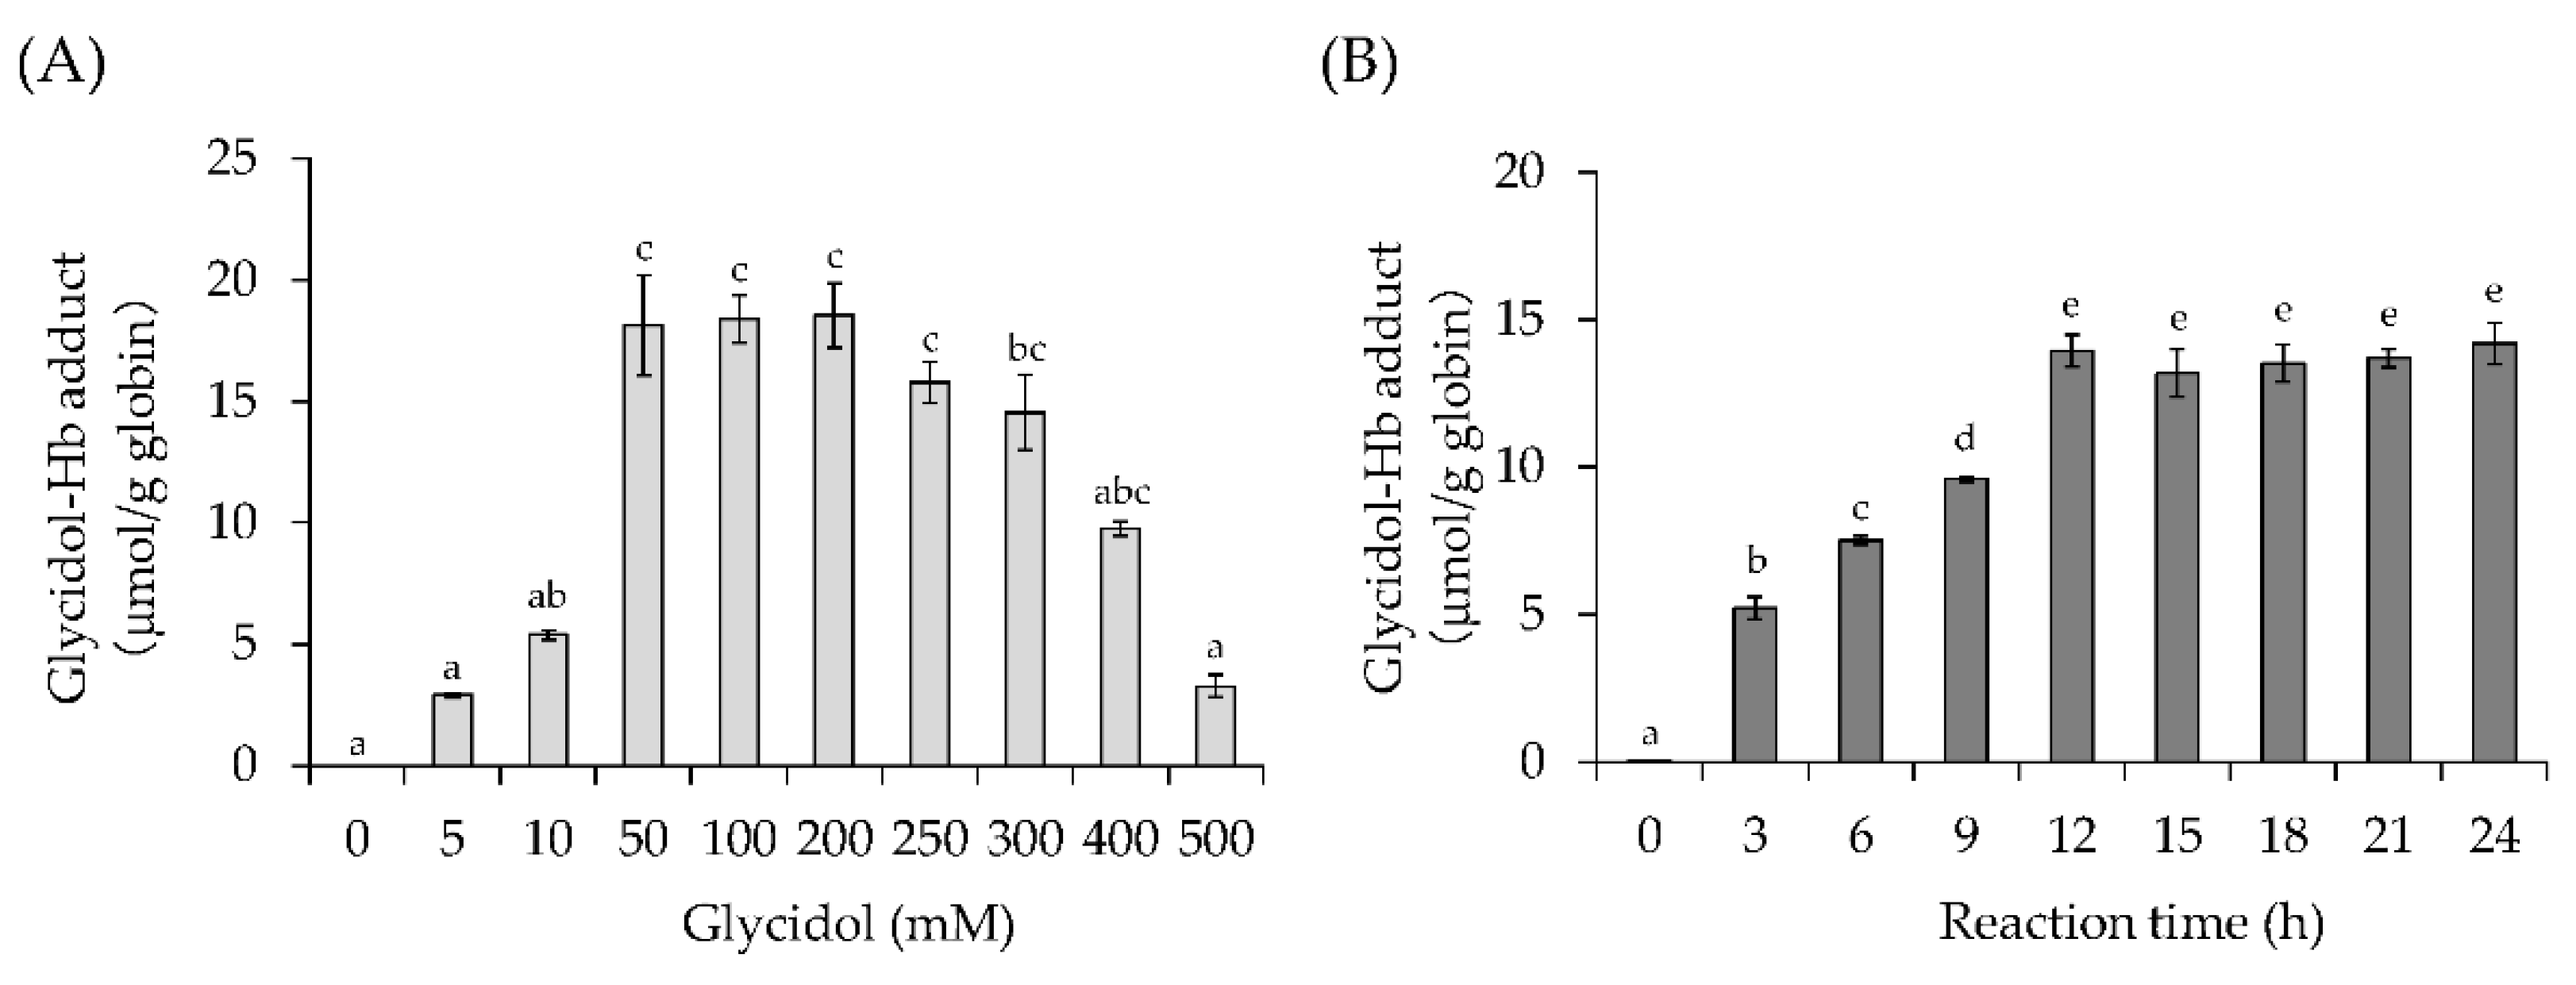
3.1.1. Effect of Glycidol Concentration on Glycidol–Hb Adduct Formation
3.1.2. Effect of Reaction Time on Glycidol–Hb Adduct Formation
3.2. Effect of Factors on Glycidol–Hb Adduct Formation (In Vitro)
3.2.1. Effect of Glucose on Glycidol–Hb Adduct Formation
3.2.2. Effect of Glycated Hb on Glycidol–Hb Adduct Formation
3.2.3. Effect of pH on Glycidol–Hb Adduct Formation
3.2.4. Effect of Serum Albumin on Glycidol–Hb Adduct Formation
3.3. Effect of Combined Exposure to Chemicals on Hb Adduct Formation (In Vitro)
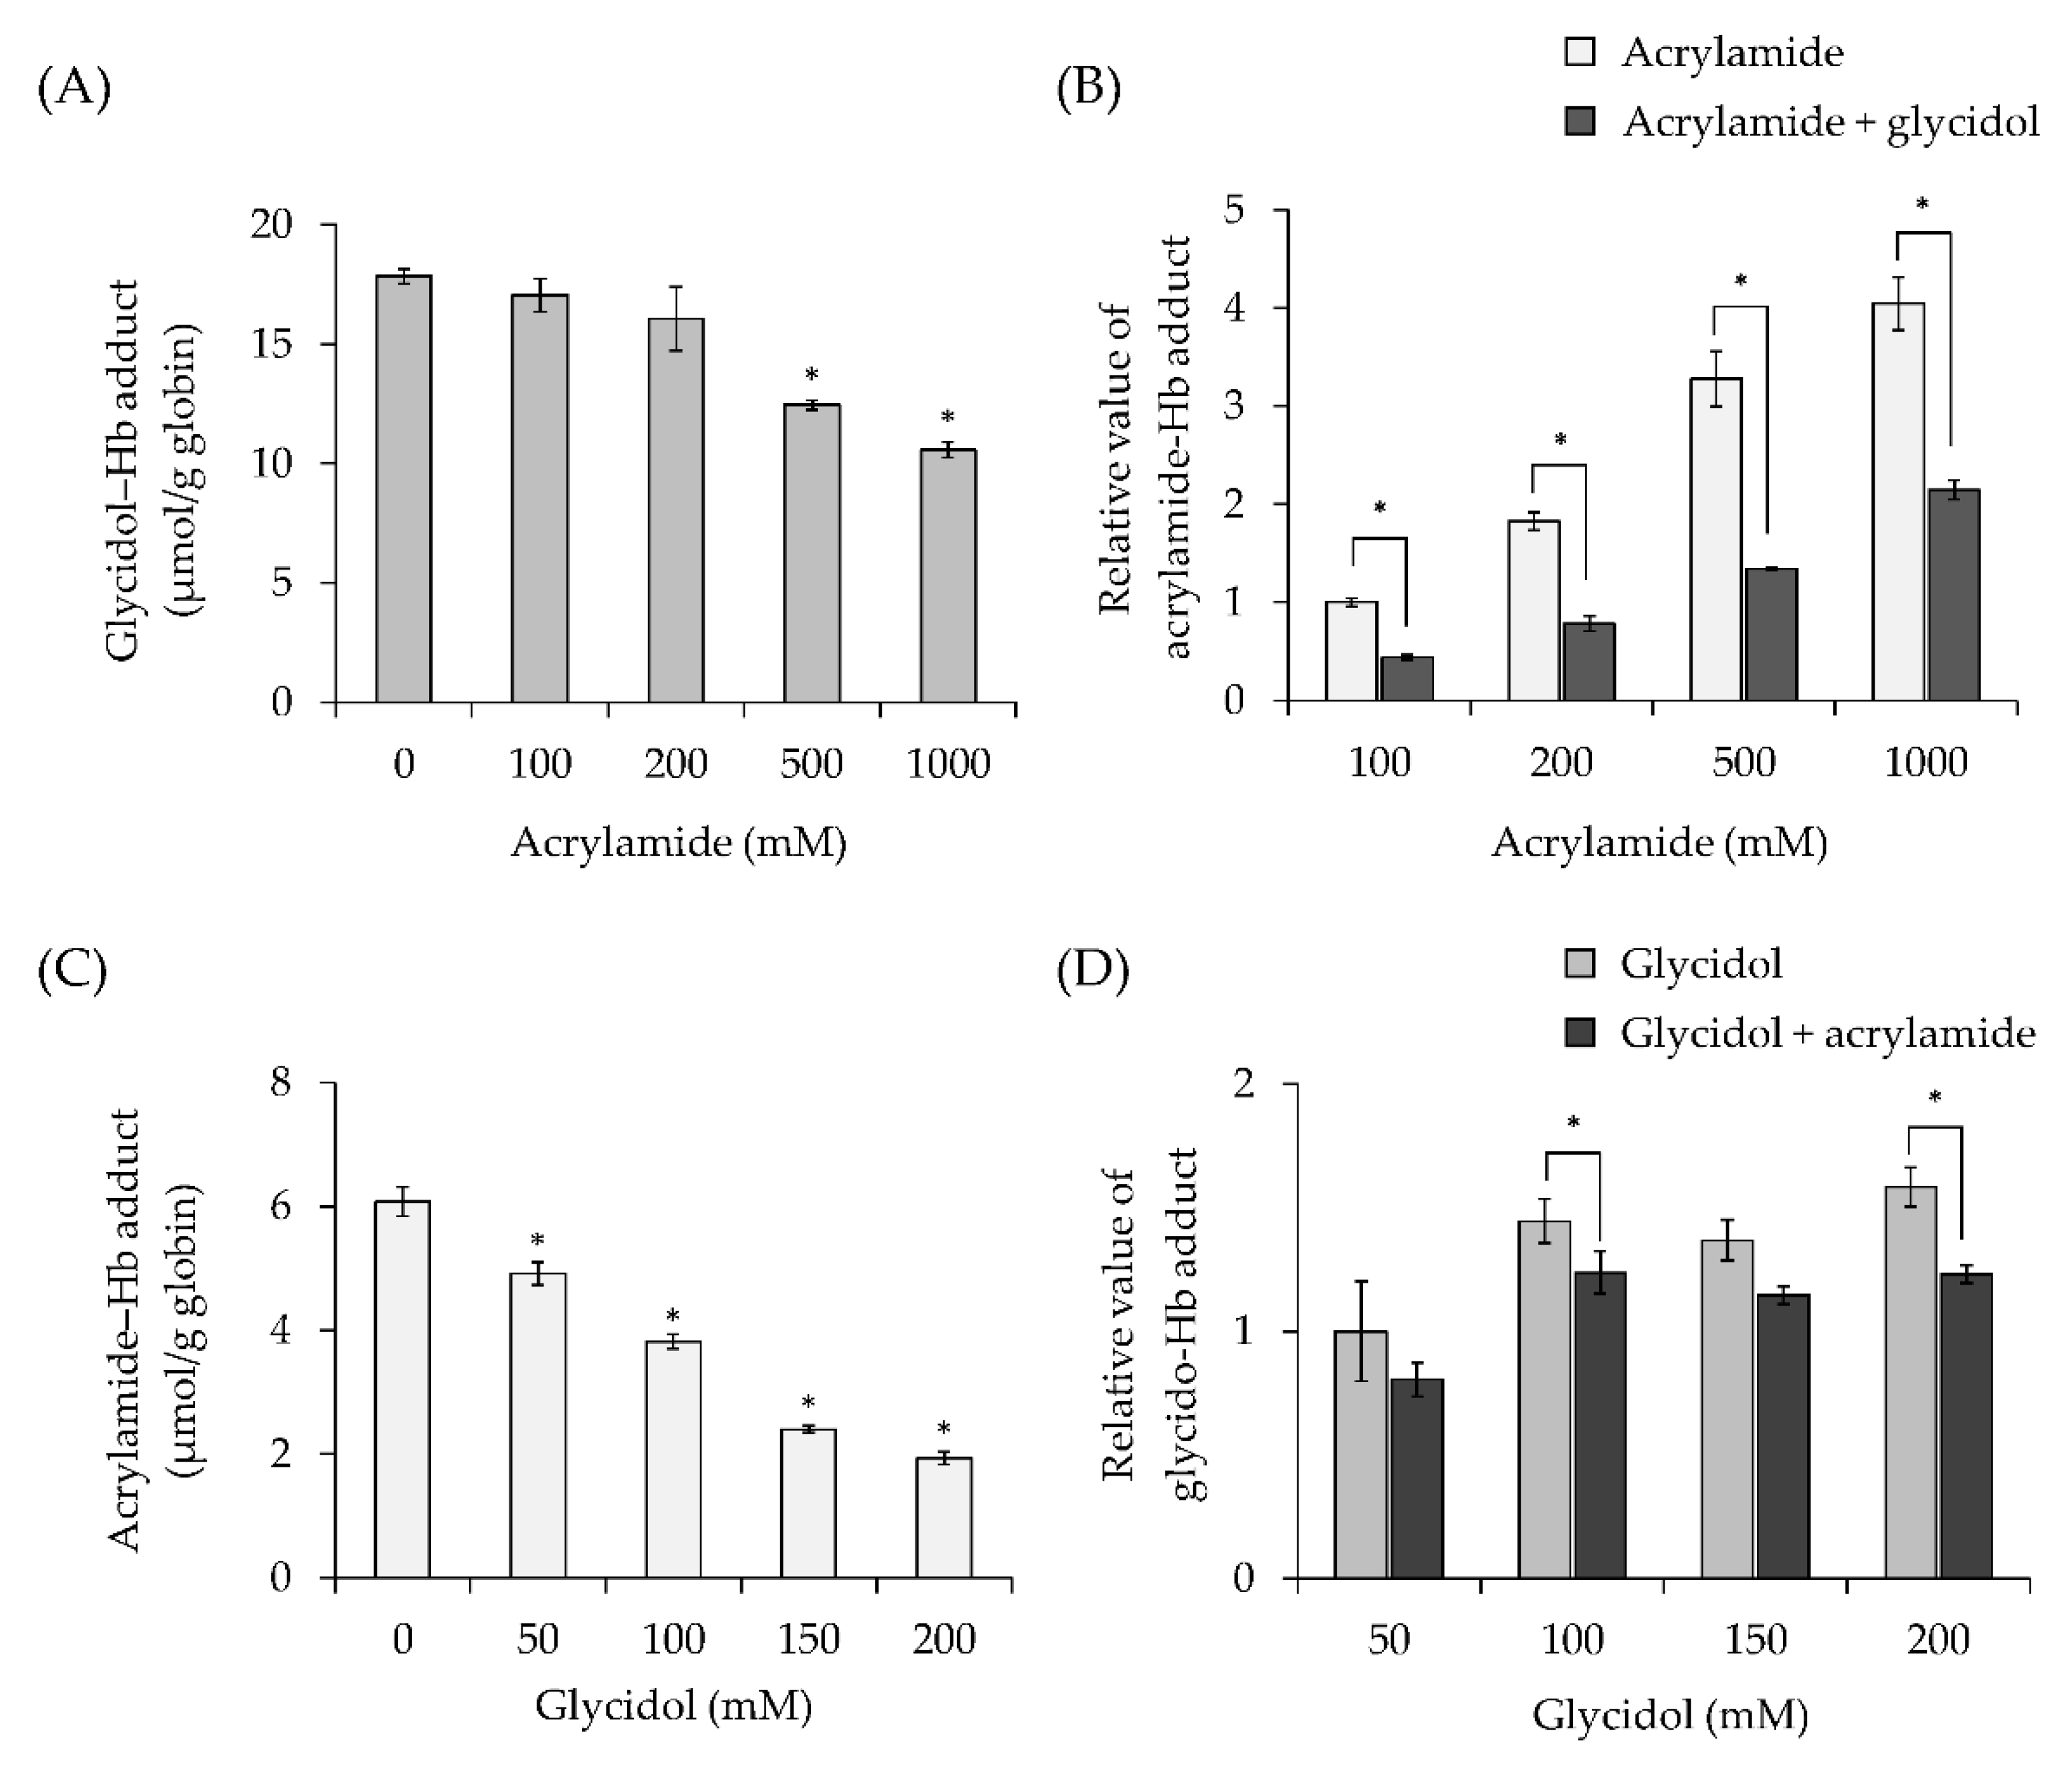
3.3.1. Effect of Acrylamide Concentration on Hb Adduct Formation in Combination with Exposure to Glycidol
3.3.2. Effect of Glycidol Concentration on Hb Adduct Formation in Combination with Exposure to Acrylamide
3.4. Hemoglobin Adduct Formation in Mice Exposed to Glycidol and Acrylamide (In Vivo)
3.5. Hb Adduct Formation during Exposure of Blood from Mice with Diabetes Mellitus to Glycidol or Acrylamide (Ex Vivo)
3.6. Interaction of Chemicals with Hemoglobin Assessed by Thermal Shift Assay
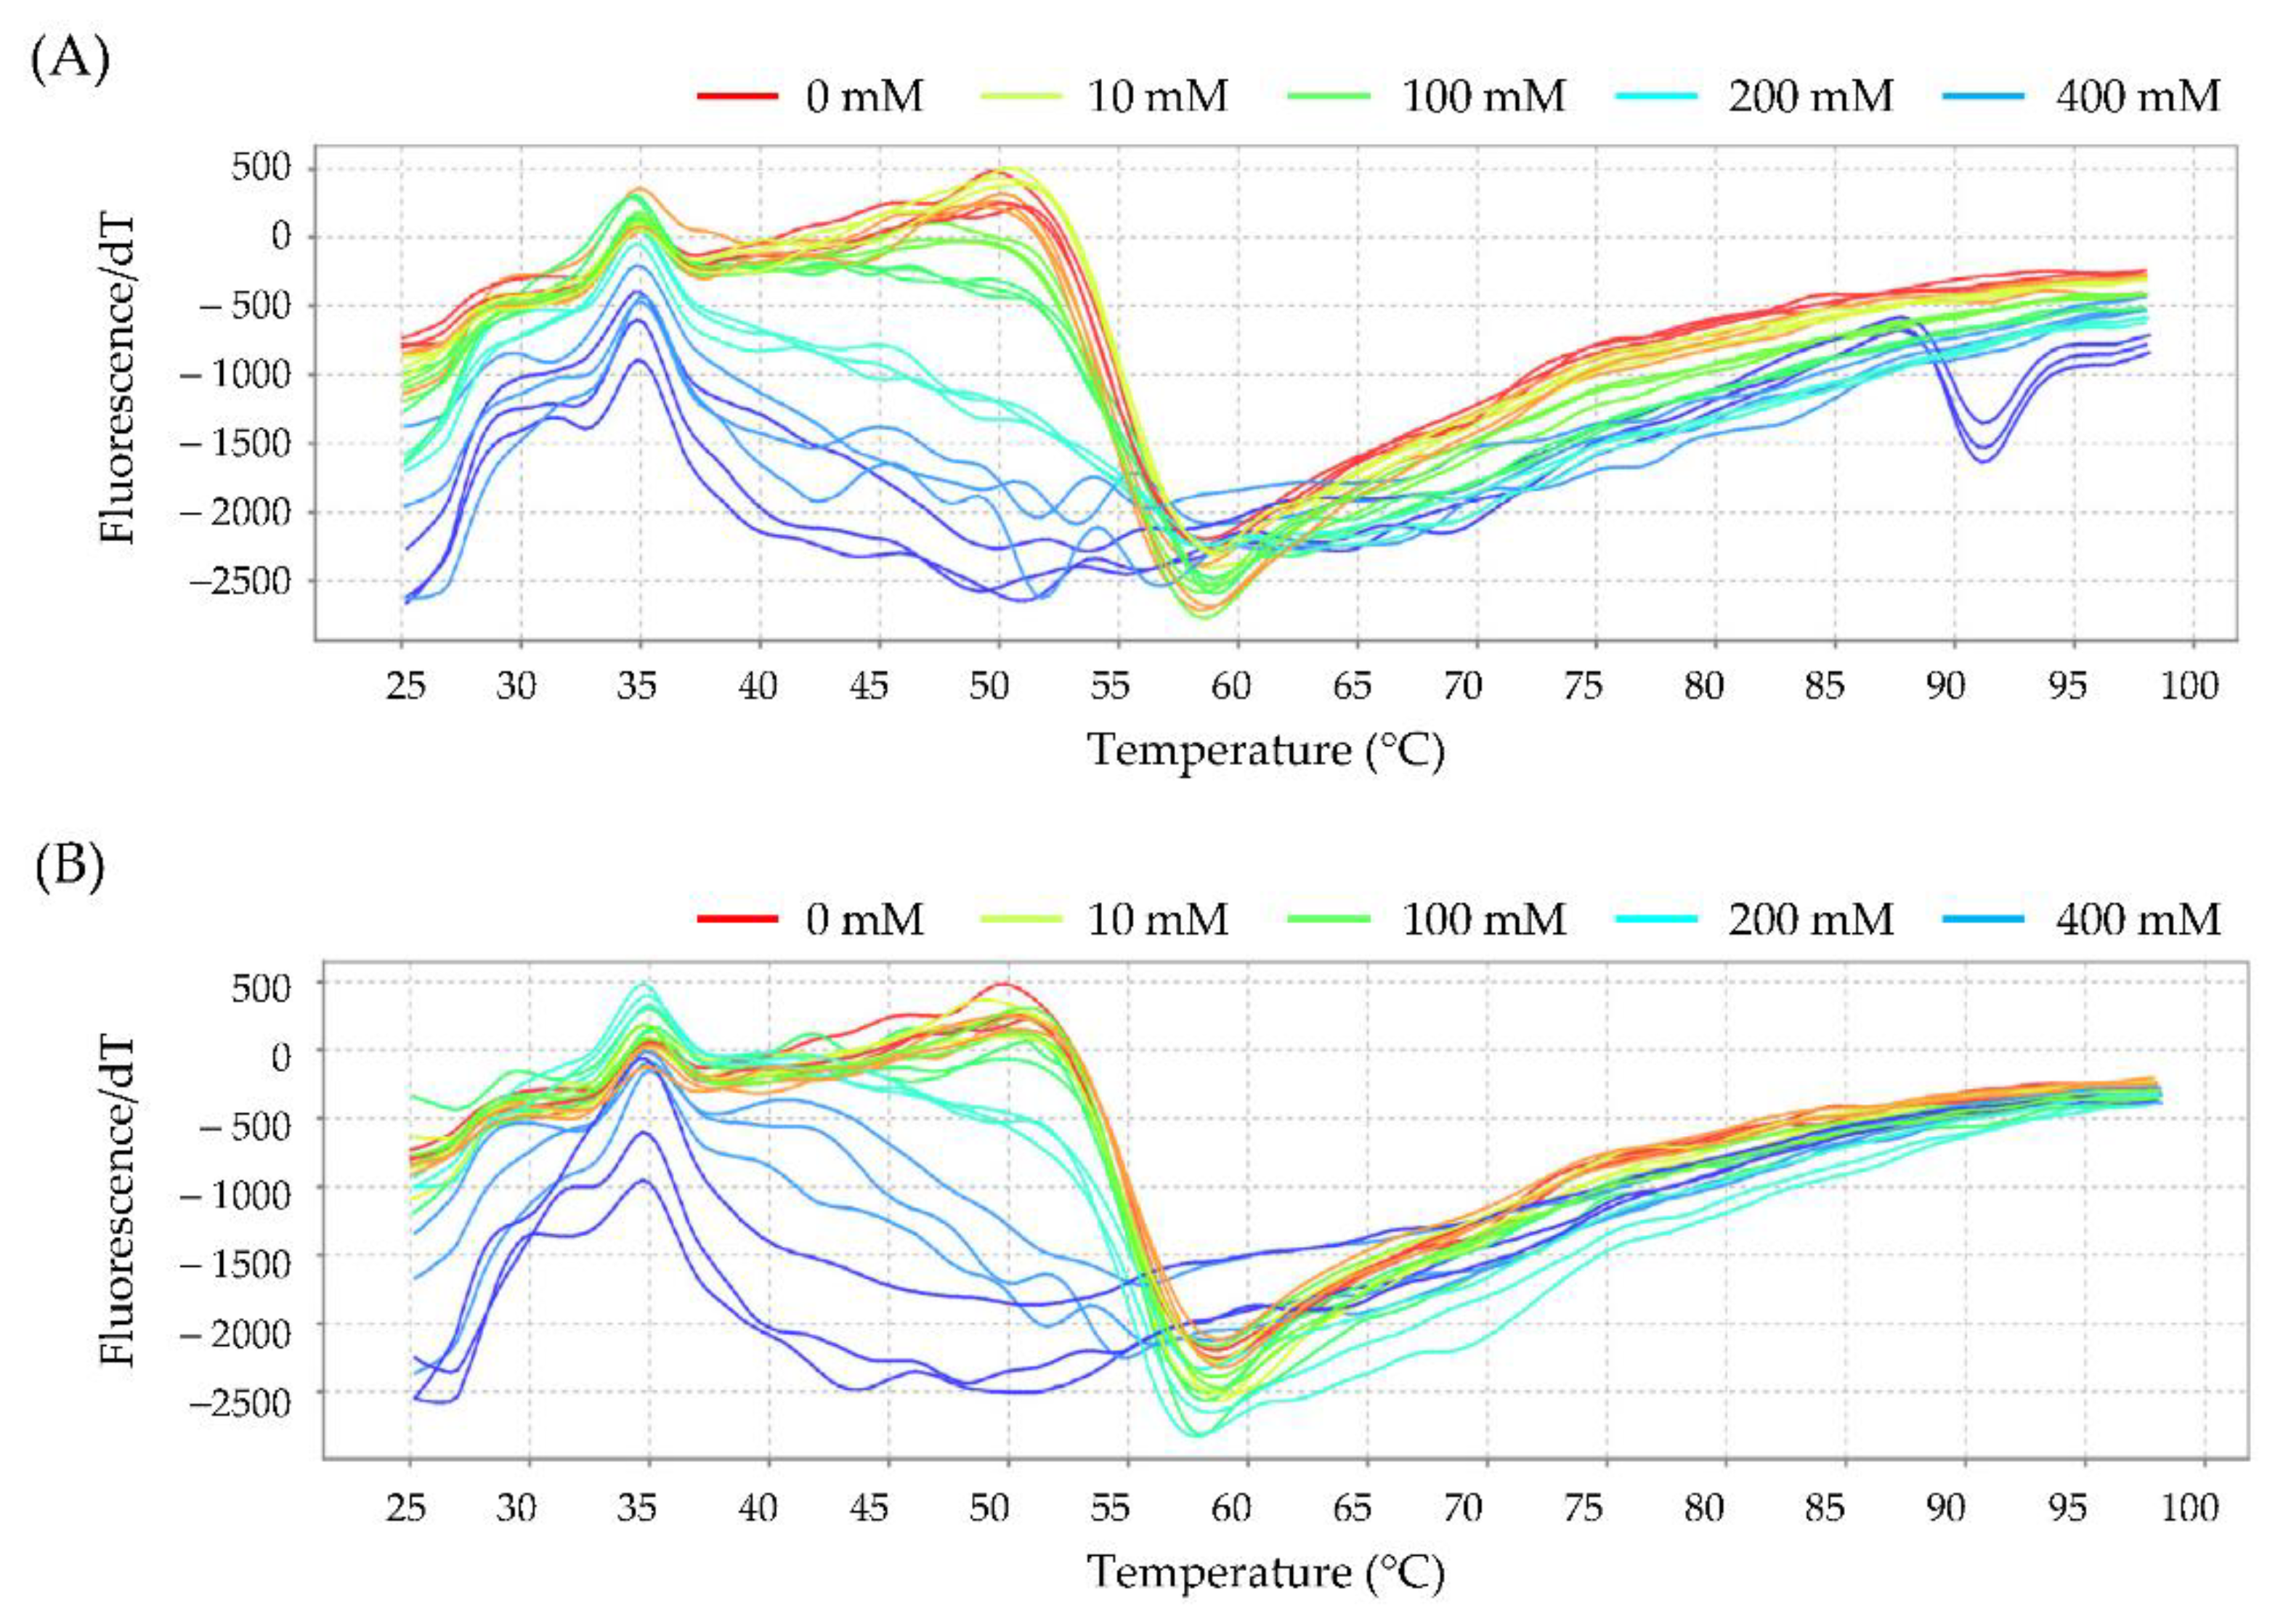
3.6.1. Interaction between Hb and Glycidol or Acrylamide
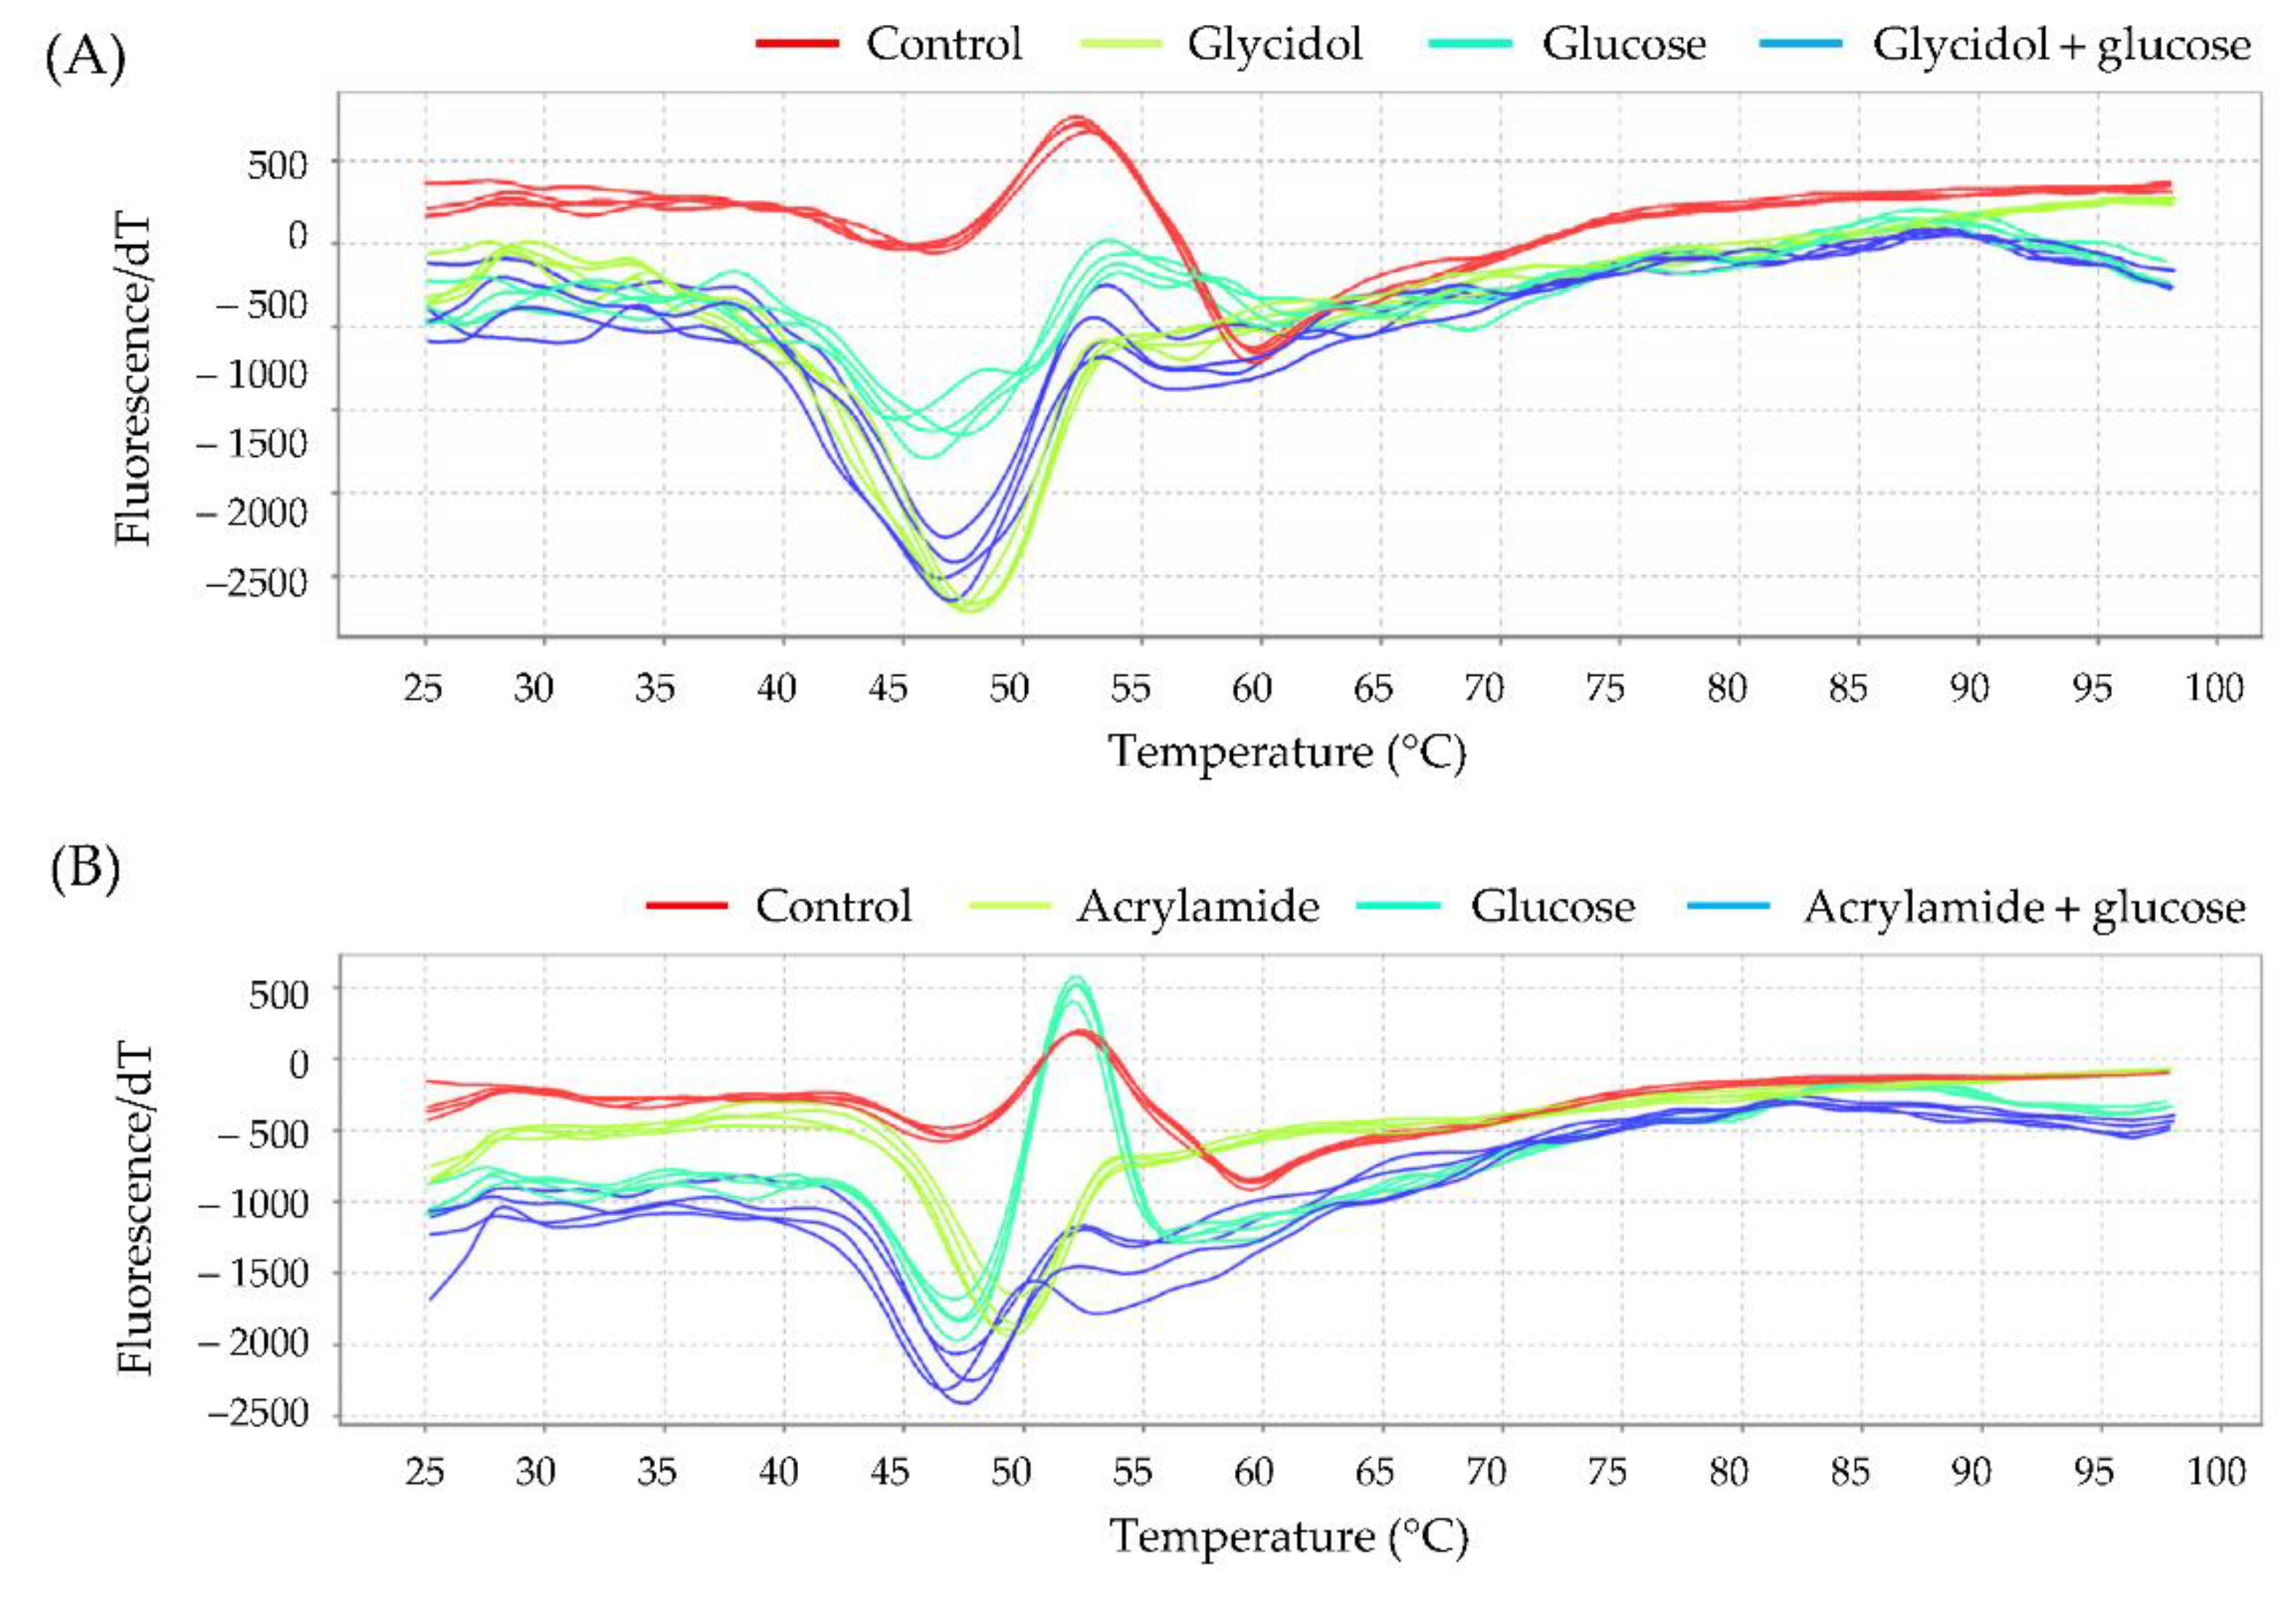
3.6.2. Effect of Glucose on the Interaction of Hb with Glycidol or Acrylamide
3.6.3. Interaction with Hb to the Combination of Glycidol and Acrylamide
4. Discussion
5. Conclusions
Author Contributions
Funding
Institutional Review Board Statement
Informed Consent Statement
Data Availability Statement
Acknowledgments
Conflicts of Interest
References
- Appel, K.E.; Abraham, K.; Berger-Preiss, E.; Hansen, T.; Apel, E.; Schuchardt, S.; Vogt, C.; Bakhiya, N.; Creutzenberg, O.; Lampen, A. Relative oral bioavailability of glycidol from glycidyl fatty acidesters in rats. Arch. Toxicol. 2013, 87, 1649–1659. [Google Scholar] [CrossRef] [PubMed]
- Ikeda, N.; Fujii, K.; Sarada, M.; Saito, H.; Kawabata, M.; Naruse, K.; Yuki, K.; Nakagiri, H.; Honda, H.; Tamaki, Y.; et al. Genotoxicity studies of glycidol fatty acid ester (glycidol linoleate) and glycidol. Food Chem. Toxicol. 2012, 50, 3927–3933. [Google Scholar] [CrossRef]
- Rietjens, I.M.; Dussort, P.; Günther, H.; Hanlon, P.; Honda, H.; Mally, A.; O’Hagan, S.; Scholz, G.; Seidel, A.; Swenberg, J.; et al. Exposure assessment of process-related contaminants in food by biomarker monitoring. Arch. Toxicol. 2018, 92, 15–40. [Google Scholar] [CrossRef] [Green Version]
- San George, R.C.; Hoberman, H.D. Reaction of acetaldehyde with hemoglobin. J. Biol. Chem. 1986, 261, 6811–6821. [Google Scholar] [CrossRef] [PubMed]
- Landin, H.H.; Osterman-Golkar, S.; Zorcec, V.; Törnqvist, M. Biomonitoring of epichlorohydrin by hemoglobin adducts. Anal. Biochem. 1996, 240, 1–6. [Google Scholar] [CrossRef]
- Honda, H.; Onishi, M.; Fujii, K.; Ikeda, N.; Yamaguchi, T.; Fujimori, T.; Nishiyama, N.; Kasamatsu, T. Measurement of glycidol hemoglobin adducts in humans who ingest edible oil containing small amounts of glycidol fatty acid esters. Food Chem. Toxicol. 2011, 49, 2536–2540. [Google Scholar] [CrossRef]
- Honda, H.; Fujii, K.; Yamaguchi, T.; Ikeda, N.; Nishiyama, N.; Kasamatsu, T. Glycidol exposure evaluation of humans who have ingested diacylglycerol oil containing glycidol fatty acid esters using hemoglobin adducts. Food Chem. Toxicol. 2012, 50, 4163–4168. [Google Scholar] [CrossRef]
- Honda, H.; Törnqvist, M.; Nishiyama, N.; Kasamatsu, T. Characterization of glycidol–hemoglobin adducts as biomarkers of exposure and in vivo dose. Toxicol. Appl. Pharmacol. 2014, 275, 213–220. [Google Scholar] [CrossRef]
- Bergmark, E. Hemoglobin adducts of acrylamide and acrylonitrile in laboratory workers, smokers and nonsmokers. Chem. Res. Toxicol. 1997, 10, 78–84. [Google Scholar] [CrossRef]
- Bjellaas, T.; Olesen, P.T.; Frandsen, H.; Haugen, M.; Stølen, L.H.; Paulsen, J.E.; Alexander, J.; Lundanes, E.; Becher, G. Comparison of estimated dietary intake of acrylamide with hemoglobin adducts of acrylamide and glycidamide. Toxicol. Sci. 2007, 98, 110–117. [Google Scholar] [CrossRef]
- Hagmar, L.; Wirfält, E.; Paulsson, B.; Törnqvist, M. Differences in hemoglobin adduct levels of acrylamide in the general population with respect to dietary intake, smoking habits and gender. Mutat. Res. 2005, 580, 157–165. [Google Scholar] [CrossRef] [Green Version]
- Scherer, G.; Engl, J.; Urban, M.; Gilch, G.; Janket, D.; Riedel, K. Relationship between machine-derived smoke yields and biomarkers in cigarette smokers in Germany. Regul. Toxicol. Pharmacol. 2007, 47, 171–183. [Google Scholar] [CrossRef]
- Schettgen, T.; Rossbach, B.; Kütting, B.; Letzel, S.; Drexler, H.; Angerer, J. Determination of haemoglobin adducts of acrylamide and glycidamide in smoking and non-smoking persons of the general population. Int. J. Hyg. Environ. Health 2004, 207, 531–539. [Google Scholar] [CrossRef]
- Von Stedingk, H.; Rydberg, P.; Törnqvist, M. A new modified Edman procedure for analysis of N-terminal valine adducts in hemoglobin by LC–MS/MS. J. Chromatogr. B Analyt. Technol. Biomed. Life Sci. 2010, 878, 2483–2490. [Google Scholar] [CrossRef]
- Rydberg, P.; von Stedingk, H.; Magnér, J.; Björklund, J. LC/MS/MS analysis of N-terminal protein adducts with improved sensitivity: A comparison of selected edman isothiocyanate reagents. Int. J. Anal. Chem. 2009, 2009, 153472. [Google Scholar] [CrossRef] [Green Version]
- Rydberg, P. Method for Analyzing N-Terminal Protein Adducts using Isothiocyanate Reagents. U.S. Patent WO/2005/101020, 13 April 2005. [Google Scholar]
- John, G.; English, E. IFCC standardised HbA1c: Should the world be as one? Clin. Chem. Lab. Med. 2012, 50, 1243–1248. [Google Scholar] [CrossRef]
- Kashiwagi, A.; Kasuga, M.; Araki, E.; Oka, Y.; Hanafusa, T.; Ito, H.; Tominaga, M.; Oikawa, S.; Noda, M.; Kawamura, T.; et al. Committee on the standardization of diabetes mellitus–related laboratory testing of Japan diabetes society. International clinical harmonization of glycated hemoglobin in Japan: From Japan diabetes society to national glycohemoglobin standardization program values. J. Diabetes Investig. 2012, 3, 39–40. [Google Scholar] [CrossRef] [PubMed]
- Kitabchi, A.E.; Wall, B.M. Diabetic ketoacidosis. Med. Clin. N. Am. 1995, 79, 9–37. [Google Scholar] [CrossRef]
- Shimamura, Y.; Inagaki, R.; Honda, H.; Masuda, S. Does external exposure of glycidol–related chemicals influence the forming of the hemoglobin adduct, N-(2, 3-dihydroxypropyl) valine, as a biomarker of internal exposure to glycidol? Toxics 2020, 8, 119. [Google Scholar] [CrossRef] [PubMed]
- Aasa, J.; Abramsson-Zetterberg, L.; Carlsson, H.; Törnqvist, M. The genotoxic potency of glycidol established from micronucleus frequency and hemoglobin adduct levels in mice. Food Chem. Toxicol. 2017, 100, 168–174. [Google Scholar] [CrossRef]
- Kerner, W.; Brückel, J. Definition, classification and diagnosis of diabetes mellitus. Exp. Clin. Endocrinol. Diabetes 2014, 122, 384–386. [Google Scholar] [CrossRef] [Green Version]
- Murunga, A.N.; Miruka, D.O.; Driver, C.; Nkomo, F.S.; Cobongela, S.Z.; Owira, P.M. Grapefruit derived flavonoid naringin improves ketoacidosis and lipid peroxidation in type 1 diabetes rat model. PLoS ONE 2016, 11, e0153241. [Google Scholar] [CrossRef]
- Li, H.; Grigoryan, H.; Funk, W.E.; Lu, S.S.; Rose, S.; Williams, E.R.; Rappaport, S.M. Profiling Cys34 adducts of human serum albumin by fixed-step selected reaction monitoring. Mol. Cell. Proteomics 2011, 10, M110.004606. [Google Scholar] [CrossRef] [PubMed] [Green Version]
- Scholl, P.F.; Turner, P.C.; Sutcliffe, A.E.; Sylla, A.; Diallo, M.S.; Friesen, M.D.; Groopman, J.D.; Wild, C.P. Quantitative comparison of aflatoxin B1 serum albumin adducts in humans by isotope dilution mass spectrometry and ELISA. Cancer Epidemiol. Biomarkers Prev. 2006, 15, 823–826. [Google Scholar] [CrossRef] [Green Version]
- Aasa, J.; Vryonidis, E.; Abramsson-Zetterberg, L.; Törnqvist, M. Internal doses of glycidol in children and estimation of associated cancer risk. Toxics 2019, 7, 7. [Google Scholar] [CrossRef] [Green Version]
- Timmermann, C.A.G.; Mølck, S.S.; Kadawathagedara, M.; Bjerregaard, A.A.; Törnqvist, M.; Brantsaeter, A.L.; Pedersen, M. A review of dietary intake of acrylamide in humans. Toxics 2021, 9, 155. [Google Scholar] [CrossRef] [PubMed]
- Aasa, J.; Granath, F.; Törnqvist, M. Cancer risk estimation of glycidol based on rodent carcinogenicity studies, a multiplicative risk model and in vivo dosimetry. Food Chem. Toxicol. 2019, 128, 54–60. [Google Scholar] [CrossRef] [PubMed]
- Paulsson, B.; Grawé, J.; Törnqvist, M. Hemoglobin adducts and micronucleus frequencies in mouse andrat after acrylamide or N-methylolacrylamide treatment. Mutat. Res. 2002, 516, 101–111. [Google Scholar] [CrossRef]
- Kasper, S.M.; Meinert, P.; Kampe, S.; Görg, C.; Geisen, C.; Mehlhorn, U.; Diefenbach, C. Large-dose hydroxyethyl starch 130/0.4 does not increase blood loss and transfusion requirements in coronary artery bypass surgery compared with hydroxyethyl starch 200/0.5 at recommended doses. Anesthesiology 2003, 99, 42–47. [Google Scholar] [CrossRef] [PubMed] [Green Version]
- Carlsson, H.; Aasa, J.; Kotova, N.; Vare, D.; Sousa, P.F.; Rydberg, P.; Abramsson-Zetterberg, L.; Törnqvist, M. Adductomic screening of hemoglobin adducts and monitoring of micronuclei in school-age children. Chem. Res. Toxicol. 2017, 30, 1157–1167. [Google Scholar] [CrossRef]
- Patel, J.M.; Wood, J.C.; Leibman, K.C. The biotransformation of allyl alcohol and acrolein in rat liver and lung preparations. Drug Metab. Dispos. 1980, 8, 305–308. [Google Scholar] [PubMed]
- Ghanayem, B.I.; McDaniel, L.P.; Churchwell, M.I.; Twaddle, N.C.; Snyder, R.; Fennell, T.R.; Doerge, D.R. Role of CYP2E1 in the epoxidation of acrylamide to glycidamide and formation of DNA and hemoglobin adducts. Toxicol. Sci. 2005, 88, 311–318. [Google Scholar] [CrossRef] [PubMed] [Green Version]


| Hb Adduct | Polarity [ESI] | Retention Time (min) | Precursor Ion (m/z) | Product Ion (m/z) | Regression Equation (r2) | LOD (pmol/g globin) | LOQ (pmol/g globin) | Recovery Rate (%) |
|---|---|---|---|---|---|---|---|---|
| G-Val-FTH *1 | [M + H]+ | 9.45 | 563 | 390 | y = 323,411x + 6187.2 (0.9998) | 67.1 | 201.2 | 87 |
| AA-Val-FTH *2 | [M + H]+ | 9.70 | 560 | 390 | y = 739,049x + 29,196 (0.9994) | 57.7 | 173.1 | 92 |
| Tm (°C) | |||||
|---|---|---|---|---|---|
| 0 mM | 10 mM | 100 mM | 200 mM | 400 mM | |
| Control | 60.03 ± 0.24 | − | − | − | − |
| Glycidol | 60.50 ± 0.08 | 59.19 ± 0.19 * | 57.53 ± 0.09 * | 56.36 ± 0.10 * | |
| Acrylamide | 59.91 ± 0.17 | 59.48 ± 0.22 * | 58.73 ± 0.07 * | 56.49 ± 0.05 * | |
| Tm (°C) | ||
|---|---|---|
| Without Glucose | With Glucose | |
| Control | 59.50 ± 0.11 a | 57.70 ± 0.33 b |
| Glycidol | 53.73 ± 0.22 c | 54.70 ± 0.09 d |
| Acrylamide | 53.18 ± 0.10 c | 54.85 ± 0.28 d |
| Tm (°C) | |||
|---|---|---|---|
| 0 mM | 100 mM | 200 mM | |
| Control | 59.96 ± 0.10 | − | − |
| Glycidol | 59.68 ± 0.20 | 58.67 ± 0.20 | |
| Acrylamide | 60.09 ± 0.37 | 59.42 ± 0.39 | |
| Glycidol + acrylamide | 59.96 ± 0.29 | 56.58 ± 0.08 * | |
Publisher’s Note: MDPI stays neutral with regard to jurisdictional claims in published maps and institutional affiliations. |
© 2021 by the authors. Licensee MDPI, Basel, Switzerland. This article is an open access article distributed under the terms and conditions of the Creative Commons Attribution (CC BY) license (https://creativecommons.org/licenses/by/4.0/).
Share and Cite
Shimamura, Y.; Okuda, A.; Ichikawa, K.; Inagaki, R.; Ito, S.; Honda, H.; Masuda, S. Factors Influencing the Formation of Chemical–Hemoglobin Adducts. Toxics 2022, 10, 2. https://doi.org/10.3390/toxics10010002
Shimamura Y, Okuda A, Ichikawa K, Inagaki R, Ito S, Honda H, Masuda S. Factors Influencing the Formation of Chemical–Hemoglobin Adducts. Toxics. 2022; 10(1):2. https://doi.org/10.3390/toxics10010002
Chicago/Turabian StyleShimamura, Yuko, Akina Okuda, Kenya Ichikawa, Ryo Inagaki, Sohei Ito, Hiroshi Honda, and Shuichi Masuda. 2022. "Factors Influencing the Formation of Chemical–Hemoglobin Adducts" Toxics 10, no. 1: 2. https://doi.org/10.3390/toxics10010002
APA StyleShimamura, Y., Okuda, A., Ichikawa, K., Inagaki, R., Ito, S., Honda, H., & Masuda, S. (2022). Factors Influencing the Formation of Chemical–Hemoglobin Adducts. Toxics, 10(1), 2. https://doi.org/10.3390/toxics10010002