
Inducing Cytotoxicity in Colon Cancer Cells and Suppressing Cancer Stem Cells by Dolasetron and Ketoprofen through Inhibition of RNA Binding Protein PUM1

 , ,
, ,
Abstract
:1. Introduction
2. Materials and Methods
2.1. Preparation of Protein for Molecular Docking and Molecular Dynamic Simulation
2.2. Preparation of Ligand for Molecular Docking and Molecular Dynamic Simulation
2.3. Active Site Prediction for Molecular Docking and Molecular Dynamic Simulation
2.4. Molecular Docking
2.5. Conceptual Density Functional Theory (C-DFT) Analysis
2.6. Molecular Dynamics Simulation
2.7. Cell Lines and Cell Culture
2.8. MTT Cell Viability Assay
2.9. Hemolysis Assay
2.10. Colony Formation Assay
2.11. Spheroid Formation Assay
2.12. Dual Acridine Orange (AO)/Ethidium Bromide (EB) Fluorescence Staining and Caspase-3/7 Activity Assay
2.13. Immunofluorescence
2.14. Statistical Analysis
3. Results and Discussion
3.1. Identification of Top Ten Compounds from FDA-Approved Compounds Using Molecular Docking
3.2. Conceptual Density Functional Theory (C-DFT) Calculations Show Dolasetron and Ketoprofen to Have Better Chemical Reactivity among the Top Ten Compounds
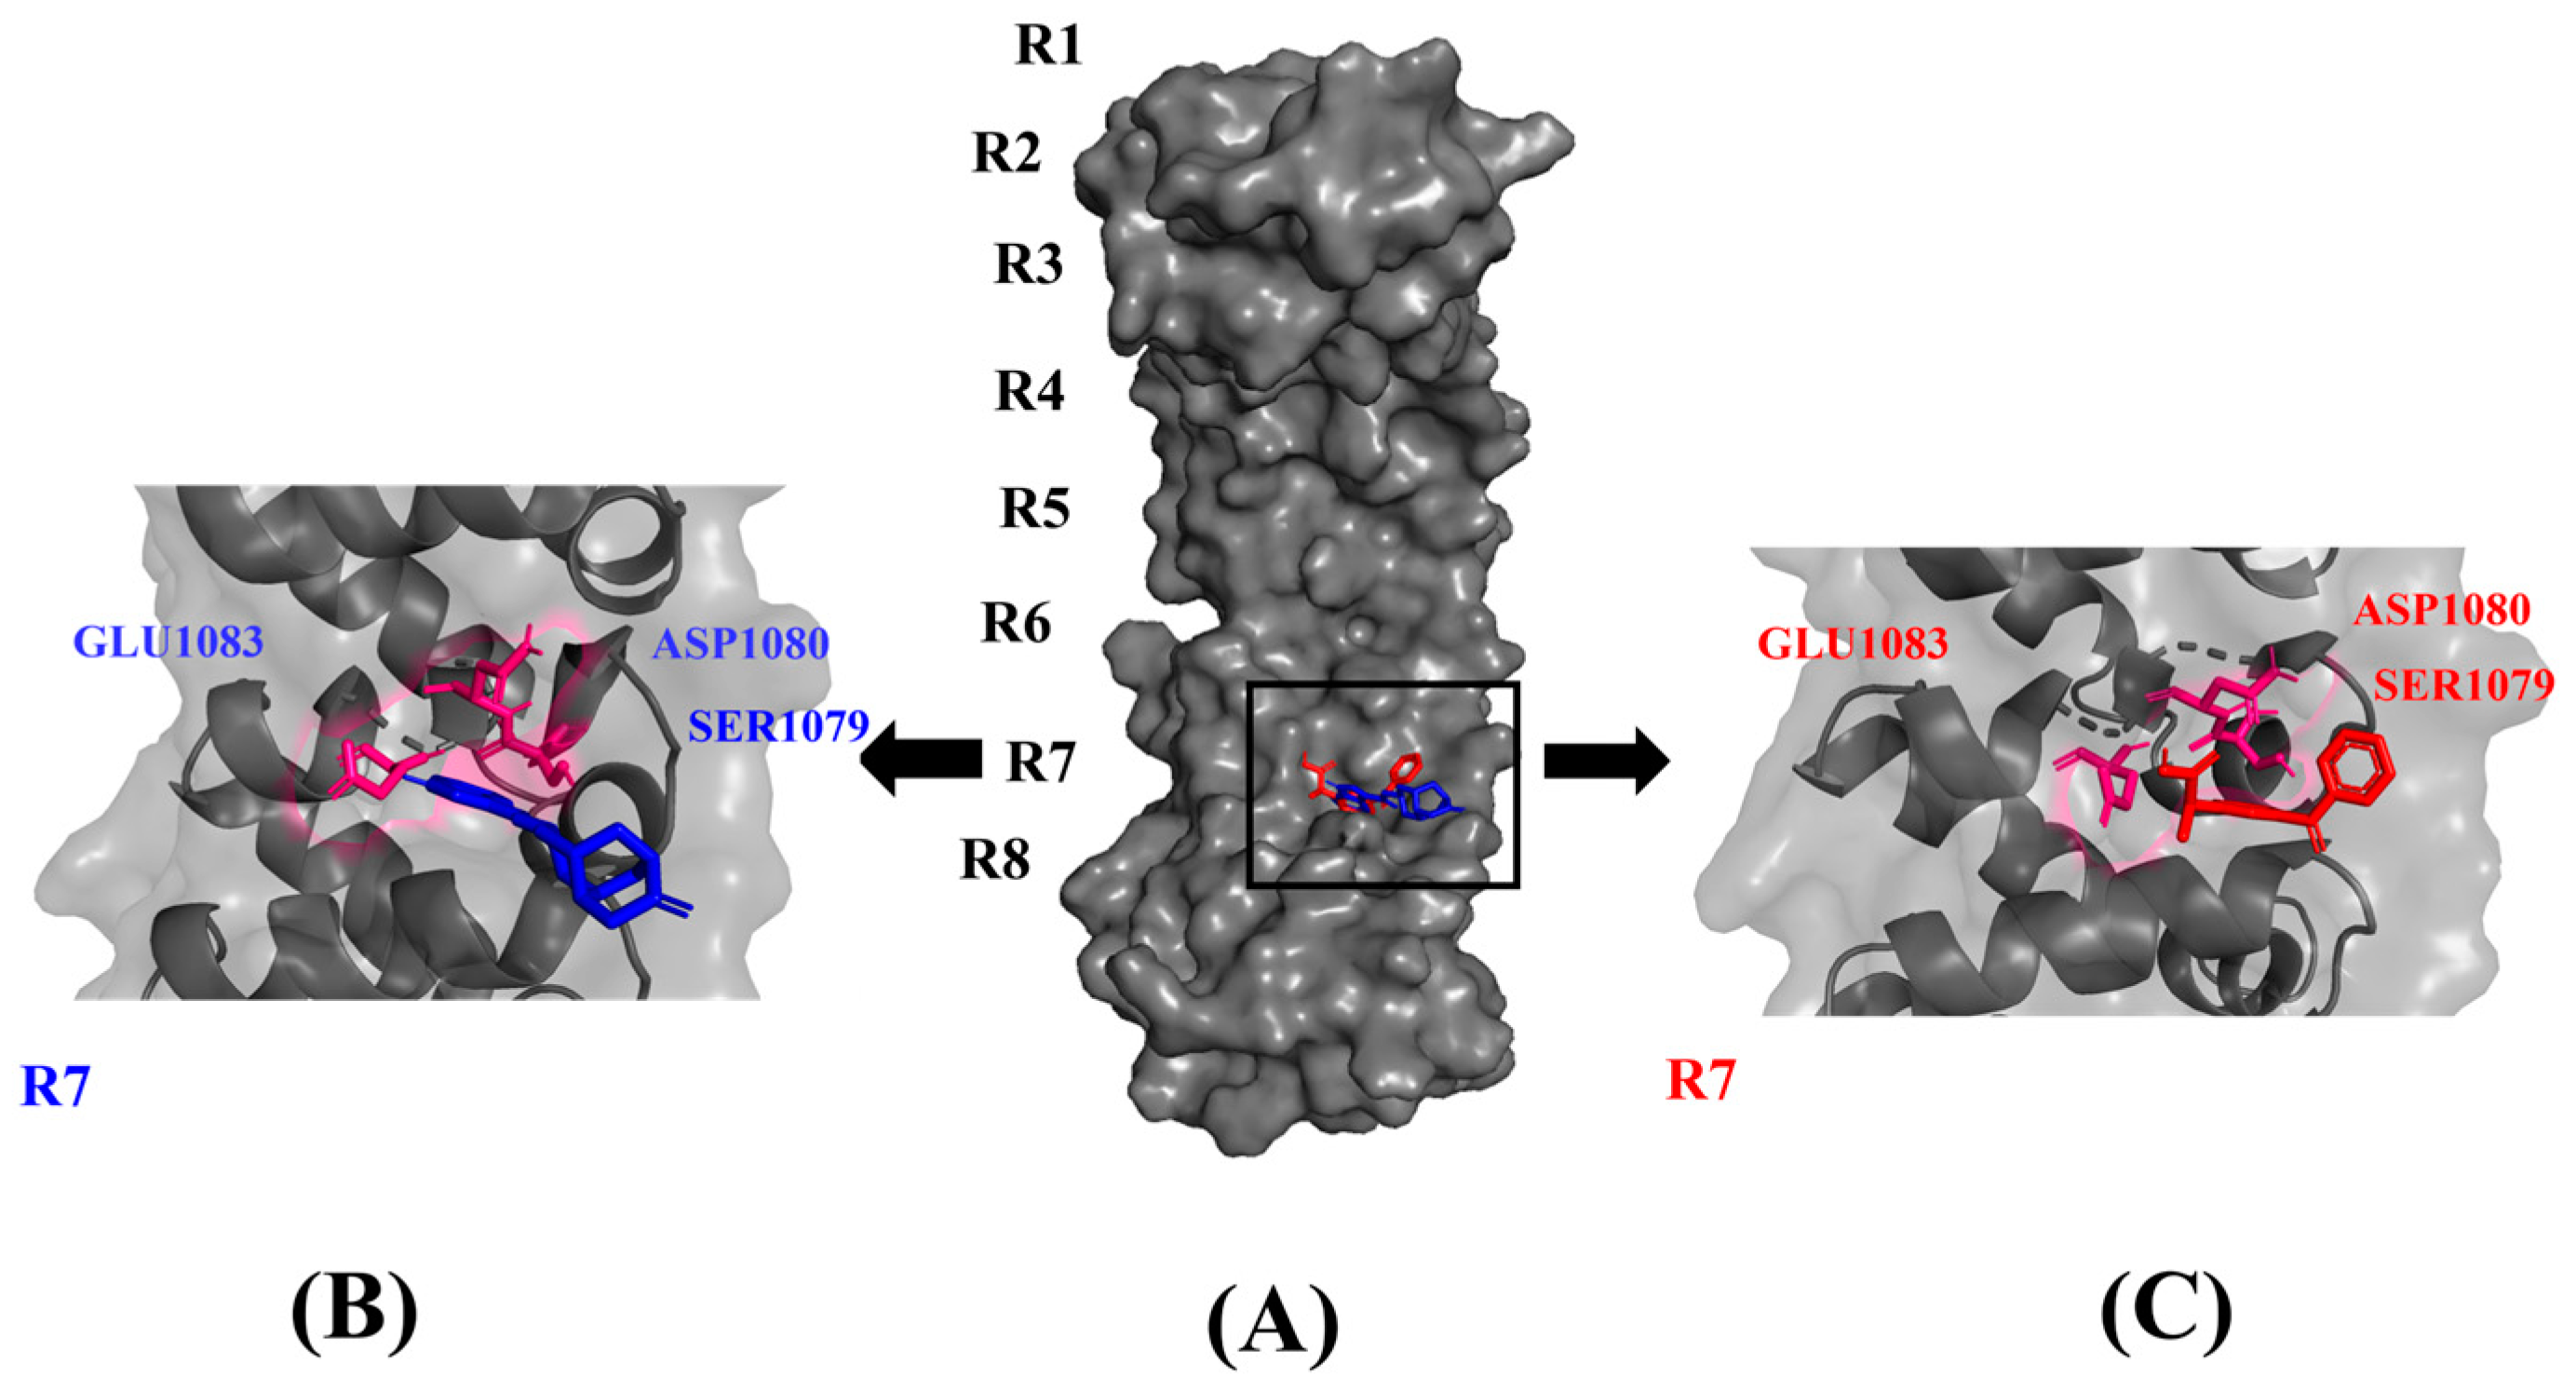
3.3. Dolasetron and Ketoprofen Are Stable during a 100 ns Simulation Run with Active Interactions with PUM1
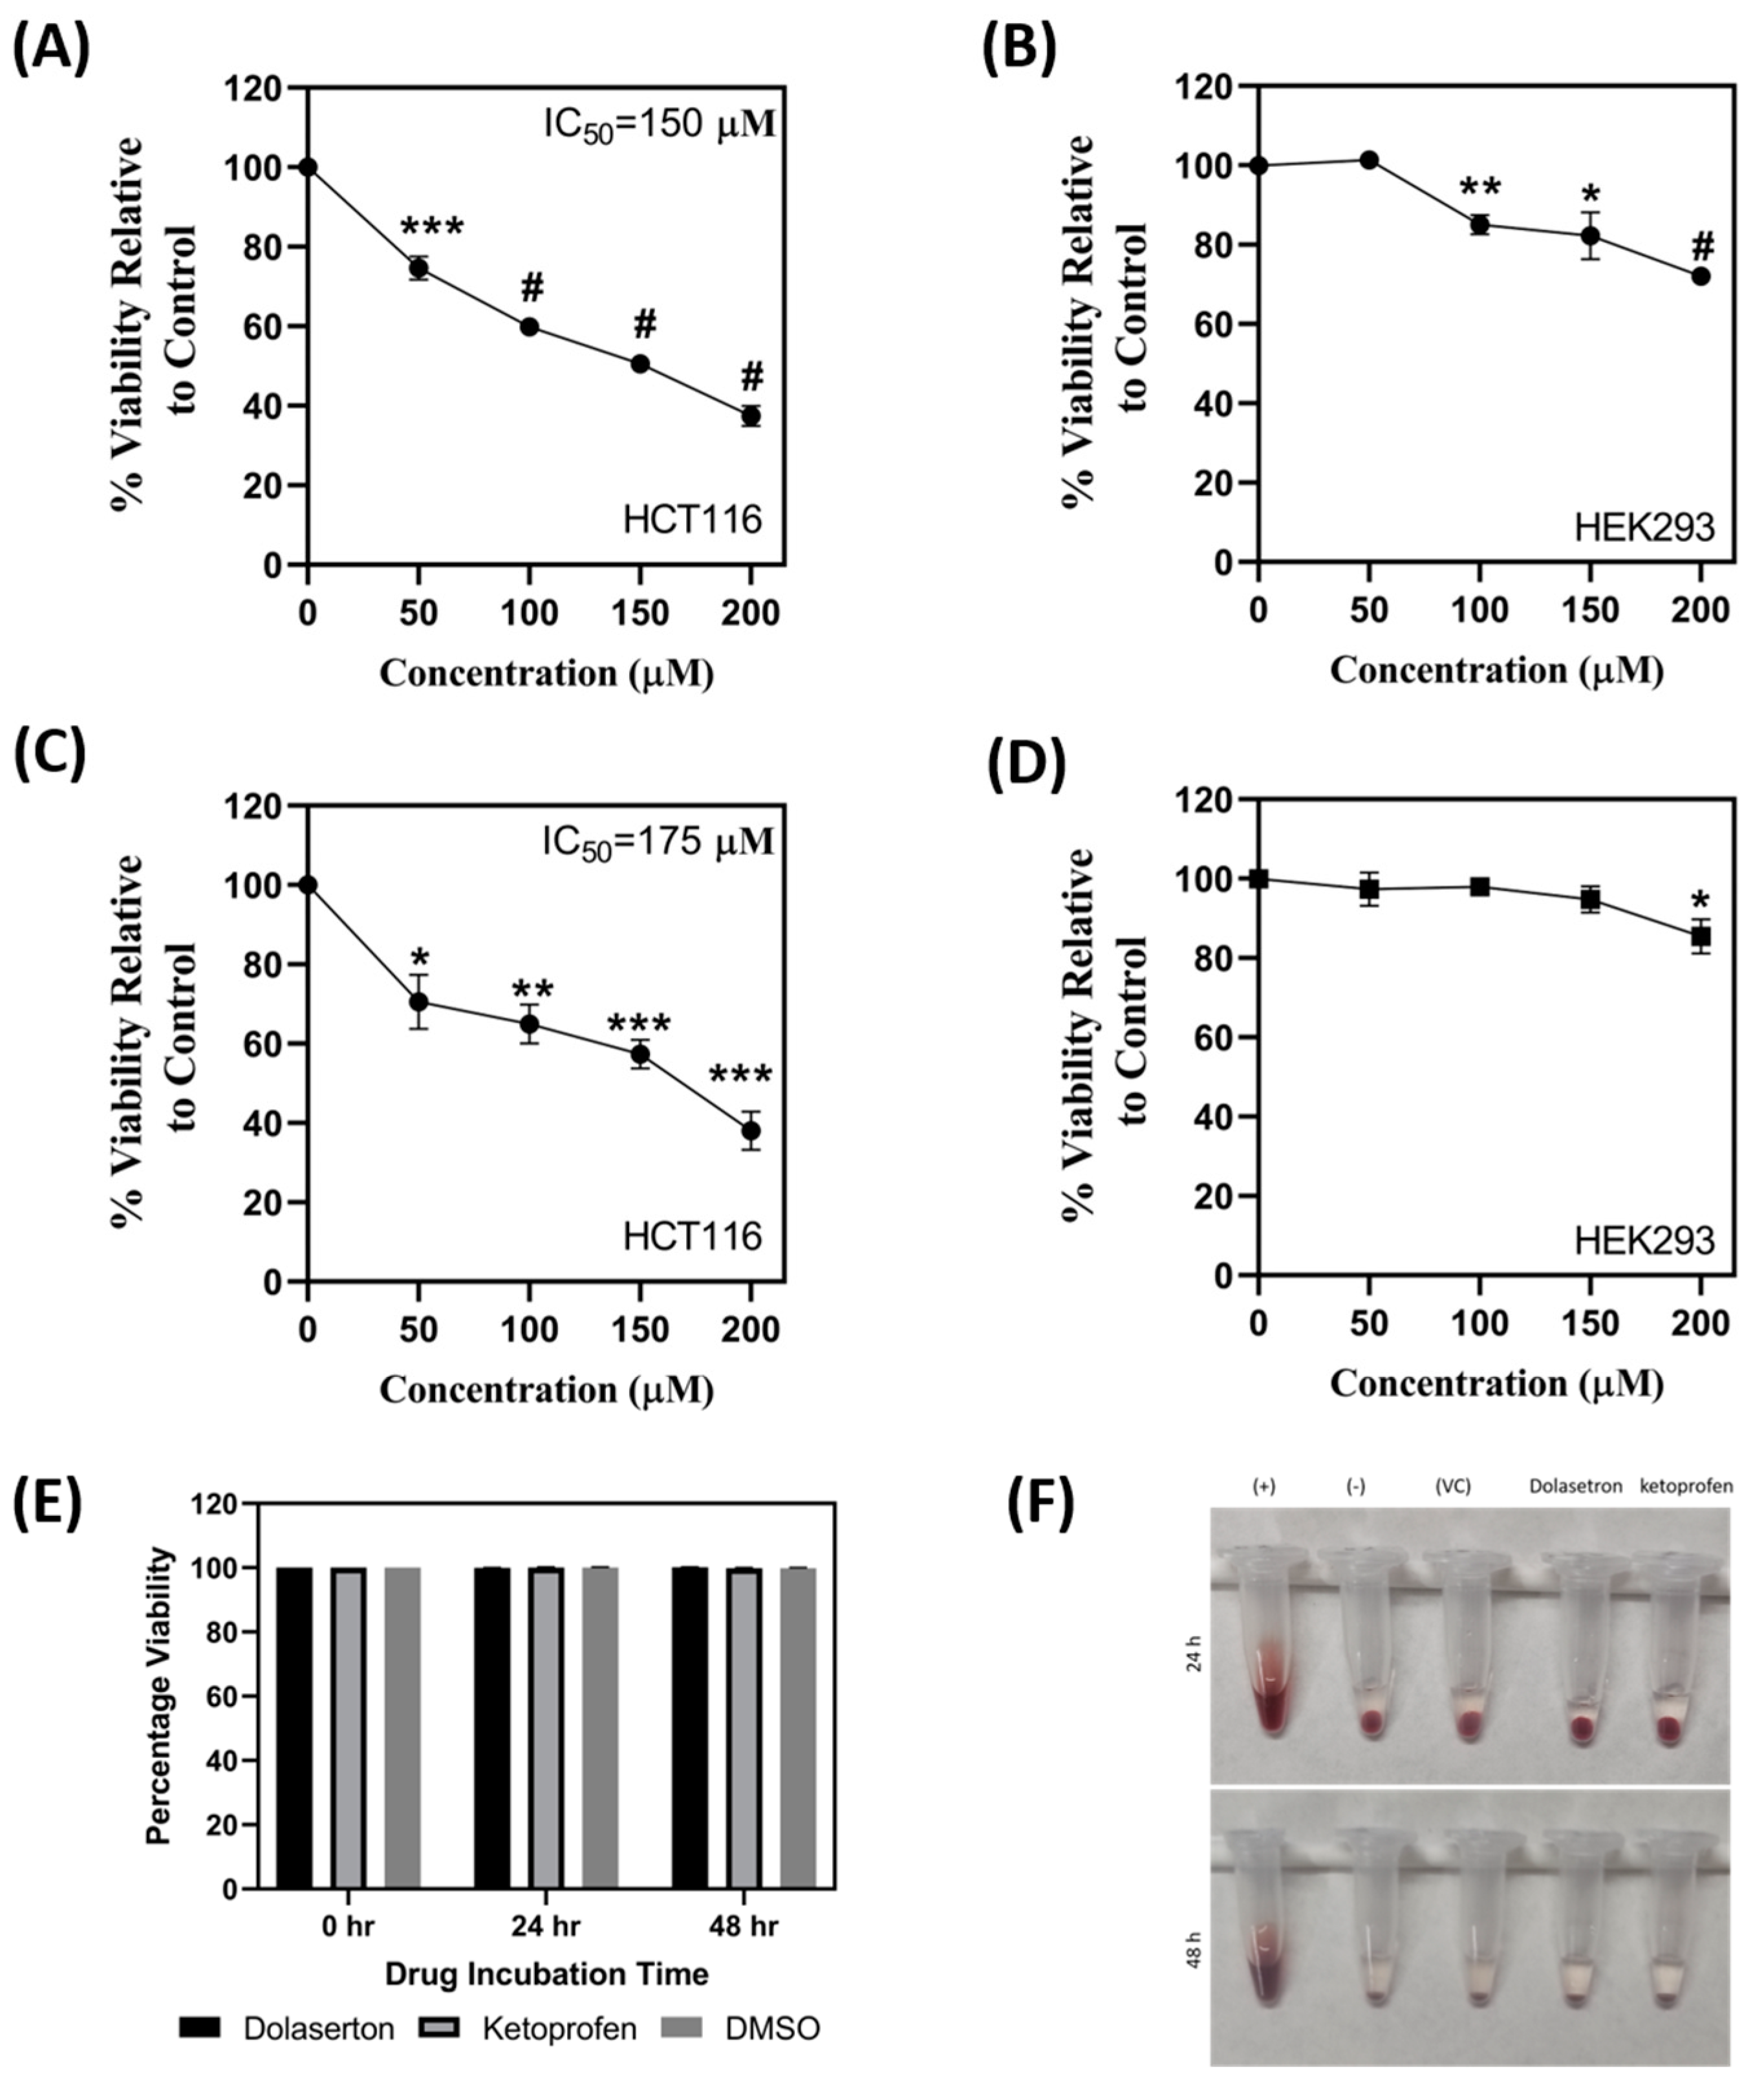
3.4. Dolasetron and Ketoprofen Inhibit Cell Viability, Colony Formation, and Colonospheroids in Colon Cancer Cells
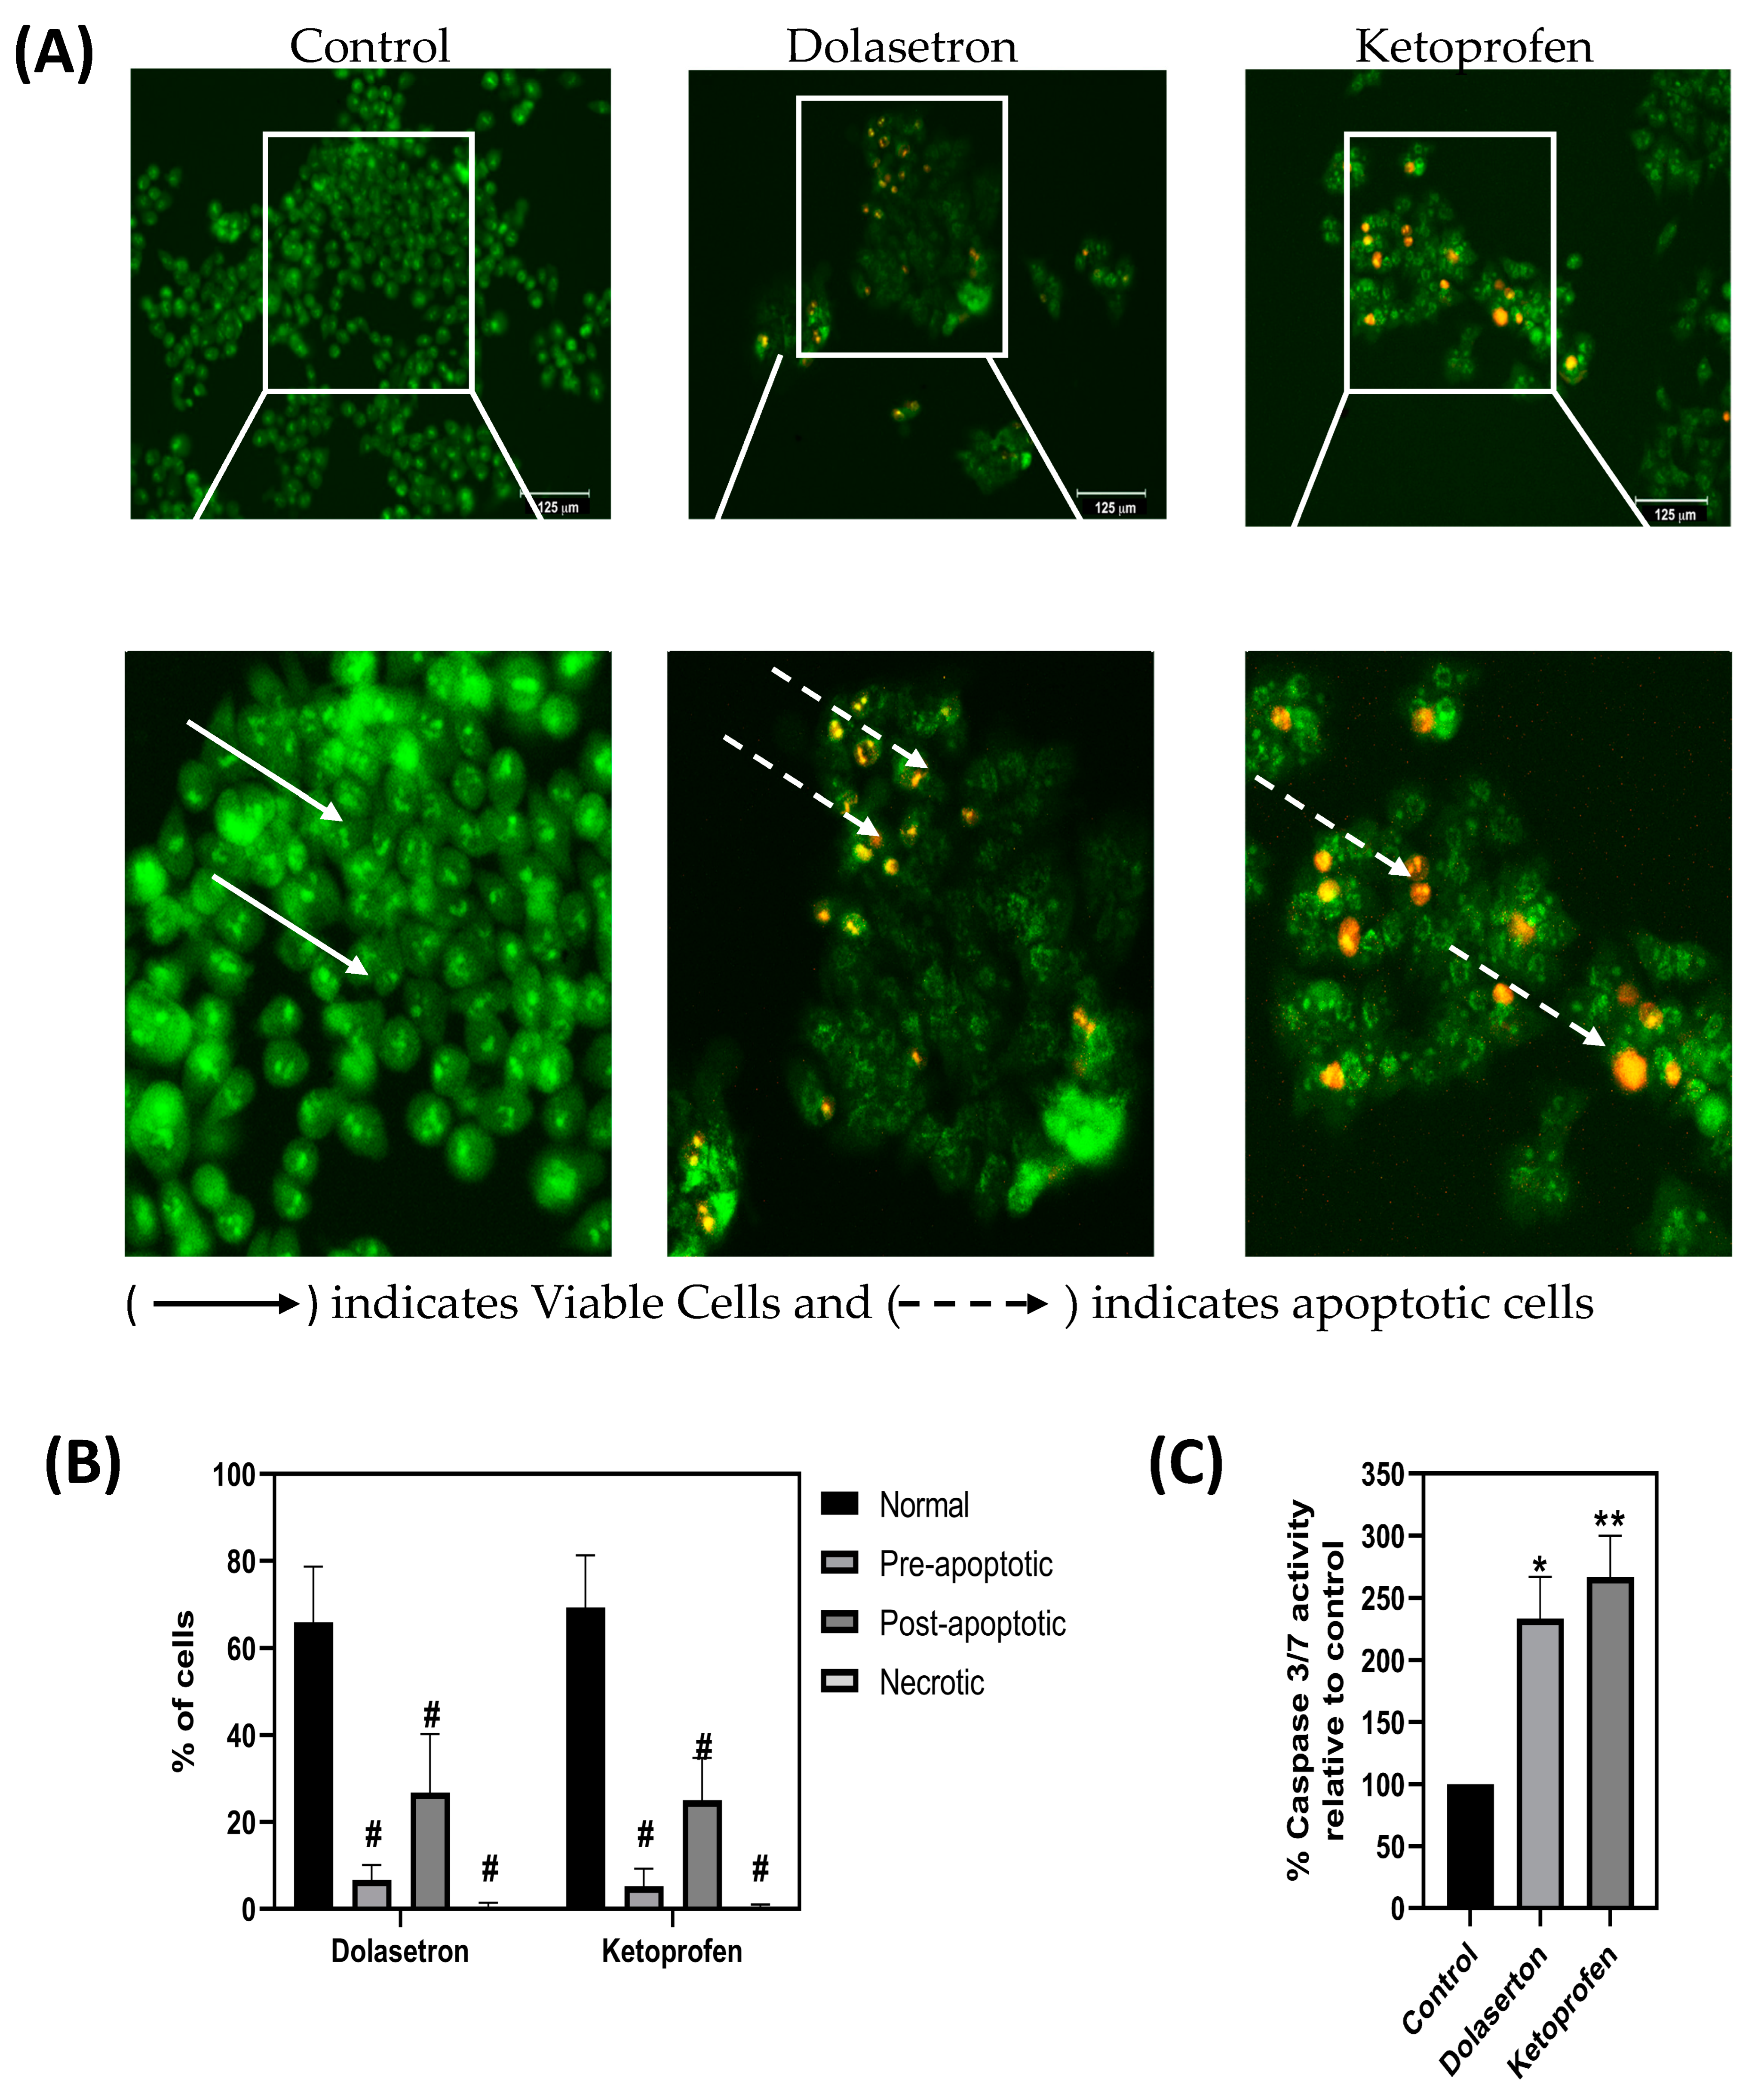
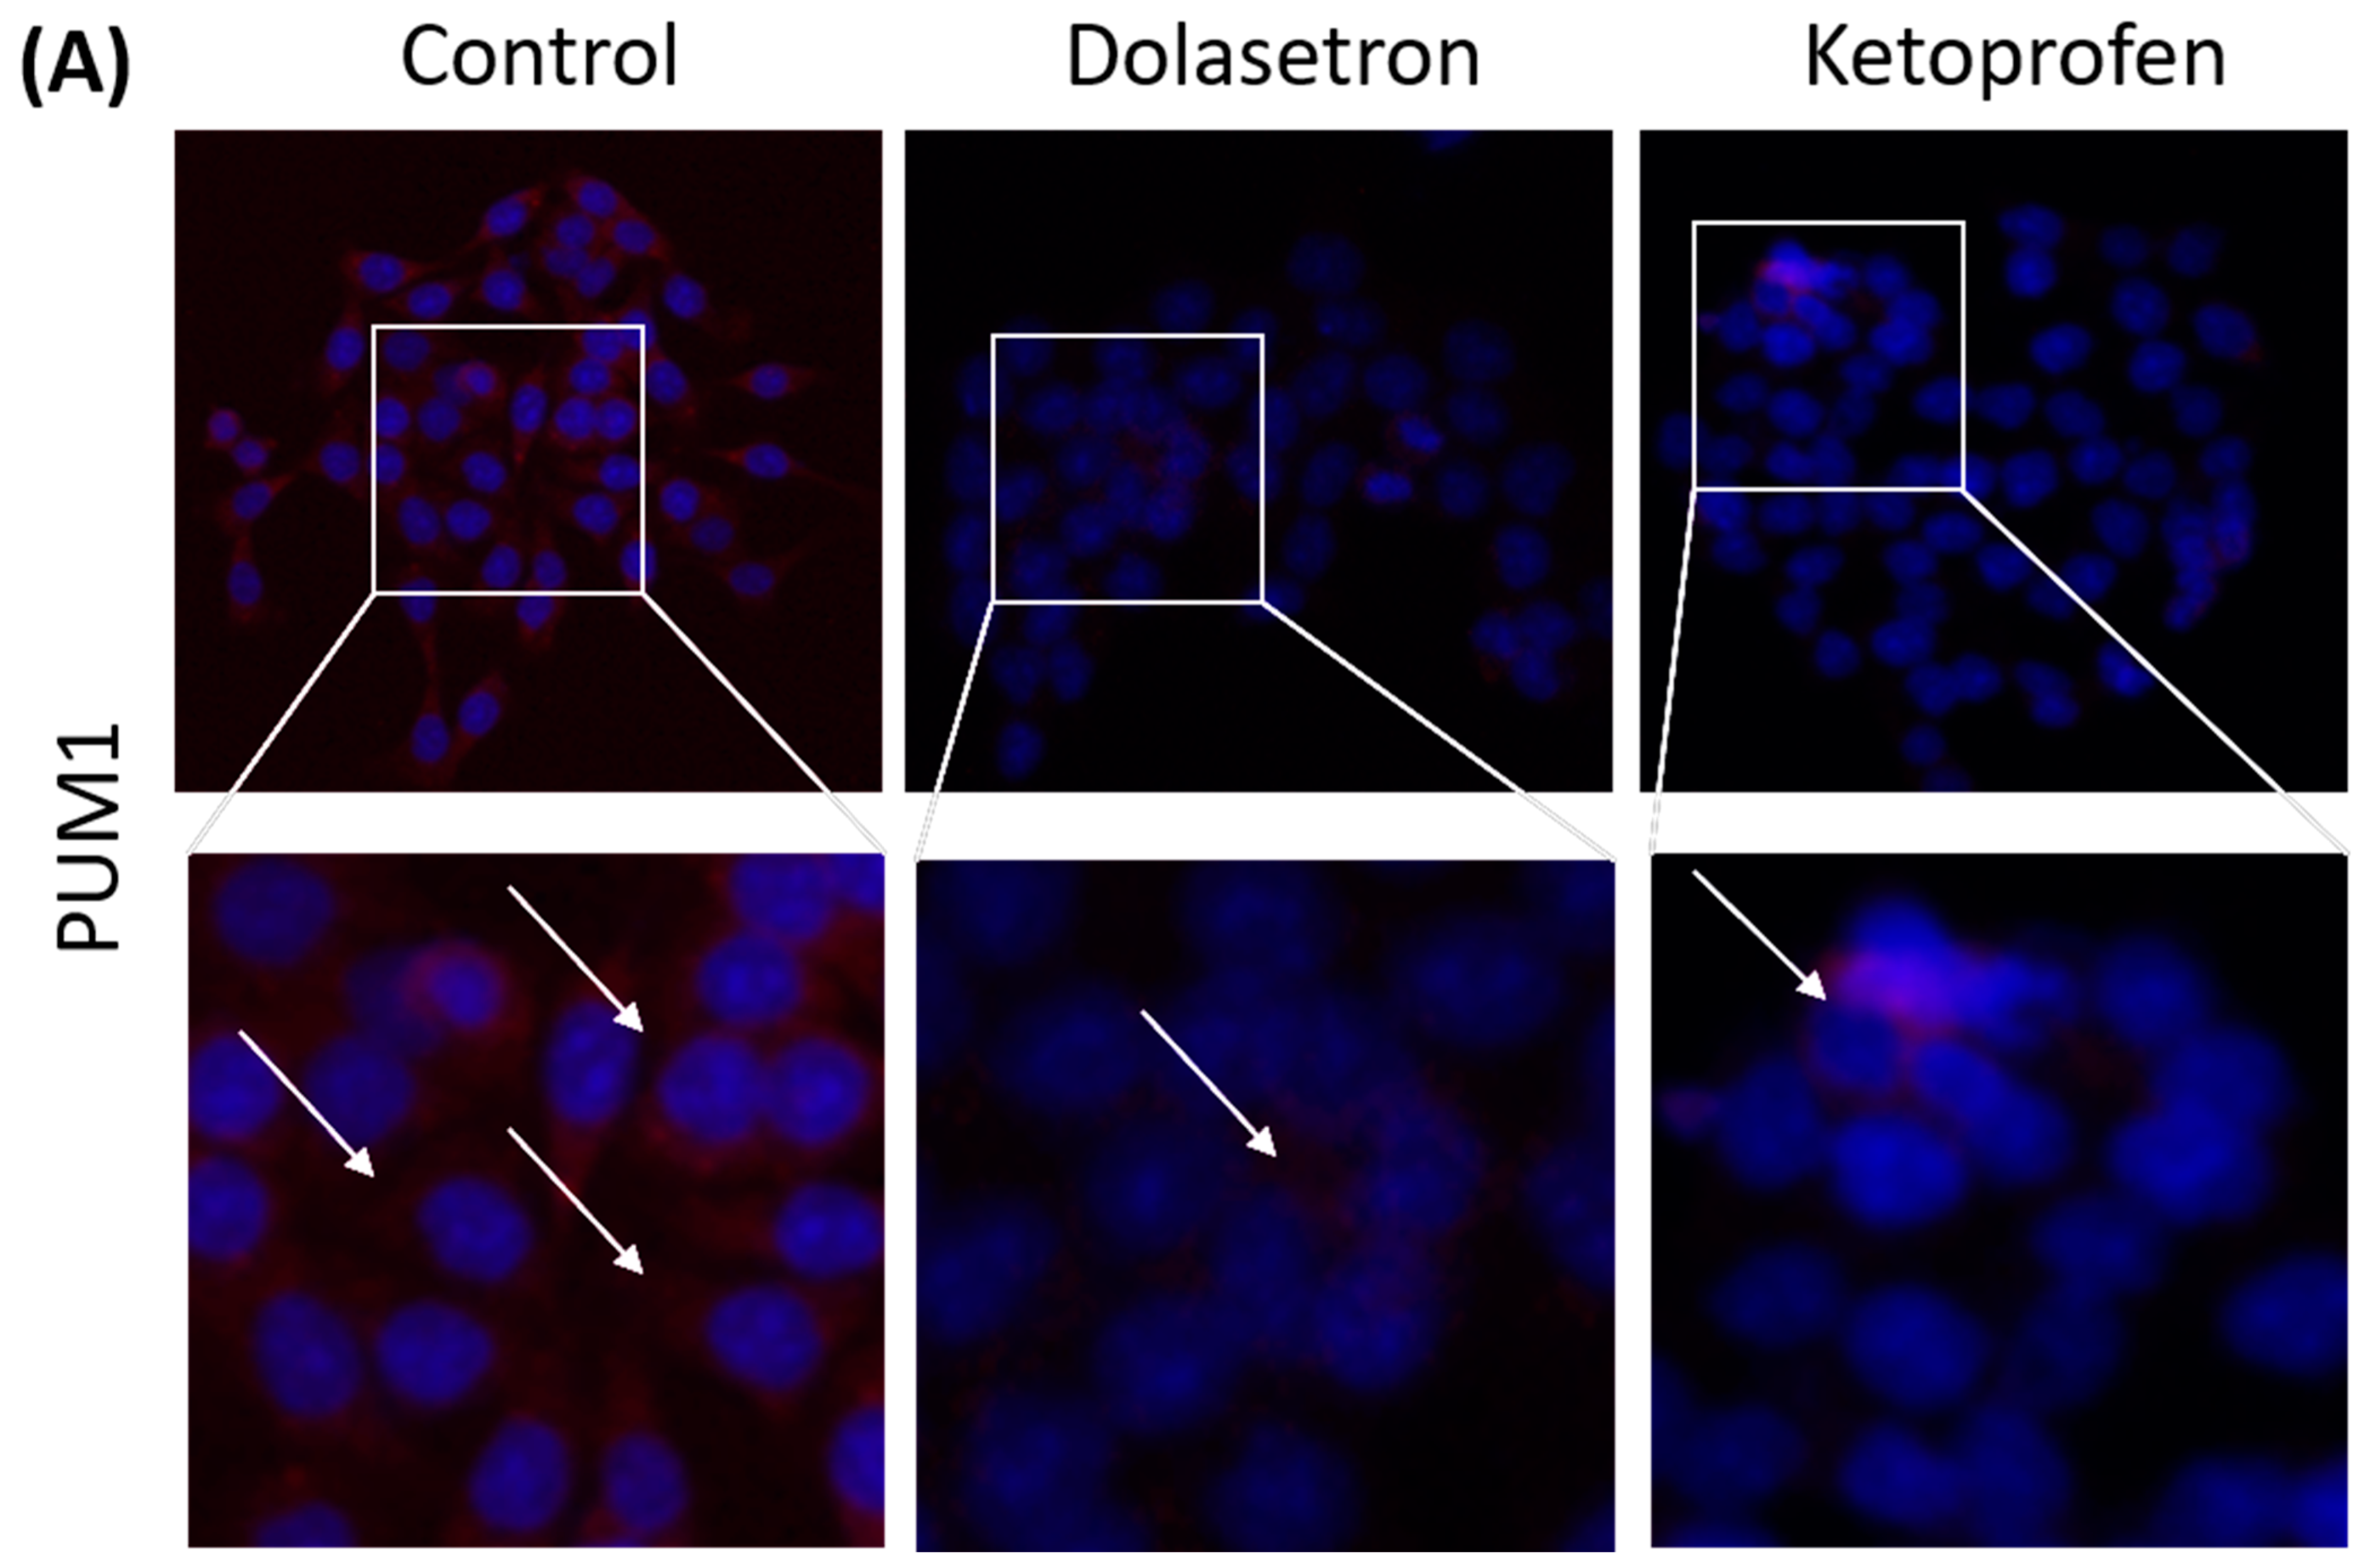
3.5. Dolasetron and Ketoprofen Induce Apoptosis and Reduce PUM1 Expression In Vitro
4. Conclusions
Author Contributions
Funding
Institutional Review Board Statement
Informed Consent Statement
Data Availability Statement
Acknowledgments
Conflicts of Interest
References
- Ashburn, T.T.; Thor, K.B. Drug Repositioning: Identifying and Developing New Uses for Existing Drugs. Nat. Rev. Drug Discov. 2004, 3, 673–683. [Google Scholar] [CrossRef] [PubMed]
- Labianca, R.; Beretta, G.D.; Kildani, B.; Milesi, L.; Merlin, F.; Mosconi, S.; Pessi, M.A.; Prochilo, T.; Quadri, A.; Gatta, G.; et al. Colon Cancer. Crit. Rev. Oncol. Hematol. 2010, 74, 106–133. [Google Scholar] [CrossRef] [PubMed]
- Wang, X.; Zamore, P.D.; Tanaka Hall, T.M. Crystal Structure of a Pumilio Homology Domain. Mol. Cell 2001, 7, 855–865. [Google Scholar] [CrossRef] [PubMed]
- Spassov, D.S.; Jurecic, R. The PUF Family of RNA-Binding Proteins: Does Evolutionarily Conserved Structure Equal Conserved Function? IUBMB Life 2003, 55, 359–366. [Google Scholar] [CrossRef] [PubMed]
- Guan, X.; Chen, S.; Liu, Y.; Wang, L.l.; Zhao, Y.; Zong, Z.H. PUM1 Promotes Ovarian Cancer Proliferation, Migration and Invasion. Biochem. Biophys. Res. Commun. 2018, 497, 313–318. [Google Scholar] [CrossRef] [PubMed]
- Gor, R.; Sampath, S.S.; Lazer, L.M.; Ramalingam, S. RNA Binding Protein PUM1 Promotes Colon Cancer Cell Proliferation and Migration. Int. J. Biol. Macromol. 2021, 174, 549–561. [Google Scholar] [CrossRef]
- Dai, H.; Shen, K.; Yang, Y.; Su, X.; Luo, Y.; Jiang, Y.; Shuai, L.; Zheng, P.; Chen, Z.; Bie, P. PUM1 Knockdown Prevents Tumor Progression by Activating the PERK/EIF2/ATF4 Signaling Pathway in Pancreatic Adenocarcinoma Cells. Cell Death Dis. 2019, 10, 595. [Google Scholar] [CrossRef] [Green Version]
- Gong, Y.; Liu, Z.; Yuan, Y.; Yang, Z.; Zhang, J.; Lu, Q.; Wang, W.; Fang, C.; Lin, H.; Liu, S. PUMILIO Proteins Promote Colorectal Cancer Growth via Suppressing P21. Nat. Commun. 2022, 13, 1627. [Google Scholar] [CrossRef]
- Gor, R.; Saha, L.; Agarwal, S.; Karri, U.; Sohani, A.; Madhavan, T.; Pachaiappan, R.; Ramalingam, S. Morin Inhibits Colon Cancer Stem Cells by Inhibiting PUM1 Expression in Vitro. Med. Oncol. 2022, 39, 251. [Google Scholar] [CrossRef]
- Pushpakom, S.; Iorio, F.; Eyers, P.A.; Escott, K.J.; Hopper, S.; Wells, A.; Doig, A.; Guilliams, T.; Latimer, J.; McNamee, C.; et al. Drug Repurposing: Progress, Challenges and Recommendations. Nat. Rev. Drug Discov. 2019, 18, 41–58. [Google Scholar] [CrossRef]
- Trott, O.; Olson, A.J. AutoDock Vina: Improving the Speed and Accuracy of Docking with a New Scoring Function, Efficient Optimization, and Multithreading. J. Comput. Chem. 2010, 31, 455–461. [Google Scholar] [CrossRef] [Green Version]
- Dallakyan, S.; Olson, A.J. Small-Molecule Library Screening by Docking with PyRx. Methods Mol. Biol. 2015, 1263, 243–250. [Google Scholar] [CrossRef]
- Yousaf, A.; Shehzadi, T.; Farooq, A.; Ilyas, K. Protein Active Site Prediction for Early Drug Discovery and Designing. Int. Rev. Appl. Sci. Eng. 2021, 13, 98–105. [Google Scholar] [CrossRef]
- Becke, A.D. Density-functional Thermochemistry. III. The Role of Exact Exchange. J. Chem. Phys. 1998, 98, 5648. [Google Scholar] [CrossRef] [Green Version]
- Lee, C.; Yang, W.; Parr, R.G. Development of the Colle-Salvetti Correlation-Energy Formula into a Functional of the Electron Density. Phys. Rev. B Condens. Matter 1988, 37, 785–789. [Google Scholar] [CrossRef] [Green Version]
- Domingo, L.R.; Ríos-Gutiérrez, M.; Pérez, P. Applications of the Conceptual Density Functional Theory Indices to Organic Chemistry Reactivity. Molecules 2016, 21, 748. [Google Scholar] [CrossRef] [Green Version]
- Kulkarni, S.A.; Nagarajan, S.K.; Ramesh, V.; Palaniyandi, V.; Selvam, S.P.; Madhavan, T. Computational Evaluation of Major Components from Plant Essential Oils as Potent Inhibitors of SARS-CoV-2 Spike Protein. J. Mol. Struct. 2020, 1221, 128823. [Google Scholar] [CrossRef]
- Abraham, M.J.; Murtola, T.; Schulz, R.; Páll, S.; Smith, J.C.; Hess, B.; Lindah, E. GROMACS: High Performance Molecular Simulations through Multi-Level Parallelism from Laptops to Supercomputers. SoftwareX 2015, 1–2, 19–25. [Google Scholar] [CrossRef] [Green Version]
- Vajrabhaya, L.o.; Korsuwannawong, S. Cytotoxicity Evaluation of a Thai Herb Using Tetrazolium (MTT) and Sulforhodamine B (SRB) Assays. J. Anal. Sci. Technol. 2018, 9, 15. [Google Scholar] [CrossRef] [Green Version]
- Riss, T.L.; Moravec, R.A.; Niles, A.L.; Duellman, S.; Benink, H.A.; Worzella, T.J.; Minor, L. Cell Viability Assays, Assay Guidance Manual; Eli lilly & Company: Bethesda, MD, USA, 2016. [Google Scholar]
- Pagano, M.; Faggio, C. The Use of Erythrocyte Fragility to Assess Xenobiotic Cytotoxicity. Cell Biochem. Funct. 2015, 33, 351–355. [Google Scholar] [CrossRef]
- Lin, Y.S.; Haynes, C.L. Impacts of Mesoporous Silica Nanoparticle Size, Pore Ordering, and Pore Integrity on Hemolytic Activity. J. Am. Chem. Soc. 2010, 132, 4834–4842. [Google Scholar] [CrossRef] [PubMed]
- Huang, H.; Lai, W.; Cui, M.; Liang, L.; Lin, Y.; Fang, Q.; Liu, Y.; Xie, L. An Evaluation of Blood Compatibility of Silver Nanoparticles. Sci. Rep. 2016, 6, 25518. [Google Scholar] [CrossRef] [PubMed] [Green Version]
- Subramaniam, D.; Ponnurangam, S.; Ramamoorthy, P.; Standing, D.; Battafarano, R.J.; Anant, S.; Sharma, P. Curcumin Induces Cell Death in Esophageal Cancer Cells through Modulating Notch Signaling. PLoS ONE 2012, 7, e30590. [Google Scholar] [CrossRef]
- Chi, C.F.; Hu, F.Y.; Wang, B.; Li, T.; Ding, G.F. Antioxidant and Anticancer Peptides from the Protein Hydrolysate of Blood Clam (Tegillarca Granosa) Muscle. J. Funct. Foods 2015, 15, 301–313. [Google Scholar] [CrossRef]
- Ponnurangam, S.; Mammen, J.M.V.; Ramalingam, S.; He, Z.; Zhang, Y.; Umar, S.; Subramaniam, D.; Anant, S. Honokiol in Combination with Radiation Targets Notch Signaling to Inhibit Colon Cancer Stem Cells. Mol. Cancer Ther. 2012, 11, 963. [Google Scholar] [CrossRef] [Green Version]
- Lazer, L.M.; Kesavan, Y.; Gor, R.; Ramachandran, I.; Pathak, S.; Narayan, S.; Anbalagan, M.; Ramalingam, S. Targeting Colon Cancer Stem Cells Using Novel Doublecortin like Kinase 1 Antibody Functionalized Folic Acid Conjugated Hesperetin Encapsulated Chitosan Nanoparticles. Colloids Surf. B Biointerfaces 2022, 217, 112612. [Google Scholar] [CrossRef]
- Sureban, S.M.; Ramalingam, S.; Natarajan, G.; May, R.; Subramaniam, D.; Bishnupuri, K.S.; Morrison, A.R.; Dieckgraefe, B.K.; Brackett, D.J.; Postier, R.G.; et al. Translation Regulatory Factor RBM3 Is a Proto-Oncogene That Prevents Mitotic Catastrophe. Oncogene 2008, 27, 4544–4556. [Google Scholar] [CrossRef] [Green Version]
- Lica, J.J.; Wieczór, M.; Grabe, G.J.; Heldt, M.; Jancz, M.; Misiak, M.; Gucwa, K.; Brankiewicz, W.; Maciejewska, N.; Stupak, A.; et al. Effective Drug Concentration and Selectivity Depends on Fraction of Primitive Cells. Int. J. Mol. Sci. 2021, 22, 4931. [Google Scholar] [CrossRef]
- Boatright, K.M.; Salvesen, G.S. Caspase Activation. In Biochemical Society Symposia; Portland Press Limited: London, UK, 2003; pp. 233–242. [Google Scholar] [CrossRef] [Green Version]
- Cho, S.G.; Choi, E.J. Apoptotic Signaling Pathways: Caspases and Stress-Activated Protein Kinases. J. Biochem. Mol. Biol. 2002, 35, 24–27. [Google Scholar] [CrossRef] [Green Version]
- Balfour, J.A.; Goa, K.L. Dolasetron. A Review of Its Pharmacology and Therapeutic Potential in the Management of Nausea and Vomiting Induced by Chemotherapy, Radiotherapy or Surgery. Drugs 1997, 54, 273–298. [Google Scholar] [CrossRef]


| Sr. No. | Compound Name | Binding Affinity (Kcal/mol) | Hydrophobic Interactions |
|---|---|---|---|
| 1 | Ketoprofen | −8.2 | Val894, Val896, Leu1014, Tyr1120, Thr1021, Tyr1123, Leu1026, Ile1046, Ser1079. |
| 2 | Dolasetron | −7.4 | |
| 3 | Methsuximide | −6.3 | |
| 4 | Menadione | −6.3 | |
| 5 | Lansoprazole | −6.3 | |
| 6 | Lefamulin | −6.0 | |
| 7 | Allopurinol | −5.3 | |
| 8 | Ketamine | −5.2 | |
| 9 | Levocarnitine | −4.2 | |
| 10 | Miltedosine | −3.4 |
| Sr. No. | Compound Name | Total Energy (In eV) | Molecular Dipole Moment (Debye) | EHOMO | ELUMO | ΔE | η | σ | χ | μ | ω | HOMO | LUMO |
|---|---|---|---|---|---|---|---|---|---|---|---|---|---|
| 1 | Dolasetron | −22960 | 2.66 | −6.6 | −1.6 | 4.9 | 2.5 | 0.2 | −4.1 | 4.1 | 3.38 |  | 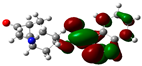 |
| 2 | Ketoprofen | −29149 | 5.05 | −5.6 | −1.5 | 4.1 | 2 | 0.2 | −3.6 | 3.6 | 3.13 | 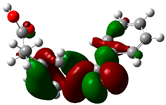 | 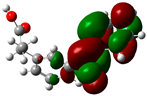 |
| 3 | Methsuxmide | −18241 | 0.73 | −6.5 | −1 | 5.6 | 2.8 | 0.2 | −3.8 | 3.8 | 2.52 |  | 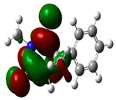 |
| 4 | Menadione | −15567 | 5.3 | −5.8 | −3.7 | 2.2 | 1.1 | 0.5 | −4.7 | 4.7 | 10.5 | 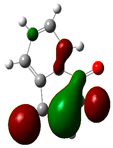 |  |
| 5 | Lansoprazole | −44366 | 2.83 | −5.5 | −2 | 3.4 | 1.7 | 0.3 | −3.7 | 3.7 | 4.06 | 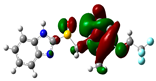 | 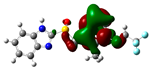 |
| 6 | Lefamulin | −52329 | 3.77 | −6 | −0.9 | 5.1 | 2.5 | 0.2 | −3.5 | 3.5 | 2.38 |  |  |
| 7 | Allopurinol | −13256 | 3.69 | −6.8 | −1.3 | 5.5 | 2.8 | 0.2 | −4.1 | 4.1 | 3.02 | 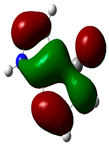 | 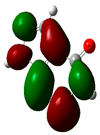 |
| 8 | Ketamine | −29219 | 9.37 | −1.9 | −1 | 0.9 | 0.5 | 1.1 | −1.4 | 1.4 | 2.17 | 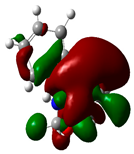 | 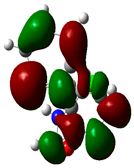 |
| 9 | Levocarnitine | −15128 | 20.44 | −2.6 | −0.2 | 2.4 | 1.2 | 0.4 | −1.4 | 1.4 | 0.82 |  | 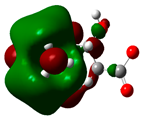 |
| 10 | Miltefosine | −41496 | 19.23 | −3.7 | −0.1 | 3.6 | 1.8 | 0.3 | −1.9 | 1.9 | 1.02 | 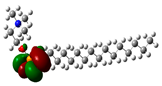 | 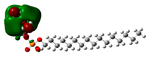 |
Disclaimer/Publisher’s Note: The statements, opinions and data contained in all publications are solely those of the individual author(s) and contributor(s) and not of MDPI and/or the editor(s). MDPI and/or the editor(s) disclaim responsibility for any injury to people or property resulting from any ideas, methods, instructions or products referred to in the content. |
© 2023 by the authors. Licensee MDPI, Basel, Switzerland. This article is an open access article distributed under the terms and conditions of the Creative Commons Attribution (CC BY) license (https://creativecommons.org/licenses/by/4.0/).
Share and Cite
Gor, R.; Gharib, A.; Dharshini Balaji, P.; Madhavan, T.; Ramalingam, S. Inducing Cytotoxicity in Colon Cancer Cells and Suppressing Cancer Stem Cells by Dolasetron and Ketoprofen through Inhibition of RNA Binding Protein PUM1. Toxics 2023, 11, 669. https://doi.org/10.3390/toxics11080669
Gor R, Gharib A, Dharshini Balaji P, Madhavan T, Ramalingam S. Inducing Cytotoxicity in Colon Cancer Cells and Suppressing Cancer Stem Cells by Dolasetron and Ketoprofen through Inhibition of RNA Binding Protein PUM1. Toxics. 2023; 11(8):669. https://doi.org/10.3390/toxics11080669
Chicago/Turabian StyleGor, Ravi, Ali Gharib, Priya Dharshini Balaji, Thirumurthy Madhavan, and Satish Ramalingam. 2023. "Inducing Cytotoxicity in Colon Cancer Cells and Suppressing Cancer Stem Cells by Dolasetron and Ketoprofen through Inhibition of RNA Binding Protein PUM1" Toxics 11, no. 8: 669. https://doi.org/10.3390/toxics11080669