
GC/MS-Based Metabolomic Analysis of A549 Cells Exposed to Emerging Organophosphate Flame Retardants

Abstract

1. Introduction
2. Materials and Methods
2.1. Chemicals and Reagents
2.2. Cell Culture
2.3. MTT Cell Viability Assay
2.4. Cell Sample Pretreatment for Metabolomic Analysis
2.5. Metabolic Data Processing and Multivariate Statistical Analysis
3. Results
3.1. Cytotoxicity Analysis of eOPFRs
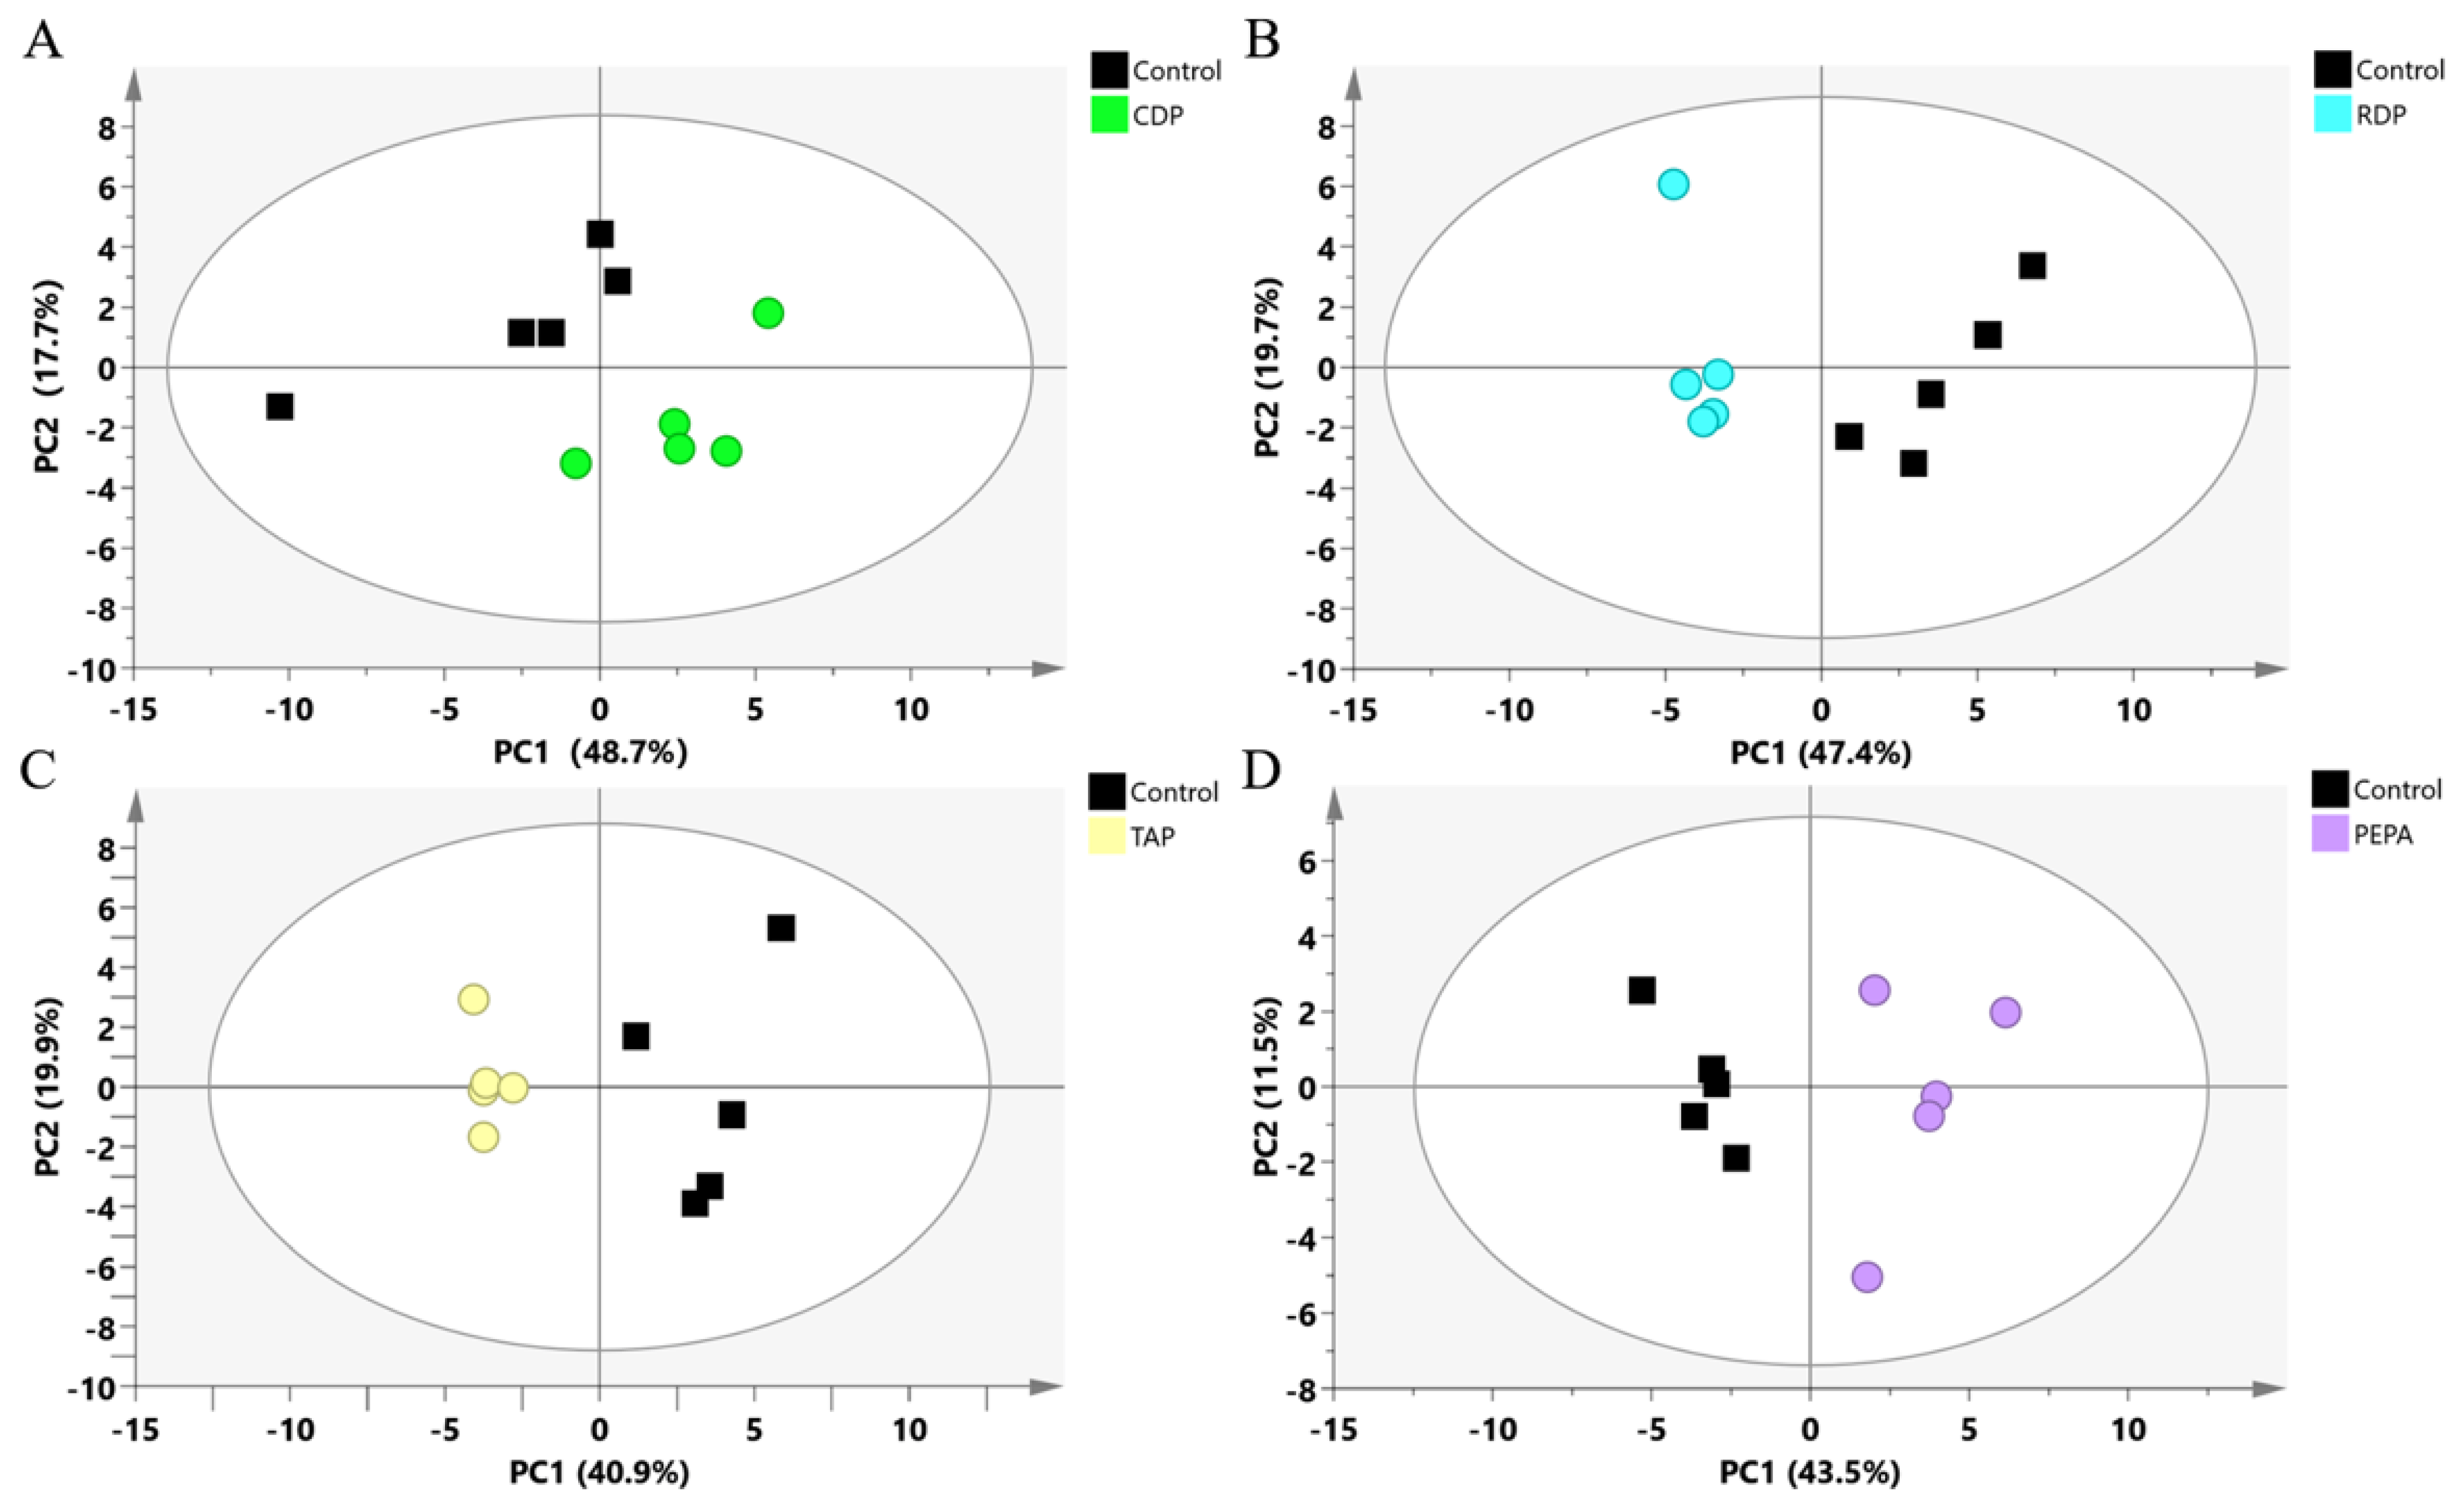
3.2. Metabolomics Analysis
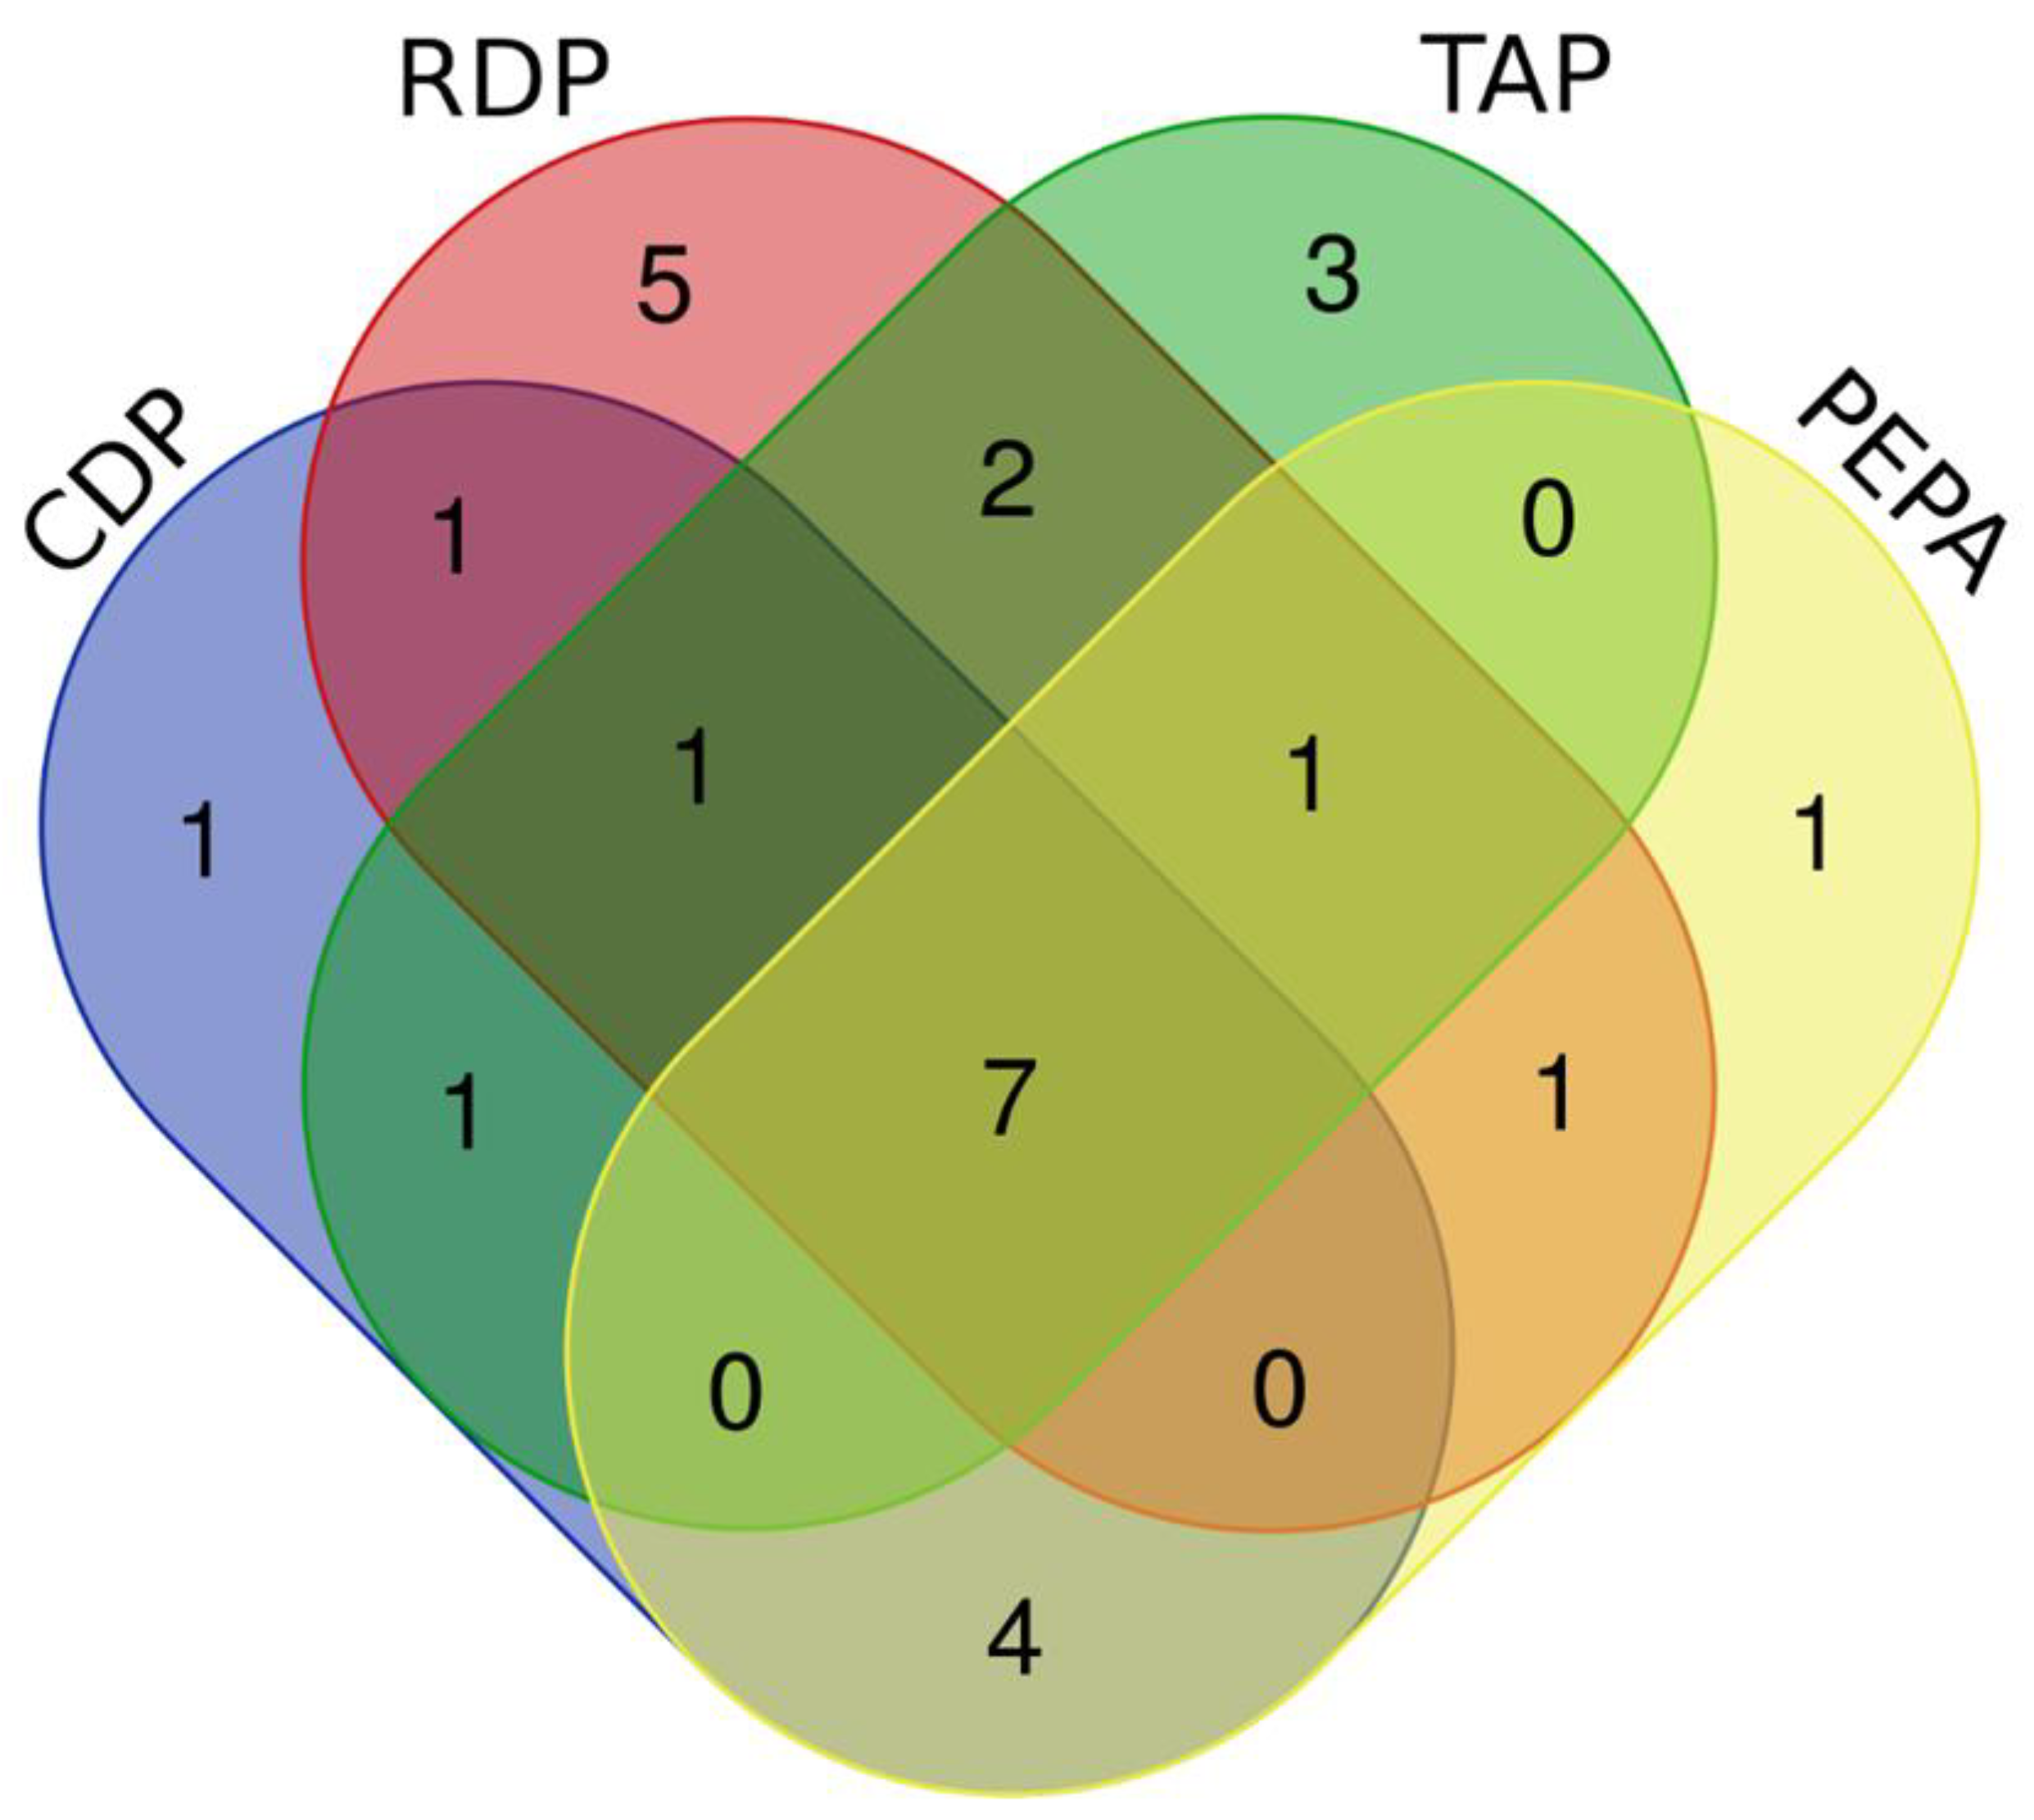
3.3. The Identification of DEMs
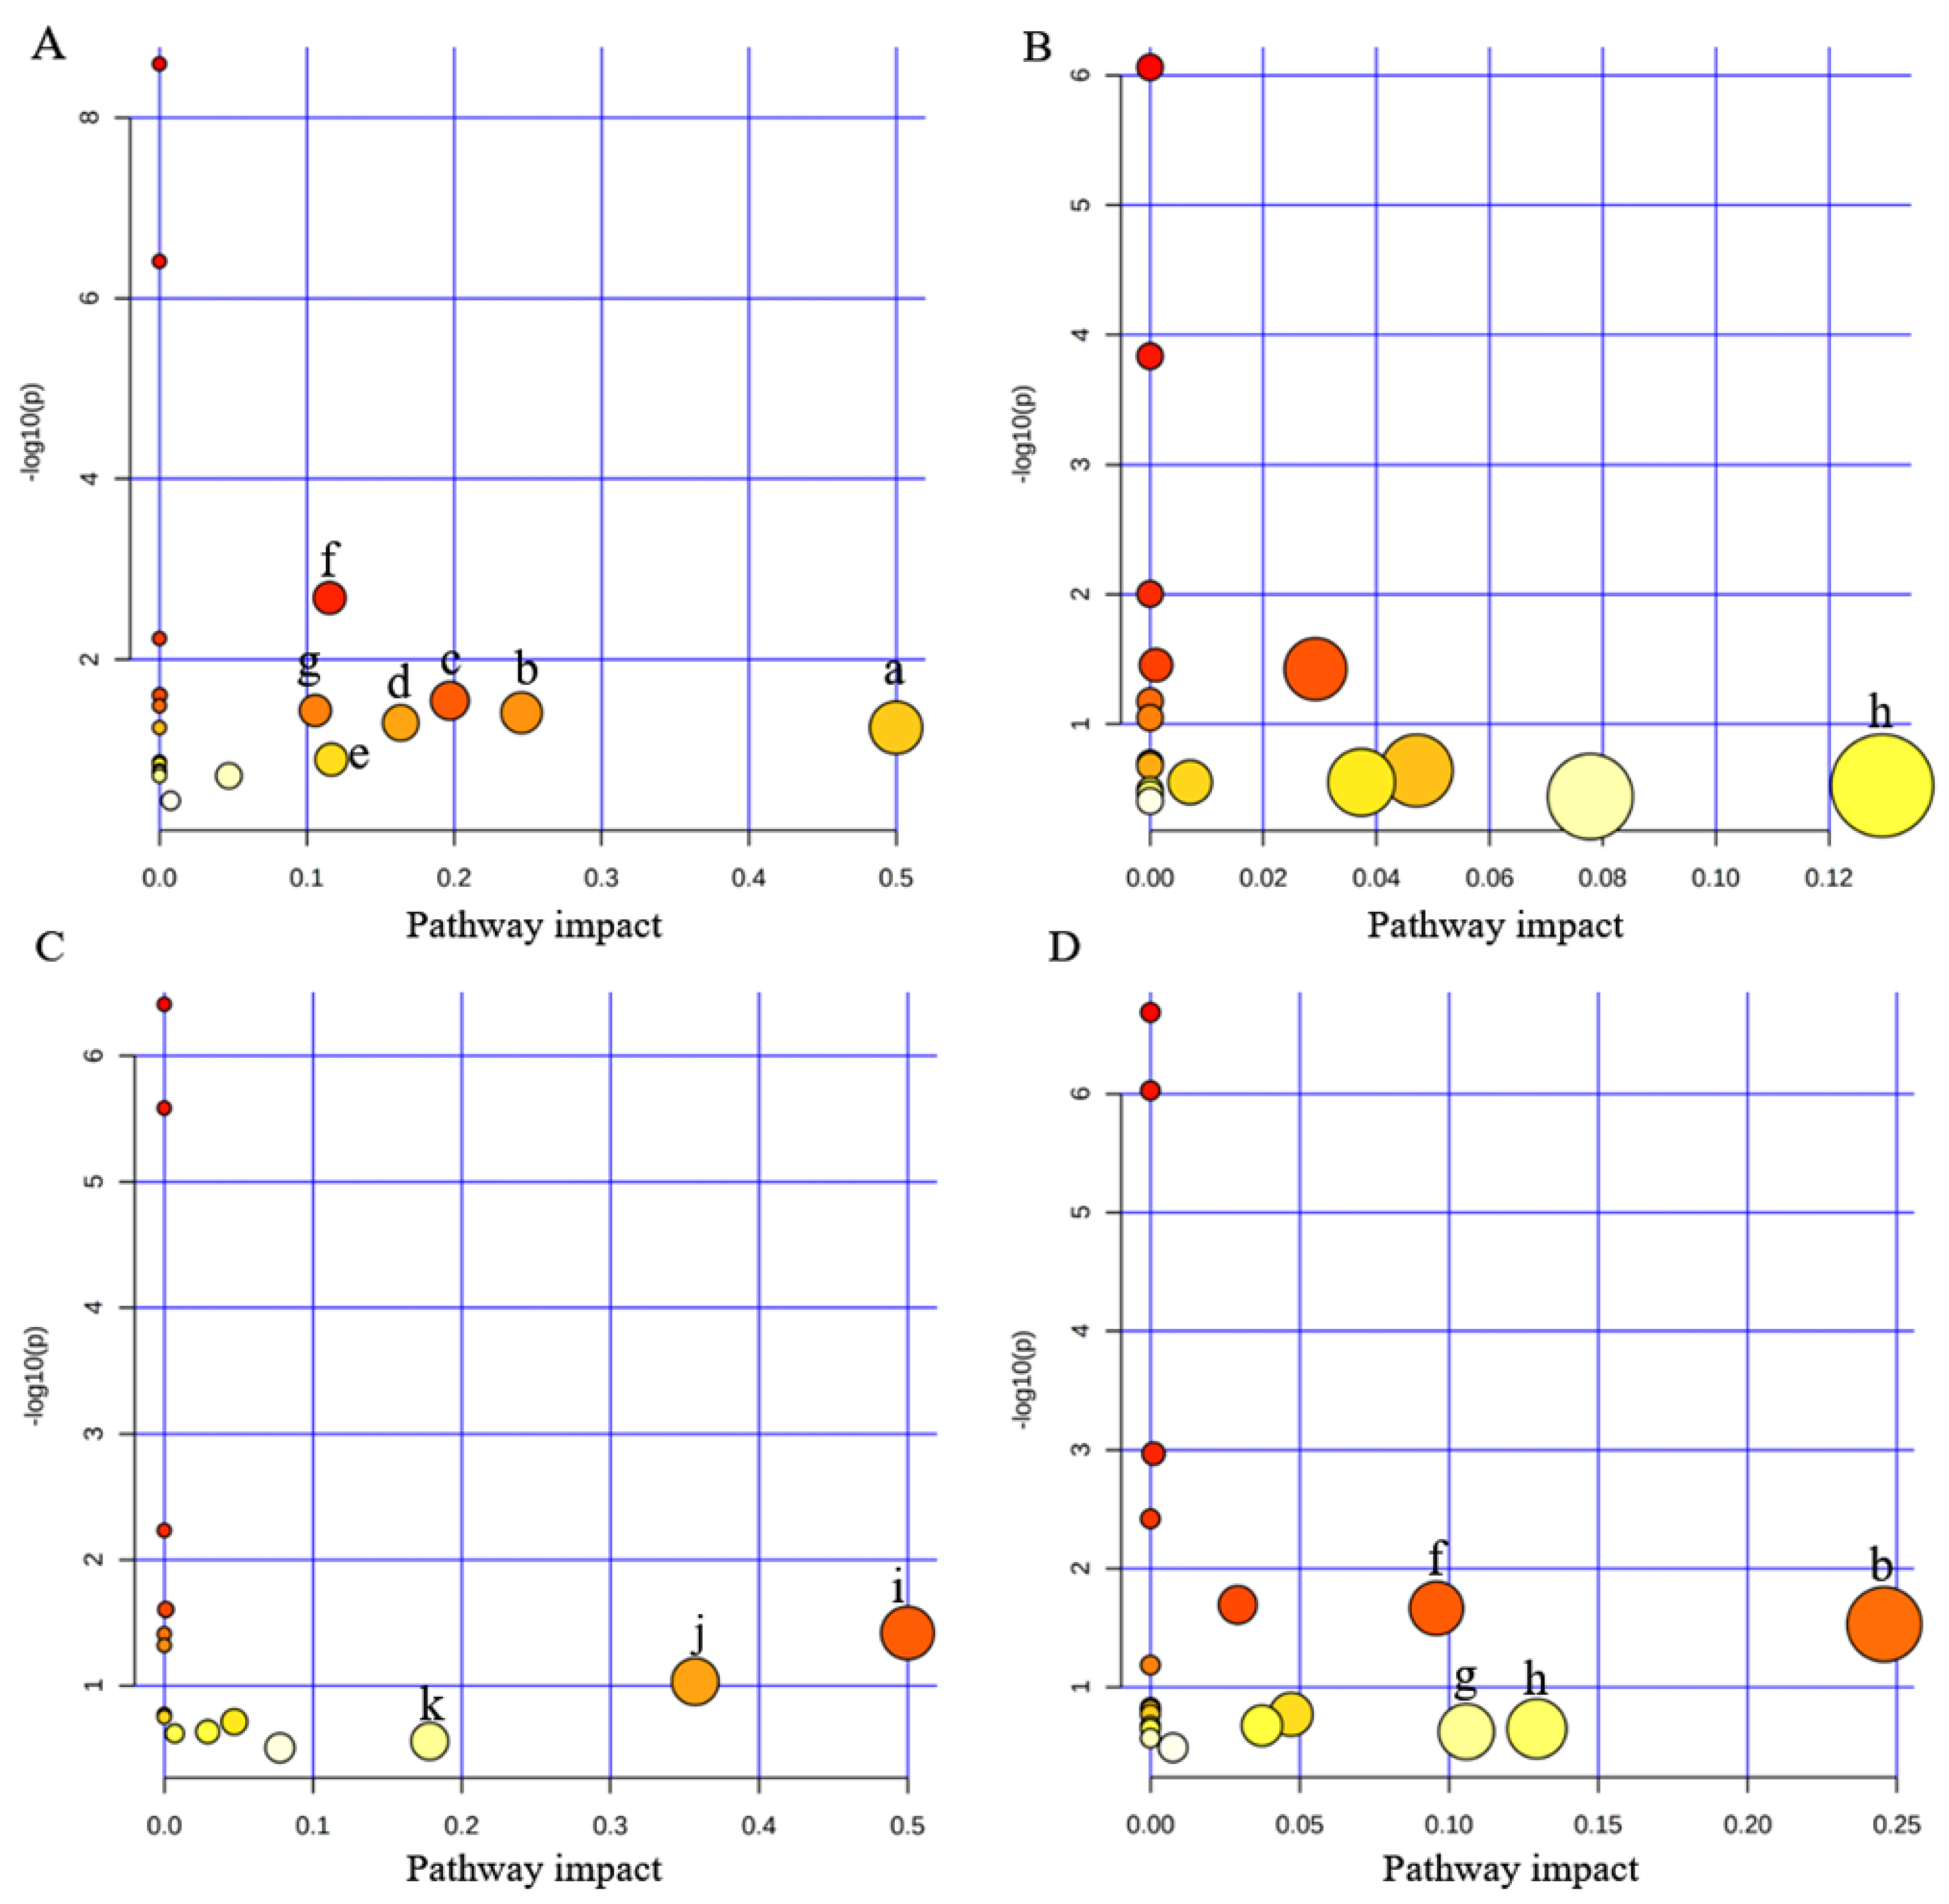
3.4. Disturbed Pathway Analysis
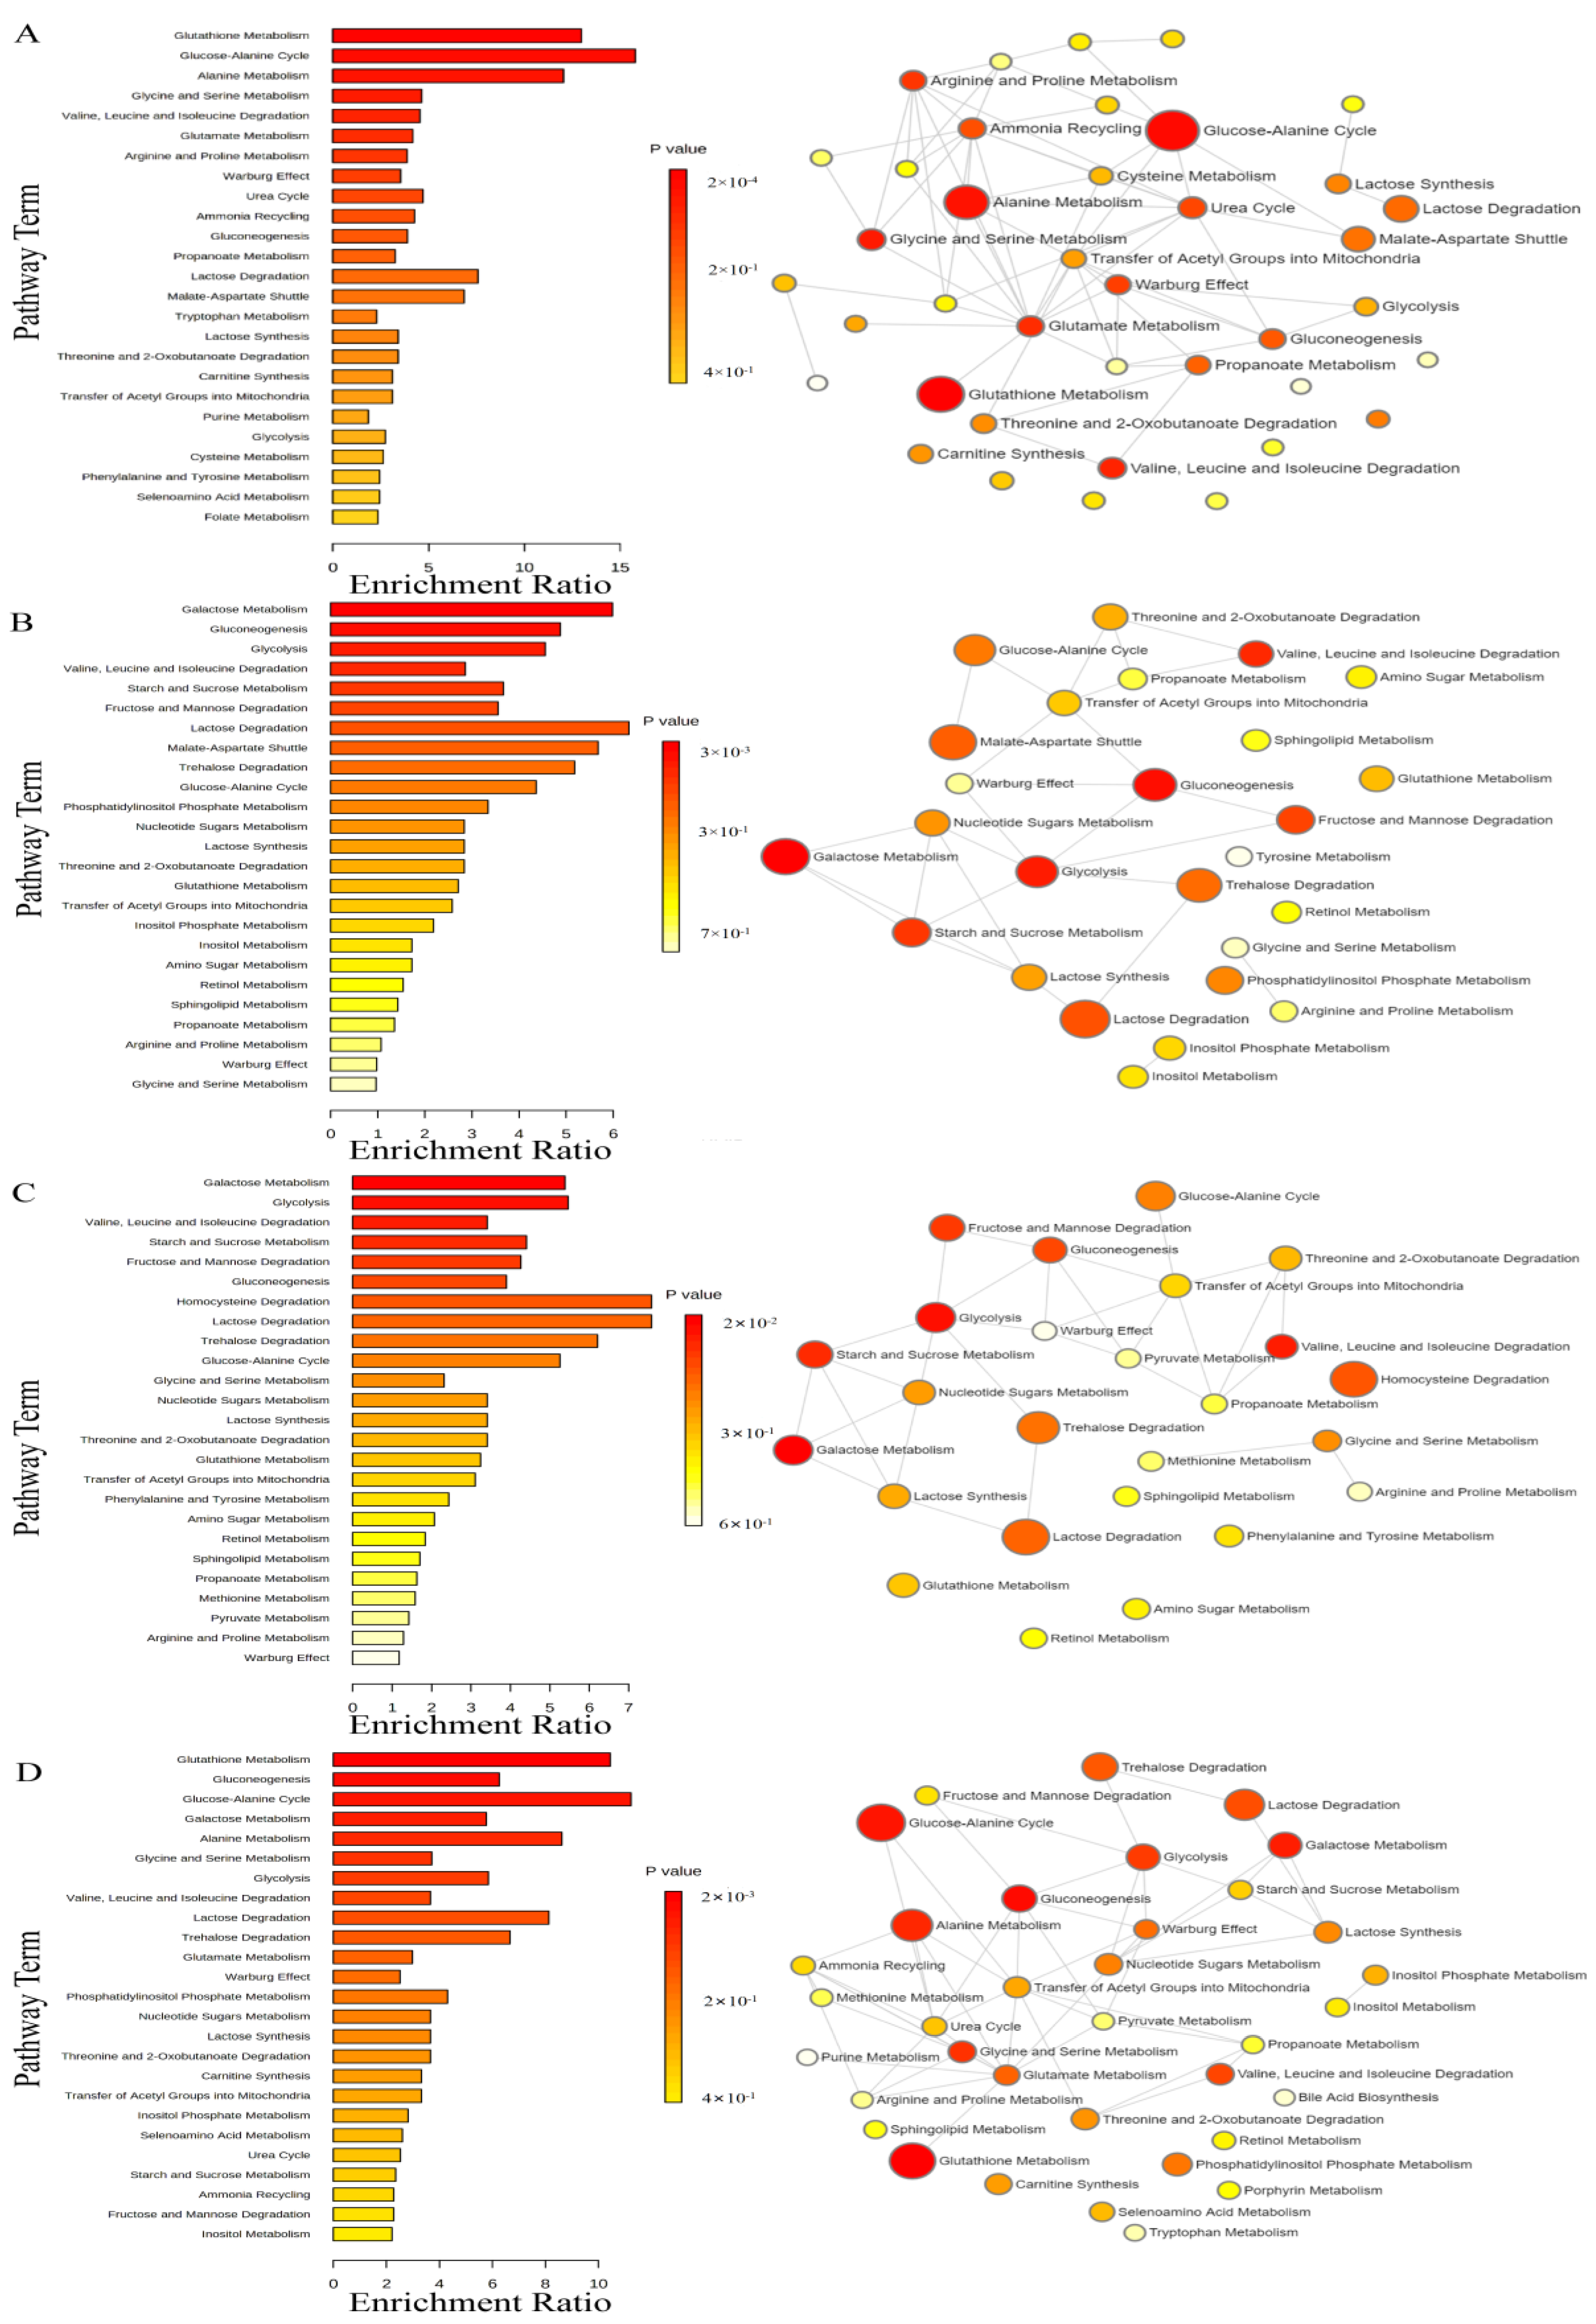
3.5. Metabolite Enrichment Analysis
4. Discussion
4.1. Cytotoxicity Analysis of eOPFRs Exposure
4.2. Analysis of eOPFR-Induced Metabolic Disorders
4.2.1. CDP Induces Oxidative Stress and Disrupts Amino Acid and Energy Metabolism
4.2.2. Metabolic Pathway Analysis of the Main Effects of RDP
4.2.3. TAP-Induced Peculiar Amino Acid Metabolism Disorders
4.2.4. Analysis of Metabolic Pathways Affected by PEPA
5. Conclusions
Supplementary Materials
Author Contributions
Funding
Institutional Review Board Statement
Informed Consent Statement
Data Availability Statement
Acknowledgments
Conflicts of Interest
References
- Chen, Y.Y.; Song, Y.Y.; Chen, Y.J.; Zhang, Y.H.; Li, R.J.; Wang, Y.J.; Qi, Z.H.; Chen, Z.F.; Cai, Z. Contamination profiles and potential health risks of organophosphate flame retardants in PM2.5 from Guangzhou and Taiyuan, China. Environ. Int. 2020, 134, 105343. [Google Scholar] [CrossRef] [PubMed]
- Sánchez-Marín, P.; Vidal-Liñán, L.; Fernández-González, L.E.; Montes, R.; Rodil, R.; Quintana, J.B.; Carrera, M.; Mateos, J.; Diz, A.P.; Beiras, R. Proteomic analysis and biochemical alterations in marine mussel gills after exposure to the organophosphate flame retardant TDCPP. Aquat. Toxicol. 2021, 230, 105688. [Google Scholar] [CrossRef] [PubMed]
- Blum, A.; Behl, M.; Birnbaum, L.S.; Diamond, M.L.; Phillips, A.; Singla, V.; Sipes, N.S.; Stapleton, H.M.; Venier, M. Organophosphate ester flame retardants: Are they a regrettable substitution for polybrominated diphenyl ethers? Environ. Sci. Technol. Lett. 2019, 6, 638–649. [Google Scholar] [CrossRef] [PubMed]
- Veen, I.; de Boer, J. Phosphorus flame retardants: Properties, production, environmental occurrence, toxicity and analysis. Chemosphere 2012, 88, 1119–1153. [Google Scholar] [CrossRef] [PubMed]
- Huang, J.N.; Ye, L.J.; Fang, M.L.; Su, G.Y. Industrial Production of Organophosphate Flame Retardants (OPFRs): Big Knowledge Gaps Need to Be Filled? Bull. Environ. Contam. Toxicol. 2022, 108, 809–818. [Google Scholar] [CrossRef] [PubMed]
- Hou, R.; Xu, Y.P.; Wang, Z.J. Review of OPFRs in animals and humans: Lbsorption, bioaccumulation, metabolism, and internal exposure research. Chemosphere 2016, 153, 78–90. [Google Scholar] [CrossRef] [PubMed]
- Tan, H.L.; Chen, D.; Peng, C.F.; Liu, X.T.; Wu, Y.; Li, X.; Du, R.; Wang, B.; Guo, Y.; Zeng, E.Y. Novel and traditional organophosphate esters in house dust from south China: Association with hand wipes and exposure estimation. Environ. Sci. Technol. 2018, 52, 11017–11026. [Google Scholar] [CrossRef] [PubMed]
- Mendy, A.; Percy, Z.; Braun, J.M.; Lanphear, B.; La Guardia, M.J.; Hale, R.; Yolton, K.; Chen, A. Exposure to dust organophosphate and replacement brominated flame retardants during infancy and risk of subsequent adverse respiratory outcomes. Environ. Res. 2023, 235, 116560. [Google Scholar] [CrossRef] [PubMed]
- Li, W.H.; Wang, Y.; Asimakopoulos, A.G.; Covaci, A.; Gevao, B.; Johnson-Restrepo, B.; Kumosani, T.A.; Malarvannan, G.; Moon, H.B.; Nakata, H.; et al. Organophosphate esters in indoor dust from 12 countries: Concentrations, composition profiles, and human exposure. Environ. Int. 2019, 133, 105178. [Google Scholar] [CrossRef]
- Yuan, S.W.; Han, Y.N.; Ma, M.; Rao, K.F.; Wang, Z.J.; Yang, R.; Liu, Y.H.; Zhou, X.H. Aryl-phosphorus-containing flame retardants induce oxidative stress, the p53-dependent DNA damage response and mitochondrial impairment in A549 cells. Environ. Pollut. 2019, 250, 58–67. [Google Scholar] [CrossRef]
- Huang, C.; Li, N.; Yuan, S.W.; Ji, X.Y.; Ma, M.; Rao, K.F.; Wang, Z.J. Aryl- and alkyl-phosphorus-containing flame retardants induced mitochondrial impairment and cell death in Chinese hamster ovary (CHO-k1) cells. Environ. Pollut. 2017, 230, 775–786. [Google Scholar] [CrossRef] [PubMed]
- Du, Z.K.; Wang, G.W.; Gao, S.X.; Wang, Z.Y. Aryl organophosphate flame retardants induced cardiotoxicity during zebrafish embryogenesis: By disturbing expression of the transcriptional regulators. Aquat. Toxicol. 2015, 161, 25–32. [Google Scholar] [CrossRef] [PubMed]
- Ji, X.Y.; Li, N.; Ma, M.; Rao, K.F.; Wang, Z.J. In vitro estrogen-disrupting effects of organophosphate flame retardants. Sci. Total Environ. 2020, 727, 138484. [Google Scholar] [CrossRef] [PubMed]
- Ballesteros-Gómez, A.; Van den Eede, N.; Covaci, A. In vitro human metabolism of the flame retardant resorcinol bis(diphenylphosphate) (RDP). Environ. Sci. Technol. 2015, 49, 3897–3904. [Google Scholar] [CrossRef] [PubMed]
- Ballesteros-Gómez, A.; Aragón, Á.; Van den Eede, N.; de Boer, J.; Covaci, A. Impurities of resorcinol bis(diphenyl phosphate) in plastics and dust collected on electric/electronic material. Environ. Sci. Technol. 2016, 50, 1934–1940. [Google Scholar] [CrossRef] [PubMed]
- Pawlowski, K.H.; Schartel, B. Flame retardancy mechanisms of triphenyl phosphate, resorcinol bis(diphenyl phosphate) and bisphenol a bis(diphenyl phosphate) in polycarbonate/acrylonitrile–butadiene–styrene blends. Polym. Int. 2007, 56, 1404–1414. [Google Scholar] [CrossRef]
- Chemspider. 2023. Available online: http://www.chemspider.com/Search.aspx. (accessed on 20 August 2023).
- Hou, M.; Fang, J.; Shi, Y.; Tang, S.; Dong, H.; Liu, Y.; Deng, F.; Giesy, J.P.; Godri-Pollitt, K.J.; Cai, Y.; et al. Exposure to organophosphate esters in elderly people: Relationships of OPE body burdens with indoor air and dust concentrations and food consumption. Environ. Int. 2021, 157, 106803. [Google Scholar] [CrossRef] [PubMed]
- Wazarkar, K.; Kathalewar, M.; Sabnis, A. Flammability behavior of unsaturated polyesters modified with novel phosphorous containing flame retardants. Polym. Compos. 2017, 38, 1483–1491. [Google Scholar] [CrossRef]
- Xia, J.; Madec, L.; Ma, L.; Ellis, L.D.; Qiu, W.; Nelson, K.J.; Lu, Z.; Dahn, J.R. Study of triallyl phosphate as an electrolyte additive for high voltage lithium-ion cells. J. Power Sources 2015, 295, 203–211. [Google Scholar] [CrossRef]
- Gangireddy, C.S.R.; Wang, X.; Kan, Y.C.; Song, L.; Hu, Y. Synthesis of a novel DOPO-based polyphosphoramide with high char yield and its application in flame-retardant epoxy resins. Polym. Int. 2019, 68, 936–945. [Google Scholar] [CrossRef]
- Sun, C.F.; Gao, M. A new intumescent flame retardant on epoxy resin. Appl. Mech. Mater. 2014, 665, 307–310. [Google Scholar]
- Shi, Y.C.; Wang, G.J. The novel epoxy/PEPA phosphate flame retardants: Synthesis, characterization and application in transparent intumescent fire resistant coatings. Prog. Org. Coat. 2016, 97, 1–9. [Google Scholar] [CrossRef]
- Hu, L.L.; Liu, J.J.; Zhang, W.H.; Wang, T.Y.; Zhang, N.; Lee, Y.H.; Lu, H.T. Functional metabolomics decipher biochemical functions and associated mechanisms underlie small-molecule metabolism. Mass Spectrom. Rev. 2020, 39, 417–433. [Google Scholar] [CrossRef] [PubMed]
- Liu, X.J.; Locasale, J.W. Metabolomics: A primer. Trends Biochem. Sci. 2017, 42, 274–284. [Google Scholar] [CrossRef] [PubMed]
- Zhang, A.H.; Sun, H.; Xu, H.Y.; Qiu, S.; Wang, X.J. Cell Metabolomics. OMICS A J. Integr. Biol. 2013, 17, 495–501. [Google Scholar] [CrossRef] [PubMed]
- Tang, R.G.; Ding, C.F.; Dang, F.; Ma, Y.B.; Wang, J.S.; Zhang, T.L.; Wang, X.X. NMR-based metabolic toxicity of low-level Hg exposure to earthworms. Environ. Pollut. 2018, 239, 428–437. [Google Scholar] [CrossRef] [PubMed]
- Beale, D.J.; Pinu, F.R.; Kouremenos, K.A.; Poojary, M.M.; Narayana, V.K.; Boughton, B.A.; Kanojia, K.; Dayalan, S.; Jones, O.A.H.; Dias, D.A. Review of recent developments in GC–MS approaches to metabolomics-based research. Metabolomics 2018, 14, 152. [Google Scholar] [CrossRef] [PubMed]
- Yue, S.Q.; Yu, J.; Kong, Y.; Chen, H.F.; Mao, M.F.; Ji, C.Y.; Shao, S.; Zhu, J.Q.; Gu, J.P.; Zhao, M.R. Metabolomic modulations of HepG2 cells exposed to bisphenol analogues. Environ. Int. 2019, 129, 59–67. [Google Scholar] [CrossRef]
- An, J.; Hu, J.W.; Shang, Y.; Zhong, Y.F.; Zhang, X.Y.; Yu, Z.Q. The cytotoxicity of organophosphate flame retardants on HepG2, A549 and Caco-2 cells. J. Environ. Sci. Health Part A Toxic/Hazard. Subst. Environ. Eng. 2016, 51, 980–988. [Google Scholar] [CrossRef]
- Yu, X.L.; Yin, H.; Peng, H.; Lu, G.N.; Liu, Z.H.; Dang, Z. OPFRs and BFRs induced A549 cell apoptosis by caspase-dependent mitochondrial pathway. Chemosphere 2019, 221, 693–702. [Google Scholar] [CrossRef] [PubMed]
- Dai, M.; Ma, T.; Niu, Y.; Zhang, M.M.; Zhu, Z.W.; Wang, S.M.; Liu, H.M. Analysis of low-molecular-weight metabolites in stomach cancer cells by a simplified and inexpensive GC/MS metabolomics method. Anal. Bioanal. Chem. 2020, 412, 2981–2991. [Google Scholar] [CrossRef] [PubMed]
- Yu, L.L.; Wu, J.P.; Zhai, Q.X.; Tian, F.W.; Zhao, J.X.; Zhang, H.; Chen, W. Metabolomic analysis reveals the mechanism of aluminum cytotoxicity in HT-29 cells. PeerJ 2019, 7, e7524. [Google Scholar] [CrossRef] [PubMed]
- Morita, K.; Arimochi, H.; Ohnishi, Y. In vitro cytotoxicity of 4-methylcatechol in murine tumor cells: Induction of apoptotic cell death by extracellular pro-oxidant action. J. Pharmacol. Exp. Ther. 2003, 306, 317–323. [Google Scholar] [CrossRef] [PubMed]
- Payton, F.; Bose, R.; Alworth, W.L.; Kumar, A.P.; Ghosh, R. 4-Methylcatechol-induced oxidative stress induces intrinsic apoptotic pathway in metastatic melanoma cells. Biochem. Pharmacol. 2011, 81, 1211–1218. [Google Scholar] [CrossRef] [PubMed]
- Greenwood, S.M.; Connolly, C.N. Dendritic and mitochondrial changes during glutamate excitotoxicity. Neuropharmacology 2007, 53, 891–898. [Google Scholar] [CrossRef] [PubMed]
- Griffith, O.W. Biologic and pharmacologic regulation of mammalian glutathione synthesis. Free. Radic. Biol. Med. 1999, 27, 922–935. [Google Scholar] [CrossRef] [PubMed]
- Fan, W.; Hou, J.B.; Zhu, W.Y.; Zhang, S.Y.; Shao, K.D.; Quan, F.Y.; Chen, W. The mechanism of the preventive effect of Shen’an capsule on the calcium oxalate crystal-induced early renal injury based on metabolomics. Biomed. Chromatogr. 2018, 32, e4374. [Google Scholar] [CrossRef] [PubMed]
- Bansal, A.; Simon, M.C. Glutathione metabolism in cancer progression and treatment resistance. J. Cell Biol. 2018, 217, 2291–2298. [Google Scholar] [CrossRef] [PubMed]
- Song, Y.Q.; Hu, T.T.; Gao, H.; Zhai, J.H.; Gong, J.W.; Zhang, Y.M.; Tao, L.N.; Sun, J.M.; Li, Z.Y.; Qu, X.Y. Altered metabolic profiles and biomarkers associated with astragaloside IV-mediated protection against cisplatin-induced acute kidney injury in rats: An HPLC-TOF/MS-based untargeted metabolomics study. Biochem. Pharmacol. 2021, 183, 114299. [Google Scholar] [CrossRef]
- Swanson, M.A.; Miller, K.; Young, S.P.; Tong, S.H.; Ghaloul Gonzalez, L.; Neira Fresneda, J.; Schlichting, L.; Peck, C.; Gabel, L.; Friederich, M.W.; et al. Cerebrospinal fluid amino acids glycine, serine, and threonine in nonketotic hyperglycinemia. J. Inherit. Metab. Dis. 2022, 45, 734–747. [Google Scholar] [CrossRef]
- Kalhan, S.C.; Hanson, R.W. Resurgence of Serine: An Often Neglected but Indispensable Amino Acid. J. Biol. Chem. 2012, 287, 19786–19791. [Google Scholar] [CrossRef] [PubMed]
- Thureen, P.J.; Narkewicz, M.R.; Battaglia, F.C.; Tjoa, S.; Fennessey, P.V. Pathways of serine and glycine metabolism in primary culture of ovine fetal hepatocytes. Pediatr. Res. 1995, 38, 775–782. [Google Scholar] [CrossRef] [PubMed]
- Malinovsky, A.V. Reason for indispensability of threonine in humans and other mammals in comparative aspect. Biochemistry 2017, 82, 1055–1060. [Google Scholar] [CrossRef] [PubMed]
- Wang, H.; McNeil, Y.R.; Yeo, T.W.; Anstey, N.M. Simultaneous determination of multiple amino acids in plasma in critical illness by high performance liquid chromatography with ultraviolet and fluorescence detection. J. Chromatogr. B 2013, 940, 53–58. [Google Scholar] [CrossRef]
- Cummings, N.E.; Williams, E.M.; Kasza, I.; Konon, E.N.; Schaid, M.D.; Schmidt, B.A.; Poudel, C.; Sherman, D.S.; Yu, D.Y.; Arriola Apelo, S.I.; et al. Restoration of metabolic health by decreased consumption of branched-chain amino acids. J. Physiol.-Lond. 2018, 596, 623–645. [Google Scholar] [CrossRef] [PubMed]
- Yu, D.Y.; Richardson, N.E.; Green, C.L.; Spicer, A.B.; Murphy, M.E.; Flores, V.; Jang, C.; Kasza, I.; Nikodemova, M.; Wakai, M.H.; et al. The adverse metabolic effects of branched-chain amino acids are mediated by isoleucine and valine. Cell Metabolism 2021, 33, 905–922. [Google Scholar] [CrossRef] [PubMed]
- Yang, J.; Pan, C.; Zhang, J.M.; Sui, X.J.; Zhu, Y.N.; Wen, C.Y.; Zhang, L. Exploring the potential of biocompatible osmoprotectants as highly efficient cryoprotectants. ACS Appl. Mater. Interfaces 2017, 9, 42516–42524. [Google Scholar] [CrossRef] [PubMed]
- Petersen, K.F.; Dufour, S.; Cline, G.W.; Shulman, G.I. Regulation of hepatic mitochondrial oxidation by glucose-alanine cycling during starvation in humans. J. Clin. Investig. 2019, 129, 4671–4675. [Google Scholar] [CrossRef] [PubMed]
- Guo, W.; Tan, H.Y.; Li, S.; Wang, N.; Feng, Y.B. Glutamic-pyruvic transaminase 1 facilitates alternative fuels for hepatocellular carcinoma growth—A small molecule inhibitor, berberine. Cancers 2020, 12, 1854. [Google Scholar] [CrossRef]
- Liberti, M.V.; Locasale, J.W. The warburg effect: How does it benefit cancer cells? Trends Biochem. Sci. 2016, 41, 211–218. [Google Scholar] [CrossRef]
- Tan Allen, K.; Chin-Sinex, H.; DeLuca, T.; Pomerening, J.R.; Sherer, J.; Watkins, J.B.; Foley, J.; Jesseph, J.M.; Mendonca, M.S. Dichloroacetate alters Warburg metabolism, inhibits cell growth, and increases the X-ray sensitivity of human A549 and H1299 NSC lung cancer cells. Free. Radic. Biol. Med. 2015, 89, 263–273. [Google Scholar] [CrossRef]
- Yang, W.Q.; Zhao, F.; Fang, Y.J.; Li, L.; Li, C.N.; Ta, N. 1H-nuclear magnetic resonance metabolomics revealing the intrinsic relationships between neurochemical alterations and neurobehavioral and neuropathological abnormalities in rats exposed to tris(2-chloroethyl) phosphate. Chemosphere 2018, 200, 649–659. [Google Scholar] [CrossRef] [PubMed]
- Coelho, A.I.; Berry, G.T.; Rubio-Gozalbo, M.E. Galactose metabolism and health. Curr. Opin. Clin. Nutr. Metab. Care 2015, 18, 422–427. [Google Scholar] [CrossRef] [PubMed]
- Leithner, K. New roles for gluconeogenesis in vertebrates. Curr. Opin. Syst. Biol. 2021, 28, 100389. [Google Scholar] [CrossRef]
- Stark, R.; Kibbey, R.G. The mitochondrial isoform of phosphoenolpyruvate carboxykinase (PEPCK-M) and glucose homeostasis: Has it been overlooked? Biochim. Et Biophys. Acta (BBA)—Gen. Subj. 2014, 1840, 1313–1330. [Google Scholar] [CrossRef]
- Grasmann, G.; Smolle, E.; Olschewski, H.; Leithner, K. Gluconeogenesis in cancer cells—Repurposing of a starvation-induced metabolic pathway? Biochimica et Biophysica Acta (BBA)—Reviews on Cancer 2019, 1872, 24–36. [Google Scholar] [CrossRef]
- Chou, Y.J.; Kober, K.M.; Yeh, K.H.; Cooper, B.A.; Kuo, C.H.; Lin, B.R.; Kuo, T.C.; Tseng, Y.J.; Miaskowski, C.; Shun, S.C. A pilot study of metabolomic pathways associated with fatigue in patients with colorectal cancer receiving chemotherapy. Eur. J. Oncol. Nurs. 2022, 56, 102096. [Google Scholar] [CrossRef]
- Jiao, Z.X.; Lu, Z.Y.; Peng, Y.; Xu, C.; Lou, Y.G.; Wang, G.J.; Aa, J.Y.; Zhang, Y. A quantitative metabolomics assay targeting 14 intracellular metabolites associated with the methionine transsulfuration pathway using LC–MS/MS in breast cancer cells. J. Chromatogr. B 2022, 1205, 123314. [Google Scholar] [CrossRef]
- Chen, P.; Tang, Y.; He, Q.Q.; Liu, L.S.; Zhou, Z.Y.; Song, Y.; Zhang, N.; Wang, B.Y.; Zhou, H.Q.; Shi, H.P.; et al. A sensitive UPLC-MS/MS method for simultaneous quantification of one-carbon metabolites & co-factors in human plasma. J. Pharm. Biomed. Anal. 2022, 219, 114944. [Google Scholar]
- Shi, Z.H.; He, J.T.; Yao, T.T.; Chang, W.B. RP-HPLC determination of octanol–water partition coefficients for bioactive compounds from chinese herbal medicines. J. Liq. Chromatogr. Relat. Technol. 2007, 27, 465–479. [Google Scholar] [CrossRef]


| Abbr. | CAS | MF | Log Kow | BCFs | Structure |
|---|---|---|---|---|---|
| CDP | 26444-49-5 | C19H17O4P | 5.25 | 1019.28 | 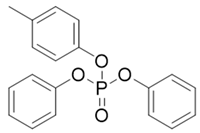 |
| RDP | 57583-54-7 | C30H24O8P2 | 7.41 | 15,546.47 | 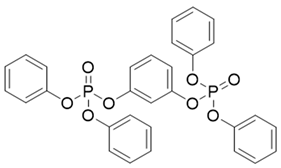 |
| TAP | 1623-19-4 | C9H15O4P | 1.94 | 17.85 | 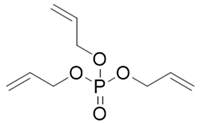 |
| PEPA | 5301-78-0 | C5H9O5P | −1.76 | 1.00 |  |
Disclaimer/Publisher’s Note: The statements, opinions and data contained in all publications are solely those of the individual author(s) and contributor(s) and not of MDPI and/or the editor(s). MDPI and/or the editor(s) disclaim responsibility for any injury to people or property resulting from any ideas, methods, instructions or products referred to in the content. |
© 2024 by the authors. Licensee MDPI, Basel, Switzerland. This article is an open access article distributed under the terms and conditions of the Creative Commons Attribution (CC BY) license (https://creativecommons.org/licenses/by/4.0/).
Share and Cite
Sun, M.; Chang, X.; Gao, Y.; Zou, S.; Wang, S.; Liu, H. GC/MS-Based Metabolomic Analysis of A549 Cells Exposed to Emerging Organophosphate Flame Retardants. Toxics 2024, 12, 384. https://doi.org/10.3390/toxics12060384
Sun M, Chang X, Gao Y, Zou S, Wang S, Liu H. GC/MS-Based Metabolomic Analysis of A549 Cells Exposed to Emerging Organophosphate Flame Retardants. Toxics. 2024; 12(6):384. https://doi.org/10.3390/toxics12060384
Chicago/Turabian StyleSun, Mengyao, Xiao Chang, Ying Gao, Sisi Zou, Shaomin Wang, and Hongmin Liu. 2024. "GC/MS-Based Metabolomic Analysis of A549 Cells Exposed to Emerging Organophosphate Flame Retardants" Toxics 12, no. 6: 384. https://doi.org/10.3390/toxics12060384
APA StyleSun, M., Chang, X., Gao, Y., Zou, S., Wang, S., & Liu, H. (2024). GC/MS-Based Metabolomic Analysis of A549 Cells Exposed to Emerging Organophosphate Flame Retardants. Toxics, 12(6), 384. https://doi.org/10.3390/toxics12060384