

Assessment of Transboundary PM2.5 from Biomass Burning in Northern Thailand Using the WRF-Chem Model


Abstract
:1. Introduction
2. Methodology
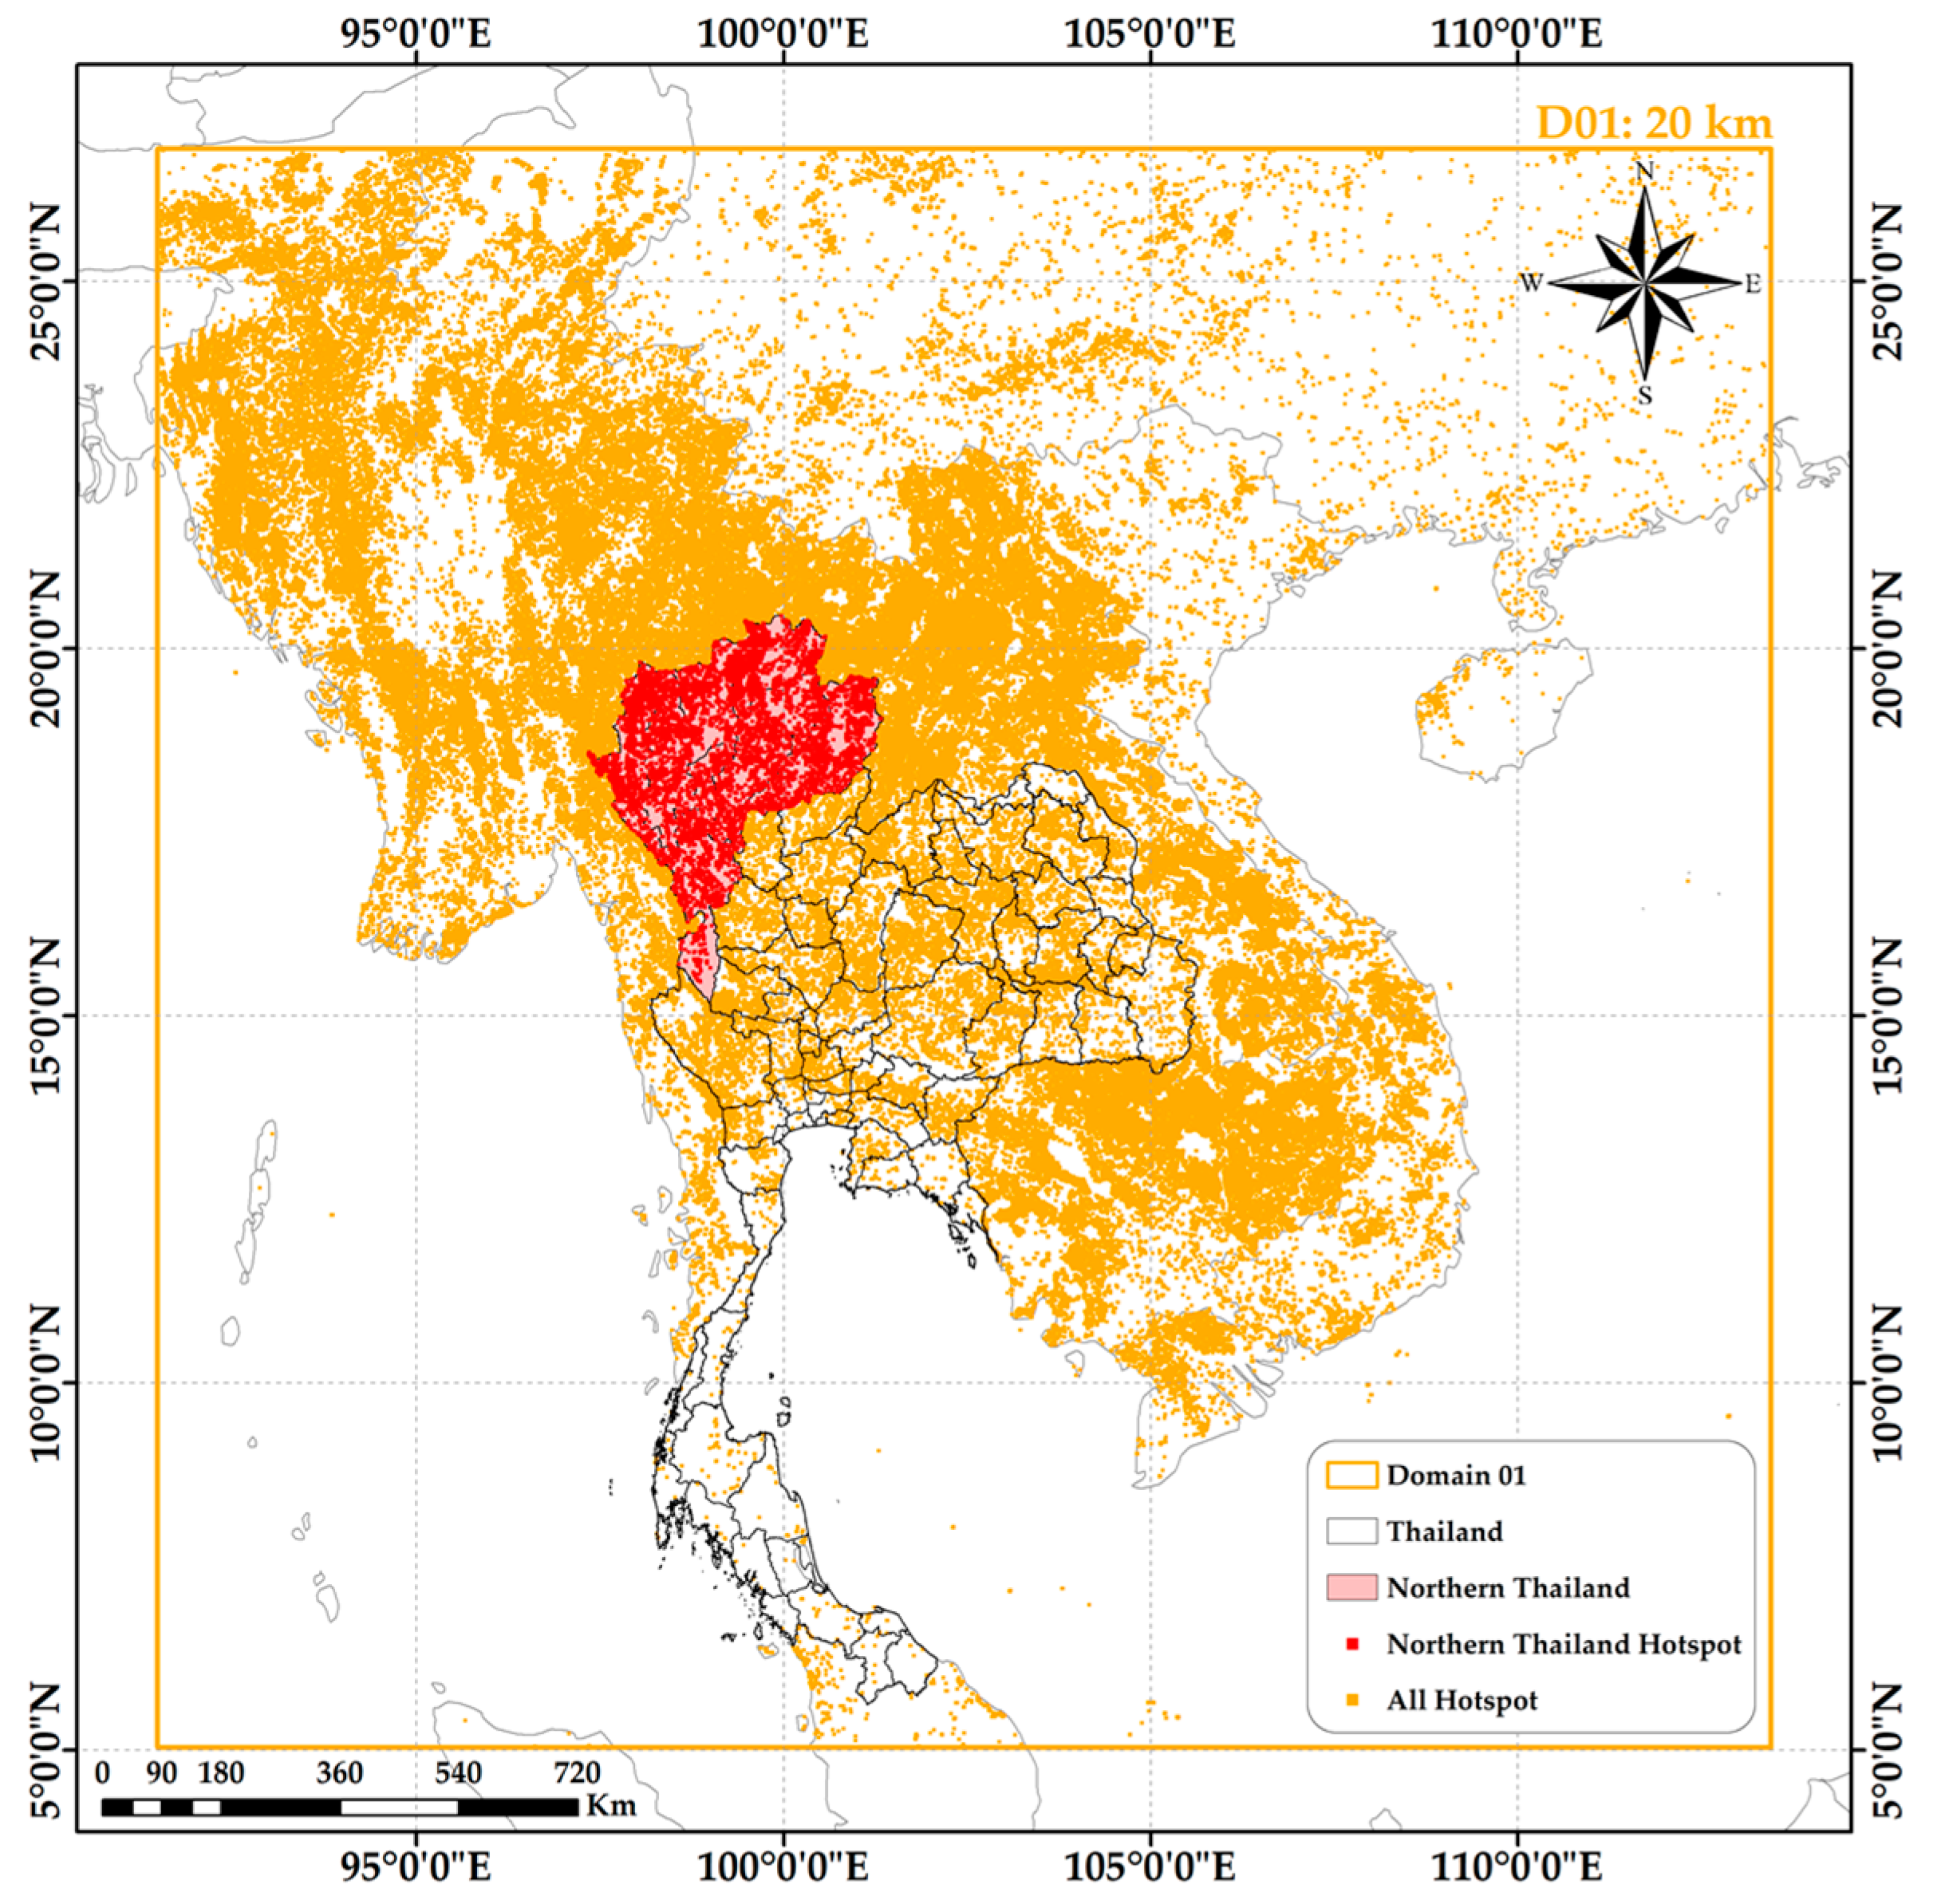
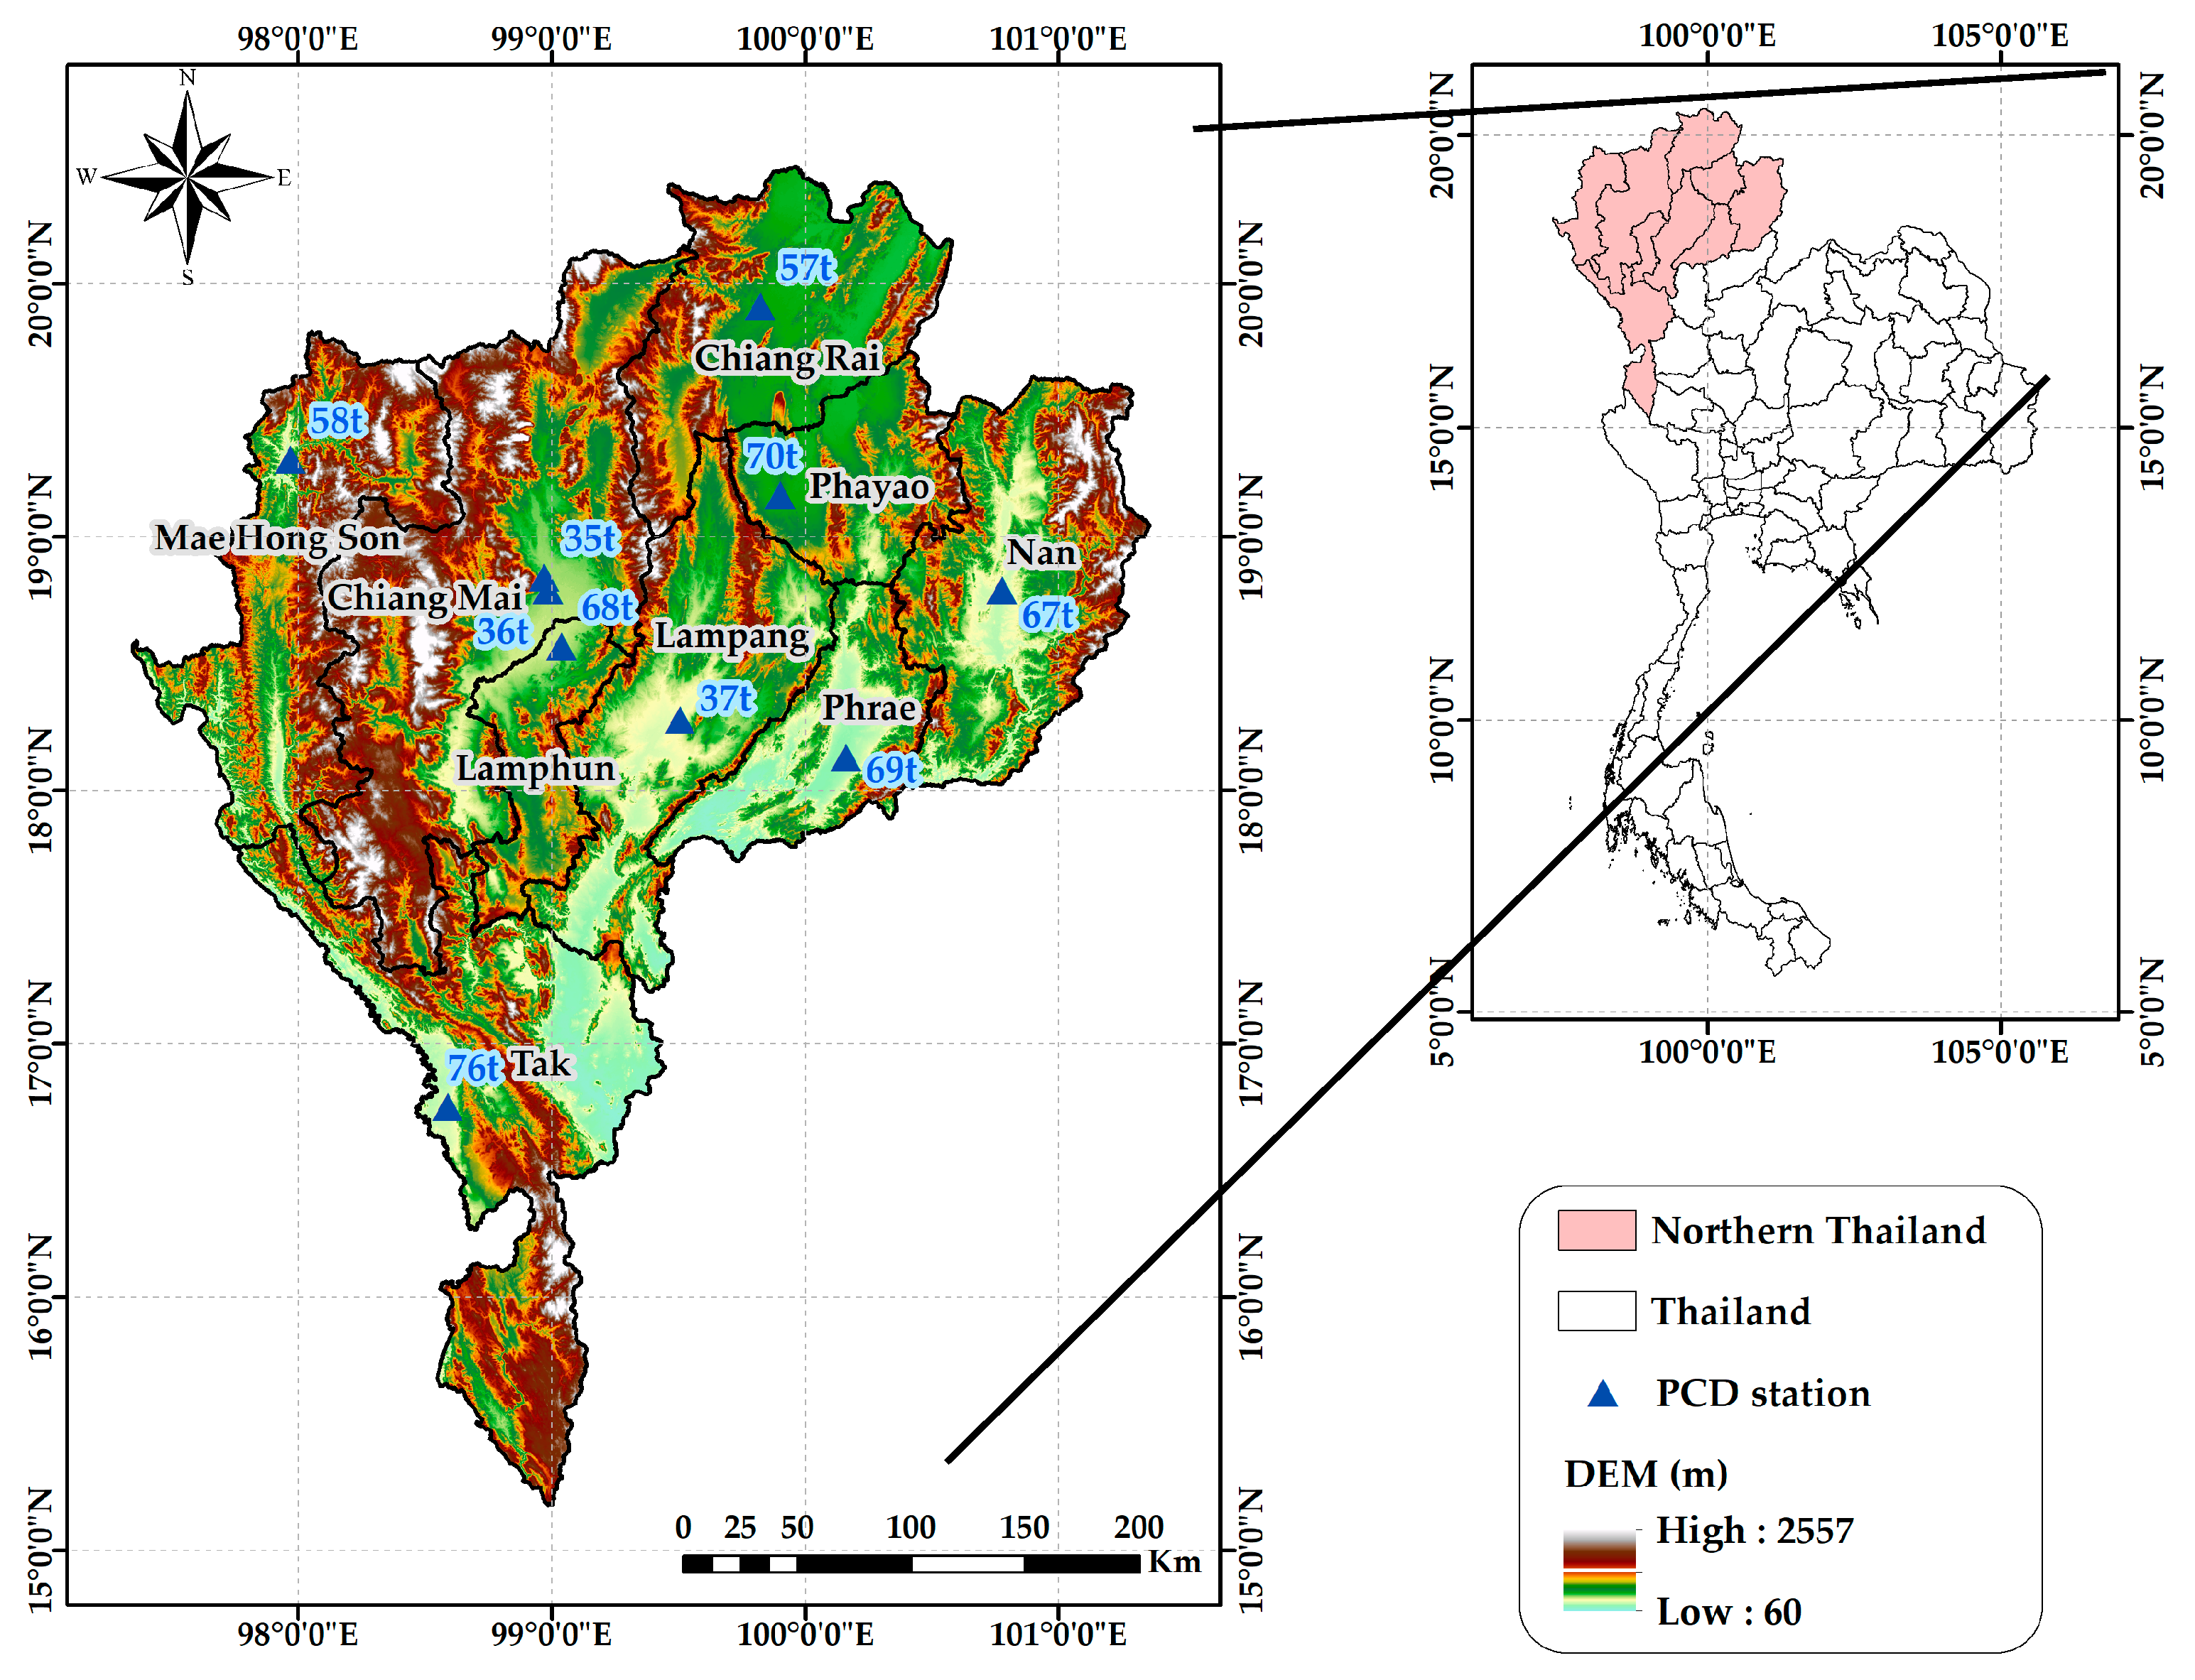
2.1. Study Area
2.2. Study Period
2.3. Data Utilized
2.3.1. Fire Hotspots
2.3.2. PM2.5 Observations
2.4. WRF-Chem Model Utilization
2.4.1. Model Setup
2.4.2. Emission Inventories
2.4.3. Simulation Scenarios
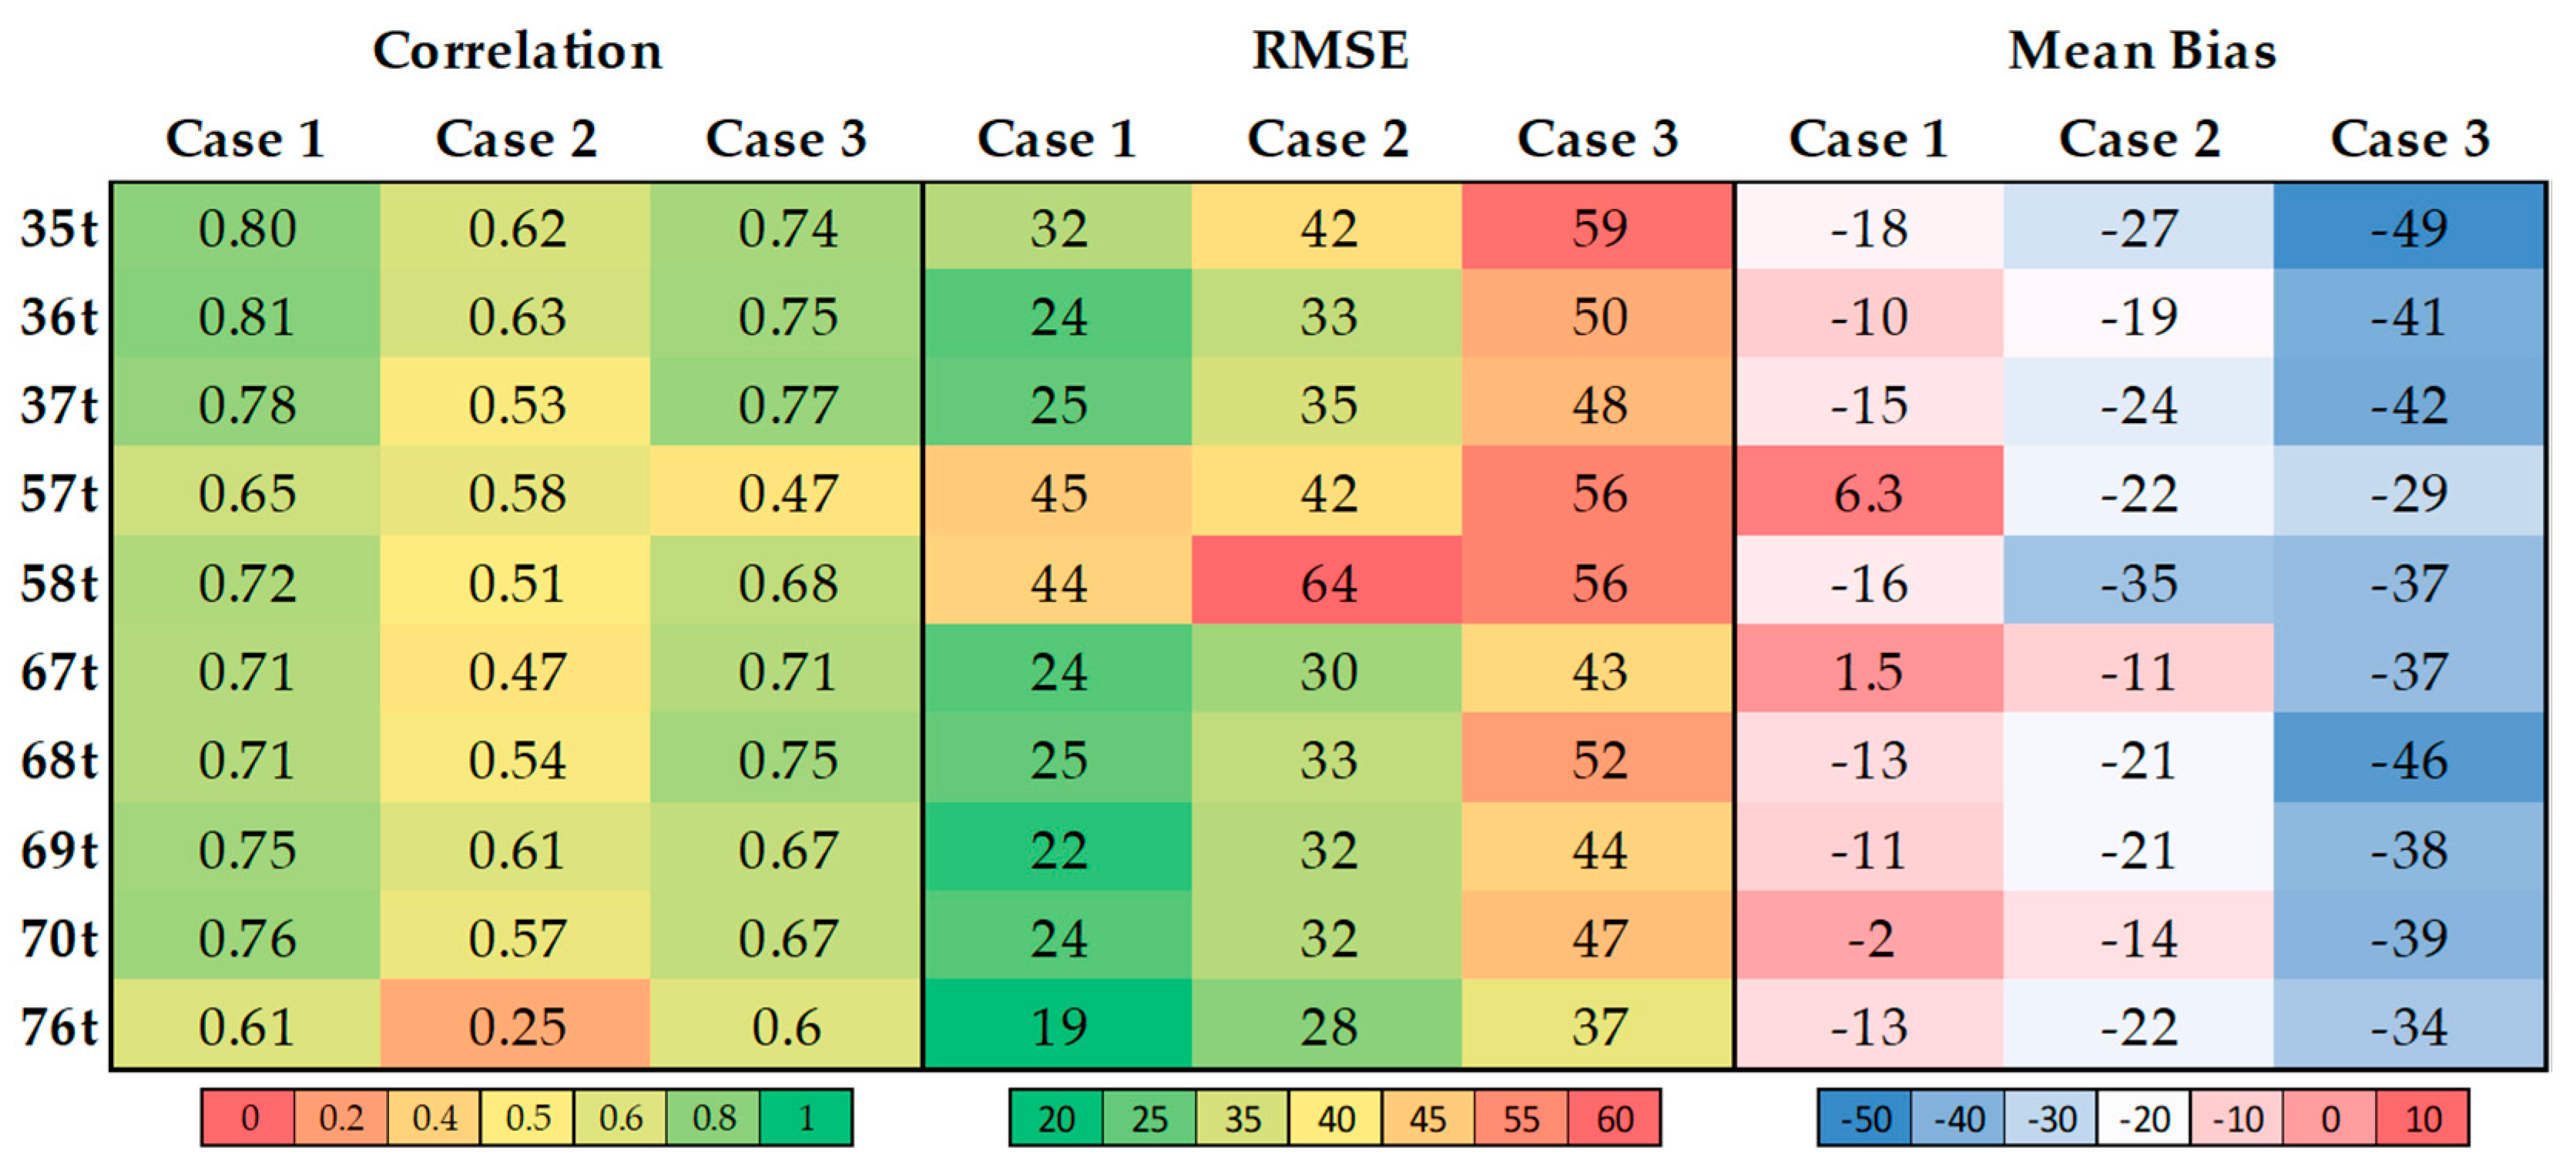
2.4.4. Validation
2.4.5. Calculation of Biomass Burning TB PM2.5
2.4.6. Analysis
2.5. Quantification of Temporal Persistence and Health Risks of Transboundary PM2.5
3. Results
3.1. WRF-Chem Model Evaluation
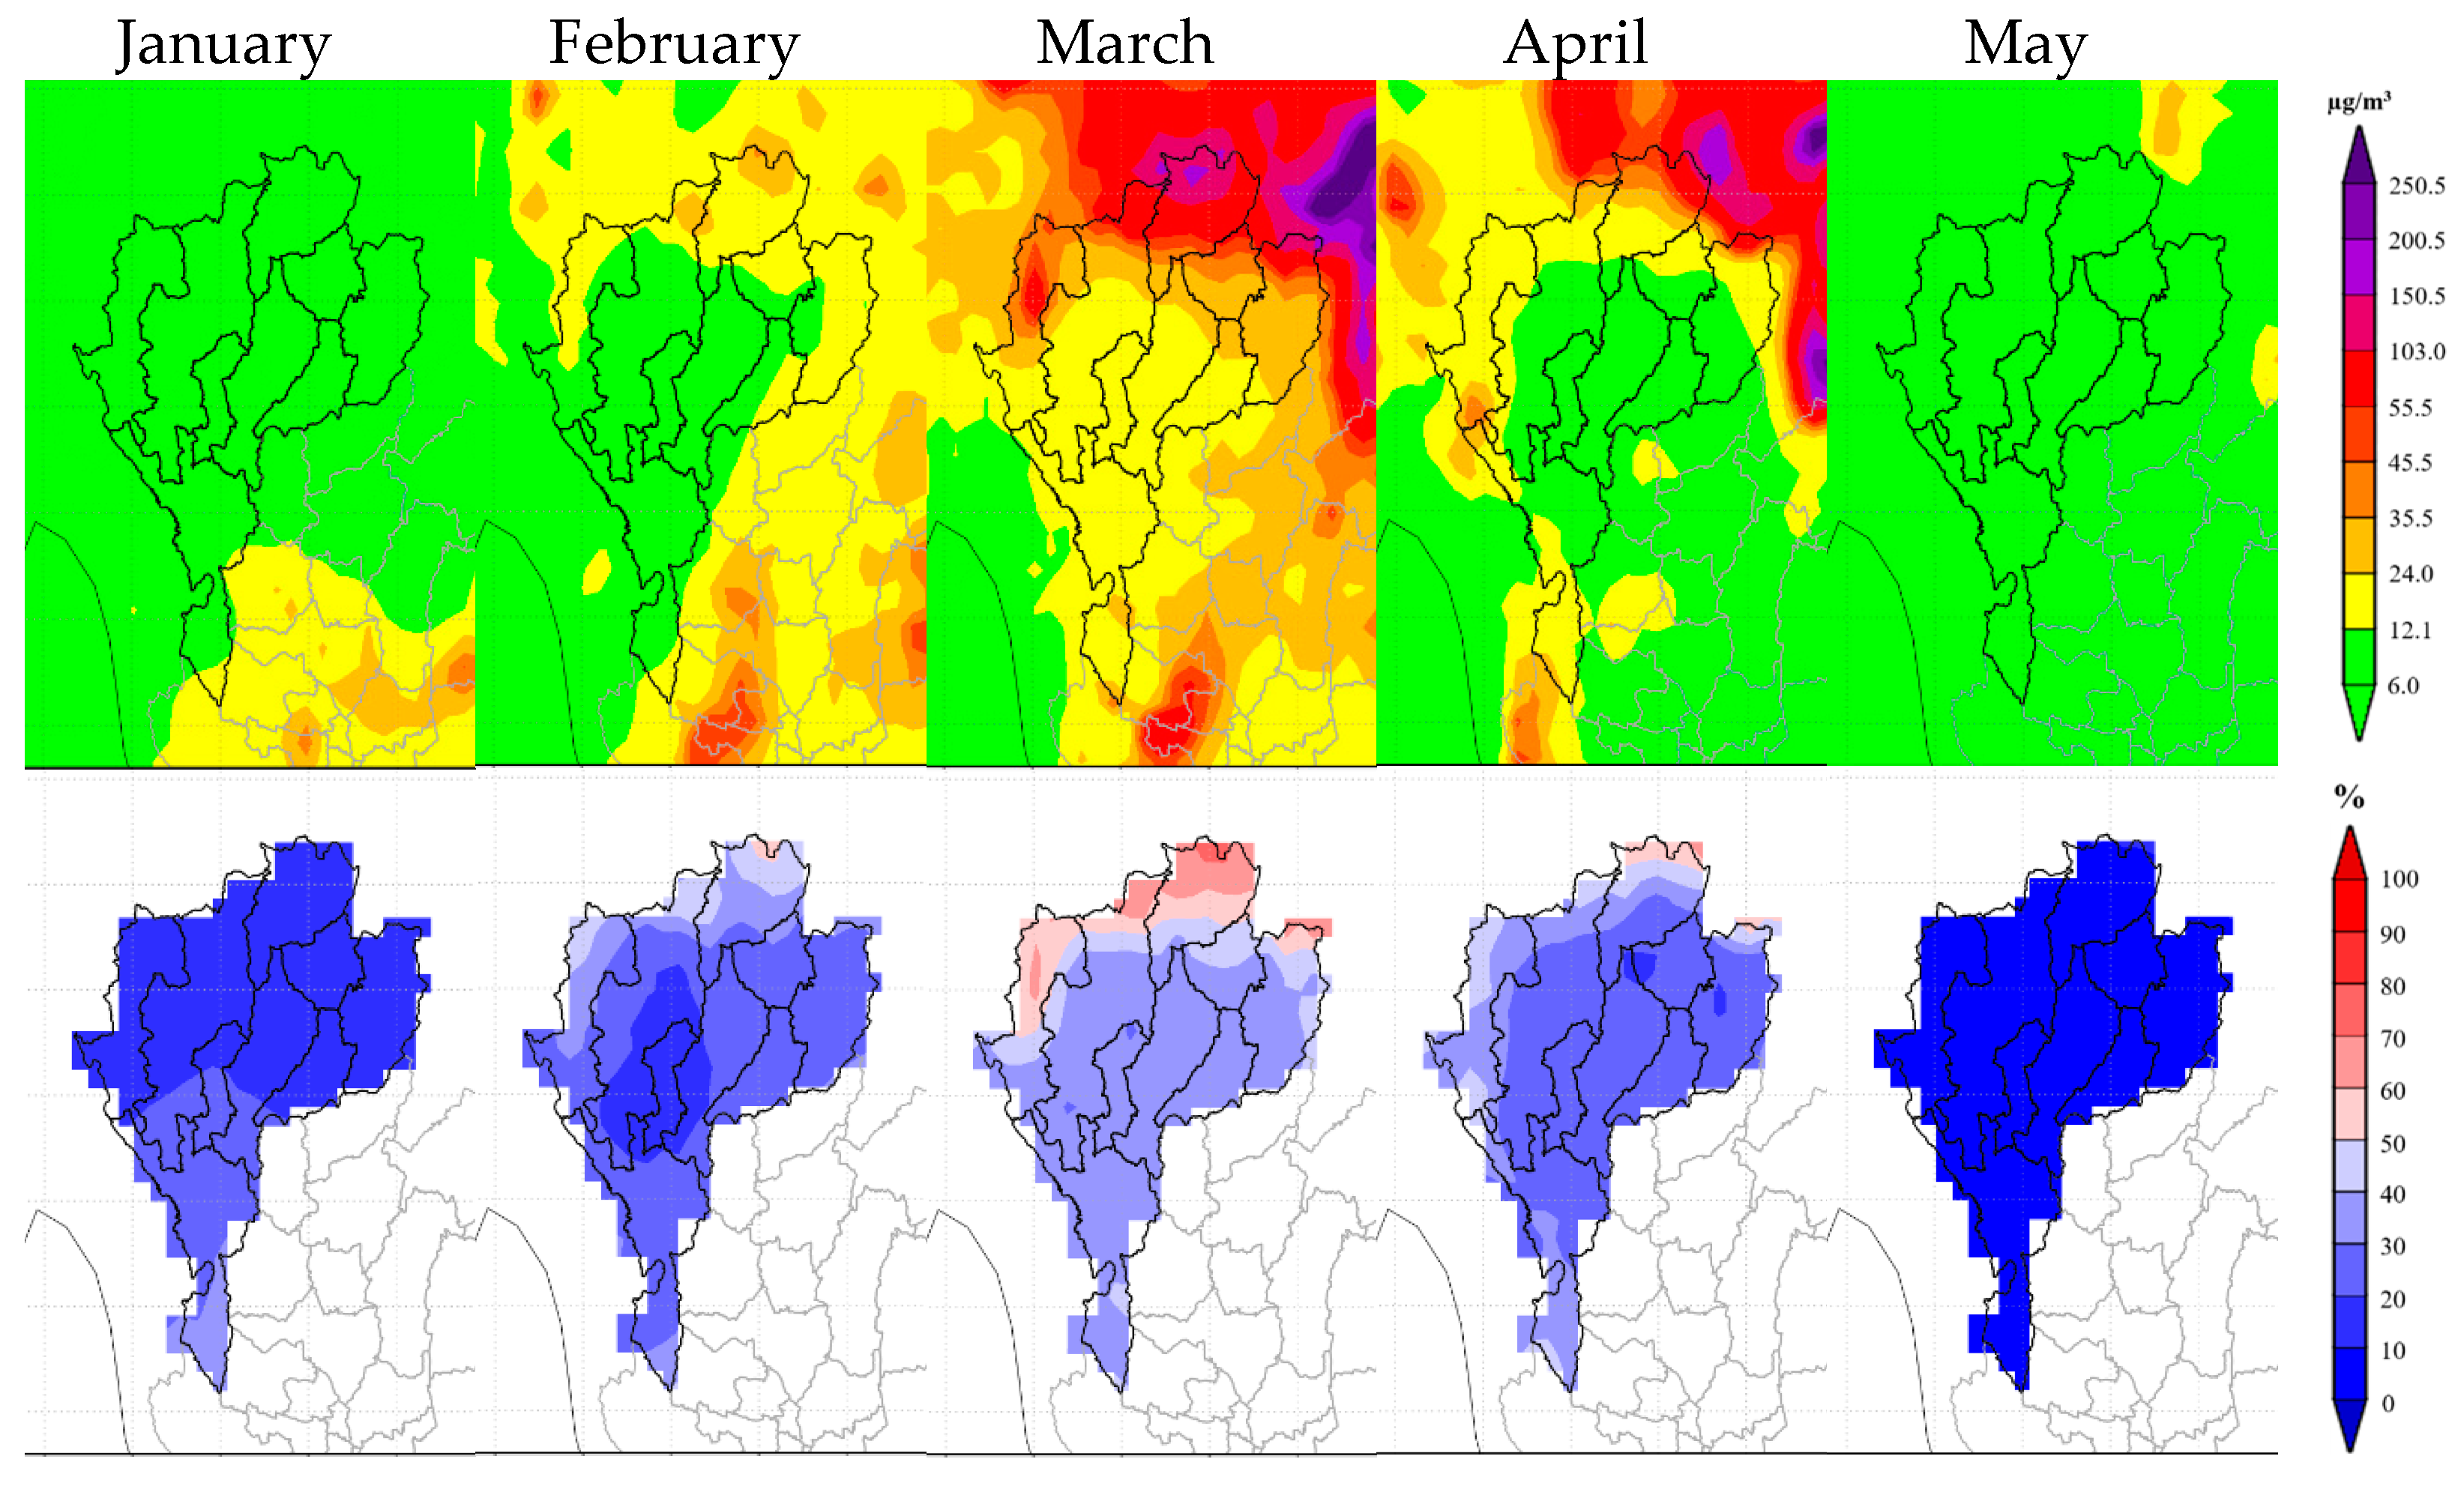
3.2. Spatial Pattern Analysis of Transboundary Biomass Burning PM2.5 in Nine Northern Provinces of Thailand
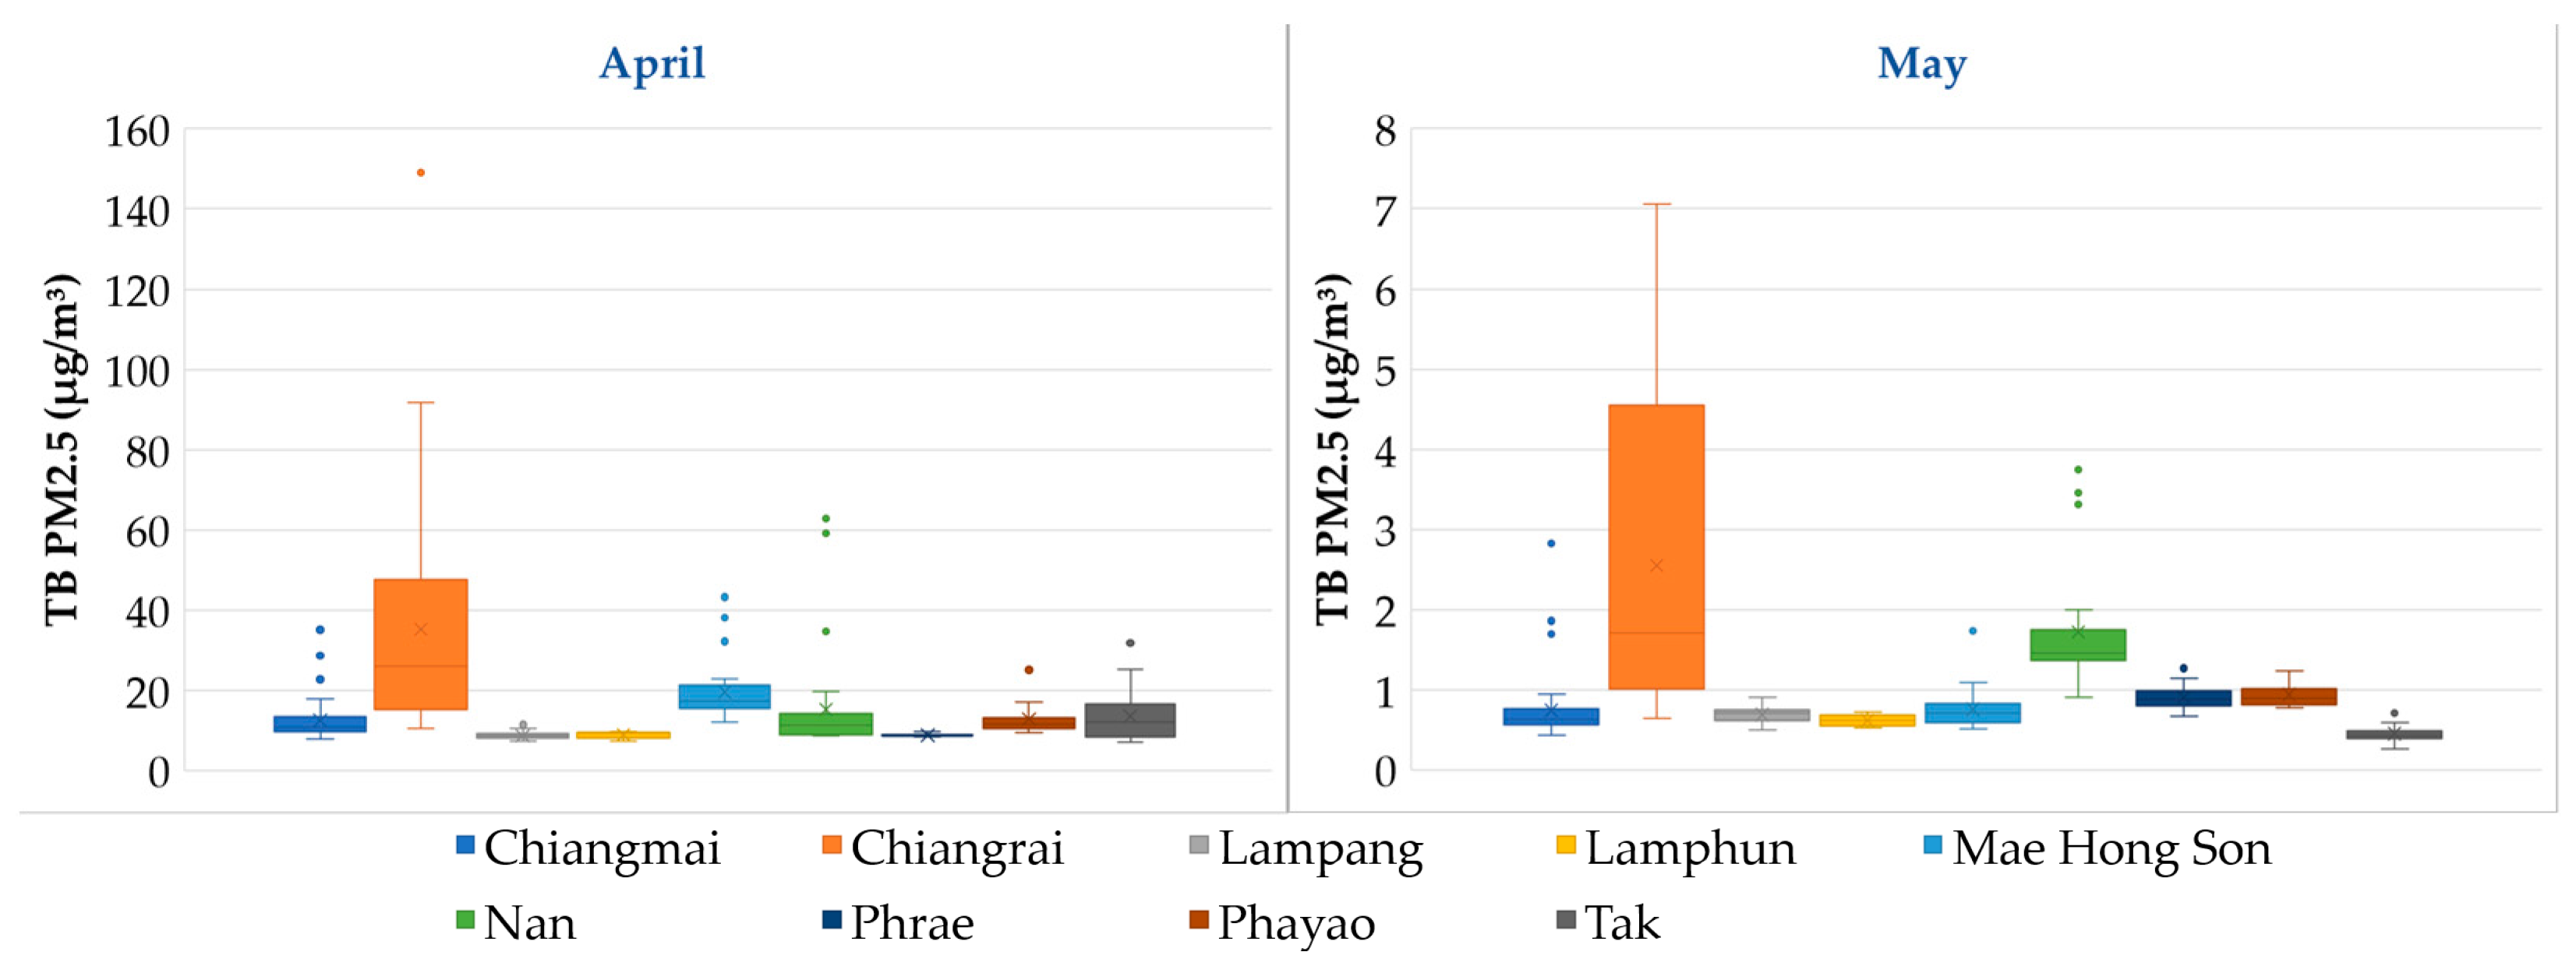
3.3. Characteristics of Transboundary Biomass Burning PM2.5 in Nine Northern Provinces of Thailand
3.4. Impacts of Transboundary Biomass Burning PM2.5 on Local Air Quality and Public Health
4. Discussion
WRF-Chem Model Evaluation
5. Conclusions
Author Contributions
Funding
Institutional Review Board Statement
Informed Consent Statement
Data Availability Statement
Acknowledgments
Conflicts of Interest
References
- Pochanaet, P. The present state of urban air pollution problems in Thailand’s large cities: Cases of Bangkok, Chiang mai, and Rayong. J. Environ. Manag. 2016, 12, 114–133. [Google Scholar]
- Adam, M.G.; Tran, P.T.M.; Bolan, N.; Balasubramanian, R. Biomass burning-derived airborne particulate matter in Southeast Asia: A critical review. J. Hazard. Mater. 2021, 407, 124760. [Google Scholar] [CrossRef] [PubMed]
- Air Pollution from Smog. Available online: http://pcd.go.th/Info_serv/air_thaihaze.html (accessed on 6 June 2019). (In Thai)
- Cheong, K.H.; Ngiam, N.J.; Morgan, G.G.; Pek, P.P.; Tan, B.Y.Q.; Lai, J.W.; Koh, J.M.; Ong, M.E.H.; Ho, A.F.W. Acute health impacts of the Southeast Asian transboundary haze problem—A review. Int. J. Environ. Res. Public Health 2019, 16, 3286. [Google Scholar] [CrossRef] [PubMed]
- Sripaung, N.; Anantagulnathi, P. Manual for Surveillance, Prevention, and control of Diseases and Health Threats Caused by PM2.5; Division of Occupational and Environmental Diseases, Department of Disease Control, Ministry of Public Health: Nonthaburi, Thailand, 2021. (In Thai) [Google Scholar]
- Shi, Y.; Matsunaga, T.; Yamaguchi, Y.; Li, Z.; Gu, X.; Chen, X. Long-term trends and spatial patterns of satellite-retrieved PM2.5 concentrations in South and Southeast Asia from 1999 to 2014. Sci. Total Environ. 2018, 615, 177–186. [Google Scholar] [CrossRef]
- Amnuaylojaroen, T.; Parasin, N. Perspective on Particulate Matter: From Biomass Burning to the Health Crisis in Mainland Southeast Asia. Toxics 2023, 11, 553. [Google Scholar] [CrossRef]
- Pardthaisong, L.; Sin-ampol, P.; Suwanprasit, C.; Charoenpanyanet, A. Haze Pollution in Chiang Mai, Thailand: A Road to Resilience. Procedia Eng. 2018, 212, 85–92. [Google Scholar] [CrossRef]
- Inlaung, K.; Chotamonsak, C.; Surapipith, V.; Macatangay, R. Relationship of Fire Hotspot, PM2.5 Concentrations, and Surrounding Areas in Upper Northern Thailand: A Case Study of Haze Season in 2019. J. King Mongkut's Univ. Technol. N. Bangk. 2023, 33, 588–602. [Google Scholar] [CrossRef]
- Janta, R.; Minoura, H.; Chantara, S. Influence of long-range transport on air quality in northern part of Southeast Asia during open burning season. EANET Sci. Bull. 2016, 4, 109–226. [Google Scholar]
- Air Quality and Noise Management Bureau. Situation and Management of Air and Noise Pollution Problems; Pollution Control Department: Bangkok, Thailand, 2017; pp. 55–57. (In Thai) [Google Scholar]
- Sukkhum, S.; Lim, A.; Ingviya, T.; Saelim, R. Seasonal Patterns and Trends of Air Pollution in the Upper Northern Thailand from 2004 to 2018. Aerosol Air Qual. Res. 2022, 22, 210318. [Google Scholar] [CrossRef]
- Amnuaylojaroen, T.; Kaewkanchanawong, P.; Panpeng, P. Distribution and Meteorological Control of PM2.5 and Its Effect on Visibility in Northern Thailand. Atmosphere 2023, 14, 538. [Google Scholar] [CrossRef]
- Amnuaylojaroen, T.; Parasin, N.; Limsakul, A. Health risk assessment of exposure near-future PM2.5 in Northern Thailand. Air Qual. Atmos. Health 2022, 15, 1963–1979. [Google Scholar] [CrossRef]
- Chaisongkaew, P.; Dejchanchaiwong, R.; Inerb, M.; Mahasakpan, N.; Nim, N.; Samae, H.; Intra, P.; Morris, J.; Ingviya, T.; Limna, T.; et al. Source apportionment of PM2.5 in Thailand’s deep south by principal component analysis and impact of transboundary haze. Environ. Sci. Pollut. Res. 2023, 30, 89180–89196. [Google Scholar] [CrossRef]
- ChooChuay, C.; Pongpiachan, S.; Tipmanee, D.; Suttinun, O.; Deelaman, W.; Wang, Q.; Xing, L.; Li, G.; Han, Y.; Palakun, J.; et al. Impacts of PM2.5 sources on variations in particulate chemical compounds in ambient air of Bangkok, Thailand. Atmos. Pollut. Res. 2020, 11, 1657–1667. [Google Scholar] [CrossRef]
- Thepnuan, D.; Chantara, S.; Lee, C.-T.; Lin, N.-H.; Tsai, Y.I. Molecular markers for biomass burning associated with the characterization of PM2.5 and component sources during dry season haze episodes in Upper South East Asia. Sci. Total Environ. 2019, 658, 708–722. [Google Scholar] [CrossRef] [PubMed]
- NASA FIRMS Archive Download. Available online: https://firms.modaps.eosdis.nasa.gov/download/ (accessed on 22 May 2021).
- Grell, G.A.; Peckham, S.E.; Schmitz, R.; McKeen, S.A.; Frost, G.; Skamarock, W.C.; Eder, B. Fully coupled “online” chemistry within the WRF model. Atmos. Environ. 2005, 39, 6957–6975. [Google Scholar] [CrossRef]
- Chotamonsak, C.; Lapyai, D. The Effects of Biomass Burning Aerosols on Solar Radiation and Climate Over Northern Thailand: A Case Study of the 2013 Smoke-Haze Season. Burapha Sci. J. 2018, 23, 1268–1283. [Google Scholar]
- Mlawer, E.J.; Taubman, S.J.; Brown, P.D.; Iacono, M.J.; Clough, S.A. Radiative transfer for inhomogeneous atmospheres: RRTM, a validated correlated-k model for the longwave. J. Geophys. Res. Atmos. 1997, 102, 16663–16682. [Google Scholar] [CrossRef]
- Chen, F.; Dudhia, J. Coupling an Advanced Land Surface–Hydrology Model with the Penn State–NCAR MM5 Modeling System. Part I: Model Implementation and Sensitivity. Mon. Weather Rev. 2001, 129, 569–585. [Google Scholar] [CrossRef]
- Gochis, D.J.; Shuttleworth, W.J.; Yang, Z.L. Sensitivity of the modeled North American monsoon regional climate to convective parameterization. Mon. Weather Rev. 2002, 130, 1282–1298. [Google Scholar] [CrossRef]
- Hong, S.Y.; Noh, Y.; Dudhia, J. A new vertical diffusion package with an explicit treatment of entrainment processes. Mon. Weather Rev. 2006, 134, 2318–2341. [Google Scholar] [CrossRef]
- Grell, G.A.; Dévényi, D. A generalized approach to parameterizing convection combining ensemble and data assimilation techniques. Geophys. Res. Lett. 2002, 29, 38-1–38-4. [Google Scholar] [CrossRef]
- Chen, S.H.; Sun, W.Y. A one-dimensional time dependent cloud model. J. Meteorol. Soc. Jpn. 2002, 80, 99–118. [Google Scholar] [CrossRef]
- Janssens-Maenhout, G.; Crippa, M.; Guizzardi, D.; Dentener, F.; Muntean, M.; Pouliot, G.; Keating, T.; Zhang, Q.; Kurokawa, J.; Wankmüller, R.; et al. HTAP-v2.2: A mosaic of regional and global emission grid maps for 2008 and 2010 to study hemispheric transport of air pollution. Atmos. Chem. Phys. 2015, 15, 11411–11432. [Google Scholar] [CrossRef]
- Guenther, A.; Karl, T.; Harley, P.; Weidinmyer, C.; Palmer, P.I.; Geron, C. Edinburgh Research Explorer Estimates of global terrestrial isoprene emissions using MEGAN (Model of Emissions of Gases and Aerosols from Nature) and Physics Estimates of global terrestrial isoprene emissions using MEGAN (Model of Emissions of Gases an. Atmos. Chem. Phys. 2006, 6, 3181–3210. [Google Scholar] [CrossRef]
- Longo, K.M.; Freitas, S.R.; Andreae, M.O.; Setzer, A.; Prins, E.; Artaxo, P. The coupled aerosol and tracer transport model to the brazilian developments on the regional atmospheric modeling system (catt-brams)-part 2: Model sensitivity to the biomass burning inventories. Atmos. Chem. Phys. 2010, 10, 5785–5795. [Google Scholar] [CrossRef]
- Freitas, S.R.; Longo, K.M.; Trentmann, J.; Latham, D. PREP-CHEM-SRC—1.0: A preprocessor of trace gas and aerosol emission fields for regional and global atmospheric chemistry models. Geosci. Model. Dev. 2011, 4, 419–433. [Google Scholar] [CrossRef]
- Hinkle, D.E.; Wiersma, W.; Jurs, S.G. Applied Statistics for the Behavioral Sciences, 4th ed.; Houghton Mifflin: Boston, MA, USA, 1998; p. 118. [Google Scholar]
- Lin, N.H.; Tsay, S.C.; Maring, H.B.; Yen, M.C.; Sheu, G.R.; Wang, S.H. An overview of regional experiments on biomass burning aerosols and related pollutants in Southeast Asia: From BASE-ASIA and the Dongsha Experiment to 7-SEAS. Atmos. Environ. 2013, 78, 1–19. [Google Scholar] [CrossRef]
- Aouizerats, B.; Van Der Werf, G.R.; Balasubramanian, R.; Betha, R. Importance of transboundary transport of biomass burning emissions to regional air quality in Southeast Asia during a high fire event. Atmos. Chem. Phys. 2015, 15, 363–373. [Google Scholar] [CrossRef]
- Duc, H.N.; Bang, H.Q.; Quan, N.H.; Quang, N.X. Impact of biomass burnings in Southeast Asia on air quality and pollutant transport during the end of the 2019 dry season. Environ. Monit. Assess. 2021, 193, 565. [Google Scholar] [CrossRef]
- Zhang, L.; Ding, S.; Qian, W.; Zhao, A.; Zhao, S.; Yang, Y.; Weng, G.; Tao, M.; Chen, H.; Zhao, S.; et al. The Impact of Long-Range Transport of Biomass Burning Emissions in Southeast Asia on Southern China. Atmosphere 2022, 13, 1029. [Google Scholar] [CrossRef]
- Betha, R.; Behera, S.N.; Balasubramanian, R. 2013 Southeast Asian Smoke Haze: Fractionation of Particulate-Bound Elements and Associated Health Risk. Environ. Sci. Technol. 2014, 48, 4327–4335. [Google Scholar] [CrossRef] [PubMed]
- Karanasiou, A.; Alastuey, A.; Amato, F.; Renzi, M.; Stafoggia, M.; Tobias, A. Short-term health effects from outdoor exposure to biomass burning emissions: A review. Sci. Total Environ. 2021, 781, 146739. [Google Scholar] [CrossRef] [PubMed]
- Basith, S.; Manavalan, B.; Shin, T.H.; Park, C.B.; Lee, W.S.; Kim, J. The Impact of Fine Particulate Matter 2.5 on the Cardiovascular System: A Review of the Invisible Killer. Nanomaterials 2022, 12, 2656. [Google Scholar] [CrossRef] [PubMed]
- Krittanawong, C.; Maitra, N.S.; Qadeer, Y.K.; Wang, Z.; Fogg, S.; Storch, E.A. Association of Depression and Cardiovascular Disease. Am. J. Med. 2023, 136, 881–895. [Google Scholar] [CrossRef] [PubMed]
- Zauli-Sajani, S.; Thunis, P.; Pisoni, E.; Bessagnet, B.; Monforti-Ferrario, F.; De Meij, A. Reducing biomass burning is key to decrease PM2.5 exposure in European cities. Sci. Rep. 2024, 14, 10210. [Google Scholar] [CrossRef] [PubMed]
- Jaffe, D.A.; O’Neill, S.M.; Larkin, N.K.; Holder, A.L.; Peterson, D.L.; Halofsky, J.E. Wildfire and prescribed burning impacts on air quality in the United States. J. Air Waste Manag. Assoc. 2020, 70, 583–615. [Google Scholar] [CrossRef] [PubMed]
- Chen, J.; Li, C.; Ristovski, Z.; Milic, A.; Gu, Y.; Islam, M.S. A review of biomass burning: Emissions and impacts on air quality, health and climate in China. Sci. Total Environ. 2017, 579, 1000–1034. [Google Scholar] [CrossRef] [PubMed]
- Yin, S. Decadal changes in premature mortality associated with exposure to outdoor PM2.5 in mainland Southeast Asia and the impacts of biomass burning and anthropogenic emissions. Sci. Total Environ. 2023, 854, 158775. [Google Scholar] [CrossRef]
- Jainontee, K.; Pongkiatkul, P.; Wang, Y.L.; Weng, R.J.F.; Lu, Y.T.; Wang, T.S. Strategy Design of PM2.5 Controlling for Northern Thailand. Aerosol Air Qual. Res. 2023, 23, 220432. [Google Scholar] [CrossRef]


| Station ID | Station Name | Latitude | Longitude |
|---|---|---|---|
| 35t | Chang Pueak | 18.8406330 | 98.9696610 |
| 36t | Sri Phum | 18.7909205 | 98.9881062 |
| 37t | Lampang | 18.2782510 | 99.5064470 |
| 57t | Chiang Rai | 19.9092690 | 99.8233500 |
| 58t | Mae Hong Son | 19.3047180 | 97.9709930 |
| 67t | Nan | 18.7888780 | 100.7763590 |
| 68t | Lamphun | 18.5671790 | 99.0385600 |
| 69t | Phrae | 18.1289280 | 100.1623450 |
| 70t | Phayao | 19.1638620 | 99.9027150 |
| 76t | Tak | 16.7501080 | 98.5913130 |
| Configuration | Details |
|---|---|
| Simulation period | January to May 2019 |
| Domains | 1 domain |
| Horizontal resolution | 20 km (D01) |
| Vertical resolution | 38 layers from 1000 to 10 mb |
| Metrological IC and BC | The National Centers for Environmental Prediction Final Analysis (NCEP-FNL) |
| Shortwave radiation scheme | Goddard shortwave radiation scheme |
| Longwave radiation scheme | The rapid radiative transfer model (RRTM) [21] |
| Land surface | The NOAH Land Surface Model [22] |
| Surface layer | Monin–Obukhov [23] |
| PBL | The Yon Sei University Scheme (YSU) [24] |
| Cumulus | The Grell–Devenyi ensemble [25] |
| Microphysics | Purdue Lin [26] |
| Aerosol model | The RADM2 SOGRAM aerosols model (direct and indirect effect) |
| Province | January | February | March | April | May | AVR 5 Month |
|---|---|---|---|---|---|---|
| Tak | 10.01 (31%) | 9.00 (28%) | 15.83 (42%) | 13.61 (39%) | 0.45 (2%) | 9.77 (31%) |
| Chiang Mai | 5.66 (20%) | 9.20 (25%) | 27.72 (45%) | 12.55 (29%) | 0.74 (3%) | 11.20 (29%) |
| Mae Hong Son | 4.65 (17%) | 10.92 (32%) | 32.87 (55%) | 19.76 (44%) | 0.75 (3%) | 13.80 (37%) |
| Chiang Rai | 5.69 (18%) | 20.38 (41%) | 86.53 (68%) | 31.25 (37%) | 2.38 (7%) | 29.41 (45%) |
| Phayao | 5.59 (17%) | 12.56 (27%) | 38.01 (47%) | 12.92 (21%) | 0.92 (3%) | 14.03 (28%) |
| Lampang | 6.37 (21%) | 8.38 (21%) | 19.62 (37%) | 8.72 (23%) | 0.70 (3%) | 8.76 (23%) |
| Phrae | 5.65 (19%) | 11.26 (25%) | 21.76 (36%) | 8.84 (24%) | 0.90 (3%) | 9.65 (24%) |
| Nan | 5.49 (17%) | 12.73 (27%) | 38.49 (44%) | 14.83 (28%) | 1.71 (6%) | 14.68 (29%) |
| Lamphun | 6.74 (23%) | 6.60 (17%) | 15.36 (35%) | 8.98 (25%) | 0.62 (3%) | 7.67 (22%) |
| AVR 9 Provinces | 6.21 (20%) | 11.22 (27%) | 32.91 (46%) | 14.61 (30%) | 1.02 (4%) | 13.22 (30%) |
Disclaimer/Publisher’s Note: The statements, opinions and data contained in all publications are solely those of the individual author(s) and contributor(s) and not of MDPI and/or the editor(s). MDPI and/or the editor(s) disclaim responsibility for any injury to people or property resulting from any ideas, methods, instructions or products referred to in the content. |
© 2024 by the authors. Licensee MDPI, Basel, Switzerland. This article is an open access article distributed under the terms and conditions of the Creative Commons Attribution (CC BY) license (https://creativecommons.org/licenses/by/4.0/).
Share and Cite
Inlaung, K.; Chotamonsak, C.; Macatangay, R.; Surapipith, V. Assessment of Transboundary PM2.5 from Biomass Burning in Northern Thailand Using the WRF-Chem Model. Toxics 2024, 12, 462. https://doi.org/10.3390/toxics12070462
Inlaung K, Chotamonsak C, Macatangay R, Surapipith V. Assessment of Transboundary PM2.5 from Biomass Burning in Northern Thailand Using the WRF-Chem Model. Toxics. 2024; 12(7):462. https://doi.org/10.3390/toxics12070462
Chicago/Turabian StyleInlaung, Kevalin, Chakrit Chotamonsak, Ronald Macatangay, and Vanisa Surapipith. 2024. "Assessment of Transboundary PM2.5 from Biomass Burning in Northern Thailand Using the WRF-Chem Model" Toxics 12, no. 7: 462. https://doi.org/10.3390/toxics12070462