Abstract
In recent years, PM2.5 and O3 have been the two main pollutants affecting public health in China, but the interaction of the two pollutants on human health remains unclear. A two-stage analytical approach was used to investigate the relationships of PM2.5–O3 co-pollution with nonaccidental, cardiovascular, and respiratory mortality levels across 14 cities in China. We first utilized a generalized additive model (GAM) to determine the city-specific associations of PM2.5 and O3 with daily mortality. The associations were then combined at the national and regional levels using meta-analysis. To investigate the potential interactions between the two pollutants and cause-specific mortality, we performed stratified analyses by co-pollutant exposure levels and the synergy index (SI) (SI > 1 indicates a synergistic interaction). The effect of changes in the two pollutants’ concentrations (in 10 μg/m3 increases) on mortality was assessed. The stratification analysis results suggested that each 10 μg/m3 increase in PM2.5 at lag0-1 (lag01) in the low, moderate, and high strata of the O3 concentrations increased nonaccidental mortality by 0.07% (95% confidence interval: −0.03%, 0.17%), 0.33% (0.13%, 0.53%), and 0.68% (0.30%, 1.06%), respectively, with significant between-group differences (p < 0.001). Moreover, each 10 μg/m3 increase in O3 (lag01) in the low, moderate, and high strata of the PM2.5 concentrations increased nonaccidental mortality by 0.15% (−0.06%, 0.36%), 0.53% (0.19%, 0.87%), and 0.75% (0.14%, 1.36%), respectively, with significant between-group differences (p < 0.001). We also found substantial synergistic interactions between the two pollutants and nonaccidental, cardiovascular, and respiratory mortality levels, with SI values of 1.48, 1.51, and 1.33, respectively. Additionally, a subgroup analysis revealed that the interaction of these two pollutants on nonaccidental mortality were greater in South China compared to elsewhere, and during the warm season compared to during the cold season. Our findings suggested that the simultaneous control of PM2.5 and O3 within the context of combined air pollution could significantly decrease the disease risk, especially in southern China and during the warm season.
1. Introduction
Numerous epidemiological studies have demonstrated that the exposure to ambient air pollution is closely related to a multitude of detrimental health effects [1,2]. Fine particulate matter (PM2.5) and ozone (O3) are considered the two most detrimental ambient air pollutants to human health and have been extensively studied [3,4]. According to a recent work of research, in 2019, PM2.5 and O3 were responsible for almost 4.10 and 0.36 million premature deaths, respectively [5]. Traditional epidemiological studies, however, have typically focused on examining the detrimental effects of PM2.5 and O3 separately, and, sometimes, they have regarded one pollutant (e.g., PM2.5) as a potential confounder of the other pollutant (e.g., O3) while ignoring potential interaction effects [6]. Indeed, in real life, the human body is often exposed to multipollutant mixtures, and the biological responses to inhaled air pollutants are probably affected by the interactions of individual pollutants [7,8]. Given the high disease burden due to PM2.5 and O3, exploring whether these pollutants generate interaction effects is crucial for both science and public health. Understanding these interaction effects could help us better understand air pollutant mixtures with regard to health and provide systematic recommendations for future emission control approaches [9].
In recent years, although a few ecological investigations [10,11] have sporadically explored the interactions of particulate matter (PM) and O3 on population health, relevant studies are still scarce, and the conclusions are contentious. For instance, three studies, including a time-series study, a cross-sectional study, and a population-based cohort study [12,13,14], indicated synergistic interactions between PM and O3 for total mortality, presbyopia disease incidence, and premature birth, respectively. In contrast, two time-series studies confirmed that there were antagonistic interactions between PM and O3 for cardiorespiratory morbidity and acute stroke mortality, respectively [15]. Recently, a new study covering 372 global cities revealed prominent synergistic impacts of PM2.5–O3 co-pollution on daily mortality [16]. There are several possible explanations for these inconsistencies, including differences in the methods utilized to explore the interactions, and differences in the chemical composition of pollutants across the study area, as well as differences in the sensitivity of various populations to pollutants across regions [16].
China, as an upper- to middle-income country with a population of 1,412,175.00 thousand people, once faced the worst air pollution problems worldwide [17]. To preserve public health, the Chinese government has launched a series of air pollution prevention–control measures since 2013 to enhance air quality [18]. In later years, environmental monitoring has demonstrated that air pollution caused by PM2.5 has notably decreased annually in most regions of China, whereas O3 concentrations have gradually increased, especially in urban areas [19]. Even so, the average PM2.5 concentration in China is still one order of magnitude greater than that in most developed countries, and PM2.5 pollution has not been fundamentally controlled [4]. As a consequence, a phenomenon referred to as PM2.5–O3 co-pollution has emerged, particularly in some Chinese metropolises [20]. This has raised widespread concern regarding the potential interaction effects of these two pollutants.
Therefore, the purpose of this study was to apply several statistical methodologies to comprehensively investigate whether PM2.5 and O3 exhibit interactive associations with nonaccidental, cardiovascular, and respiratory mortality levels across 14 cities in China. In addition, we determined whether potential factors such as region and season imposed modification effects on these associations at the national and regional levels.
2. Materials and Methods
2.1. Data Collection
We collected observed daily death count, weather variable, and air pollution data for 14 Chinese cities (Figure 1) from 1 January 2014, to 31 December 2016. The 14 Chinese cities—9 in the north and 5 in the south—are all province capitals or municipalities. The Chinese Center for Disease Control and Prevention (CDC) provided the daily death counts for nonaccidental, cardiovascular, and respiratory disease in the 14 cities (10th Revision of the International Classification of Diseases, ICD-10: A00-R99, I00-I99, and J00-J99, respectively).
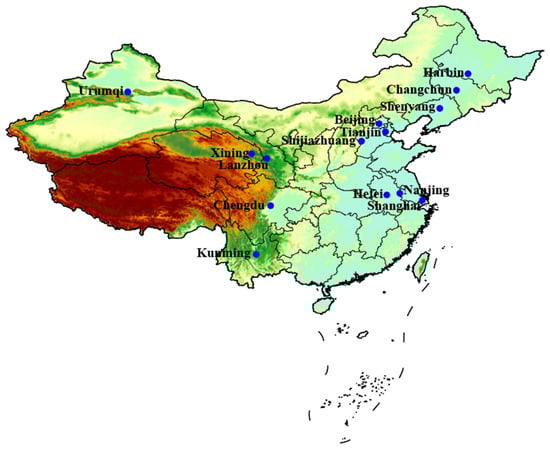
Figure 1.
Geographical location of the 14 cities.
Air pollution data were retrieved from the Ministry of Ecology and Environment of the People’s Republic of China. PM2.5 and O3 are regularly monitored at 132 stationary monitoring stations (12 in Harbin, 10 in Changchun, 7 in Urumqi, 11 in Shenyang, 10 in Urumqi, 12 in Beijing, 15 in Tianjin, 8 in Shijiazhuang, 5 in Lanzhou, 9 in Nanjing, 10 in Shanghai, 8 in Hefei, 8 in Chengdu, and 7 in Kunming) at different points across the 14 cities. The 24 h average PM2.5 and daily maximum 8 h average O3 concentration levels, which were used as air pollutant metrics in this study, were calculated by averaging measurements from multiple fixed-site monitoring stations in each city. For detailed calculations of the PM2.5 as well as O3 concentrations, refer to our published articles [6].
Additionally, to allow adjustment for potential confounding meteorological effects on mortality, we collected city-specific surface daily average temperature (°C) and relative humidity (%) data from the China Meteorological Data Sharing Service System.
2.2. Statistical Methods
The associations of PM2.5 and O3 with the cause-specific mortality were assessed using a two-stage approach [12]. At the first stage, a quasi-Poisson generalized additive model (GAM) was employed to estimate city-specific associations between the two pollutants and health outcomes. The GAM can be expressed as follows:
where E(Yt) denotes the predicted death toll on day t. To adjust for temporal trends, we employed a natural cubic spline function of calendar days with 7 degrees of freedom (df) per year. Moreover, with 6 df for the average temperature (Temp) and with 3 df for the relative humidity (RH) were employed to control for meteorological confounding effects. Meteorological factors impose significant cumulative lag effects on public health. Drawing on previous research experience [21], we determined the lags of the Temp and RH as moving averages of the current and previous 3 days (lag03). We also used two categorical variables to adjust for weekends (DOW) and public holidays (Holiday). X denotes the PM2.5 (or O3) concentration and β is the corresponding coefficient. The subscript t denotes the different lags (days). The detrimental effects of PM2.5 and O3 reached their peak with a cumulative lag of 1 day (lag01) (please refer to the Sensitivity Analysis section). Thus, in the follow-up research, the PM2.5 and O3 concentrations at lag01 were taking into account. is the intercept.
At the second stage, we conducted a random-effects multilevel meta-analysis to pool the associations of the two pollutants with health outcomes at the national and regional levels. Potential heterogeneity in the effects across cities was estimated via the Q test (Cochran’s Q test) and I2 statistic, which can be used to characterize the ratio of the variation due to the true effect to the total variation.
In our study, two established approaches were adopted to investigate the potential interaction of PM2.5–O3 co-pollution on health outcomes: stratified analysis and synergy index (SI). We first performed a stratified analysis according to the quartiles of the two exposures. Specifically, the daily PM2.5 (or O3) concentration in each city was divided into three strata: low (≤25th percentile), moderate (25th–75th percentile), and high (>75th percentile) strata, respectively. Model 1 was run for a specific pollutant (e.g., PM2.5) in the different strata of the other pollutant (e.g., O3) in each city. The meta-analysis model was subsequently applied to different stratum separately to pool the health impacts at the national and regional levels. Finally, we evaluated the pooled effect estimates of a specific exposure (e.g., PM2.5) in subgroups at low, moderate, and high concentration of the other exposure (e.g., O3). Second, the SI method was employed to test the possible synergistic effects of these two exposures on the cause-specific mortality. A new categorical variable was created by dichotomizing the daily PM2.5 and O3 concentrations into low (≤50th percentile) and high (>50th percentile) levels. The new categorical variable included 4 levels: low PM2.5 and high O3 (LPM2.5-HO3); low PM2.5 and low O3 (LPM2.5-LO3); high PM2.5 and low O3 (HPM2.5-LO3); and high PM2.5 and high O3 (HPM2.5-HO3). Based on the new variables, the SI is computed as follows:
where RR11, RR01, and RR10 denote the relative risks in the HPM2.5-HO3, LPM2.5-HO3, and HPM2.5-LO3 categories, respectively. SI > 1 indicates synergistic interaction, whereas SI < 1 denotes antagonistic interaction [22].
To investigate the potential factors influencing the interaction of the two pollutants on the health of people, we conducted subgroup analysis by region (northern and southern China) and season (warm seasons: April to September, and cold seasons: October to March of next year).
We also carried out two sensitivity analyses to assess the robustness of our models. First, we considered several lags (days) for PM2.5 and O3 concentrations, including the current day (lag0) and moving averages of the current day and the past 2 days (lag02) or 3 days (lag03). Second, we studied the impact of different lags in the temperature simulations, such as lag0, lag01, and moving averages of the current day and the past 7 days (lag07) or 14 days (lag014).
All analyses were performed with three packages mgcv, dlnm, and meta of R4.1.2. The estimated associations between PM2.5 and O3 and health outcomes for a 10 μg/m3 increase were expressed as a percentage change (%) or relative risk (RR) of mortality with corresponding 95% confidence intervals (CI). p < 0.05 indicates statistical significance.
3. Results
A statistical summary of city-specific daily death rates and environmental variables is provided in Table 1. In 2016, the population of the 14 cities ranged from 3.52 million to 24.67 million. The median numbers of nonaccidental, cardiovascular, and respiratory disease deaths per day in the 14 cities ranged from 23–233, 9–106, and 4–54, respectively. The median annual average temperature ranged from the lowest value of 5.3 (interquartile range [IQR]: −26.0–29.0) °C in Harbin to the highest value of 18.4 (IQR: −6.1–34.7) °C in Shanghai, and the median annual average relative humidity ranged from the lowest value of 24 (IQR: 2–84)% in Xining to the highest value of 83 (IQR: 42–99)% in Chengdu, respectively, across the 14 cities, reflecting the different climate characteristics of China. Supplementary Figure S1 depicts the boxplots of the concentrations of the two pollutants are shown in. The median annual average PM2.5 concentration ranged from the lowest value of 38.93 (IQR: 23.46–48.59) μg/m3 in Harbin to the highest value of 78.20 (IQR: 42.90–129.20) μg/m3 in Shijiazhuang, while the O3 concentration ranged from the lowest value of 43.07 (IQR: 29.03–85.53) μg/m3 in Urumqi to the highest value of 117.60 (IQR: 88.10–149.10) μg/m3 in Shanghai. In addition, there were statistically significant negative correlations (Pearson’s r =−0.06-0.55) between PM2.5 and O3 (see Supplementary Figure S2).

Table 1.
Summary statistics for the number of deaths in the three categories and environmental variables in the 14 Chinese cities.
We estimated the individual effects of each pollutant on the three mortality categories at the national level (Supplementary Figure S3). An increase of 10 μg/m3 in PM2.5 (lag01) was linked to increases in nonaccidental, cardiovascular, and respiratory mortality of 0.28% (0.23%, 0.33%), 0.38% (0.32%, 0.44%), and 0.40% (0.25%, 0.56%), respectively. An increase of 10 μg/m3 in O3 (lag01) was linked to increases in nonaccidental, cardiovascular, and respiratory mortality of 0.58% (0.44%, 0.72%), 0.59% 0.48%, 0.69%), and 0.75% (0.57%, 0.93%), respectively. There occurred moderate between-city heterogeneity for the relationships between the two exposures and nonaccidental mortality (PM2.5-I2 = 25%, O3-I2 = 37%), cardiovascular mortality (PM2.5-I2 = 20%, O3-I2 = 26%), and respiratory mortality (PM2.5-I2 = 21%, O3-I2 = 42%) levels. In addition, the associations between one pollutant and the three mortality categories varied by region. The individual effects of PM2.5 on the three mortality categories in southern China were two to three times greater than those in northern China. In contrast, the individual effects of O3 on the three mortality categories in northern China were one to two times greater than those in southern China (refer to Supplementary Table S1).
Table 2 summarizes the results of the stratification analysis. It was shown that the two exposures had substantial interactions on nonaccidental and cardiovascular mortality (p < 0.001), but not on respiratory mortality (p = 0.11). Regardless of the cause of death, the relationships between PM2.5 and daily mortality were most pronounced in the highest fourths of the O3 concentration stratum, and vice versa. For instance, a 10 µg/m3 increase in PM2.5 (lag01) in the low, moderate, and high strata of the O3 concentrations increased the nonaccidental mortality by 0.07% (−0.03%, 0.17%), 0.33% (0.13%, 0.53%), and 0.68% (0.30%, 1.06%), respectively, with significant between-group differences (p < 0.001). Moreover, a 10 µg/m3 increase in O3 (lag01) in the low, moderate, and high strata of the PM2.5 concentrations increased the nonaccidental mortality by 0.15% (-0.06%, 0.36%), 0.53% (0.19%, 0.87%), and 0.75% (0.14%, 1.36%), respectively, with significant between-group differences (p < 0.001).
Table 2.
Percentage changes in the daily mortality (95% CI) per 10 μg/m3 increase in PM2.5 and O3 concentrations in the analyses stratified by the co-pollutant level.
Table 3 provides the interaction effects of PM2.5 (lag01) and O3 (lag01) on cause-specific mortality. Regardless of the cause of death, the RRs in the LPM2.5-HO3, HPM2.5-LO3, and HPM2.5-HO3 exposure groups were greater than one, with the LPM2.5-LO3 exposure group serving as the baseline (RR = 1). Furthermore, in the joint analysis, we observed a stronger joint estimate than the sum of the individual estimates for the three mortality categories, indicating synergistic interactions. For example, the RRs of nonaccidental mortality for single high PM2.5 (HPM2.5-LO3), single high O3 (LPM2.5-HO3), and double high PM2.5–O3 (HPM2.5-HO3) were 1.011 (1.004, 1.018), 1.003 (0.997, 1.009), and 1.021 (1.010, 1.032), respectively, with an SI value of 1.48. Moreover, the joint estimates of cardiovascular and respiratory mortality for these two pollutants were 1.024 (1.012, 1.036) with SI = 1.51, and 1.028 (1.017, 1.039) with SI = 1.33, respectively. Overall, the two pollutants imposed synergistic effects on the three mortality categories, especially on cardiovascular mortality.
Table 3.
Interaction effects of PM2.5 and O3 on daily mortality.
According to our stratified analysis by region (Figure 2), we obtained greater associations of PM2.5 with the three mortality categories when O3 is high in both southern and northern China (p < 0.05), although the association between PM2.5 and respiratory mortality in the north was not significant (p = 0.64). In southern China, increasing the exposure to PM2.5 enhanced the estimated associations of O3 with cardiovascular and respiratory mortality (p < 0.001 and p = 0.01, respectively). However, in northern China, interactions were observed only for cardiovascular mortality (p = 0.04). In terms of the seasonal stratification analysis (Figure 3), the associations between PM2.5 and the three mortality categories were greater (p < 0.05) at higher O3 levels during both the warm and cold seasons, except that the association between PM2.5 and respiratory mortality during the cold season was not statistically significant (p = 0.36). In addition, we found greater associations between O3 and nonaccidental and respiratory mortality (p < 0.001 and p = 0.03, respectively) when PM2.5 is high during the warm season. However, there were no significant associations between O3 and any mortality category under different PM2.5 strata during the cold season.
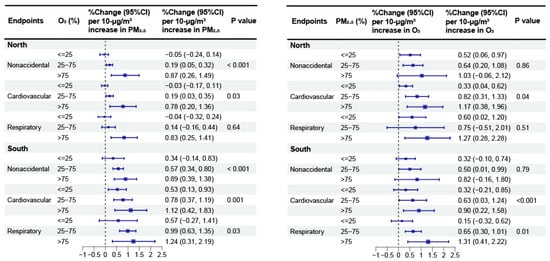
Figure 2.
Meta-analysis results for the percentage changes (95% CI) in daily mortality linked to a 10 μg/m3 increase in PM2.5 and O3 concentrations in southern and northern China.
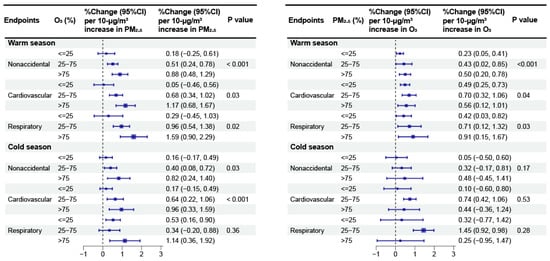
Figure 3.
Meta-analysis results for the percentage changes (95% CI) in daily mortality linked to a 10 μg/m3 increase in PM2.5 and O3 concentrations during the warm and cold seasons.
Supplementary Table S2 provides the interaction of PM2.5 and O3 on nonaccidental mortality by region and season. For both region and season, we consistently identified greater joint effects of PM2.5–O3 co-pollution than the sum of their individual effects. In terms of stratification by region, the SI values of PM2.5 and O3 were 1.81 in the southern region and 1.45 in the northern region. In terms of stratification by season, the warm season (2.17) exhibited a greater SI than the cold season (1.24).
The sensitivity analyses revealed that the results were similar and very close to those of the main models (lag01) when we used alternative lags for PM2.5 and O3 (Supplementary Table S3). Additionally, we observed that the associations were marginally lower than those of the main models when we chose longer lags for the temperature (Supplementary Table S4), but the trends of higher estimates with a greater exposure to co-pollutants remained.
4. Discussion
To better understand the potential interaction of PM2.5-O3 on mortality rates, our study focused on investigating the relationships between these two pollutants and nonaccidental and cardiovascular, as well as respiratory mortality across 14 Chinese cities. Our findings revealed significant associations of coexposure to these two pollutants with the three mortality categories. In particular, the two pollutants imposed synergistic effects on the three mortality categories. In addition, we revealed various interactions across regions and seasons. Our findings highlighted the urgency and importance of developing synergistic control policies for these two pollutants in China.
Exploring the interactions of multiple pollutants is challenging, as no harmonized standards or methodological frameworks have been developed [23]. In the current study, two methodologies were employed to explore whether PM2.5 and O3 interact to affect mortality across 14 Chinese cities. Both methodologies yielded similar and consistent conclusions: the simultaneous exposure to PM2.5–O3 co-pollution amplifies their individual risks. The stratified analyses were first adopted, which allow us to evaluate the modifying effects of the two pollutants on each other, i.e., whether there is a difference in the magnitude of another pollutant’s effect on mortality in different concentration strata for the other pollutant. As an example, a 10 μg/m3 increment in PM2.5 in the low, moderate, and high O3 strata led to increases in the nonaccidental mortality of 0.07%, 0.33%, and 0.68%, respectively, indicating positive interactions. Our findings are similar to those of several earlier studies [11,24]. For instance, a study around the world revealed that a 10 μg/m3 increase in PM2.5 at low, middle, and high O3 levels resulted in 0.47%, 0.70%, and 1.25% increases in overall mortality, respectively [16]. Furthermore, we adopted the SI method to quantify the interaction effects of these two pollutants. The SI values for the three mortality categories were greater than one, suggesting synergistic interactions of PM2.5–O3 co-pollution on the three mortality categories. Overall, our findings revealed that risks associated with a combination of pollutants cannot be adequately captured by any one pollutant.
The stratified analysis findings indicated that the interactions of the two pollutants on daily mortality substantially varied by region and season in China. In terms of regional stratification, there were greater interactions in southern China than in northern China. This variance might be attributed to the diverse compositions of air pollutants, particularly PM2.5. Prior research has demonstrated that the composition of PM2.5 greatly varies across China and is affected by geographical and meteorological conditions, socioeconomic conditions, local industrial emissions, and other factors [25]. In general, primary pollutants make up the majority of PM2.5 in northern China, whereas secondary pollutants can account for up to 80% of the total PM2.5 composition in the southern region [26]. However, secondary particulate matter exerts much greater negative impacts on the human body than primary pollutants [27]. The study suggested that the individual effect of PM2.5 on daily mortality in southern China was two to three times greater than that in northern China, which is consistent with earlier research findings [28]. Variations in the PM2.5 composition can lead to differences in individual effects, as well as interactions of PM2.5–O3 co-pollution for daily mortality [11]. In terms of seasonal stratification, our findings revealed that the two pollutants significantly interacted during both the warm and cold seasons. Furthermore, the interactions were greater during the warm season. The specific reason remains unclear, and definitive proof is lacking. This difference might also be related to seasonal variations in the compositions of the two pollutants and their concentrations [20]. However, further studies with larger populations, different geographic areas, and other methodologies are needed to further verify the validity of these conclusions.
Several biological pathways have been hypothesized, although the physiological mechanisms underpinning the interactions of the two pollutants on public health have not yet been fully explained. First, animal studies have shown that the coexposure to these two pollutants generates synergistic effects on airway responsiveness and allergic inflammation in mice, which can be manifested as changes in respiratory function and the release of cytokines [29]. Second, a previous study [30] demonstrated that O3 could modify the health risks of PM2.5. For instance, antioxidants in the lung lining fluid are depleted by O3 inhalation in humans, which may weaken the body’s defences against reactive oxygen species produced by other pollutants such as PM2.5 [31]. Regrettably, the available evidence is very limited, and additional investigations of the underlying mechanisms should be performed in the future.
Our study exhibits several limitations. First, we collected the average PM2.5 and O3 concentrations from fixed-site urban monitoring stations instead of the real-time pollution level data, which could not reflect the real-time pollution level of participants’ residential addresses. The lack of accurate personal exposure profiles may result in exposure misclassification [19]. Second, our study focused on metropolitan cities in China. However, there are notable differences in population distributions and pollutant levels between urban and rural areas. Therefore, it is challenging to generalize our findings to rural locations. Third, the study only assessed the relationships between PM2.5–O3 co-pollution in terms of public health; other combined air pollutants, such as O3 and nitrogen dioxide, were not examined in this regard. Lastly, we only used three years of data in this study to evaluate the interactions of PM2.5–O3 on daily mortality, and hope to collect longer-term data in future.
5. Conclusions
In this study, the relationships of PM2.5–O3 co-pollution with excess mortality were investigated across 14 cities in China. Our findings offer fresh evidence that the coexposure to PM2.5–O3 co-pollution notably amplifies the mortality risk above the predicted levels solely based on the individual effects of each substance. Additionally, the associations substantially varied by region and season in China, with greater interactions in the south and during the warm season. Therefore, within the context of combined air pollution, strict and integrated prevention–control policies for PM2.5-O3 co-pollution are urgently needed to reduce their interaction effects on human health.
Supplementary Materials
The following supporting information can be downloaded at: https://www.mdpi.com/article/10.3390/toxics12080578/s1, Figure S1: Boxplots of O3 and PM2.5 concentrations in 14 cities of China; Figure S2: Pearson correlations among environmental factors (PM2.5, O3, mean temperature, and relative humidity) and daily mortality in 14 Chinese cities; Figure S3: Percentage changes (95% CI) in nonaccidental, cardiovascular, and respiratory mortality per 10 μg/m3 increase in two-day moving average of PM2.5 and O3 concentrations at national level; Table S1: Percentage changes (95% CI) in daily nonaccidental, cardiovascular, and respiratory mortality per 10 μg/m3 increase in PM2.5 and O3 at national and regional levels; Table S2: Synergy index and relative risk between two-day moving average PM2.5 and O3 concentrations on nonaccidental mortality stratified by region and season; Table S3: Percentage changes (95% CI) in nonaccidental, cardiovascular, and respiratory mortality per 10 μg/m3 increase in PM2.5 and O3 with different lag days in analyses stratified by level of co-pollutant; Table S4: Percent changes (95% CI) in nonaccidental mortality associated with a 10 μg/m3 increase in PM2.5 and O3 in analyses stratified by level of co-pollutant, using different lag structures of temperature.
Author Contributions
Y.Z.: writing—review and editing, methodology, designed the research, and wrote the manuscript. L.F.: methodology, designed and reviewed the research, and reviewed the research. S.W.: formal analysis, and reviewed the research. H.L.: methodology, and reviewed the research. All authors have read and agreed to the published version of the manuscript.
Funding
This study was supported by the Second Tibetan Plateau Scientific Expedition and Research (STEP) program (2019QZKK0103), the Natural Science Foundation of Sichuan Province (2024NSFSC0775), and the Innovation Team Fund of Southwest Regional Meteorological Center, China Meteorological Administration (XNQYCXTD-202203).
Institutional Review Board Statement
Not applicable.
Informed Consent Statement
Not applicable.
Data Availability Statement
The datasets used in this study are available from the corresponding author upon reasonable request.
Conflicts of Interest
The authors declare no conflicts of interest.
References
- Stafoggia, M.; Bellander, T. Short-term effects of air pollutants on daily mortality in the Stockholm county—A spatiotemporal analysis. Environ. Res. 2020, 188, 109854. [Google Scholar] [CrossRef] [PubMed]
- Lee, W.; Wu, X.; Heo, S.; Fong, K.C.; Son, J.-Y.; Sabath, M.B.; Braun, D.; Park, J.Y.; Kim, Y.C.; Lee, J.P.; et al. Associations between long term air pollution exposure and first hospital admission for kidney and total urinary system diseases in the US Medicare population: Nationwide longitudinal cohort study. BMJ Med. 2022, 1, e000009. [Google Scholar] [CrossRef] [PubMed]
- Chen, R.; Yin, P.; Meng, X.; Liu, C.; Wang, L.; Xu, X.; Ross, J.A.; Tse, L.A.; Zhao, Z.; Kan, H.; et al. Fine Particulate Air Pollution and Daily Mortality A Nationwide Analysis in 272 Chinese Cities. Am. J. Respir. Crit. Care Med. 2017, 196, 73–81. [Google Scholar] [CrossRef] [PubMed]
- Son, J.-Y.; Sabath, M.B.; Lane, K.J.; Miranda, M.L.; Dominici, F.; Di, Q.; Schwartz, J.; Bell, M.L. Long-term exposure to PM2.5 and mortality for the older population: Effect modification by residential greenness. Epidemiology 2021, 32, 477–486. [Google Scholar] [CrossRef] [PubMed]
- GBD 2019 Risk Factors Collaborators. Global burden of 87 risk factors in 204 countries and territories, 1990–2019: A systematic analysis for the Global Burden of Disease Study 2019. Lancet 2020, 396, 1223–1249. [Google Scholar] [CrossRef] [PubMed]
- Zhang, Y.; Wang, S.; Zhang, X.; Ni, C.; Zhang, J.; Zheng, C. Temperature modulation of the adverse consequences on human mortality due to exposure to fine particulates: A study of multiple cities in China. Environ. Res. 2020, 185, 109353. [Google Scholar] [CrossRef] [PubMed]
- Costa, A.F.; Hoek, G.; Brunekreef, B.; de Leon, A.C.M.P. Air pollution and deaths among elderly residents of São Paulo, Brazil: An analysis of mortality displacement. Environ. Health Perspect. 2017, 125, 349–354. [Google Scholar] [CrossRef] [PubMed]
- Rodriguez-Villamizar, L.A.; Rojas-Roa, N.Y.; Fernandez-Nino, J.A. Short-term joint effects of ambient air pollutants on emergency department visits for respiratory and circulatory diseases in Colombia, 2011–2014. Environ. Pollut. 2019, 248, 380–387. [Google Scholar] [CrossRef] [PubMed]
- Hong, C.; Zhang, Q.; Zhang, Y.; Davis, S.J.; Tong, D.; Zheng, Y.; Liu, Z.; Guan, D.; He, K.; Schellnhuber, H.J. Impacts of climate change on future air quality and human health in China. Proc. Natl. Acad. Sci. USA 2019, 116, 17193–17200. [Google Scholar] [CrossRef]
- Winquist, A.; Kirrane, E.; Klein, M.; Strickland, M.; Darrow, L.A.; Sarnat, S.E.; Gass, K.; Mulholland, J.; Russell, A.; Tolbert, P. Joint effects of ambient air pollutants on pediatric asthma emergency department visits in Atlanta, 1998–2004. Epidemiology 2014, 25, 666–673. [Google Scholar] [CrossRef]
- Li, J.; Liang, L.; Lyu, B.; Cai, Y.S.; Zuo, Y.; Su, J.; Tong, Z. Double trouble: The interaction of PM2.5 and O3 on respiratory hospital admissions. Environ. Pollut. 2023, 338, 122665. [Google Scholar] [CrossRef] [PubMed]
- Revich, B.; Shaposhnikov, D. The effects of particulate and ozone pollution on mortality in Moscow, Russia. Air Qual. Atmos. Health 2010, 3, 117–123. [Google Scholar] [CrossRef] [PubMed]
- Lin, H.; Guo, Y.; Ruan, Z.; Yang, Y.; Chen, Y.; Zheng, Y.; Cummings-Vaughn, L.A.; Rigdon, S.E.; Vaughn, M.G.; Sun, S.; et al. Ambient PM2.5 and O3 and their combined effects on prevalence of presbyopia among the elderly: A cross-sectional study in six low- and middle-income countries. Sci. Total Environ. 2019, 655, 168–173. [Google Scholar] [CrossRef]
- Siddika, N.; Rantala, A.K.; Antikainen, H.; Balogun, H.; Amegah, A.K.; Ryti, N.R.; Kukkonen, J.; Sofiev, M.; Jaakkola, M.S.; Jaakkola, J.J. Synergistic effects of prenatal exposure to fine particulate matter (PM2.5) and ozone (O3) on the risk of preterm birth: A population-based cohort study. Environ. Res. 2019, 176, 108549. [Google Scholar] [CrossRef]
- Hong, Y.-C.; Lee, J.-T.; Kim, H.; Ha, E.-H.; Schwartz, J.; Christiani, D.C. Effects of air pollutants on acute stroke mortality. Environ. Health Perspect. 2002, 110, 187–191. [Google Scholar] [CrossRef] [PubMed]
- Liu, C.; Chen, R.; Sera, F.; Vicedo-Cabrera, A.M.; Guo, Y.; Tong, S.; Lavigne, E.; Correa, P.M.; Ortega, N.V.; Achilleos, S.; et al. Interactive effects of ambient fine particulate matter and ozone on daily mortality in 372 cities: Two stage time series analysis. BMJ 2023, 383, e075203. [Google Scholar] [CrossRef] [PubMed]
- Kan, H.; Chen, R.; Tong, S. Ambient air pollution, climate change, and population health in China. Environ. Int. 2012, 42, 10–19. [Google Scholar] [CrossRef] [PubMed]
- Chen, K.; Wolf, K.; Hampel, R.; Stafoggia, M.; Breitner, S.; Cyrys, J.; Samoli, E.; Andersen, Z.; Bero-Bedada, G.; Bellander, T.; et al. Does temperature-confounding control influence the modifying effect of air temperature in ozone–mortality associations? Environ. Epidemiol. 2018, 2, 1. [Google Scholar]
- Zheng, B.; Tong, D.; Li, M.; Liu, F.; Hong, C.; Geng, G.; Li, H.; Li, X.; Peng, L.; Qi, J.; et al. Trends in China’s anthropogenic emissions since 2010 as the consequence of clean air actions. Atmos. Chem. Phys. 2018, 18, 14095–14111. [Google Scholar] [CrossRef]
- Wu, X.; Xin, J.; Zhang, W.; Gao, W.; Ma, Y.; Ma, Y.; Wen, T.; Liu, Z.; Hu, B.; Wang, Y.; et al. Variation characteristics of air combined pollution in Beijing City. Atmos. Res. 2022, 274, 106197. [Google Scholar] [CrossRef]
- Liu, C.; Yin, P.; Chen, R.; Meng, X.; Wang, L.; Niu, Y.; Lin, Z.; Liu, Y.; Liu, J.; Qi, J.; et al. Ambient carbon monoxide and cardio-vascular mortality: A nationwide time-series analysis in 272 cities in China. Lancet Planet. Health 2018, 2, e12–e18. [Google Scholar] [CrossRef] [PubMed]
- Andersson, T.; Alfredsson, L.; Källberg, H.; Zdravkovic, S.; Ahlbom, A. Calculating measures of biological interaction. Eur. J. Epidemiol. 2005, 20, 575–579. [Google Scholar] [CrossRef] [PubMed]
- Gass, K.; Klein, M.; Chang, H.H.; Flanders, W.D.; Strickland, M.J. Classification and regression trees for epidemiologic research: An air pollution example. Environ. Health 2014, 13, 17. [Google Scholar] [CrossRef]
- Lavigne, E.; Burnett, R.T.; Weichenthal, S. Association of short-term exposure to fine particulate air pollution and mortality: Effect modification by oxidant gases. Sci. Rep. 2018, 8, 16097. [Google Scholar] [CrossRef] [PubMed]
- Shao, M.; Wang, W.; Yuan, B.; Parrish, D.D.; Li, X.; Lu, K.; Wu, L.; Wang, X.; Mo, Z.; Yang, S.; et al. Quantifying the role of PM2.5 dropping in variations of ground-level ozone: Inter-comparison between Beijing and Los Angeles. Sci. Total Environ. 2021, 788, 147712. [Google Scholar] [CrossRef] [PubMed]
- Shao, P.; Xin, J.; Zhang, X.; Gong, C.; Ma, Y.; Wang, Y.; Wang, S.; Hu, B.; Ren, X.; Wang, B. Aerosol optical properties and their impacts on the co-occurrence of surface ozone and particulate matter in Kunming City, on the Yunnan–Guizhou Plateau of China. Atmos. Res. 2022, 266, 105963. [Google Scholar] [CrossRef]
- Adams, K.; Greenbaum, D.S.; Shaikh, R.; van Erp, A.M.; Russell, A.G. Particulate matter components, sources, and health: Systematic approaches to testing effects. J. Air Waste Manag. Assoc. 2015, 65, 544–558. [Google Scholar] [CrossRef]
- Zheng, S.; Schlink, U.; Ho, K.-F.; Singh, R.P.; Pozzer, A. Spatial Distribution of PM2.5-Related Premature Mortality in China. GeoHealth 2021, 5, e2021GH000532. [Google Scholar] [CrossRef]
- Goldsmith, C.-A.W.; Ning, Y.; Qin, G.; Imrich, A.; Lawrence, J.; Murthy, G.G.K.; Catalano, P.J.; Kobzik, L. Combined air pollution particle and ozone exposure increases airway responsiveness in mice. Inhal. Toxicol. 2002, 14, 325–347. [Google Scholar] [CrossRef]
- Crobeddu, B.; Aragao-Santiago, L.; Bui, L.-C.; Boland, S.; Squiban, A.B. Oxidative potential of particulate matter 2.5 as predictive indicator of cellular stress. Environ. Pollut. 2017, 230, 125–133. [Google Scholar] [CrossRef]
- Zhang, Y.; Wang, S.; Fan, X.; Ye, X. Temperature modulation of the health effects of particulate matter in Beijing, China. Environ. Sci. Pollut. Res. 2018, 25, 10857–10866. [Google Scholar] [CrossRef] [PubMed]


Disclaimer/Publisher’s Note: The statements, opinions and data contained in all publications are solely those of the individual author(s) and contributor(s) and not of MDPI and/or the editor(s). MDPI and/or the editor(s) disclaim responsibility for any injury to people or property resulting from any ideas, methods, instructions or products referred to in the content. |
© 2024 by the authors. Licensee MDPI, Basel, Switzerland. This article is an open access article distributed under the terms and conditions of the Creative Commons Attribution (CC BY) license (https://creativecommons.org/licenses/by/4.0/).