Article

Effect of Ozone Exposure on Cardiovascular and Cerebrovascular Disease Mortality in the Elderly

1
Liaoning Key Laboratory of Environmental Health Damage Research and Assessment, Department of Environmental Physical Factors and Health, School of Public Health, Ministry of Education, China Medical University, Shenyang 110122, China
2
Liaoning Provincial Center for Disease Control and Prevention, Shenyang 110005, China
3
Key Laboratory of Environmental Stress and Chronic Disease Control & Prevention, Ministry of Education, China Medical University, Shenyang 110122, China
*
Author to whom correspondence should be addressed.
Toxics 2025, 13(3), 184; https://doi.org/10.3390/toxics13030184
Submission received: 9 December 2024 / Revised: 14 January 2025 / Accepted: 26 February 2025 / Published: 28 February 2025

Abstract

:
Background: Ozone pollution has increased alongside China’s economic development, contributing to public health issues such as cardiovascular and cerebrovascular diseases. At present, the problem of an aging population is aggravated, which is worth more attention in terms of the health problems of elderly people. Methods: This study employed a distributional lag nonlinear model (DLNM) with Poisson regression to analyze the impact of ozone on cardiovascular and cerebrovascular disease mortality among the elderly in Shenyang, China, from 2014 to 2018. In addition, a time-series generalized additive regression model (GAM) was used to analyze the joint effect between PM2.5 and ozone. Results: We found a positive correlation between ozone and mortality from cardiovascular and cerebrovascular diseases in the elderly. The maximum relative risk (RR) of mortality from cardiovascular and cerebrovascular diseases for every 10 μg/m3 increase in ozone was 1.005 (95% CI: 1.002–1.008). Males (RR: 1.018, 95% CI: 1.007–1.030), individuals in unconventional marital status (RR: 1.024, 95% CI: 1.011–1.038), and outdoor workers (RR: 1.017, 95% CI: 1.002–1.031) were more vulnerable to ozone pollution. This study did not find significant differences in the impact of ozone pollution on cardiovascular and cerebrovascular disease mortality risks among different educational groups. Additionally, a joint effect between ozone and PM2.5 was observed. Conclusion: This study confirms that ozone exposure is positively associated with increased mortality from cardiovascular and cerebrovascular diseases. It emphasizes the joint effect of ozone and PM2.5 in exacerbating cardiovascular and cerebrovascular disease mortality.

1. Introduction

Ozone (O3) is a secondary pollutant formed through photochemical reactions involving nitrogen oxides (NOx) and volatile organic compounds (VOCs) under sunlight exposure [1]. As the continuous development of China’s economy, surface ozone pollution has intensified across various regions over the past two decades. Furthermore, near-surface ozone concentrations will continue to rise due to future climate change [2]. Rising O3 concentrations pose a serious public health threat [3]. Approximately 400,000 people worldwide died from O3 pollution in 2019, according to the 2019 Global Burden of Disease, Injury, and Risk Factors Study (GBD) [4]. Previous studies have shown a 46% increase in global O3-attributable mortality over a 20-year period [5]. Ozone exposure has been linked to various diseases, including respiratory diseases [6], cardiovascular diseases (CVD) [7,8], and cerebrovascular diseases (CEVD) [2,9]. Moreover, the population-weighted average O3 concentration in China is higher than in most other countries [10].
While numerous studies have investigated the effects of O3 on CVD and CEVD, the results remain inconsistent. Large cohort studies in the United States and Canada have found a positive correlation between increased O3 concentrations and CVD mortality [11,12]. However, a cohort study from the United Kingdom reported the opposite result [13]. Several studies have shown that O3 is positively associated with CVD mortality only during the warmer months [14,15]. Similarly, studies on CEVD and O3 are inconsistent. A study from Guangzhou found a positive correlation between O3 levels and the incidence of CEVD [16]. In contrast, another study from Taiwan concluded that O3 was negatively associated with CEVD incidence [17]. These discrepancies underscore the need for further investigation into the effects of O3 on CVD and CEVD mortality.
In addition to O3, fine particulate matter (PM2.5) has been widely recognized for its adverse effects on both CVD [18,19,20] and CEVD [17]. Although PM2.5 pollution has decreased in China in recent years [21], both O3 and PM2.5 remain major pollutants, often interacting and compounding their negative effects on human health [22]. Currently, few studies have been conducted on the joint effects of PM2.5 and O3. It is crucial to fully understand the joint effects of PM2.5 and O3 on CVD and CEVD.
Furthermore, China has become a rapidly aging society [23]. It is important to conduct studies in the elderly to reduce the burden of deaths caused by air pollution. This study aims to quantify the risks of O3 exposure on CVD and CEVD mortality in the elderly and examine whether these risks are modified by individual factors. Additionally, the study will investigate the joint effects of O3 and PM2.5 using both single-pollutant and two-pollutant models.

2. Materials and Methods

2.1. Study Area

Shenyang, as the capital of Liaoning Province, is the center of transportation, economy, science and technology, commerce, and culture in Northeast China. It has a sub-humid temperate continental climate, with hot and humid summers and cold, dry winters. In Shenyang, the primary source of air pollution is soot, with PM2.5 being the main pollutant in winter and O3 the dominant pollutant in summer. In Shenyang, the majority of sulfur SO2 and soot emissions come from industrial sources, followed by residential emissions, with a small portion from vehicle emissions. For NOx emissions, industrial sources remain the primary contributor, followed by vehicle emissions, with only a small fraction coming from residential emissions (Figure 1).

2.2. Data Collection

In this study, we collected data on deaths from 1 January 2014 to 31 December 2018 in Shenyang from the death registration system of the Liaoning Provincial Center for Disease Control and Prevention. The study focused on elderly individuals (aged ≥ 65) who died from cardiovascular disease (CVD; ICD-10 codes I05–I52) and cerebrovascular disease (CEVD; ICD-10 codes I60–I69). Participants were categorized based on gender, educational level, marital status, and occupation.
This study collected daily maximum 8-hour average concentrations of ozone during the study period from the Shenyang Municipal Environmental Protection Department (https://sthjj.shenyang.gov.cn/, accessed on: 25 Febuary 2025). In addition, we calculated daily 24-hour average concentration data, including PM2.5, SO2, NO2, and CO.
Daily meteorological data, including average daily temperature (°C) and relative humidity (%), were provided by the meteorological monitoring site of the Liaoning Provincial Environmental Protection Department.

2.3. Statistical Analysis

This study used a distributed lag nonlinear model (DLNM) to analyze the lag–exposure–response relationship between ozone and CVD and CEVD deaths. In addition, this study used a generalized additive model (GAM) to analyze the interaction between O3 and PM2.5. Spearman was used for correlation analysis between pollutants and meteorological conditions.

2.3.1. Distributed Lag Nonlinear Model (DLNM)

Since daily deaths from CVD and CEVD in the elderly are rare events, they followed a quasi-Poisson distribution. Therefore, DLNM with quasi-Poisson regression was employed to analyze the associations between O3 and mortality. Meteorological factors (temperature and relative humidity), other pollutants (PM2.5, NO2, SO2), and long-term trends were incorporated into the model to control for their potential impact on the outcome and to improve the accuracy of the model. The model is specified as follows:
Yt~Poisson (ut)
Log[E(Yt)] = β0 + β1cb.O3t + β2cb.tempt + ns(PM2.5,df) + ns(NO2,df) + ns(SO2,df) + ns(h,df) + ns(time,df) + Dow
  • Yt: The number of deaths due to cardiovascular and cerebrovascular disease on day t.
  • β0: The intercept.
  • β: The vector of coefficients.
  • cb.O3t: Cross-basis of O3 concentration at day t.
  • cb.tempt: Cross-basis of temperature at day t.
  • ns: Natural cubic spline.
  • df: Degree of freedom.
  • time: Time variable, to control long-term trend and seasonality.
  • dow: The day of week and public holidays are represented as categorical variables to control short-term fluctuations.
The degrees of freedom (df) for each variable were determined based on previous studies and the Akaike information criterion (AIC). Specifically, the df for daily average temperature was set to 5; for other pollutants (PM2.5, SO2, and NO2), it was set to 3; for humidity, it was set to 4; and for time, it was set to 7 per year.
Previous studies on the lag effect of air pollutants on deaths usually occur within 7 days [24,25]. In this study, single-day lag (lag0–lag7) and multi-day cumulative lag (lag00–lag07) were used to assess the lag-specific and cumulative effects of O3 on the deaths of cardiovascular and cerebrovascular diseases in the elderly. This study further explored the potential effects of gender, level of education, marital status, and season (warm season: April to October; cold season: November to March).

2.3.2. Generalized Additive Model (GAM)

First, this study used a stratified analysis to assess the interaction between O3 and PM2.5. We stratified the daily concentrations of PM2.5 into two levels, low and high, according to the median of the study period.O3-8h is used as a continuous variable in the model to compare the risk of death from O3 at different stratification levels. The model is as follows:
Log[E(Yt)] = β0 + β(O3 × PM2.5low) + COVs
Log[E(Yt)] = β0 + β1(O3 × PM2.5high) + COVs
COVs: Covariates including time, mean temperature, relative humidity, weekday, public holidays, and the intercept.
Next, we used a two-pollutant model to analyze the joint effects of PM2.5 and O3, specified as follows:
Log[E(Yt)] = β0 + te(O3, PM2.5) + COVs
te (): Smoothing function that simultaneously fits the joint effect of the two variables.
All statistical analyses were performed using RStudio version 4.2.1, with the “mgcv”, “ggplot2”, and “dlnm” packages. The relative risks (RR) and 95% confidence intervals (95% CIs) for both individual and joint effects of PM2.5 and O3 are reported for every 10 μg/m3 increase in pollutant concentrations.

3. Results

3.1. Descriptive Statistics and Correlation Coefficients

As shown in Table 1, 117,604 people were included in this study, all of whom died of cardiovascular and cerebrovascular diseases from 2014 to 2018. The average age of the participants was 80.3 ± 7.85, of which 50.4% were male. Moreover, the participants were stratified by education, marital status, and occupation. Since the participants were all over 65 years old, the proportion of people with a junior high school and below level of education was high, forming 86.9% of the total.
Table 2 presents the average levels of temperature, relative humidity, and air pollution across different seasons during the study period. The O3 concentration in the warm season was significantly higher than in the cold season. The average O3 concentration in the warm season was 84.7 μg/m3, well above the WHO’s air quality guideline of 60 μg/m3.
Table 3 presents the correlation coefficients between air pollutants, temperature, and relative humidity (p < 0.01). PM2.5, PM10, SO2, NO2, and CO were positively correlated with each other and negatively correlated with temperature. The correlation between PM2.5 and PM10 is the strongest (r = 0.89), indicating a high degree of consistency in their concentration variations. O3-8 h was negatively correlated with other pollutants and positively correlated with temperature (r = 0.69).

3.2. The Association Between O3 and Mortality

Table 4 illustrates the relative risk (RR) (95% CI) of CVD and CEVD mortality for each 10 μg/m3 increase in O3 across different seasons. Model 1 did not adjust for other factors. Model 2 adjusted for temperature, humidity, week effects, and holiday effects. Model 3 incorporated PM2.5 based on Model 2. Model 4 adjusted SO2 and NO2 based on Model 3 to build the final model. Except for Model 1, the relative risk (RR) differences in the other three models were not significant, particularly in the warm season.
Table 5 summarizes the mortality risk for CVD and CEVD in the elderly in Shenyang for each 10 μg/m3 increase in O3 across a lag of 0–7 days. In the full season, the effect was highest at lag1 (RR = 1.005, 95% CI: 1.002–1.007). As for the cumulative lag, the maximum is observed at lag06, with a cumulative RR value of 1.009 (95% CI: 1.001–1.016). In the warm season, the effect was most significant at lag1 (RR = 1.007, 95% CI: 1.004–1.010). As for the cumulative lag, the effect of O3 increased slowly from lag01 to lag07, reaching a maximum at lag06, with a cumulative RR = 1.017 (95% CI: 1.009–1.026). The effect of O3 on the death risk of CVD and CEVD in the elderly was not statistically significant in the cold season. Therefore, further subgroup analyses were conducted for the warm season.

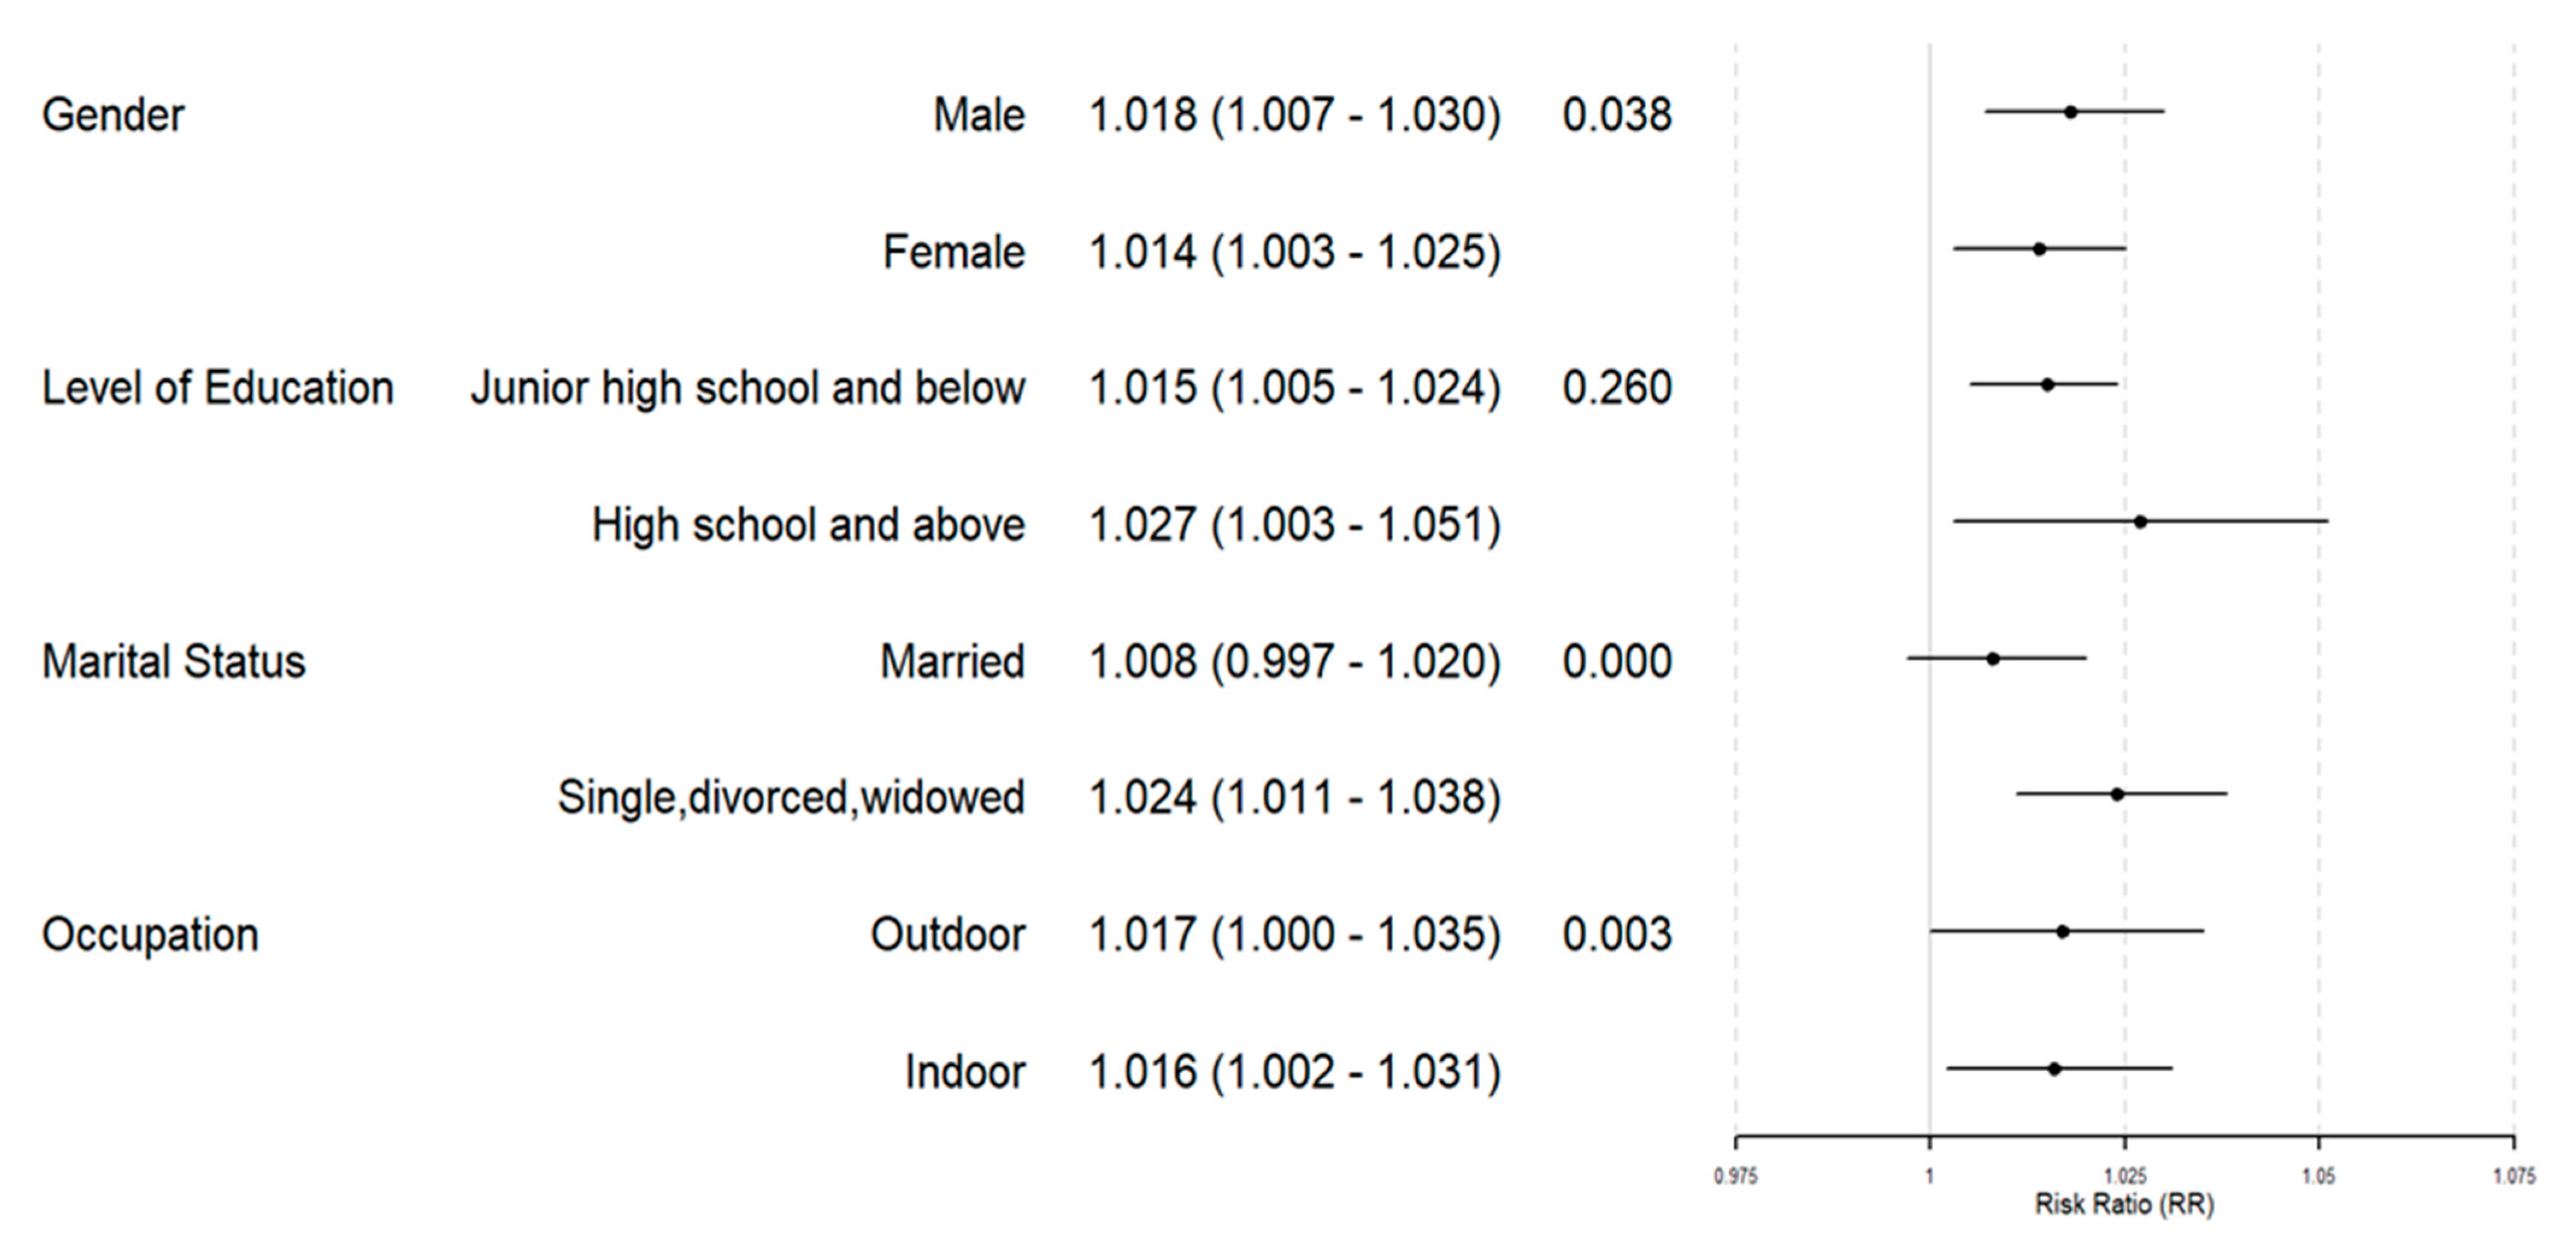
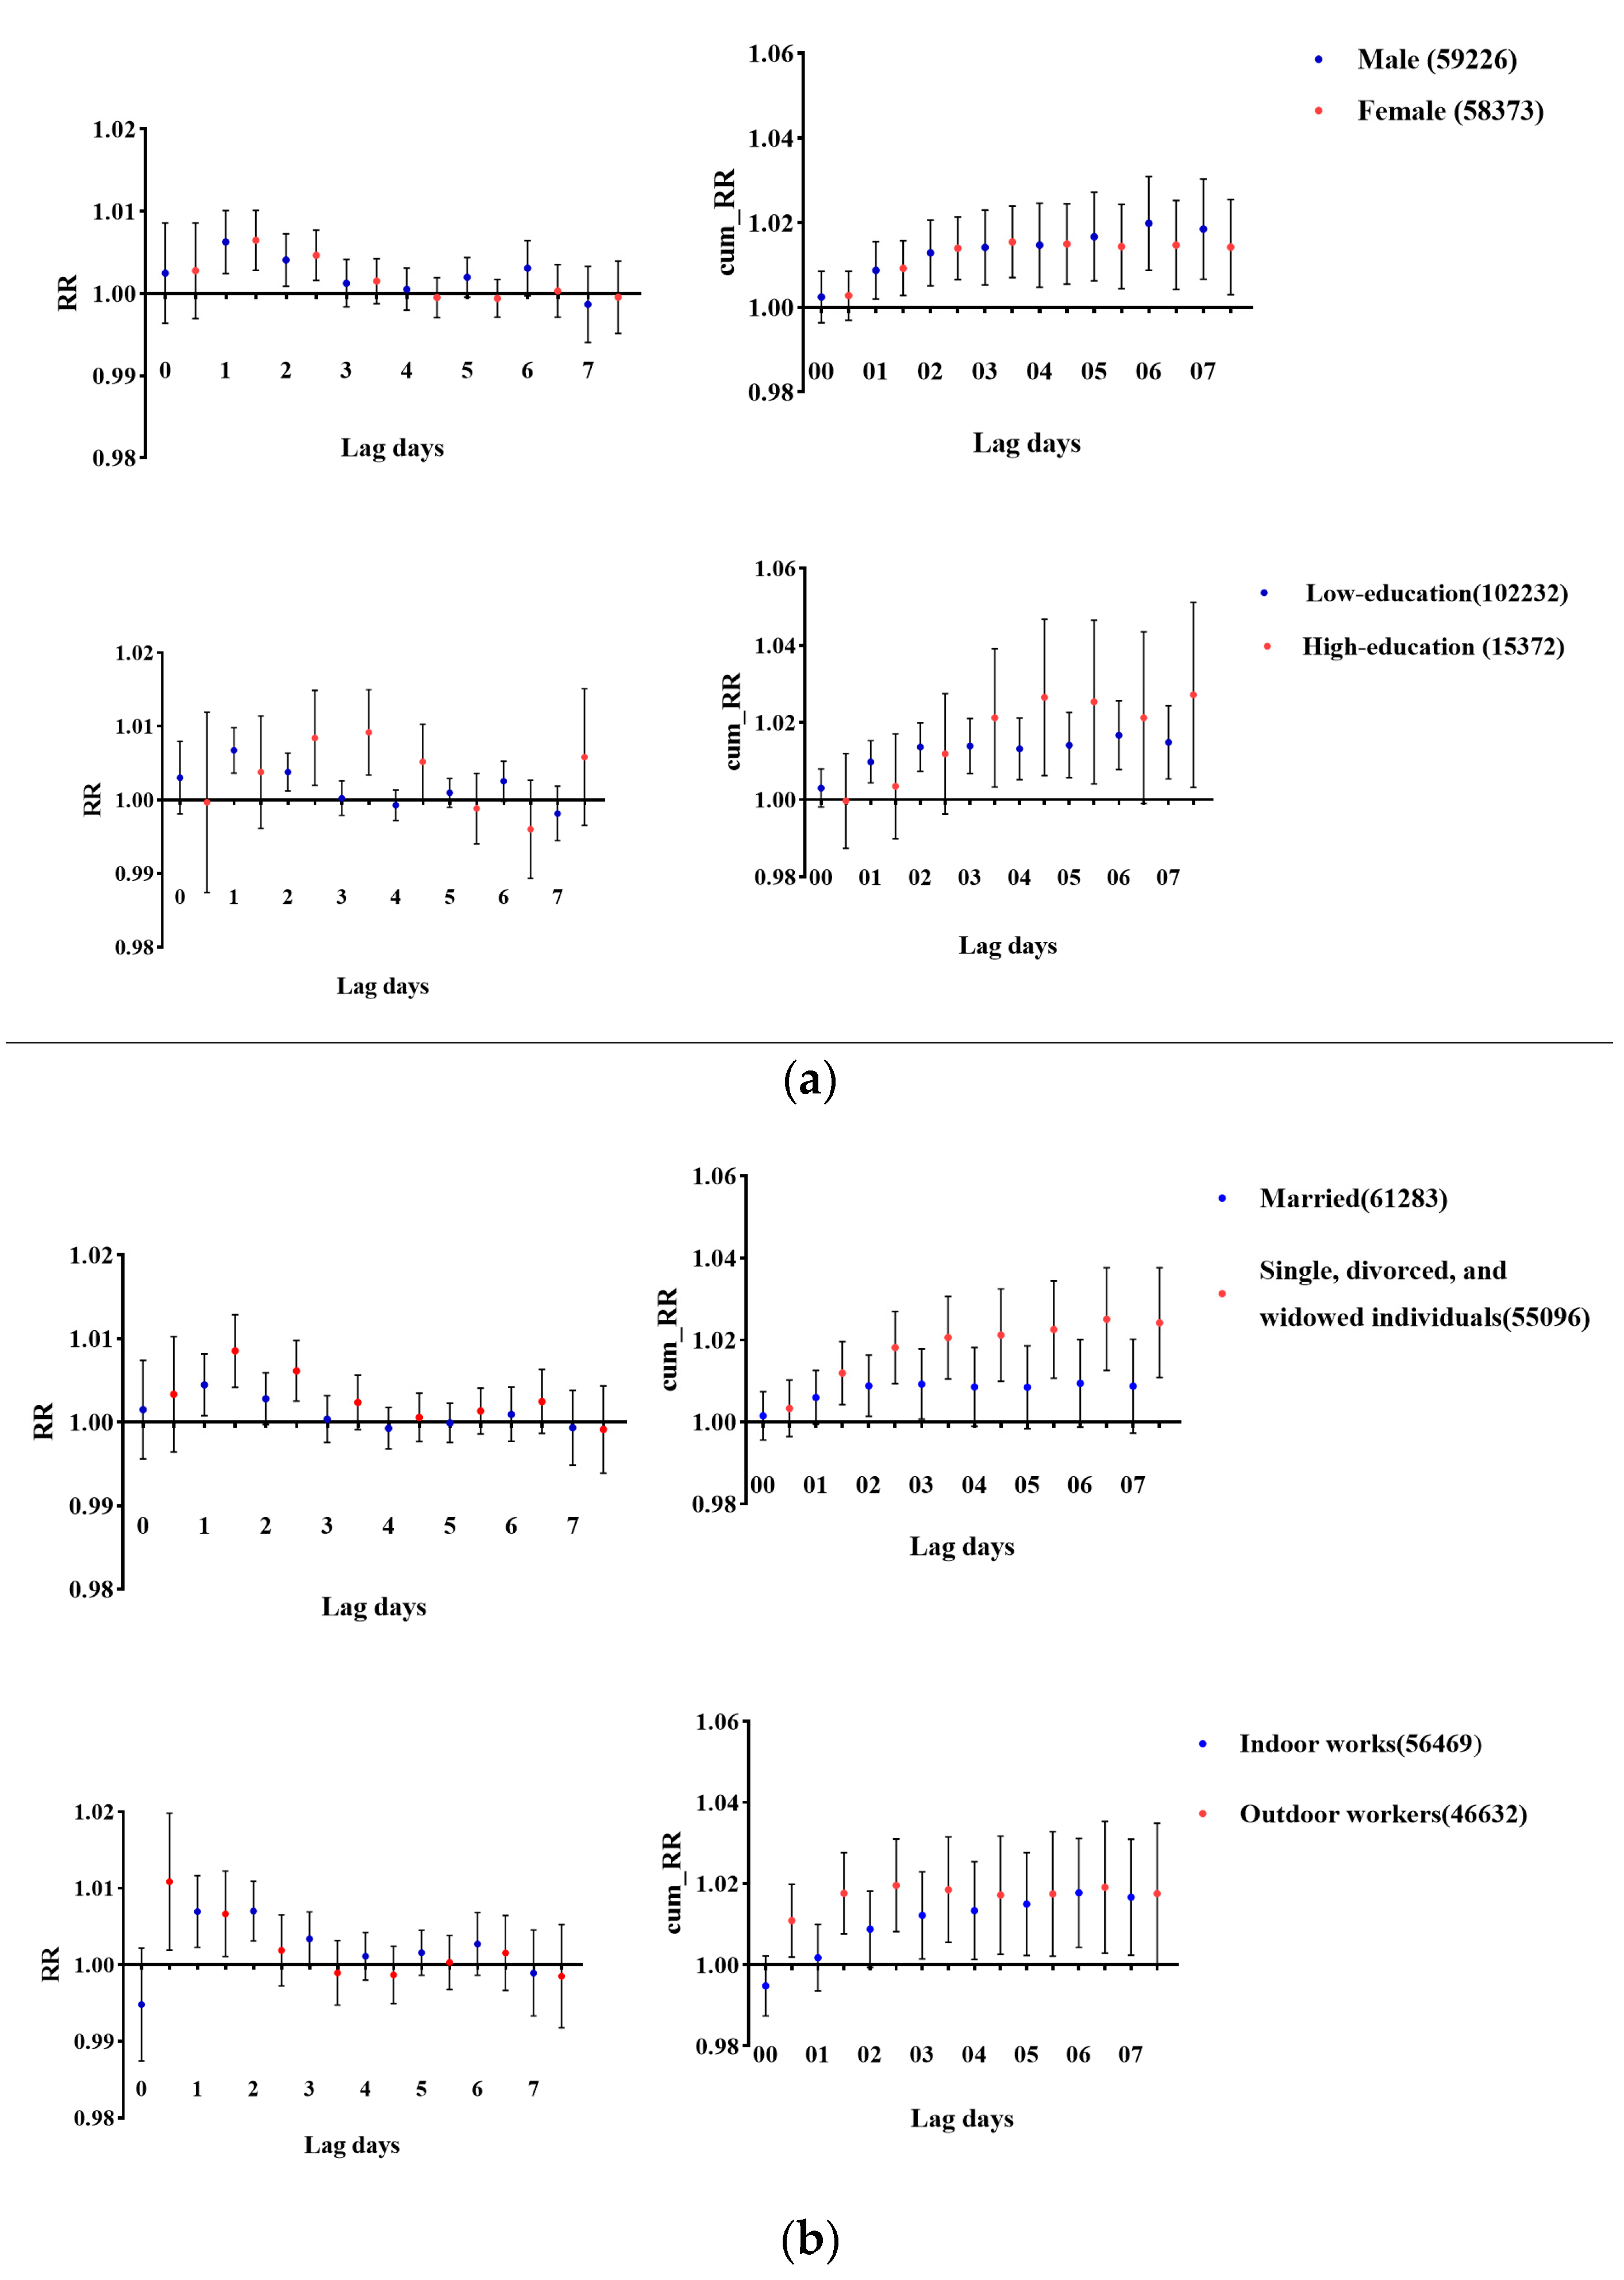
3.3. Subgroup Analysis of O3 Exposure

Figure 2 presents the RR (95% CI) for different subgroups in the warm season with each 10 μg/m3 increase in O3 concentration. It can be seen that the effect of O3 on CEVD and CVD mortality was greater in males than in females (p = 0.038). Single, divorced, and widowed individuals were more vulnerable to O3 exposure than married individuals, with a statistically significant difference between groups (p = 5.82 × 10⁻¹¹). Additionally, outdoor workers had a significantly higher risk compared to indoor workers (p = 0.003).
Figure 3 shows the RR (95% CI) and cumulative RR (95% CI) for different subgroups at a lag of 0–7 days. Males exhibited the largest cumulative RR value at lag06. The RR was 1.020 (95% CI: 1.009–1.026) per 10 μg/m3 increase in O3. For females, the cumulative RR was 1.014 (95% CI: 1.006–1.023) per 10 μg/m3 rise in O3 at lag03. In the low-education group, the cumulative RR was statistically significant for lag01 through lag06 with the highest cumulative effect at lag06 (RR = 1.017, 95% CI: 1.008–1.026). The impact of O3 on married individuals was not significant. It was an upward trend in the cumulative RR for single, divorced, and widowed individuals. Among outdoor workers, the cumulative RR peaked at lag02 (RR = 1.020, 95% CI: 1.008–1.030) but showed a declining trend after lag02.
As shown in Figure 4, the risk of death from CEVD and CVD followed an increasing trend when both PM2.5 and O3 rose. Additionally, it can be observed that in the cold season, O3 concentrations are lower while PM2.5 concentrations are higher. In the warm season, the mortality rate of cardiovascular and cerebrovascular diseases in the elderly is more strongly influenced by the combined effect of O3 and PM2.5.

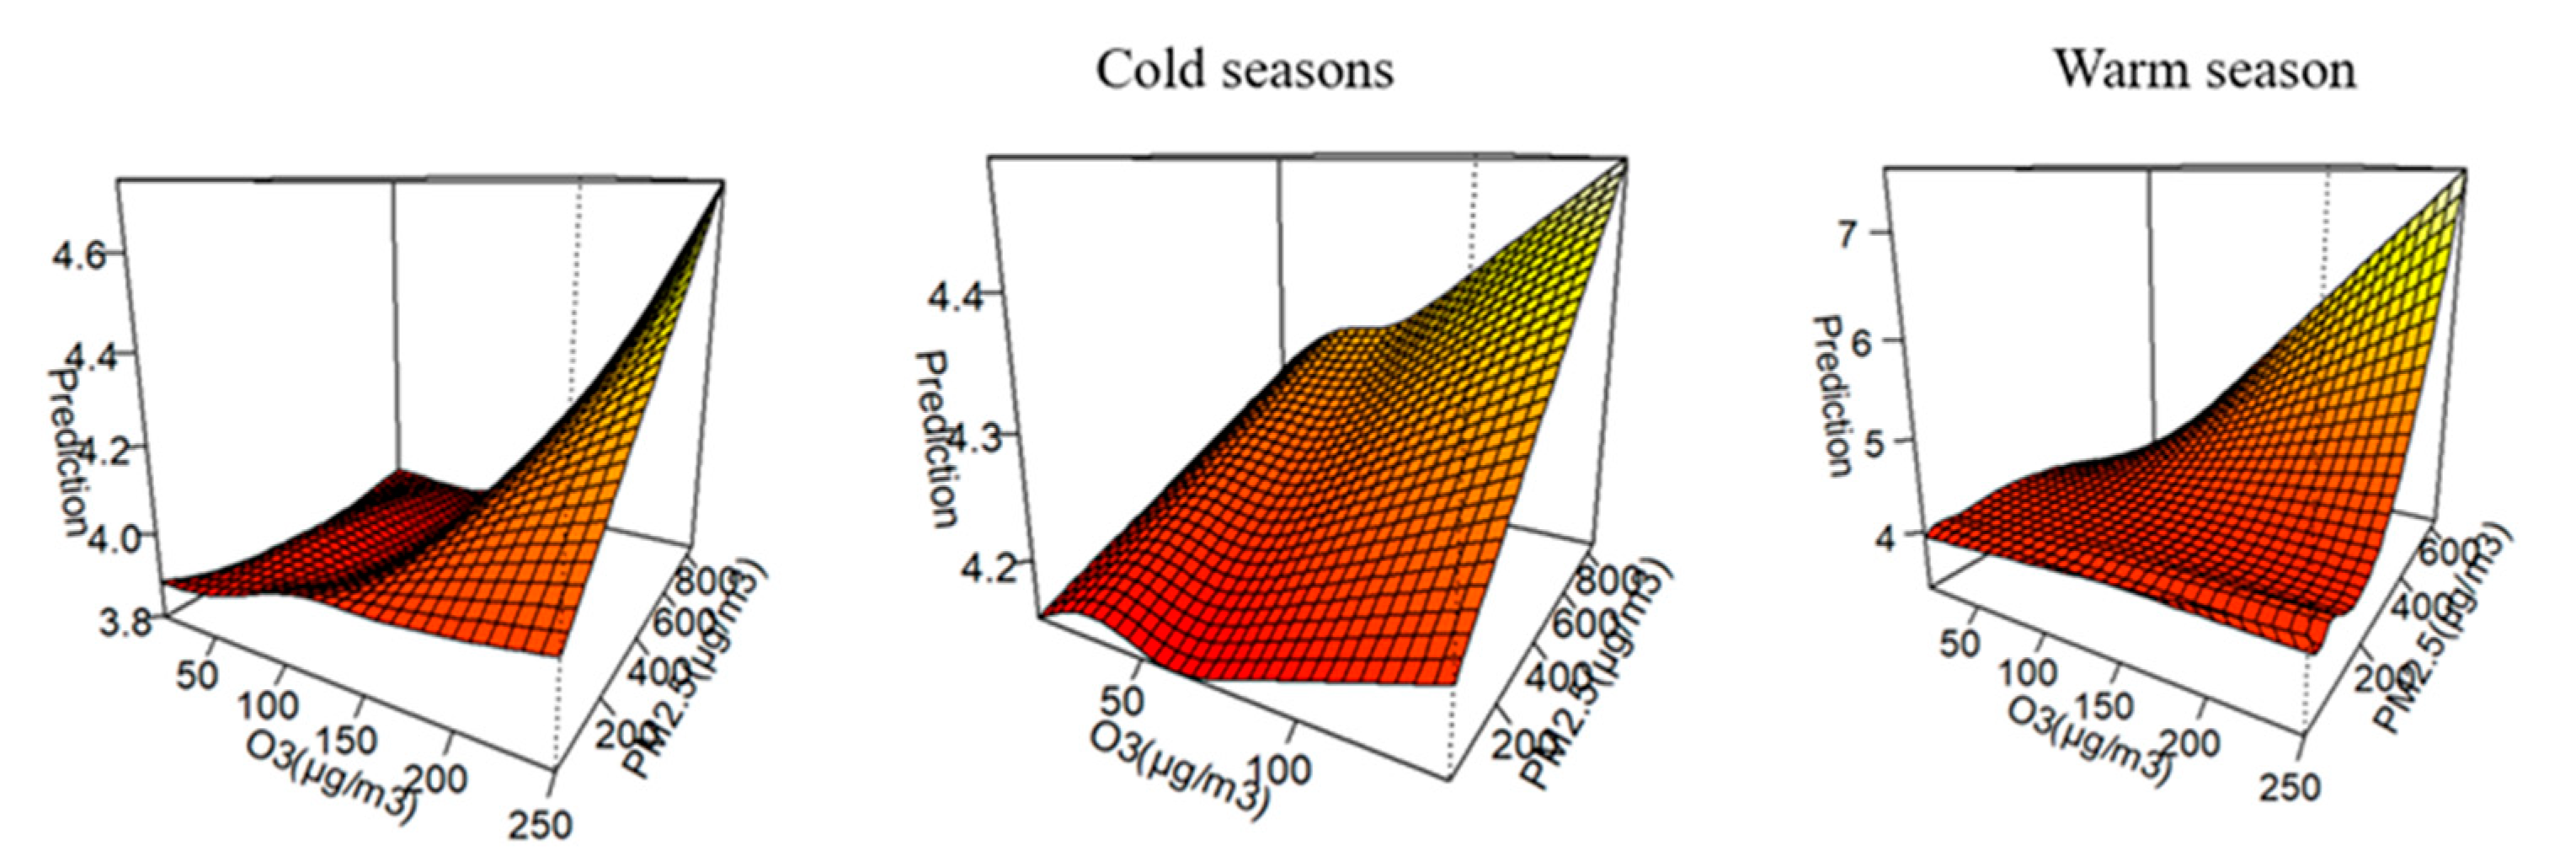
3.4. Joint Effect Between O3 and PM2.5

Table 6 describes the joint effect of O3 and PM2.5 on CEVD and CVD mortality. The RR for CEVD and CVD mortality at high PM2.5 were higher than those at low PM2.5 in both the single-pollutant model and two-pollutant model. The RR in the two-pollutant model is slightly more attenuated than in the single-pollutant model.

4. Discussion

This paper examined the relationship between O3 and the CVD and CEVD mortality in the elderly. We found a positive association between O3 concentration and the mortality risk from CVD and CEVD (RR: 1.007, 95% CI: 1.000–1.015). This association was stronger in the warm season compared to the cold season (RR: 1.01, 95% CI: 1.007–1.025). Males, individuals with low education, individuals with non-conventional marital status, and outdoor workers are more sensitive to O3 pollution. Additionally, we observed a synergistic effect of O3 and PM2.5 on CVD and CEVD mortality.

4.1. Effect of Ozone on CVD and CEVD

It indicated a significant relationship between O3 exposure and elevated mortality risk for CVD and CEVD in the elderly (RR: 1.007, 95% CI: 1.000–1.015). Previous studies have supported this observation [26,27,28]. Research on the relationship between O3 pollution and CEVD mortality has yielded inconsistent results. Studies from Taipei (OR: 1.031, 95% CI: 1.008–1.054) and Shenyang (ERR: 1.02%, 95% CI: 0.63–1.4%) have shown a positive correlation between the onset of CEVD and O3 exposure [29,30]. Furthermore, a nationwide study in China found that O3 is positively associated with the risk of CEVD hospitalization. The excess risk (ER) of hospitalization for CEVD per 10 μg/m3 increase in ozone concentration was 0.29% (95% CI: 0.18–0.40%) [31]. Research in Wuhan observed no significant effect of O3 on mortality in CEVD [32]. However, the results were different in regions with low O3 pollution. In rural Australia, where O3 concentrations remained in the single digits year-round, the association between O3 concentrations and daily hospitalizations for CVD and CEVD was negative (IRR: 0.96, 95% CI: 0.91–1.01) [9]. Studies of the elderly in New England, also from low-pollution areas, have not observed a protective or detrimental effect of O3 on CVD mortality [33]. According to another study in the United Kingdom, O3 has shown a negative correlation with CVD mortality. The ozone concentration range in this area was 40.5–63 μg/m3 [13]. It is suggested that ozone pollution control may be effective in reducing mortality from CVD and CEVD. Previous studies have shown that exposure to high concentrations of ozone decreases the high-frequency band of human heart rate variability and triggers the release of biomarkers associated with coagulation, platelet dysfunction, and endothelial damage. As a result, it increases the risk of CVD. [34]. However, the adverse effects of O3 on CVD and CEVD, and the underlying mechanisms, are not yet fully understood. Further studies are needed to clarify these mechanisms.
We also found that the effect of O3 on mortality from CVD and CEVD was greater in the warm season compared to the cold season. After adjusting for temperature, humidity, and other pollutants, we found that for each 10 μg/m3 increase in ozone concentration during the warm season, the mortality risk from CVD and CEVD in the elderly increased by 1.6% (95% CI: 0.7–2.5%). The relationship between ozone and cardiovascular disease in the elderly was not observed during the cold season. Previous studies have reached similar conclusions. A study in Lanzhou, China, showed that the effect of O3 on CVD mortality was stronger in the warm season than in the cold season [35]. Additionally, research in northern China has demonstrated that the association between O3 and all-cause mortality is stronger during the warm season [27]. This is likely because O3 is a secondary pollutant that is highly influenced by temperature, humidity, wind, and other environmental factors. Higher temperatures can promote ozone production, especially in northern, eastern, and northeastern Chinese cities where solar temperatures are higher during the warm season [36]. These findings may support our conclusions. A randomized crossover study of healthy young volunteers may provide a biological basis for the relationship between heat and ozone. The results suggest that the systemic effects of O3 exposure vary with temperature. O3 may activate the fibrinolytic pathway at appropriate temperatures. However, ozone may impair the fibrinolytic pathway which may prevent the growth of blood clots and lead to thrombosis at high temperatures [37]. The physiological mechanisms by which ozone and high temperatures interact to affect cardiovascular disease are not yet well elucidated. This may involve multiple pathways, and further studies are needed to elucidate these mechanisms.
We also found that the RR values were highest at a 1-day lag throughout the year, as well as during the warm season. The RR was 1.002 (95% CI: 1.000–1.004) and 1.005 (95% CI: 1.002–1.007) for each 10 μg/m3 increase in ozone concentration. The cumulative RR was maximum at a six-day lag (lag06). The cumulative RR for the whole year was 1.009 (95% CI: 1.001–1.016). The cumulative RR for the warm season was 1.017 (95% CI: 1.009–1.026). These findings align with results from Nanchang. The highest risk of death was observed at a 1-day lag. For each 10 μg/m3 rise in ozone concentration, the risk of death from CVD increased by 1.26% (0.68–1.8%). The highest cumulative multi-day lag effect was observed at a 0–6 days lag [8]. In Guangzhou, the highest CVD mortality risk was also observed at a 1-day lag. Differently, the cumulative effect was highest at 0–3 days [38]. The delayed impact of ozone on public health may be influenced by several factors, including the population structure, level of economic development, population-weighted ozone concentrations, regional public health policies, and healthcare resource allocation. The significant heterogeneity suggests that it is important to investigate and tailor public health policies to specific regions. Notably, previous studies have shown that ozone pollution is not a risk factor for CVD and CEVD in areas with sufficiently low ozone concentrations. Therefore, developing region-specific public health strategies, based on research, along with effective air pollution control policies, can significantly reduce CVD and CEVD mortality.

4.2. Subgroups More Sensitive to O3

Further subgroup analyses were conducted to examine the sensitivity of different population groups to O3 exposure. The results indicated that males were more susceptible to ozone, with statistically significant findings. However, females exhibited a more immediate response to O3 pollution. We found that males had the highest cumulative RR at lag06 and females had the highest cumulative RR at lag03. In contrast to our findings, some studies have shown that females are more sensitive to ozone exposure [8,26,30]. These studies concluded that females are more susceptible to air pollutants because their airways are shorter and they breathe differently than males. However, studies focusing on populations older than 65 years have reported results consistent with our findings [28,39,40]. A possible explanation for our findings could be that males tend to work or be more active outdoors, leading to greater exposure to air pollution [41]. Additionally, males may be more likely to pick up bad habits such as smoking and drinking. In China, the prevalence of smoking is 50.5% for males and 2.1% for females. It has been demonstrated that smokers are more susceptible to short-term air pollution exposure than never-smokers [42]. A nationwide study in China showed that individuals with healthier lifestyles had a reduced risk of cardiovascular disease, with reductions of approximately 38% and 62% under moderate and good lifestyle conditions, respectively, compared to poor lifestyles [43]. This suggests that adopting a healthy lifestyle can minimize the risk of CVD and CEVD.
We did not find any differences in the susceptibility to ozone pollution between populations with varying levels of education. In contrast to our study, previous research typically indicates that individuals with lower levels of education are more susceptible to the effects of ozone. A study conducted across 272 cities in China showed that for every 10 μg/m3 increase in ozone concentration, total mortality was four times higher in the lower-educated population compared to the higher-educated population [27]. Educational level has been proven a significant factor in the health effects of air pollution [44]. It is speculated that lower levels of healthcare awareness and limited financial resources in less educated groups contribute to poorer health outcomes [45]. Moreover, the low educated population is usually engaged in outdoor or manual labor which leads to greater exposure to ozone pollution. The difference between this study and previous research may be attributed to the fact that this study primarily focused on elderly individuals aged over 65, with a majority of participants having an education level of junior high school or below. Additionally, there was a large disparity in the sample sizes between the two groups.
This study found that unmarried, widowed, and divorced individuals are more sensitive to ozone pollution compared to married people. Research on the effects of air pollution by marital status is limited. It is possible that married individuals are healthier and less prone to depressive symptoms compared to individuals with unconventional marital status. Married individuals typically have access to emotional support and practical assistance from their partners, which enhances their ability to cope with environmental stressors. In contrast, unmarried, widowed, or divorced individuals may face more isolated social relationships, lacking sufficient support, and are more vulnerable to the negative effects of external pressures. Previous studies have shown that married individuals generally have better health outcomes and are less likely to experience depression. In contrast, unmarried, widowed, or divorced individuals often face a higher risk of depression, and depressive symptoms are closely associated with the onset of cardiovascular and cerebrovascular diseases [46]. Furthermore, certain depressive symptoms, including sleep disturbances and loneliness, are strongly correlated with the occurrence of CVD and CEVD [47].
We also found that outdoor workers were more vulnerable to O3 exposure than indoor workers. In particular, the negative impact of ozone on outdoor workers was already statistically significant at lag0. It is clear that outdoor workers are more exposed and vulnerable to ozone pollution. In addition, low-income individuals and farmers, who make up the majority of outdoor workers, are at higher risk. Studies have shown that low-income individuals are more vulnerable to ill health than high-income individuals [48] and at higher risk of death from exposure to air pollution [49]. CVD may occur within hours of exposure to ozone pollution [50]. Consequently, a negative effect of ozone on CVD and CEVD mortality was observed even at lag day 0. These subgroup analyses identified populations more sensitive to ozone pollution. They provide new and more targeted perspectives for future strategies to manage the burden of cardiovascular disease in Shenyang. However, more in-depth studies on socio-economic status (income, education, and occupation) and marital status are needed in the future.

4.3. Synergy EFfect Between PM2.5 and O3

Our study found a synergistic effect between ozone and PM2.5. Coexisting high concentrations of PM2.5 and O3 increase the mortality effect of CVD and CEVD. Studies conducted in Chengdu, China, and nationwide have reported similar findings, demonstrating significant synergistic effects of ozone and PM2.5 on CVD mortality in the population [51,52]. Biological mechanisms have been proposed to explain the potential interaction between PM2.5 and O3 pollution on cardiovascular mortality, despite the lack of clear evidence of a direct synergistic effect of these two pollutants on CVD and CEVD. Toxicological experiments conducted in rats have demonstrated that particulate matter can act as a carrier of O3 and deliver O3 into body [53]. Furthermore, studies have suggested that PM2.5 and O3 act on the human body with similar pathological pathways, such as inflammatory responses and oxidative stress, which may lead to interactions between the two pollutants [54]. This evidence hints at the existence of synergies between PM2.5 and O3, warranting further investigation and the development of policies for the co-control of both pollutants.

4.4. Limitations

An implication of this study is to recommend that individuals suffering from CVD and CEVD avoid exposure to higher levels of ambient PM2.5 and O3 in order to protect their health.
However, several limitations exist in our study. Firstly, previous studies on CEVD are limited, which we did not analyze meticulously and thoroughly. Secondly, the pollutant concentrations in this study were obtained from fixed-site detectors, which do not provide a completely accurate picture of the actual exposure of individuals and may differ from the real exposure of the population to ozone pollution. In future research, we plan to conduct studies at the individual level, using personal samplers to record air pollution exposure. Additionally, we will collect data on participants’ specific lifestyle and the time spent indoors and outdoors. Thirdly, the population data collected in this study was not sufficiently comprehensive. Future surveys should include factors such as smoking status, alcohol consumption, BMI, and living area. Finally, this study only examined the synergistic effect between O3 and PM2.5. Further research is needed to explore the synergistic effects of O3 with other pollutants or meteorological factors.

5. Conclusions

This study found that ozone pollution is associated with an increased risk of mortality from CVD and CEVD in the elderly, with this effect being more pronounced during warmer seasons and exhibiting a lag effect. The study also identified that, among individuals aged 65, males, those with non-traditional marital statuses, and outdoor workers are more susceptible to the health impacts of ozone pollution. No significant differences in susceptibility to ozone were found across different educational levels. Furthermore, this study revealed a synergistic effect between ozone and PM2.5. The combined impact of these pollutants on public health may be much greater than that of each pollutant individually. These findings contribute to a more comprehensive understanding of the health impacts of ozone and PM2.5. These findings, combined with the existing evidence, provide better estimates of the future burden of disease. They can help policymakers develop more targeted environmental policies that are effective in improving public health outcomes.

Author Contributions

Conceptualization, M.H.; methodology, J.W.; software, T.W.; validation, J.W. and Y.D.; formal analysis, T.W.; resources, L.S.; data curation, W.P., J.C., T.W., Y.X., Y.W. and Y.C.; writing—original draft preparation, T.W.; writing—review and editing, M.H.; supervision, M.H. All authors have read and agreed to the published version of the manuscript.

Funding

Central Guiding Local Science and Technology Development Plan (2024JH6/100800006).

Institutional Review Board Statement

Not applicable.

Informed Consent Statement

Patient consent was waived due to retrospective analysis of the anonymized data in this study.

Data Availability Statement

The data presented in this study are available on request from the corresponding author.

Acknowledgments

We sincerely thank the Liaoning Provincial Center for Disease Control and Prevention and the Department of Ecology and Environment of Liaoning Province for strong support in this study.

Conflicts of Interest

The authors declare no conflicts of interest.

References

  1. Yao, Y.; Ma, K.; He, C.; Zhang, Y.; Lin, Y.; Fang, F.; Li, S.; He, H. Urban Surface Ozone Concentration in Mainland China during 2015–2020: Spatial Clustering and Temporal Dynamics. Int. J. Environ. Res. Public. Health 2023, 20, 3810. [Google Scholar] [CrossRef]
  2. Donzelli, G.; Suarez-Varela, M.M. Tropospheric Ozone: A Critical Review of the Literature on Emissions, Exposure, and Health Effects. Atmosphere 2024, 15, 779. [Google Scholar] [CrossRef]
  3. He, C.; Wu, Q.; Li, B.; Liu, J.; Gong, X.; Zhang, L. Surface ozone pollution in China: Trends, exposure risks, and drivers. Front. Public Health 2023, 11, 1131753. [Google Scholar] [CrossRef] [PubMed]
  4. Murray, C.J.L.; Aravkin, A.Y.; Zheng, P.; Abbafati, C.; Abbas, K.M.; Abbasi-Kangevari, M.; Abd-Allah, F.; Abdelalim, A.; Abdollahi, M.; Abdollahpour, I.; et al. Global burden of 87 risk factors in 204 countries and territories, 1990–2019: A systematic analysis for the Global Burden of Disease Study 2019. Lancet 2020, 396, 1223–1249. [Google Scholar] [CrossRef] [PubMed]
  5. Malashock, D.A.; Delang, M.N.; Becker, J.S.; Serre, M.L.; West, J.J.; Chang, K.-L.; Cooper, O.R.; Anenberg, S.C. Global trends in ozone concentration and attributable mortality for urban, peri-urban, and rural areas between 2000 and 2019: A modelling study. Lancet Planet. Health 2022, 6, e958–e967. [Google Scholar] [CrossRef]
  6. Zheng, X.; Orellano, P.; Lin, H.; Jiang, M.; Guan, W. Short-term exposure to ozone, nitrogen dioxide, and sulphur dioxide and emergency department visits and hospital admissions due to asthma: A systematic review and meta-analysis. Environ. Int. 2021, 150, 106435. [Google Scholar] [CrossRef]
  7. Ensor, K.B.; Raun, L.H.; Persse, D. A Case-Crossover Analysis of Out-of-Hospital Cardiac Arrest and Air Pollution. Circulation 2013, 127, 1192–1199. [Google Scholar] [CrossRef]
  8. Wu, H.; Lu, K.; Fu, J. A Time-Series Study for Effects of Ozone on Respiratory Mortality and Cardiovascular Mortality in Nanchang, Jiangxi Province, China. Front. Public Health 2022, 10, 864537. [Google Scholar] [CrossRef]
  9. Hasnain, M.G.; Garcia-Esperon, C.; Tomari, Y.K.; Walker, R.; Saluja, T.; Rahman, M.M.; Boyle, A.; Levi, C.R.; Naidu, R.; Filippelli, G.; et al. Effect of short-term exposure to air pollution on daily cardio- and cerebrovascular hospitalisations in areas with a low level of air pollution. Environ. Sci. Pollut. Res. 2023, 30, 102438–102445. [Google Scholar] [CrossRef]
  10. Brauer, M.; Freedman, G.; Frostad, J.; Van Donkelaar, A.; Martin, R.V.; Dentener, F.; Dingenen, R.V.; Estep, K.; Amini, H.; Apte, J.S.; et al. Ambient Air Pollution Exposure Estimation for the Global Burden of Disease 2013. Environ. Sci. Technol. 2016, 50, 79–88. [Google Scholar] [CrossRef]
  11. Turner, M.C.; Jerrett, M.; Pope, C.A.; Krewski, D.; Gapstur, S.M.; Diver, W.R.; Beckerman, B.S.; Marshall, J.D.; Su, J.; Crouse, D.L.; et al. Long-Term Ozone Exposure and Mortality in a Large Prospective Study. Am. J. Respir. Crit. Care Med. 2016, 193, 1134–1142. [Google Scholar] [CrossRef] [PubMed]
  12. Crouse, D.L.; Peters, P.A.; Hystad, P.; Brook, J.R.; Van Donkelaar, A.; Martin, R.V.; Villeneuve, P.J.; Jerrett, M.; Goldberg, M.S.; Pope, C.A.; et al. Ambient PM 2.5, O 3, and NO 2 Exposures and Associations with Mortality over 16 Years of Follow-Up in the Canadian Census Health and Environment Cohort (CanCHEC). Environ. Health Perspect. 2015, 123, 1180–1186. [Google Scholar] [CrossRef] [PubMed]
  13. Carey, I.M.; Atkinson, R.W.; Kent, A.J.; Van Staa, T.; Cook, D.G.; Anderson, H.R. Mortality Associations with Long-Term Exposure to Outdoor Air Pollution in a National English Cohort. Am. J. Respir. Crit. Care Med. 2013, 187, 1226–1233. [Google Scholar] [CrossRef]
  14. Atkinson, R.W.; Butland, B.K.; Dimitroulopoulou, C.; Heal, M.R.; Stedman, J.R.; Carslaw, N.; Jarvis, D.; Heaviside, C.; Vardoulakis, S.; Walton, H.; et al. Long-term exposure to ambient ozone and mortality: A quantitative systematic review and meta-analysis of evidence from cohort studies. BMJ Open 2016, 6, e009493. [Google Scholar] [CrossRef] [PubMed]
  15. Niu, Y.; Zhou, Y.; Chen, R.; Yin, P.; Meng, X.; Wang, W.; Liu, C.; Ji, J.S.; Qiu, Y.; Kan, H.; et al. Long-term exposure to ozone and cardiovascular mortality in China: A nationwide cohort study. Lancet Planet. Health 2022, 6, e496–e503. [Google Scholar] [CrossRef]
  16. Cao, X.; You, X.; Wang, D.; Qiu, W.; Guo, Y.; Zhou, M.; Chen, W.; Zhang, X. Short-term effects of ambient ozone exposure on daily hospitalizations for circulatory diseases in Ganzhou, China: A time-series study. Chemosphere 2023, 327, 138513. [Google Scholar] [CrossRef]
  17. Chien, T.-Y.; Ting, H.-W.; Chan, C.-L.; Yang, N.-P.; Pan, R.-H.; Lai, K.; Hung, S.-I. Does the Short-Term Effect of Air Pollution Influence the Incidence of Spontaneous Intracerebral Hemorrhage in Different Patient Groups? Big Data Analysis in Taiwan. Int. J. Environ. Res. Public. Health 2017, 14, 1547. [Google Scholar] [CrossRef]
  18. Yang, Y.C.; Li, J.W.; Sun, B.; Chen, Y.L.; Shen, S.Q.; Yuan, C. Cardiovascular and Cerebrovascular Diseases Induced by Air Pollution. Acta Acad. Med. Sin. 2022, 44, 318–323. [Google Scholar]
  19. Lin, J.; Zheng, H.; Xia, P.; Cheng, X.; Wu, W.; Li, Y.; Ma, C.; Zhu, G.; Xu, T.; Zheng, Y.; et al. Long-term ambient PM2.5 exposure associated with cardiovascular risk factors in Chinese less educated population. BMC Public Health 2021, 21, 2241. [Google Scholar] [CrossRef]
  20. Yap, J.; Ng, Y.; Yeo, K.K.; Sahlén, A.; Lam, C.S.P.; Lee, V.; Ma, S. Particulate air pollution on cardiovascular mortality in the tropics: Impact on the elderly. Environ. Health 2019, 18, 34. [Google Scholar] [CrossRef]
  21. Fan, S.-J.; Heinrich, J.; Bloom, M.S.; Zhao, T.-Y.; Shi, T.-X.; Feng, W.-R.; Sun, Y.; Shen, J.-C.; Yang, Z.-C.; Yang, B.-Y.; et al. Ambient air pollution and depression: A systematic review with meta-analysis up to 2019. Sci. Total Environ. 2020, 701, 134721. [Google Scholar] [CrossRef]
  22. Chen, J.; Shen, H.; Li, T.; Peng, X.; Cheng, H.; Ma, C. Temporal and Spatial Features of the Correlation between PM2.5 and O3 Concentrations in China. Int. J. Environ. Res. Public Health 2019, 16, 4824. [Google Scholar] [CrossRef]
  23. Niu, Z.; Duan, Z.; Wei, J.; Wang, F.; Han, D.; Zhang, K.; Jing, Y.; Wen, W.; Qin, W.; Yang, X. Associations of long-term exposure to ambient ozone with hypertension, blood pressure, and the mediation effects of body mass index: A national cross-sectional study of middle-aged and older adults in China. Ecotoxicol. Environ. Saf. 2022, 242, 113901. [Google Scholar] [CrossRef] [PubMed]
  24. Bhaskaran, K.; Gasparrini, A.; Hajat, S.; Smeeth, L.; Armstrong, B. Time series regression studies in environmental epidemiology. Int. J. Epidemiol. 2013, 42, 1187–1195. [Google Scholar] [CrossRef]
  25. Ma, Y.; Yang, S.; Yu, Z.; Jiao, H.; Zhang, Y.; Ma, B. A study on the short-term impact of fine particulate matter pollution on the incidence of cardiovascular diseases in Beijing, China. Atmos. Environ. 2019, 215, 116889. [Google Scholar] [CrossRef]
  26. Zhang, J.; Chen, Q.; Wang, Q.; Ding, Z.; Sun, H.; Xu, Y. The acute health effects of ozone and PM2.5 on daily cardiovascular disease mortality: A multi-center time series study in China. Ecotoxicol. Environ. Saf. 2019, 174, 218–223. [Google Scholar] [CrossRef] [PubMed]
  27. Yin, P.; Chen, R.; Wang, L.; Meng, X.; Liu, C.; Niu, Y.; Lin, Z.; Liu, Y.; Liu, J.; Qi, J.; et al. Ambient Ozone Pollution and Daily Mortality: A Nationwide Study in 272 Chinese Cities. Environ. Health Perspect. 2017, 125, 117006. [Google Scholar] [CrossRef]
  28. Liu, S.; Zhang, Y.; Ma, R.; Liu, X.; Liang, J.; Lin, H.; Shen, P.; Zhang, J.; Lu, P.; Tang, X.; et al. Long-term exposure to ozone and cardiovascular mortality in a large Chinese cohort. Environ. Int. 2022, 165, 107280. [Google Scholar] [CrossRef]
  29. Chan, C.-C.; Chuang, K.-J.; Chien, L.-C.; Chen, W.-J.; Chang, W.-T. Urban air pollution and emergency admissions for cerebrovascular diseases in Taipei, Taiwan. Eur. Heart J. 2006, 27, 1238–1244. [Google Scholar] [CrossRef]
  30. Liu, G.; Sun, B.; Yu, L.; Chen, J.; Han, B.; Li, Y.; Chen, J. The Gender-Based Differences in Vulnerability to Ambient Air Pollution and Cerebrovascular Disease Mortality: Evidences Based on 26781 Deaths. Glob. Heart 2020, 15, 46. [Google Scholar] [CrossRef]
  31. Liu, T.; Jiang, Y.; Hu, J.; Li, Z.; Li, X.; Xiao, J.; Yuan, L.; He, G.; Zeng, W.; Rong, Z.; et al. Joint Associations of Short-Term Exposure to Ambient Air Pollutants with Hospital Admission of Ischemic Stroke. Epidemiology 2023, 34, 282–292. [Google Scholar] [CrossRef]
  32. Yan, Y.; Chen, X.; Guo, Y.; Wu, C.; Zhao, Y.; Yang, N.; Dai, J.; Gong, J.; Xiang, H. Ambient air pollution and cerebrovascular disease mortality: An ecological time-series study based on 7-year death records in central China. Environ. Sci. Pollut. Res. 2021, 28, 27299–27307. [Google Scholar] [CrossRef] [PubMed]
  33. Qiu, X.; Wei, Y.; Wang, Y.; Di, Q.; Sofer, T.; Awad, Y.A.; Schwartz, J. Inverse probability weighted distributed lag effects of short-term exposure to PM2.5 and ozone on CVD hospitalizations in New England Medicare participants—Exploring the causal effects. Environ. Res. 2020, 182, 109095. [Google Scholar] [CrossRef] [PubMed]
  34. Day, D.B.; Xiang, J.; Mo, J.; Li, F.; Chung, M.; Gong, J.; Weschler, C.J.; Ohman-Strickland, P.A.; Sundell, J.; Weng, W.; et al. Association of Ozone Exposure With Cardiorespiratory Pathophysiologic Mechanisms in Healthy Adults. JAMA Intern. Med. 2017, 177, 1344–1353. [Google Scholar] [CrossRef]
  35. Yu, J.; Zhu, A.; Liu, M.; Dong, J.; Chen, R.; Tian, T.; Liu, T.; Ma, L.; Ruan, Y. Association Between Air Pollution and Cardiovascular Disease Hospitalizations in Lanzhou City, 2013–2020: A Time Series Analysis. GeoHealth 2024, 8, e2022GH000780. [Google Scholar] [CrossRef] [PubMed]
  36. Fang, C.; Zhang, Z.; Jin, M.; Zou, P.; Wang, J. Pollution Characteristics of PM2.5 Aerosol during Haze Periods in Changchun, China. Aerosol Air Qual. Res. 2017, 17, 888–895. [Google Scholar] [CrossRef]
  37. Kahle, J.J.; Neas, L.M.; Devlin, R.B.; Case, M.W.; Schmitt, M.T.; Madden, M.C.; Diaz-Sanchez, D. Interaction Effects of Temperature and Ozone on Lung Function and Markers of Systemic Inflammation, Coagulation, and Fibrinolysis: A Crossover Study of Healthy Young Volunteers. Environ. Health Perspect. 2015, 123, 310–316. [Google Scholar] [CrossRef]
  38. Li, M.; Dong, H.; Wang, B.; Zhao, W.; Zare Sakhvidi, M.J.; Li, L.; Lin, G.; Yang, J. Association between ambient ozone pollution and mortality from a spectrum of causes in Guangzhou, China. Sci. Total Environ. 2021, 754, 142110. [Google Scholar] [CrossRef]
  39. Adebayo-Ojo, T.C.; Wichmann, J.; Arowosegbe, O.O.; Probst-Hensch, N.; Schindler, C.; Künzli, N. Short-Term Effects of PM10, NO2, SO2 and O3 on Cardio-Respiratory Mortality in Cape Town, South Africa, 2006–2015. Int. J. Environ. Res. Public Health 2022, 19, 8078. [Google Scholar] [CrossRef]
  40. Liang, S.; Chen, Y.; Sun, X.; Dong, X.; He, G.; Pu, Y.; Fan, J.; Zhong, X.; Chen, Z.; Lin, Z.; et al. Long-term exposure to ambient ozone and cardiovascular diseases: Evidence from two national cohort studies in China. J. Adv. Res. 2023, 62, 165–173. [Google Scholar] [CrossRef]
  41. Ai, S. Long-term exposure to ambient fine particles associated with asthma: A cross-sectional study among older adults in six low- and middle-income countries. Environ. Res. 2019, 168, 141–145. [Google Scholar] [CrossRef] [PubMed]
  42. Sun, S. Cigarette smoking increases deaths associated with air pollution in Hong Kong. Atmos. Environ. 2020, 223, 117266. [Google Scholar] [CrossRef]
  43. Hu, X.; Knibbs, L.D.; Zhou, Y.; Ou, Y.; Dong, G.-H.; Dong, H. The role of lifestyle in the association between long-term ambient air pollution exposure and cardiovascular disease: A national cohort study in China. BMC Med. 2024, 22, 93. [Google Scholar] [CrossRef] [PubMed]
  44. Kan, H.; London, S.J.; Chen, G.; Zhang, Y.; Song, G.; Zhao, N.; Jiang, L.; Chen, B. Season, Sex, Age, and Education as Modifiers of the Effects of Outdoor Air Pollution on Daily Mortality in Shanghai, China: The Public Health and Air Pollution in Asia (PAPA) Study. Environ. Health Perspect. 2008, 116, 1183–1188. [Google Scholar] [CrossRef]
  45. Samal, D.; Greisenegger, S.; Auff, E.; Lang, W.; Lalouschek, W. The Relation Between Knowledge About Hypertension and Education in Hospitalized Patients With Stroke in Vienna. Stroke 2007, 38, 1304–1308. [Google Scholar] [CrossRef]
  46. Kim, H.; Cho, J.; Isehunwa, O.; Noh, J.; Noh, Y.; Oh, S.S.; Koh, S.-B.; Kim, C. Marriage as a social tie in the relation of depressive symptoms attributable to air pollution exposure among the elderly. J. Affect. Disord. 2020. [Google Scholar] [CrossRef]
  47. Li, H.; Zheng, D.; Li, Z.; Wu, Z.; Feng, W.; Cao, X.; Wang, J.; Gao, Q.; Li, X.; Wang, W.; et al. Association of Depressive Symptoms With Incident Cardiovascular Diseases in Middle-Aged and Older Chinese Adults. JAMA Netw. Open 2019, 2, e1916591. [Google Scholar] [CrossRef]
  48. Liu, W.; Xu, Z.; Yang, T. Health Effects of Air Pollution in China. Int. J. Envrion. Res. Public Health 2018, 15, 1471. [Google Scholar] [CrossRef] [PubMed]
  49. Jbaily, A. Air pollution exposure disparities across US population and income groups. Nature 2022, 601, 228–233. [Google Scholar] [CrossRef]
  50. Wu, K.; Ho, H.C.; Su, H.; Huang, C.; Zheng, H.; Zhang, W.; Tao, J.; Hossain, M.Z.; Zhang, Y.; Hu, K.; et al. A systematic review and meta-analysis of intraday effects of ambient air pollution and temperature on cardiorespiratory morbidities: First few hours of exposure matters to life. eBioMedicine 2022, 86, 104327. [Google Scholar] [CrossRef]
  51. Zhang, Y.; Yin, Z.; Li, S.; Zhang, J.; Sun, H.Z.; Liu, K.; Shirai, K.; Hu, K.; Qiu, C.; Liu, X.; et al. Ambient PM2.5, ozone and mortality in Chinese older adults: A nationwide cohort analysis (2005–2018). J. Hazard. Mater. 2023, 454, 131539. [Google Scholar] [CrossRef] [PubMed]
  52. Liu, C.; Chen, R.; Sera, F.; Vicedo-Cabrera, A.M.; Guo, Y.; Tong, S.; Lavigne, E.; Correa, P.M.; Ortega, N.V.; Achilleos, S.; et al. Interactive effects of ambient fine particulate matter and ozone on daily mortality in 372 cities: Two stage time series analysis. BMJ 2023, 383, e075203. [Google Scholar] [CrossRef] [PubMed]
  53. Mølhave, L.; Kjaergaard, S.K.; Sigsgaard, T.; Lebowitz, M. Interaction between ozone and airborne particulate matter in office air. Indoor Air 2005, 15, 383–392. [Google Scholar] [CrossRef]
  54. Lin, H.; Guo, Y.; Ruan, Z.; Yang, Y.; Chen, Y.; Zheng, Y.; Cummings-Vaughn, L.A.; Rigdon, S.E.; Vaughn, M.G.; Sun, S.; et al. Ambient PM2.5 and O3 and their combined effects on prevalence of presbyopia among the elderly: A cross-sectional study in six low- and middle-income countries. Sci. Total Environ. 2019, 655, 168–173. [Google Scholar] [CrossRef] [PubMed]
Figure 1. The map of Shenyang city, Liaoning province.
Toxics 13 00184 g001
Figure 2. Associations of cardiovascular mortality with a 10 μg/m3 increase in warm-season O3 concentrations for different subgroups.
Toxics 13 00184 g002
Figure 3. (a) The relative risk (lag0–7) and (b) the cumulative relative risk (lag00–07) per 10 μg/m3 of O3 elevation for a lag of 0–7 days in different subgroups.
Toxics 13 00184 g003
Figure 4. Bivariate response of PM2.5 and O3 to CEVD and CVD deaths in the elderly in Shenyang.
Toxics 13 00184 g004
Table 1. Basic characteristics of the participants. Data are mean ± standard deviation or n(%).
Characteristics Overall (n = 117,604)
Age80.3 ± 7.85
GenderMale59,226 (50.4)
Female58,373 (49.6)
Level of educationJunior high school and below102,232 (86.9)
High school and above15,372 (13.1)
Marital statusMarried61,283 (52.1)
Single, divorced and widowed55,096 (46.8)
Unknow 1225 (1.0)
OccupationIndoor56,469 (48.0)
Outdoor 46,632 (39.6)
Unknow14,503 (12.3)
Cause of deathsCVD (I05~I52)72,724 (61.8)
CEVD (I60~I69)44,880 (38.2)
Table 2. Descriptive statistic of O3, PM2.5, SO2, NO2, temperature and relative humidity from 2014 to 2018.
Mean SDMin Max P25P50P75
O3 (μg/m3)
O3-warm
O3-cold
66.7
84.7
41.9
40.3
40.5
22.2
9
10
9
250
250
140
35
56
24
59
79
37
88
107
54
PM2.5 (μg/m3)
PM2.5-warm
PM2.5-cold
56.5
41.6
77.6
47.3
31.7
56.7
4
4
10
848
632
848
28
24
41
43
35
65
72
51
101
SO2 (μg/m3)
SO2-warm
SO2-cold
47.9
19.8
87.6
55.1
12.0
66.6
3
3
10
527
120
527
15
11
39
27
17
70
57
26
114
NO2 (μg/m3)
NO2-warm
NO2-cold
41.8
36.3
49.7
17.1
14.0
18.0
12
12
14
125
109
125
29
27
36
39
34
48
51
43
61
Temperature (°C)
Temperature-warm
Temperature-cold
9.1
18.5
−4.2
13.1
6.7
7.2
−23
−5
−23
32
32
16
−3
14
−9
11
20
−5
21.2
24
1
RH (%)
RH-warm
RH-cold
59.9
62.9
55.6
16.3
17.0
14.2
15
15
22
98
98
91
47.8
52
45
61
66
55
72
75
66
Table 3. Spearman’s rank correlation coefficients between pollutants and meteorological variables (* p < 0.01).
PM2.5PM10SO2NO2COO3-8 hTRh
Rh (%)−0.04−0.10 *−0.22−0.030.16 *−0.08 *0.32 *1
T (°C)−0.39 *−0.28 *−0.068 *−0.41 *−0.22 *0.69 *1
O3-8 h (μg/m3)−0.16 *−0.06 *−0.39 *−0.35 *−0.2 *1
CO (mg/m3)0.8 *0.65 *0.63 *0.73 *1
NO2 (μg/m3)0.74 *0.63 *0.71 *1
SO2 (μg/m3)0.71 *0.52 *1
PM10 (μg/m3)0.89 *1
PM2.5 (μg/m3)1
Table 4. The relative risk (RR) of CEVD and CVD mortality associated with ambient O3 concentration (per 10 μg/m3).
O3 (RR)Warm Season O3 (RR)Cold Season O3 (RR)
Model 11.027 (1.019~1.034)1.032 (1.024~1.040)1.005 (0.988~1.023)
Model 21.008 (1.000~1.016)1.016 (1.007~1.025)1.015 (0.993~1.037)
Model 31.007 (0.999~1.015)1.016 (1.007~1.025)1.016 (0.993~1.038)
Model 41.007 (1.000~1.015)1.016 (1.007~1.025)1.007 (0.986~1.029)
Table 5. The relative risk (lag0–7) and the cumulative relative risk (lag00–07) per 10 μg/m3 of O3 elevation for lag 0–7 days.
LagO3Warm Season O3 Cold Season O3
lag01.002 (0.998–1.006)1.002 (0.997–1.006)1.003 (0.994–1.012)
lag11.005 (1.002–1.007)1.007 (1.004–1.010)1.003 (0.997–1.010)
lag21.002 (1.000–1.004)1.005 (1.002–1.007)0.999 (0.994–1.005)
lag30.999 (0.997–1.001)1.001 (0.999–1.004)0.996 (0.991–1.001)
lag40.998 (0.997–1.000)1.000 (0.998–1.002)0.997 (0.992–1.002)
lag51.001 (0.999–1.002)1.000 (1.000–1.003)1.001 (0.997–1.006)
lag61.002 (1.000–1.005)1.002 (1.000–1.005)1.005 (0.999–1.011)
lag70.998 (0.995–1.002)0.998 (0.995–1.002)1.002 (0.994–1.009)
lag001.002 (0.998–1.006)1.002 (0.997–1.006)1.003 (0.993–1.012)
lag011.007 (1.002–1.011)1.008 (1.003–1.014)1.006 (0.994–1.018)
lag021.009 (1.003–1.014)1.013 (1.007–1.019)1.005 (0.991–1.020)
lag031.007 (1.001–1.013)1.015 (1.008–1.021)1.001 (0.985–1.018)
lag041.006 (1.000–1.013)1.014 (1.007–1.022)0.998 (0.980–1.017)
lag051.006 (1.000–1.014)1.015 (1.007–1.023)1.000 (0.980–1.020)
lag061.009 (1.001–1.016)1.017 (1.009–1.026)1.005 (0.985–1.023)
lag071.007 (1.000–1.015)1.016 (1.007–1.025)1.007 (0.986–1.002)
Table 6. The RR of CEVD and CVD mortality for each 10 μg/m3 increase in O3 at different PM2.5 concentrations in warm season (lag = 1).
Model Pollutants RR (95% CI)
Single-pollutant analysisO3 (PM2.5low)0.998 (0.995–1.004)
O3 (PM2.5high)1.006 (1.000–1.007)
Two-pollutant analysisO3-PM2.5low0.998 (0.992–1.003)
O3-PM2.5high1.001 (1.000–1.004)
Disclaimer/Publisher’s Note: The statements, opinions and data contained in all publications are solely those of the individual author(s) and contributor(s) and not of MDPI and/or the editor(s). MDPI and/or the editor(s) disclaim responsibility for any injury to people or property resulting from any ideas, methods, instructions or products referred to in the content.

