Article

Impacts of NO2 on Urban Air Quality and Causes of Its High Ambient Levels: Insights from a Relatively Long-Term Data Analysis in a Typical Petrochemical City in the Bohai Bay Region, China

1
State Key Laboratory of Environmental Criteria and Risk Assessment, Chinese Research Academy of Environmental Sciences, Beijing 100012, China
2
Department of Environmental Science and Engineering, Beijing University of Technology, Beijing 100124, China
3
Shanghai Key Laboratory of Atmospheric Particle Pollution and Prevention, Department of Environmental Science and Engineering, Fudan University, Shanghai 200438, China
4
Environment Research Institute, Shandong University, Qingdao 266237, China
5
Dongying Municipal Ecology and Environment Bureau, Dongying 257000, China
6
Ltd. of Shandong Environmental Protection Industry Corp., Jinan 250061, China
*
Author to whom correspondence should be addressed.
Toxics 2025, 13(3), 208; https://doi.org/10.3390/toxics13030208
Submission received: 12 February 2025 / Revised: 10 March 2025 / Accepted: 11 March 2025 / Published: 13 March 2025
(This article belongs to the Special Issue Source and Components Analysis of Aerosols in Air Pollution)

Abstract

:
The ambient levels of NO2 in urban areas in China in recent years have generally shown a downward trend, but high NO2 concentrations still exist under certain conditions, and the causes for such phenomenon and its impact on air quality remain unclear. Taking Dongying, a typical petrochemical city in the Bohai Bay of China, as an example, this paper analyzed the influence of NO2 on urban air quality and investigated the causes for the formation of NO2 with high concentrations. The results indicated that higher daily NO2 concentrations (>40 μg/m3) mainly occurred during January-April and September-December each year, and higher hourly NO2 concentrations mainly occurred during the nighttime and morning rush hour in Dongying from 2017 to 2023. With the increase in daily NO2 concentrations, the daily air pollution levels showed a general increasing trend from 2017 to 2023. The occurrence of high NO2 values in Dongying was affected by the combination of unfavorable meteorological conditions, local emissions and regional transports, and localized atmospheric chemical generation. High-pressure and uniform-pressure weather patterns in 2017–2022, along with land–sea breeze circulation in 2022, contribute to high NO2 concentrations in Dongying. Boundary layer heights (BLH) in spring (−0.43) and winter (−0.36), wind direction in summer (0.21), and temperature in autumn (−0.46) are the primary meteorological factors driving NO2-HH (High hourly NO2 values), while BLH (−0.47) is the main cause for NO2-HD (High daily NO2 values). The titration reaction between NO with O3 is the main cause for NO2-HH in spring, summer and autumn, and photochemical reactions of aromatics have a significant influence on NO2-HD. NOx emissions from the thermal power and petrochemical industry in Dongying and air pollution transports from western and southwestern Shandong Province (throughout the year) and from the Bohai Sea (during spring and summer) had serious adverse impact on high NO2 values in 2022. The results of the study could help to provide a scientific basis for the control of NO2 and the continuous improvement of air quality in Dongying and similar petrochemical cities.

Graphical Abstract

1. Introduction

Atmospheric nitrogen oxides (NOx) include compounds such as nitrous oxide (N2O), nitric oxide (NO), nitrogen dioxide (NO2), dinitrogen trioxide (N2O3), and dinitrogen tetroxide (N2O4). Among these, NO2 is one of the more stable nitrogen oxides, with higher concentration and longer persistence, playing a significant role in atmospheric chemical reactions) [1]. The formation of NO2 in the atmosphere is primarily related to the conversion of NO. During the day, the photochemical chain reactions involving volatile organic compounds (VOCs) are key to NO2 generation, while at night, the reaction of ozone (O3) with NO is the main pathway for NO2 generation (Figure S1). The photochemical reactions between NO2 and VOCs during the day are the only chemical source of O3 [2]. The reaction between NO2 and hydroxyl radicals (OH) is the primary source of gaseous nitric acid (HNO3), and the reactions between NO2 and alkoxy radicals (RO) are the main sources of organic nitrate compounds in the atmosphere. NO2 reacts with O3 to form nitrate radical (NO3) at night when NO concentration is low. NO3 can react with VOCs or with NO2 to form dinitrogen pentoxide (N2O5), which then reacts with water or aerosols to produce nitric acid (HNO3) or nitrate salts (NO3), ultimately leading to the net removal of NO2 [3]. NO2 and its related products, such as O3 and organic nitrate compounds, are key components of photochemical smog, while HNO3 or NO3 are major contributors to acid rain. These pollutants pose potential risks to human health and the eco-environment, they could damage human cardiovascular and pulmonary functions, and other organisms in ecosystems; In addition, photochemical smog could irritate the eye membrane of humans, reduce atmospheric visibility, and contribute to global warming, and acid rain could lead to soil acidification and building corrosion [4,5].
Therefore, studying the pollution characteristics of NO2, its impact on air quality, and the causes of high NO2 concentrations is crucial for further understanding atmospheric chemical mechanisms, continuously improving air quality, and reducing its adverse effects on human health and the environment.
The distribution pattern of NO2 in the atmosphere results from the combined effects of pollution sources, meteorological conditions, and chemical generation. NO2 sources are mainly divided into natural and anthropogenic sources [6]. Natural sources include lightning, soil emissions, and ammonia oxidation, while anthropogenic sources include industrial facilities and mobile emissions. Ambient NO2 concentrations are greatly influenced by anthropogenic sources [7,8], which is the primary causes for the “higher in the east, lower in the west” distribution pattern observed in China over the years [9]. The average NO2 concentration in autumn and winter are relatively higher than in spring and summer [10]. The seasonal differences in anthropogenic NOx emissions and meteorological conditions are important factors contributing to the seasonal variation in NO2 concentration [11]. The diurnal variation of NO2 concentration usually shows a “two peaks and one valley” pattern. The morning peak can be attributed to motor vehicle emissions, while the evening peak may be related to unfavorable weather conditions and the conversion of NO with high concentrations during the evening rush period [12]. Additionally, NO2 exhibits a certain transport capacity [13]. Cheng et al. [14] found that implementing an odd-even license plate policy in the surrounding areas of Beijing significantly reduced NO2 concentration in the city. Wang et al. [15] found that controlling NOx emissions in upwind cities is crucial for mitigating O3 pollution in specific cities. Relevant studies have found that meteorological conditions, especially wind speeds (WS) and wind direction (WD), often affect the regional transports of NO2, leading to high urban NO2 concentrations [16,17]. High NO2 concentrations at low WS are influenced by nearby pollution sources, while at high WS are influenced by long-distance transport. Xiao et al. [18] found that under weak large-scale meteorological conditions, local circulations related to terrain can also affect pollutant concentrations. The land–sea breeze characteristics in the Bohai Bay region are distinct [19]. During pollution events, offshore land winds can transport pollutants from Shandong Province to the Bohai Sea, while onshore sea winds can create a convergence zone, inducing upward air currents that cause pollutants to cycle over the bay, further deteriorating air quality in coastal areas [20]. Therefore, to fully understand the pollution characteristics of NO2 and determine the causes for the formation of NO2 with high concentrations, it is necessary to investigate from multiple perspectives.
Over the past 20 years, NOx emissions in China have initially increased and then decreased annually, peaking in 2012. Although NOx emissions in China have decreased, the emission structure in many regions has shifted to being dominated by traffic sources [21,22,23]. However, the overall NOx emissions remain above ten million tons, leading to persistently high ambient NO2 concentrations in China [24]. The China Ecological Environment Status Bulletin shows that after a sharp decline in 2014 (34.8 µg/m3), NO2 concentrations in China’s urban areas fluctuated from 2015 to 2019 (27.5–28.4 µg/m3), continued to decline from 2019 (27 µg/m3) to 2022 (21 µg/m3) but rebounded in 2023 (22 µg/m3) with a year-on-year increase of 4.8% [25].Currently, high NO2 values in China are concentrated in economically developed and densely populated regions of North China, East China, and Central China [26], primarily in autumn and winter. For example, the monthly average NO2 concentration in Jinan, Shandong Province, exceeded 60 μg/m3 in January from 2015 to 2021 [27]. Some cities also experienced peak concentration at night during the summer. In 2018, four prefecture-level cities in Shanxi Province experienced pollution peaks during summer, with the average hourly NO2 concentration in Lvliang exceeding 80 μg/m3 at night [28]. Besides O3, PM2.5, and PM10, NO2 remains one of the primary pollutants on days with air quality exceedance in urban areas of China [25,29]. For example, the number of days with NO2 as the primary pollutant and the number of NO2 exceedance days increased annually from 2018 to 2020 in Chuzhou, Anhui Province, in the Yangtze River Delta region. In 2020, the proportion of days with NO2 as the primary pollutant reached 5.2–9.0% in coastal cities like Qingdao, Binzhou, Rizhao, and Dongying in Shandong Province [30,31].
Dongying City, located in the northwest of Shandong Province and bordered by Bohai Bay to the north and Laizhou Bay to the east, is one of the representative cities in the Bohai Bay of China. Dongying has a developed petrochemical industry. Transportation primarily relies on road traffic, with extensive motor vehicle use and a high number of trucks in urban areas, leading to substantial NOX and VOC emissions in Dongying [32], resulting in various environmental issues, such as increased photochemical pollution and frequent smoggy weather [33]. Previous studies on air pollution in Dongying have mainly focused on aerosols, particulate matter, O3, and their precursors [31,32]. Research on NO2 has primarily concentrated on pollution characteristics [8,15], with few comprehensive analyses of the impacts and causes of high NO2 values. This study analyzed the temporal and spatial distribution characteristics of NO2 concentrations in Dongying based on atmospheric pollutant and meteorological data from 2017 to 2023. The impact of NO2 on air quality and of high NO2 values in 2022 on O3, PM2.5, PM2.5-related secondary components, and atmospheric oxidation capacity were explored, and the causes of high NO2 values were investigated. The study results could provide a theoretical basis for NO2 pollution control and air quality improvement in Dongying and similar petrochemical cities.

2. Materials and Methods

2.1. Study Area and Data Sources

This study focuses on Dongying, a representative city in the Bohai Bay region, China. Dongying is located in the northwest of Shandong Province, bordered by Bohai to the east and north, adjacent to Binzhou City to the west, and neighboring Zibo and Weifang cities to the south (Figure 1a). As a typical resource-based city, Dongying is dominated by heavy industries (petroleum and chemicals), with industrial parks concentrated in the southern region. Consequently, the air quality in Dongying is easily influenced by both maritime and inland pollutant transports. Dongying has jurisdiction over five counties/districts: Dongying District, Hekou District, Kenli District, Lijin County, and Guangrao County. Currently, the city has one Super Atmospheric Observation Station (referred to as “Atmospheric Observatory”), eight state-controlled stations, and four provincial-controlled stations. The Hekou Urban Area and Hekou Development Zone stations are in the northern region, Minfeng Lake and Minfeng Road stations in Kenli District are in the central region, and the remaining stations are in the southern region (Figure 1b).
The routine observation items include NO2 and meteorological parameters—temperature (T), relative humidity (RH), WS, WD, atmospheric pressure (AP), and boundary layer heights (BLH). The enhanced observation items include routine monitoring parameters (NO2, NO, SO2, PM2.5, O3), 115 VOCs, OC (organic carbon), EC (elemental carbon), ionic components (NO3 and SO42−), ultraviolet radiation (UR), and emissions data. All observation items were continuously monitored using automatic monitoring devices, with monitoring station, frequency and duration of data collection, quality assurance, and quality control adhering to various technical specifications. Details regarding data usage, sources, and quality control in this study can be found in Table S1, Text S1, and Text S2, respectively.

2.2. Related Definitions

NO2 evaluation standards: According to the Technical Regulation for Ambient Air Quality Assessment (on Trial) (HJ 663-2013), the daily NO2 assessment value is the average NO2 concentration over a 24 h period, the monthly NO2 assessment value is the average NO2 concentration for the month, and the annual NO2 assessment value is the average NO2 concentration for the calendar year. According to the Technical Regulation on Ambient Air Quality Index (on Trial) (HJ 633-2012), the daily NO2 concentration corresponding to the “Excellent” and “Good” air quality levels are 0–40 μg/m3 and 40–80 μg/m3, respectively. The daily assessment limit for NO2 under the National Ambient Air Quality Secondary Standard is 80 μg/m3. The World Health Organization (WHO) recommends annual NO2 Interim Target 2: IT-2 (30 μg/m3) and IT-3 (20 μg/m3). For 24 h NO2, IT-2 is 50 μg/m3, and the 2021 Air Quality Guideline (AQG) level is 25 μg/m3 [34].
The significance of NO2 at different percentiles: Analyzing the arithmetic mean of NO2 is complemented by evaluating NO2 at different percentiles to provide a more comprehensive and detailed description of NO2 pollution characteristics [35,36]. Generally, low percentiles of NO2 (5th percentile) represent background concentration, while high percentiles (99th and 95th percentiles) indicate concentration during severe NO2 pollution events [37]. Middle percentiles (75th, 50th, and 25th percentiles) reflect the NO2 concentration observed during most periods in Dongying.
High daily NO2 values (NO2-HD): NO2-HD is defined as daily average concentration exceeding the 75th percentile for each season in 2022, with seasonal thresholds of >23 μg/m3 (spring), >18 μg/m3 (summer), >45 μg/m3 (autumn), and >44 μg/m3 (winter) (Figure S2a). NO2-NHD is defined as the daily average concentration not exceeding the 75th percentile.
High hourly NO2 values (NO2-HH): NO2-HH is defined as hourly concentration exceeding the 75th percentile for each season in 2022, with seasonal thresholds of >25 μg/m3 (spring), >19 μg/m3 (summer), >47 μg/m3 (autumn), and >49 μg/m3 (winter) (Figure S2b).
NO2-HH events and NO2-NHH periods: Based on diurnal variation characteristics of NO2, NO2-HH typically occurs during nighttime to morning rush hours. NO2-HH events are defined as at least five consecutive NO2-HH occurrences during this period (with spring and summer from 00:00 to 09:00 and 20:00 to 23:00, and autumn and winter from 00:00 to 10:00 and 19:00 to 23:00) (Figure S8). Periods without five consecutive NO2-HH occurrences are defined as NO2-NHH periods. In addition, the remaining hours of each season are referred to as the daytime (with spring and summer from 10:00 to 19:00, and autumn and winter from 11:00 to 18:00).

2.3. Analytical Methods

2.3.1. Methods for Analyzing Impact of NO2 on Air Quality

In this study, when analyzing the impact of NO2 on air pollution levels in Dongying, the number of mildly, moderately, heavily, and severely polluted days refers to the total number of polluted days where various basic pollutants were the primary pollutants, in accordance with the Technical Regulation on Ambient Air Quality Index (on Trial) (HJ 633-2012). The proportion of polluted days was then calculated as the ratio of the number of polluted days corresponding to a specific NO2 concentration range to the total number of all days in that range. To explore the impact of high NO2 values on different pollutants in detail, analyses were conducted from the perspectives of NO2-HH and NO2-HD in different seasons of Dongying. The analytical framework is detailed in Figure S3, and the main analytical methods are as follows:
Calculation of Secondary Organic Carbon (SOC): The concentration of SOC can be calculated using the OC/EC ratio method. The calculation formula is as follows:
SOC = OC − EC × (OC/EC)min
In the formula, SOC represents secondary organic carbon (µg/m3); OC and EC denote organic carbon and elemental carbon, respectively, and (OC/EC)min represents the minimum value of the OC/EC ratio observed during the study period.
Evaluation indicators for atmospheric oxidation capacity: The atmospheric oxidation capacity is typically represented by OX concentration, which is generally estimated using the concentration of NO2 and O3 (NO2 + O3). NO3 is an important nocturnal atmospheric oxidant, and the reaction between NO3 and NO2 is the only pathway for the formation of N2O5 [38]. The changes in N2O5 concentration levels can be indicated by the nighttime O3 concentration multiplied by the square of the NO2 concentration ([NO2]2 × O3), which indirectly represents the nighttime atmospheric oxidation capacity.
Transformation Rate of Nitrates and Sulfates: The nitrogen oxidation rate (NOR) and sulfur oxidation rate (SOR) can be used to assess the conversion status of gaseous precursors such as NO2 and SO2 into secondary inorganic ions. Higher values of NOR and SOR indicate a greater extent of secondary conversion of NO2 and SO2 in the atmosphere. The formulas are as follows:
NOR = N1/(N1 + N2)
SOR = S1/(S1 + S2)
In the formula, N1 and N2 represent the concentration of NO3 and NO2, respectively (mol/m3); S1 and S2 represent the concentration of SO42− and SO2, respectively (mol/m3).

2.3.2. Methods for Analyzing the Causes of High NO2 Values

The NO2 concentration distribution in 2022 is not significantly different from that in recent years. Additionally, the Atmospheric Observatory and meteorological station data for 2022 are relatively comprehensive. Therefore, this study selects 2022 for analyzing the causes of high NO2 levels. The analytical framework is detailed in Figure S4, and the main analytical methods are as follows:
Synoptic classification method: This study utilized the synoptic classification software cost733class developed by the European Union COST733 Project (http://www.cost733.org, accessed on 18 March 2024) and employed T-mode principal component Analysis (PCT) method to perform objective synoptic classification and reveal spatial distribution of the 925 hPa geopotential height field and the horizontal full WS (U and V) from 2017 to 2022. Details regarding the synoptic classification method in this study can be found in Text S3.
Criteria for sea–land breeze identification: Based on domestic and international studies on sea–land breeze classification standards [39,40], along with the natural geographic features of Dongying’s coastline, the criteria for identifying sea–land breeze events in Dongying are established as follows. Based on the orientation of the coastline, airflow within the SSE to NW range (157.5–315°) is defined as a land breeze, while airflow within the NNW to SE range (0–135° and 337.5–360°) is defined as a sea breeze (Figure 1a). A day is classified as a sea–land breeze day if the following criteria are met: (1) the 24 h average surface wind speed is below 10 m·s−1; (2) during the land breeze period (01:00–08:00), the land breeze duration is ≥4 h, while the sea breeze duration is ≤2 h; and (3) during the sea breeze period (13:00–20:00), the sea breeze duration is ≥4 h, while the land breeze duration is ≤2 h.
Random forest model: The random forest model, introduced by Breiman in 2001, is a machine learning algorithm based on classification trees. This model is widely used for handling nonlinear relationships, classification, regression, high-order correlations, and variable importance assessment [41,42]. A linear regression model and a random forest model were constructed using Python 3.13. The models randomly selected 90% of the data as the training set and the remaining 10% as the test set. Model performance was evaluated by calculating the coefficient of determination (R2) and root mean squared error (RMSE) [43]. Furthermore, the mean decrease accuracy (MDA) method was employed to evaluate the importance of each influencing factor. The principle behind MDA is that each variable is randomly assigned new values; if a variable is more important, replacing it randomly will result in a larger prediction error [44].
HYSPLIT mode: The Hybrid Single-Particle Lagrangian Integrated Trajectory Model (HYSPLIT) is primarily used to analyze air mass trajectories and trace the sources of air pollutants. In this study, the Dongying Atmospheric Observatory (37.45° N, 118.59° E) was selected as the starting point for the backward trajectories, with the analysis period covering the four seasons of 2022. The air mass analysis was conducted at an altitude of 300 m, with a backward tracing duration of 24 h. A total of 24 trajectories were calculated per day, resulting in 2208, 2206, 2184, and 2160 effective trajectories for each season. More details can be found in Text S4.
Backward trajectory clustering analysis method: Backward trajectory clustering analysis uses mathematical methods to classify and cluster all air parcel trajectories within a set time based on transport speed and direction. This helps analyze the source and proportion of dominant air masses at the target location, thereby determining the primary pollution source direction [45]. After cluster analysis, this study statistically analyzed the trajectory types and corresponding NO2 hourly concentration data for each season, and subsequently determined the mean NO2 concentration and contribution percentage for each trajectory type. More details can be found in Text S5. The formula for calculating the contribution percentage of NO2 concentration is as follows.
P N O 2 , t = C t C × 100 %
t is the category corresponding to the trajectory, C t is the hourly mass concentration of NO2 corresponding to the trajectory with category t, C t is the sum of hourly mass concentrations of NO2 corresponding to the trajectory with category t , C is the sum of hourly mass concentrations of NO2 of all the trajectories, and P N O 2 , t is the contribution of NO2 concentration corresponding to the category of trajectory, t .
Potential source contribution function (PSCF) analysis method: PSCF is a method based on conditional probability functions to identify potential pollution sources [46]. This method relies on backward trajectory results and utilizes a series of functions in the TrajStat plugin to calculate WPSCF values. In this study, NO2-HH in each season were set as the threshold for the target pollutant. The higher the WPSCF value in an area, the darker the color in the generated graphics, indicating a higher probability that the area contributes to NO2-HH at the target site. More details can be found in Text S6.
Concentration weight trajectory (CWT) analysis method: The CWT method calculates the weighted concentration of trajectories to quantitatively reflect the pollution severity of different trajectories [47], thus determining the impact of regional transport on NO2 concentration in Dongying. The higher the WCWT value, the more pollutants transported by the trajectory passing through the grid to the target site, and the greater the contribution to NO2 concentration at the target site [48]. More details can be found in Text S7.

3. Results and Discussion

3.1. NO2 Concentration Levels and Variation Characteristics

3.1.1. Concentration Levels

From 2017 to 2023, the annual mean values of NO2 in Dongying showed a trend of “increase-decrease-stabilization” (Figure 2). The 5th, 25th, 50th, and 75th percentiles of NO2 in Dongying exhibited a clear downward trend overall, except for a rise in 2019. The 95th and 99th percentiles of NO2 displayed a fluctuating trend of “increase–decrease–increase,” indicating a significant difference in the trends between low and high percentiles of NO2. Additionally, in 2023, while the low and middle percentiles continued to decline and the high percentiles rebounded, the annual average remained relatively stable. This indicates that the high NO2 concentration issue in Dongying has not been resolved. The NO2 concentration at the 95th percentile in Dongying each year was consistently higher than that at the 75th percentile, further indicating a high NO2 concentration issue. Notably, in 2019, the annual mean values of NO2 were the highest, and both the 75th and 95th percentiles were significantly elevated compared to other years. This suggests that the high NO2 concentration in 2019 may have been driven by increases in the middle and high percentiles. In recent years, the annual NO2 concentration in Dongying has met IT-2 (30 μg/m3), but there is still a significant gap in reaching IT-3 (20 μg/m3). In summary, Dongying currently faces a significant issue with high NO2 concentration, and reducing the high values could notably lower the overall NO2 concentration levels in the city.

3.1.2. Temporal Variation Characteristics

The monthly variation of NO2 in Dongying exhibits a “U” distribution (Figure 3), which is consistent with the findings of most researchers [49,50]. Overall, NO2 concentration was highest in December, followed by November, October, and January. A significant decline in NO2 concentration was observed each year from January to February. The period from March to August marked a rapid decrease in NO2 levels, reaching the lowest values in July and August, while the period from August to October shows a rapid increase. The calendar of NO2 in Dongying from 2017 to 2023 (Figure 4) shows that NO2 with high concentrations (>40 μg/m3) was concentrated from January to mid-March and from September to late December in 2017, with exceedances (>80 μg/m3) occurring in late October. Compared to 2017, NO2 with high concentrations in 2018 was concentrated from October to December and March. The days in January and February were more dispersed, but days where exceedances occurred in mid-January and were concentrated. In 2019, compared to 2018, the days of NO2 with high concentrations increased and became more concentrated, with exceedance days mainly occurring in January and being more dispersed. From 2020 to 2023, the days of NO2 with high concentrations significantly decreased and became more dispersed. In 2023, Dongying still experienced 46 days with NO2 concentrations exceeding IT-2 (50 μg/m3) and 159 days not meeting the 2021 AQG level (25 μg/m3), indicating a relatively high daily average NO2 level in the city. Overall, the days of NO2 with high concentrations in Dongying exhibited a distribution pattern of “few and dispersed days—increasing and concentrated days—gradually decreasing and more dispersed days” from 2017 to 2023. High NO2 concentrations mainly occurred from September to December and January to April, with exceedances usually happening in late October, November, December, and January.
From 2017 to 2023, the concentrations of NO2 during high NO2 concentrations periods (from September to December and January to April) and non-high NO2 concentrations periods, and the annual mean value of NO2 concentration in Dongying all exhibited a “single peak and single valley” pattern (Figure 5 and Figure S5). The peak occurred around 8:00 a.m., and the valley appeared around 2:00 PM. During the morning traffic rush (6–9 a.m.), NO2 concentration slightly increased, then slowly decreased after 9 a.m. After 4:00 p.m., NO2 concentration rose significantly, remained at high levels, and exhibited a slow upward trend during nighttime to morning rush hours. Most research findings indicate that daily NO2 variations exhibit a “double peak and single valley” pattern, with distinct morning and evening peaks [23,51]. In comparison, the hourly NO2 concentration in Dongying did not show a significant peak at night, and the morning peak was smaller, indicating that in addition to vehicle emissions, other pollution sources also influence NO2 concentration in Dongying. Overall, from 2017 to 2023, the concentrations of NO2 during high NO2 concentrations periods and non-high NO2 concentrations periods, and the annual mean value of NO2 concentration all showed a downward trend. However, changes in NO2 concentration mainly occurred during nighttime to morning rush hours, with minimal changes during daytime hours.

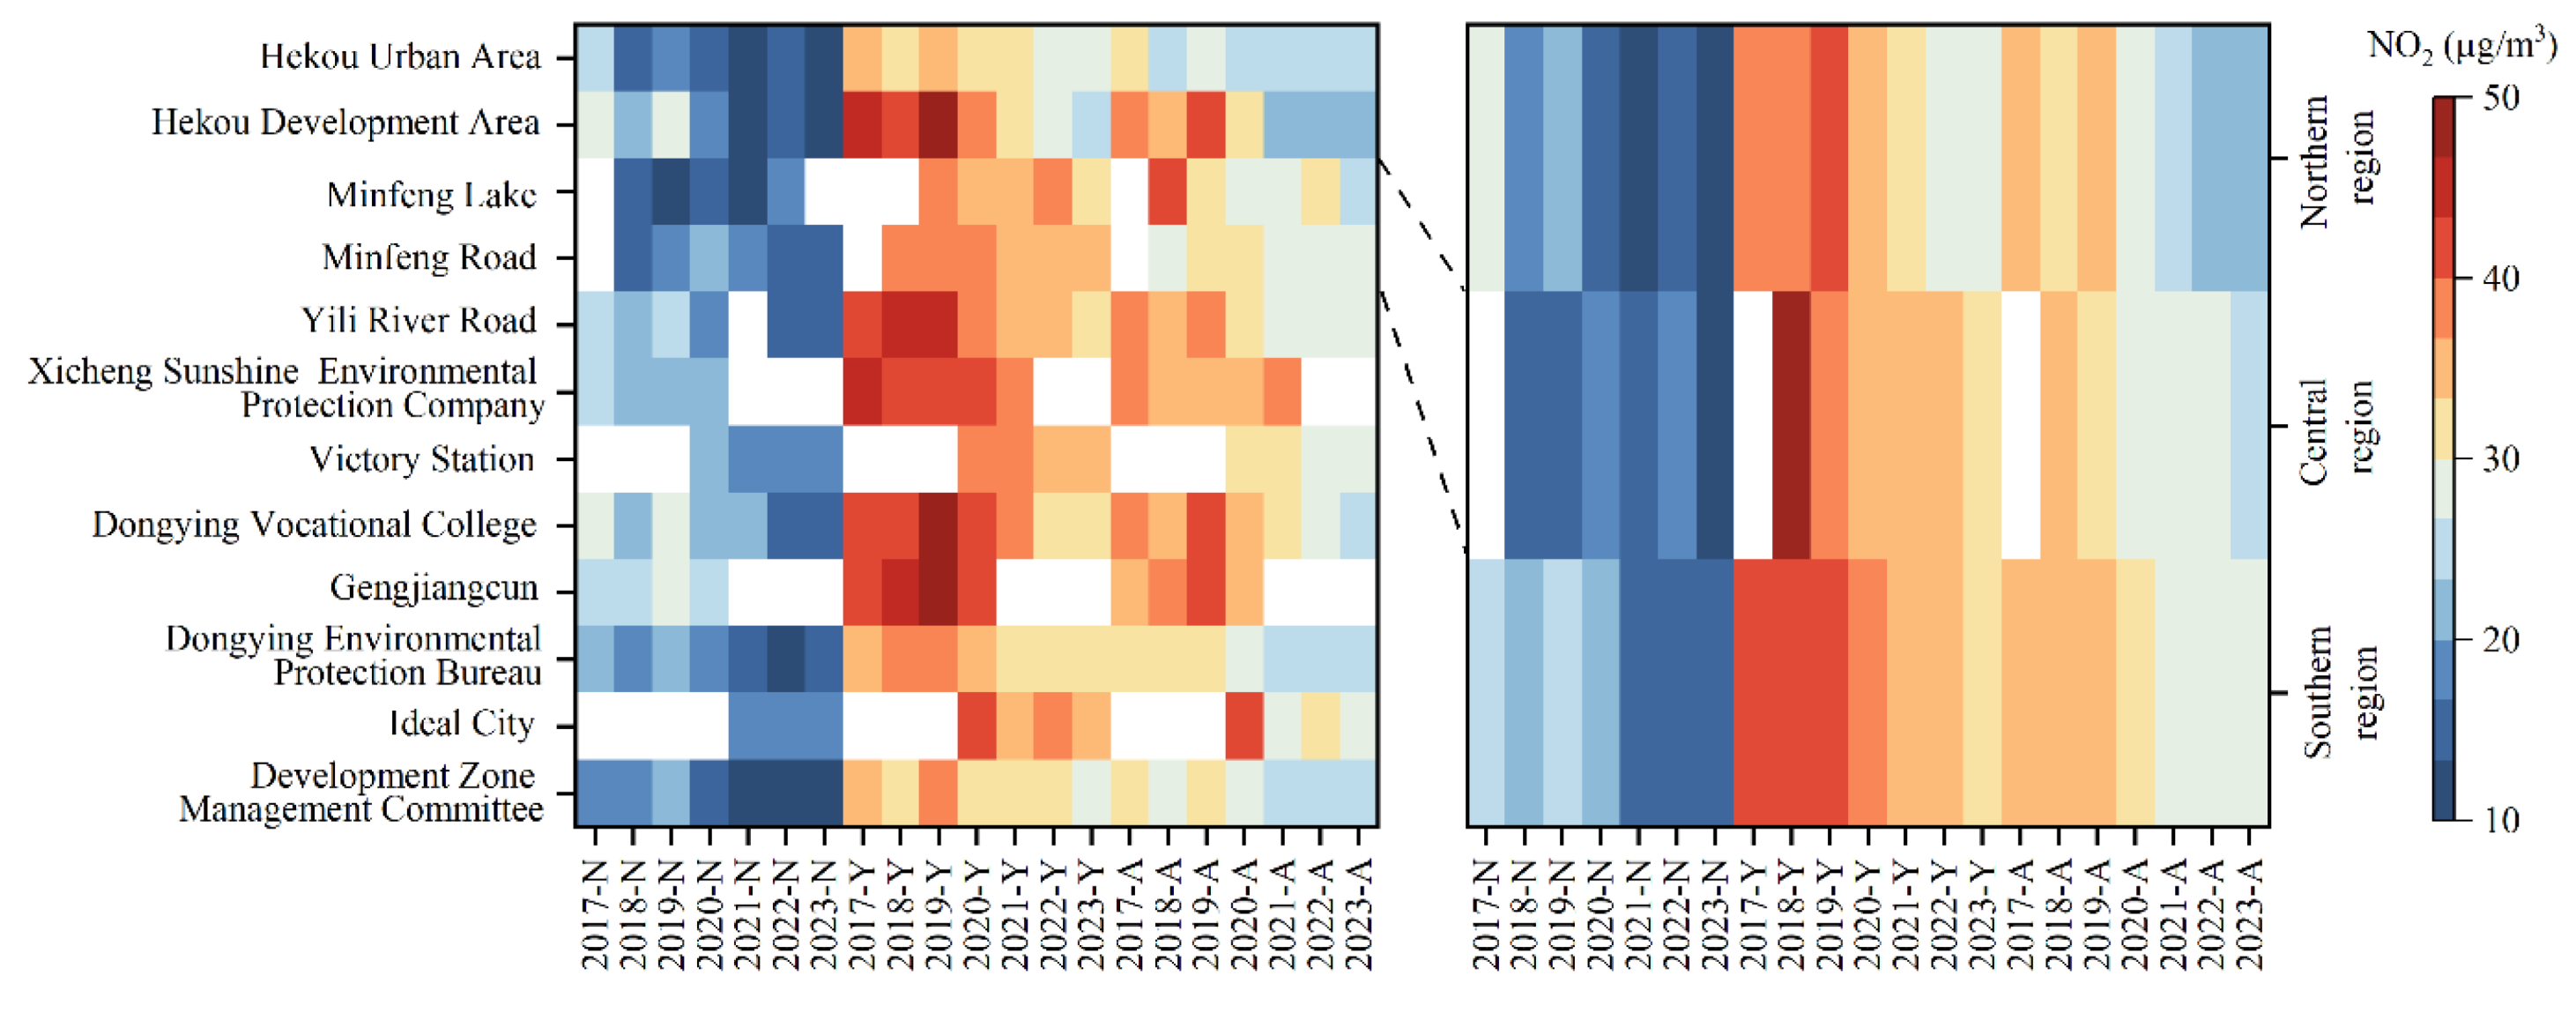
3.1.3. Spatial Variation Characteristics

The interannual variation of NO2 concentration in different regions of Dongying from 2017 to 2023 is shown in Figure 6. From different monitoring sites, during non-high NO2 concentrations periods, the highest average NO2 concentration was at the Gengjiangcun site, and the lowest was at the Minfeng Lake site in Kenli District. During periods of high NO2 concentrations, the highest average NO2 concentration was also at the Gengjiangcun site, while the lowest was at the Hekou urban site. From the annual variation at different sites, the Gengjiangcun site consistently showed higher average NO2 concentration, while the Hekou urban site had lower averages. From different regions, during non-high NO2 concentrations periods, the southern region had the highest average NO2 concentration (19 μg/m3), and the central region had the lowest (15 μg/m3). During high NO2 concentrations periods, the southern region had the highest average NO2 concentration (37 μg/m3), while the northern region had the lowest (34 μg/m3). From the annual variation at different regions, the southern region had the highest average NO2 concentration (19 μg/m3), while the central region had the lowest (15 μg/m3). Overall, from the perspectives mentioned above, the NO2 concentration levels in the southern region of Dongying are relatively higher compared to other regions.

3.2. Impact of NO2 on Air Quality

3.2.1. Impact of NO2 on Air Quality Levels

From the perspective of the primary pollutant (Figure S6), the number of days with NO2 as the primary pollutant in Dongying was the lowest in 2017 (1 d), higher from 2018 to 2020 (14–20 days), and relatively lower from 2021 to 2023 (10–13 days) with a fluctuating trend. The proportion of days with NO2 daily assessment value of “excellent” showed an overall increasing trend, reaching its lowest point in 2019 (64%) and experiencing a slight rebound in 2023. Exceedance days for NO2 occurred between 2017 and 2020 (3–5 days) and in 2023 (1 day). Overall, as a pollutant in air quality assessment, NO2 itself currently has a reduced impact on the air quality in Dongying.
According to Figure 7, from 2017 to 2019, the number of mildly polluted days generally increased and then gradually decreased with rising NO2 concentration. From 2020 to 2023, the number of mildly polluted days steadily decreased with rising NO2 concentration. The number of moderately polluted days showed an increase, followed by a decrease and then another increase with rising NO2 concentration. Severe pollution days mainly occurred in 2017 (1 day) and 2021 (4 days), with corresponding NO2 concentration ranges of 70–80 and 30–40 µg/m3, respectively. Unlike other polluted days, the number of severe pollution days is relatively small, and there is no obvious pattern of variation. From 2017 to 2023, the number of mildly, moderately, and heavily polluted days was higher when the NO2 concentration were 10–30 μg/m3, 20–30 μg/m3, and 50–80 μg/m3, respectively. When the NO2 concentration is below 20 μg/m3, the proportion of polluted days is relatively low (<25%). Within the 20–50 μg/m3 range, the proportion remained stable (32–35%). However, when the NO2 concentration exceeded 60 μg/m3, the proportion of polluted days increased significantly (>60%). In summary, the overall air quality in Dongying showed that both the air pollution level and the proportion of polluted days increased with rising daily NO2 concentrations.

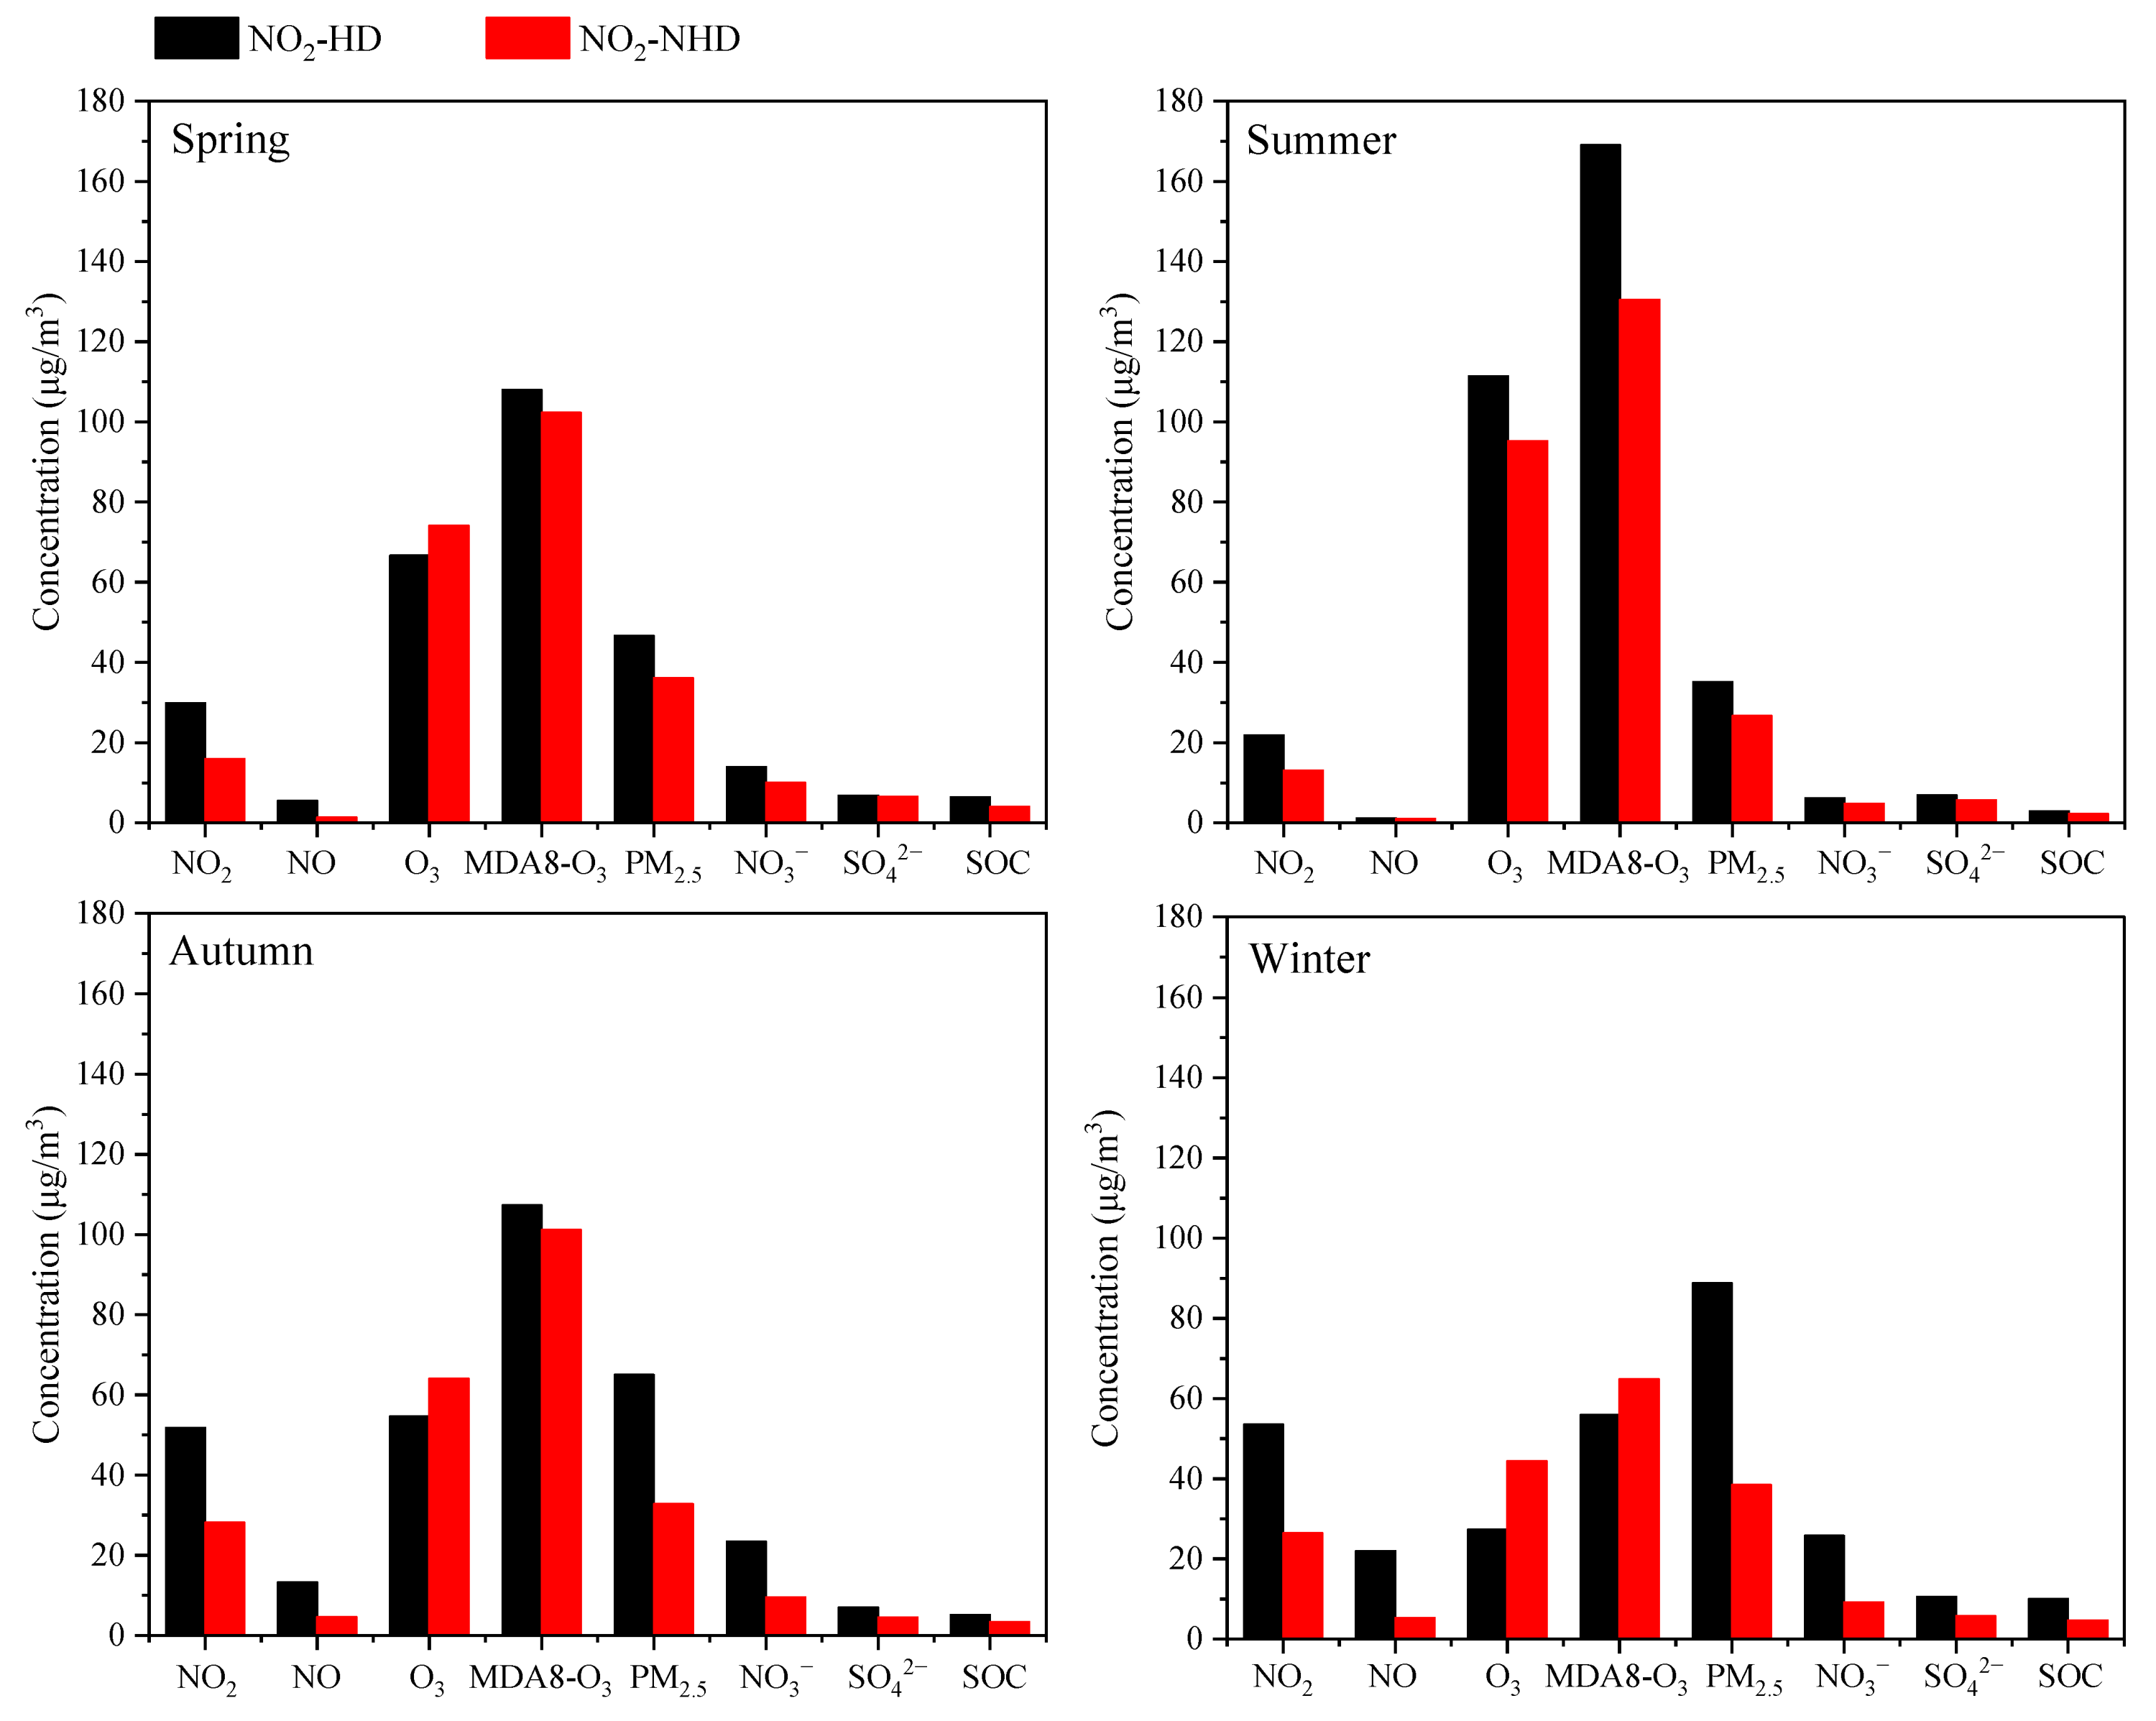
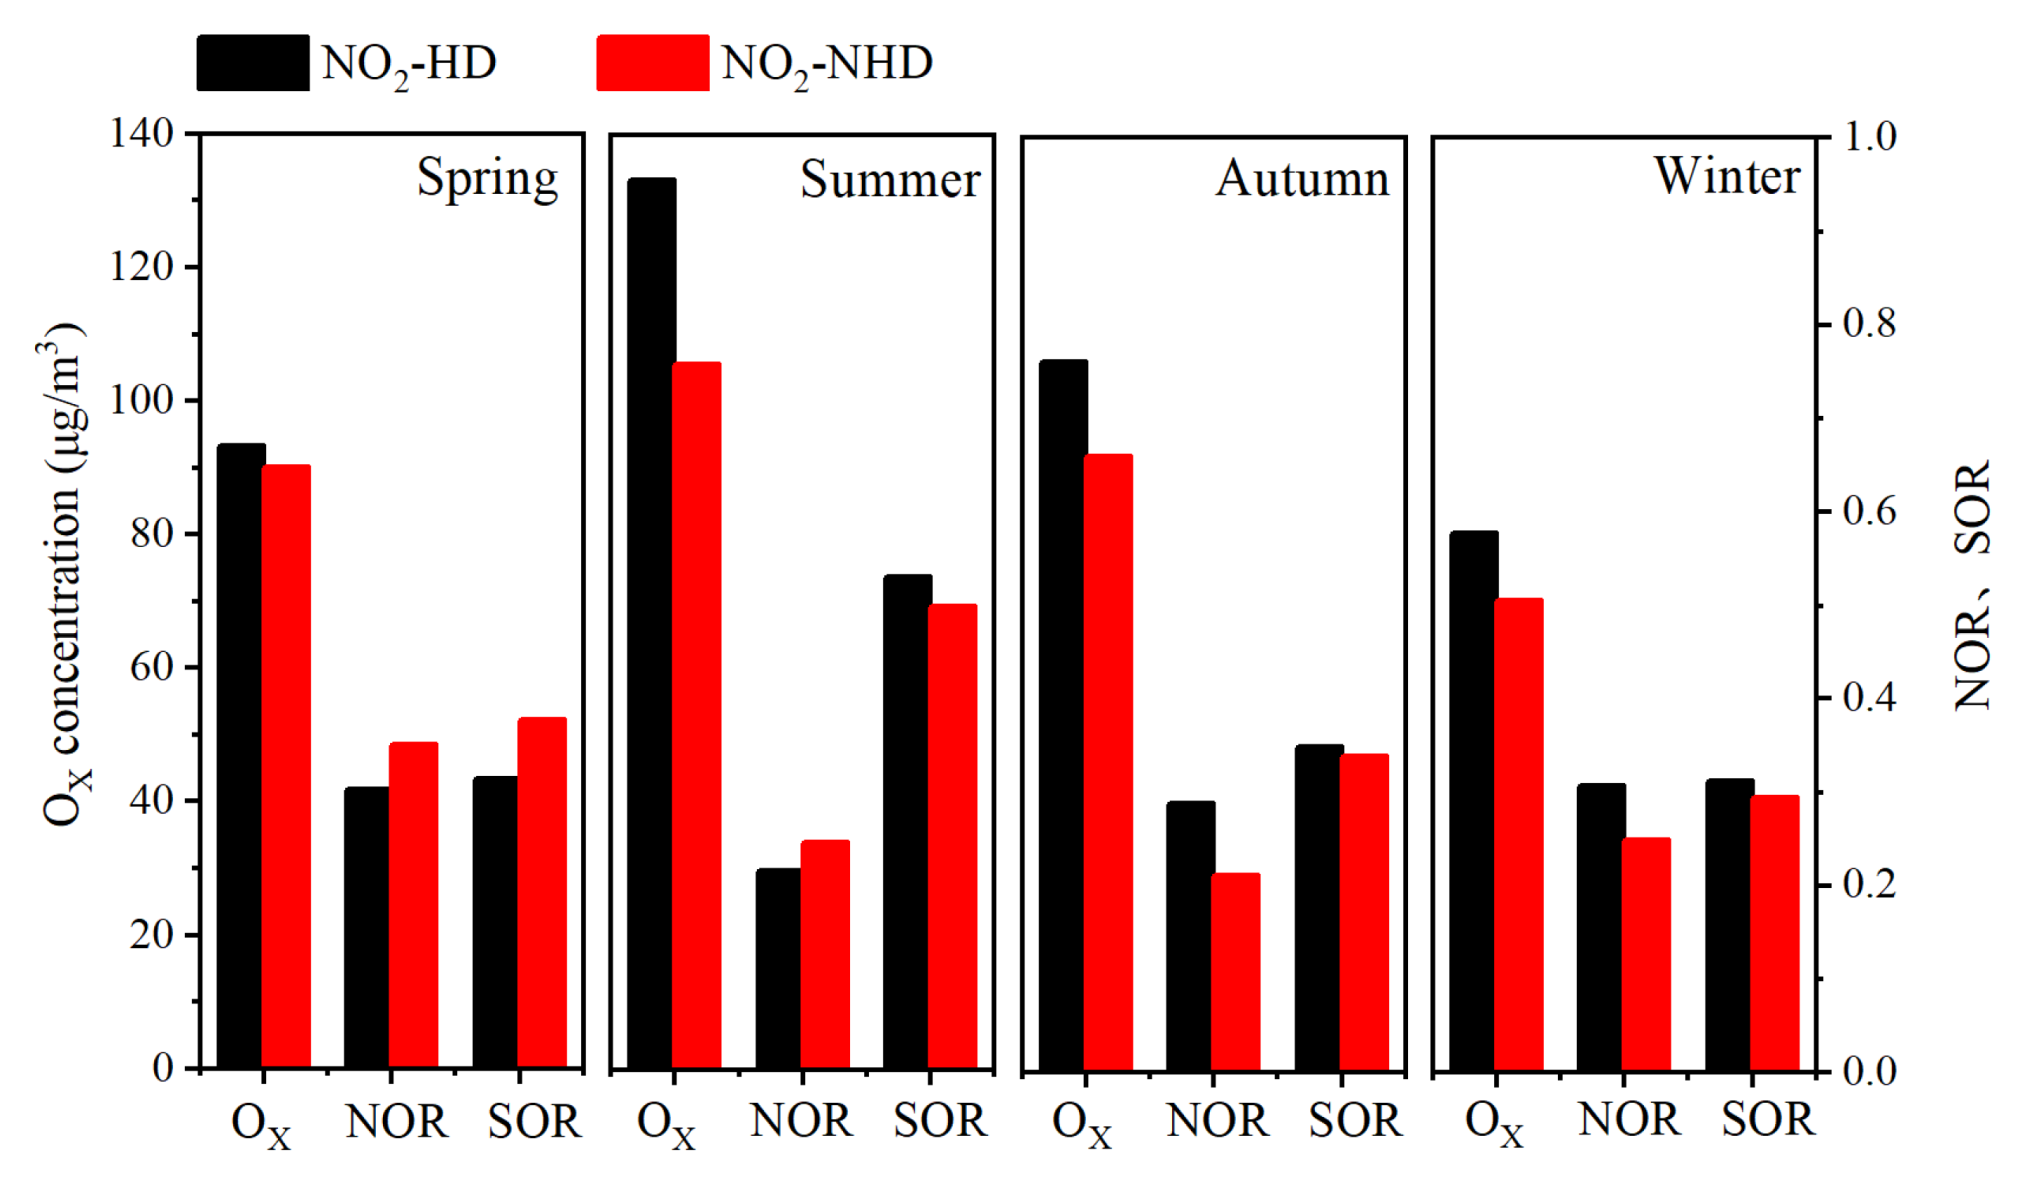
3.2.2. Impact of High NO2 Values on O3, PM2.5, and Atmospheric Oxidation Capacity in 2022

According to Figure S7, the number of NO2-HD days in Dongying in 2022 showed no significant seasonal variation, with similar counts in spring (21 days), summer (21 days), autumn (19 days), and winter (22 days). On a monthly scale, December and March had the highest number of NO2-HD days (11 days), followed by June and November (9 days), while February, April, and September had the fewest (4 days), indicating some inter-monthly variability. As shown in Figure S8, the proportion of NO2-HH in spring and summer peaked around 00:00–01:00 (8% and 7%) and again around 07:00 (8% and 10%). In contrast, NO2-HH in autumn and winter remained relatively stable between 19:00 and 10:00, the following day, ranging from 5% to 7% and 4% to 6%, respectively. Overall, NO2-HH in Dongying primarily occurred from nighttime to the morning peak hours (with spring and summer being 00:00–09:00 and 20:00–23:00, and autumn and winter 00:00–10:00 and 19:00–23:00).
As shown in Figure 8, compared to NO2-NHH periods, NO2-HH events in all seasons lead to significant increases in PM2.5 and PM2.5-bounded NO3, SO42, and SOC concentrations, and a notable decrease in O3 concentration. This indicates that high NO2 values can enhance the concentrations of O3, PM2.5 and PM2.5-bounded secondary components during nighttime to morning rush hours, with the most pronounced effects in autumn and winter. The higher the NO2 concentration in a season, the lower the nighttime O3 concentration, which is related to the NOx titration reaction [2]. As shown in Figure 9, during NO2-HH events across all seasons, the concentrations of OX and N2O5 are significantly higher compared to NO2-NHH periods, indicating that high NO2 values can enhance the atmospheric oxidation capacity at night, consistent with the findings of Alberto Notario et al. [52]. In spring, summer, and winter, the NOR values decrease during NO2-HH events, whereas the opposite is observed in autumn. Similarly, SOR values decrease during NO2-HH events in spring, autumn, and winter, but increase in summer. This may be because the formation of NO3 and SO42 at night is significantly influenced by nighttime O3 concentration [53]. During NO2-HH events, high NO concentration results in the titration of O3 by NO and the concentrations of NO2 and SO2 are relatively high, leading to lower NOR and SOR values. In summary, NO2-HH events can increase O3, PM2.5 and PM2.5-bounded secondary components concentrations, as well as OX and N2O5 concentrations during nighttime to morning rush hours. They also lead to lower O3 concentration, NOR, and SOR values. Moreover, the analysis of impact of high NO2 values on daytime O3, PM2.5, and atmospheric oxidation capacity in Dongying in 2022 is detailed in Figures S9 and S10 and Text S8.
As shown in Figure 10, compared to NO2-NHD days, PM2.5 and PM2.5-bounded NO3, SO42, and SOC concentrations are significantly higher on NO2-HD days across all seasons, indicating that NO2-HD can promote increases in concentrations of PM2.5 and PM2.5-bounded secondary components on the same day, with the most pronounced effect in autumn and winter. In spring, autumn, and winter, O3 concentration on NO2-HD days is lower than on NO2-NHD days, whereas the opposite is true in summer. In spring, summer, and autumn, MDA8-O3 concentration on NO2-HD days is higher than on NO2-NHD days, with the opposite observed in winter, likely due to higher daytime NO emissions in winter. As shown in Figure 11, OX concentration is significantly higher on NO2-HD days across all seasons, indicating that NO2-HD can enhance the atmospheric oxidation capacity. In spring and summer, NOR values on NO2-HD days are lower than on NO2-NHD days, whereas the opposite is observed in autumn and winter. Conversely, SOR values are higher on NO2-HD days in summer, autumn, and winter, but lower in spring, indicating a noticeable seasonal difference in the impact of NO2-HD on NOR and SOR. In summary, NO2-HD can increase MDA8-O3, PM2.5 and PM2.5-bounded secondary component concentrations, as well as OX concentration, while reducing the average O3 concentration on the same day.

3.3. Causes of High NO2 Values

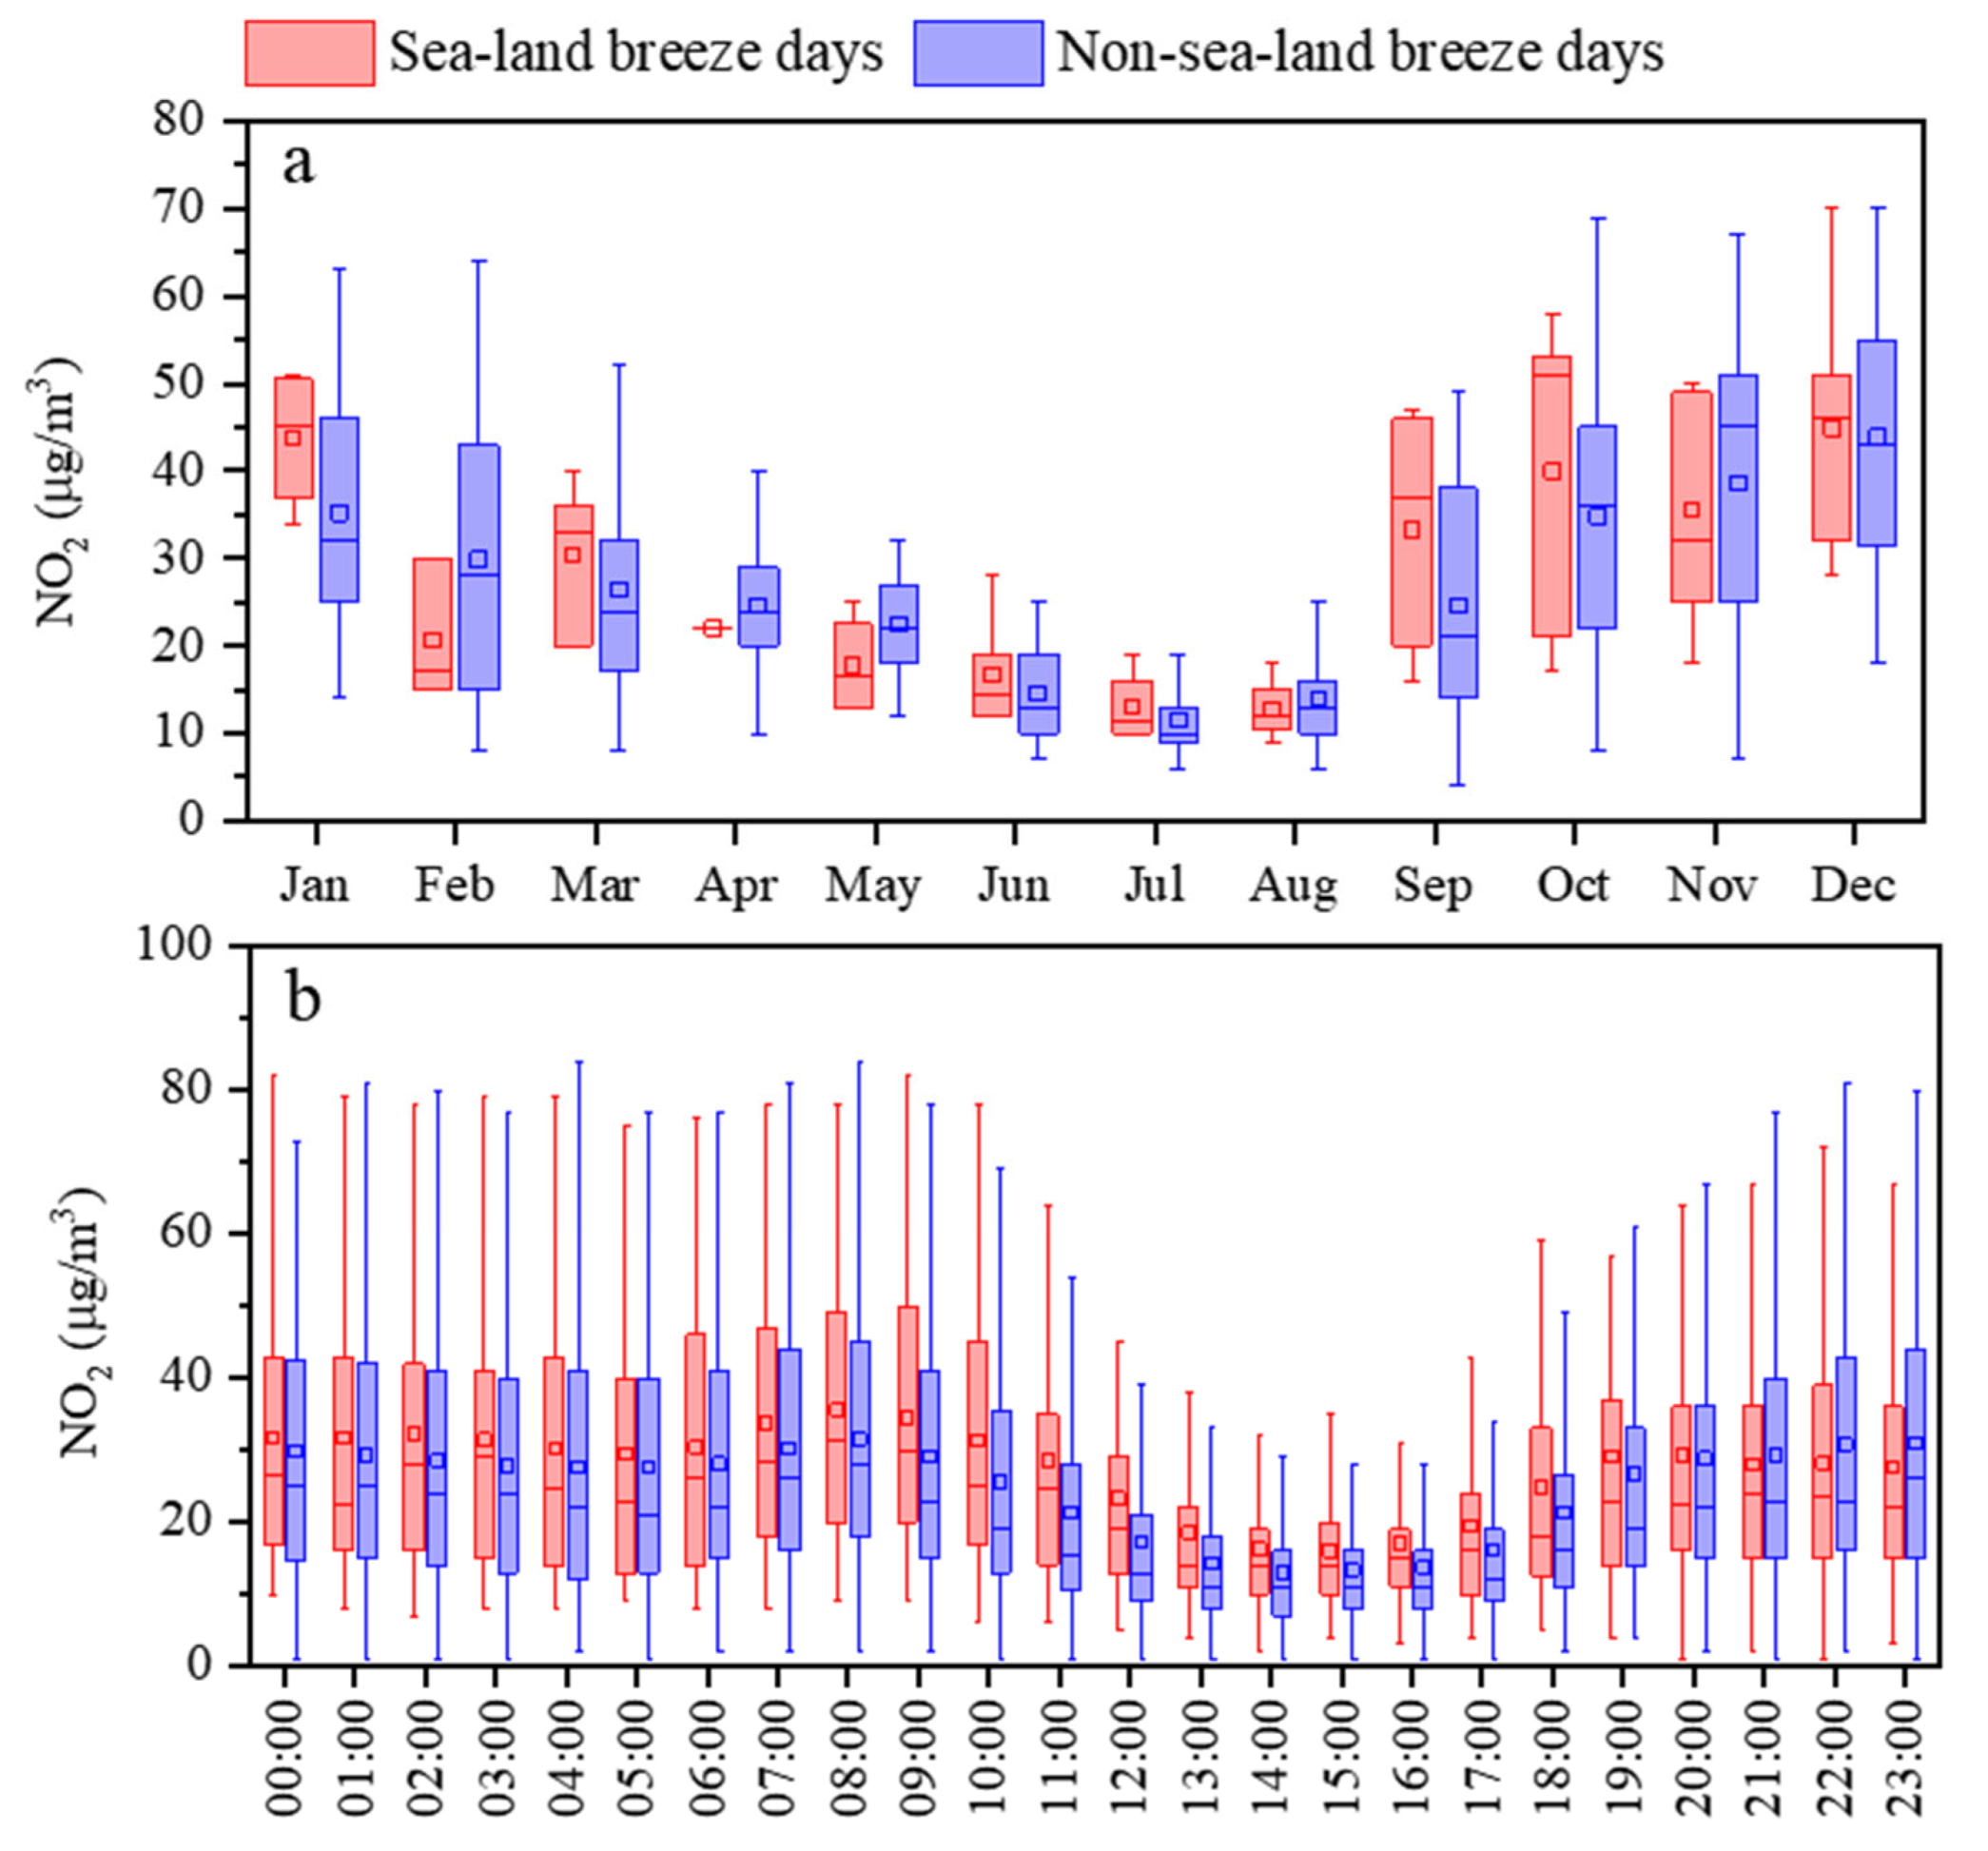
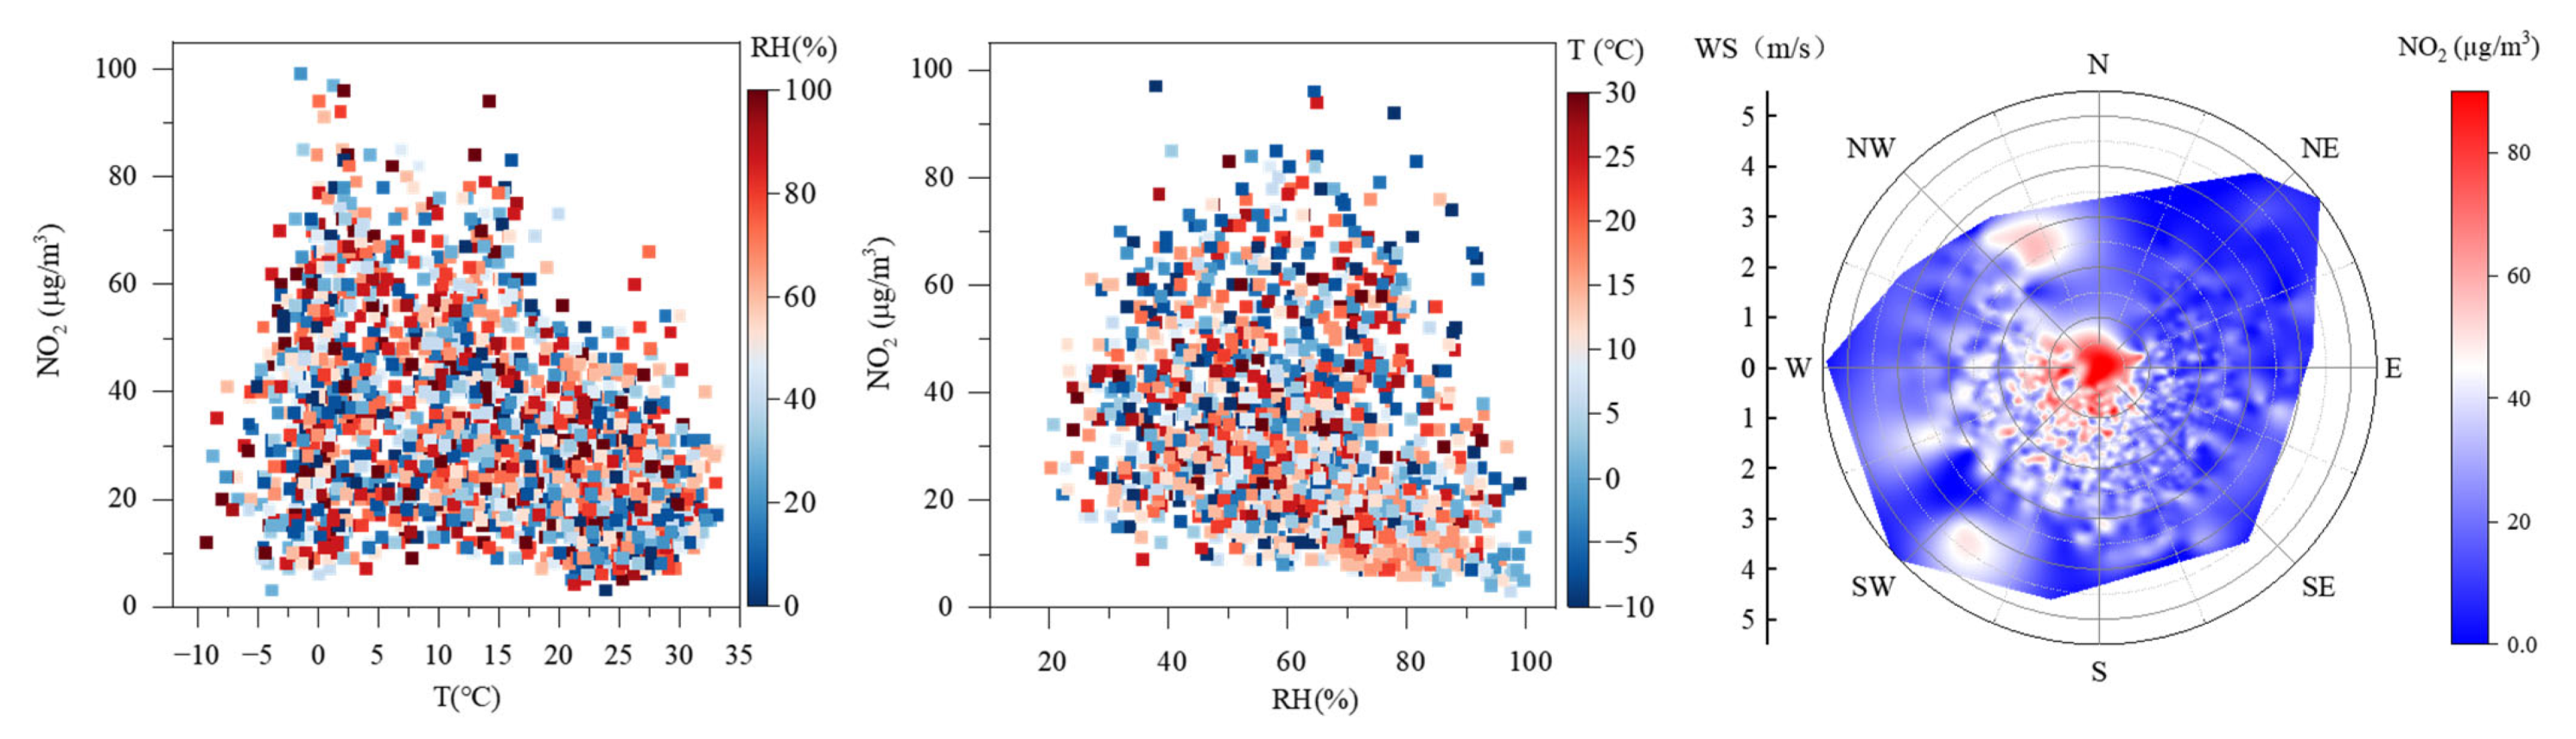
3.3.1. Meteorological Conditions

Using the PCT method, the circulations of the 925-hPa geopotential height field from 2017 to 2022 were classified into nine patterns (Figure S11)—namely, “offshore high-pressure rear” (Type 1), “high-pressure front” (Type 2), “high-pressure inside” (Type 3), “high-pressure top front” (Type 4), “uniform pressure” (Type 5), “west-high and east-low” (Type 6), “subtropical high” (Type 7), “inverted trough” (Type 8), and “low-pressure field” (Type 9).
From 2017 to 2022, Type 1 occurs most frequently (20.5%), with large variations in the daily average maximum temperature (Tmax-mean) and daily average relative humidity (RH-mean). Type 4 (16.6%), Type 2 (14.1%), and Type 3 (12.1%) followed, with these patterns generally characterized by low Tmax-mean and high RH-mean. Type 6 (8.4%) and Type 5 (6.7%) exhibited large ranges in Tmax-mean, with the former having sparse isobars and lower RH-mean, and the latter having dense isobars and higher RH-mean. Type 7 (9.5%), Type 8 (7.6%), and Type 9 (4.4%) mainly occur in summer, characterized by higher Tmax-mean, occasional precipitation, and higher RH-mean (Table 1).
As shown in Figure 12, when the proportion of “subtropical high” (Type 7), “inverted trough” (Type 8), and “low-pressure field” (Type 9) was higher, the NO2 concentration in Dongying was relatively low. Conversely, when the proportion of these types decreased and the proportion of high-pressure synoptic patterns (Type 1, Type 2, Type 3, and Type 4) increased, the NO2 concentration rose. This is because Type 7, Type 8, and Type 9 usually occur in summer, with higher Tmax-mean, occasional precipitation, and higher RH-mean, which facilitate the removal of pollutants. When Dongying was under “offshore high-pressure rear” (Type 1), the impact of the cold high-pressure was waning, resulting in stable synoptic conditions and low RH, which can lead to a higher concentration of accumulated pollutants and higher NO2 levels. When Dongying was under “high-pressure front” (Type 2) and “high-pressure top front” (Type 4), the passage of cold air masses resulted in a significant drop in T and RH. Additionally, the dominant wind was typically a low-speed southwest wind, which was conducive to the increase in NO2 concentration. When Dongying was under “high-pressure inside” (Type 3), the activity of the cold high-pressure was weak, leading to conditions such as temperature inversion, which can result in NO2 exceedances. Moreover, when Dongying was under “uniform pressure” (Type 5), horizontal atmospheric movement is weak, often accompanied by strong radiative inversions or low-level inversions, making high NO2 concentration more likely [54]. The above analysis indicates that Type 7, Type 8, and Type 9 help to reduce NO2 concentration, whereas high-pressure synoptic patterns (Type 1, Type 2, Type 3, and Type 4) and “uniform pressure” (Type 5) tend to trigger NO2 pollution.
The monthly variation in NO2 concentrations on land–sea breeze and non-land–sea breeze days in Dongying City in 2022 is shown in Figure 13a. Overall, the average NO2 concentration on land–sea breeze days in Dongying (29.1 µg/m3) was higher than that on non-land–sea breeze days (26.5 µg/m3). In January, March, and September to October, the NO2 concentration on land–sea breeze days in Dongying was higher than that on non-land–sea breeze days. From June to August and November to December, the NO2 concentrations on land–sea breeze days were similar to those on non-land–sea breeze days. In February and from April to May, the NO2 concentration on land–sea breeze days was lower than that on non-land–sea breeze days. The above analysis indicates that during high NO2 concentrations periods, the land–sea breeze has a significant contribution to the elevated daily average NO2 concentrations in Dongying City.
The daily variation in NO2 concentrations on land–sea breeze and non-land–sea breeze days in Dongying City in 2022 is shown in Figure 13b. Overall, the hourly NO2 concentrations on land–sea breeze days were significantly higher than those on non-land–sea breeze days. From 00:00 to 20:00, the NO2 concentrations on land–sea breeze days were higher than those on non-land–sea breeze days. From 00:00 to 04:00, the difference between the two was small, ranging from 1.9 to 3.6 µg/m3. From 05:00 to 15:00, the difference gradually increased and then decreased, with the greatest difference observed at 11:00 (7.3 µg/m3). From 16:00 to 18:00, the concentration difference between the two remained between 3.3 and 3.5 µg/m3. From 19:00 to 20:00, the difference gradually decreased, and by 21:00, the NO2 concentration on land–sea breeze days was lower than on non-land–sea breeze days. The possible explanation for this phenomenon is as follows: during the early phase of land breeze dominance, pollutants from the continent are transported to the air over the Bohai Sea. Meanwhile, ship emissions in the Bohai region also contribute to air pollution [55], and currently, NOx and VOC emissions from ships in China remain relatively high [56]. Consequently, NO2 gradually accumulates over the Bohai Sea. During the transition from land breeze to sea breeze, NO2 pollution plume over the Bohai Sea are gradually transported back to Dongying City. Under the combined influence of transport and local emissions, the hourly NO2 concentration is higher than that on non-land–sea breeze days [20]. During the period of sea breeze dominance, NO2 is continuously transported from the Bohai Sea to Dongying, resulting in a large difference between the two. During the transition from sea breeze to land breeze, the NO2 concentration in the sea area decreases and is gradually carried back to the air over the Bohai Sea by the dominant land breeze, resulting in a smaller difference in NO2 concentrations between land–sea breeze and non-land–sea breeze days, with the concentration on land–sea breeze days at certain hours being lower.
The variation of NO2 concentrations with T, RH, WS, and WD in Dongying from 2017 to 2022 is shown in Figure 14. High NO2 concentration (>40 μg/m3) are notably concentrated when T from −5 to 15 °C and RH from 30 to 80%. Daily average NO2 concentration exceeding standards is more likely when T are below 10 °C and RH ranges from 50 to 70%. It is noteworthy that NO2 concentration does not show a strong linear relationship with T and RH. This can be explained by the findings of Huang et al. [57], who, through extensive data analysis, discovered that NO2 concentrations are primarily influenced by BLH and AP, especially by BLH. When WS in Dongying are below 1 m/s, both the level of daily average NO2 concentration and the frequency of high NO2 concentration are relatively high. When WD is N to NW and WS range from 2 to 3 m/s, high NO2 concentration are more frequent. When WD is W to S, the level of daily average NO2 concentration and the frequency of high NO2 concentration decrease with increasing WS. Overall, high NO2 concentration are more likely to occur when WS are below 1 m/s. While when WS exceeds 1 m/s, southwestern winds facilitate a higher NO2 concentration. This may be due to local pollutant accumulation at low WS and regional pollutant transport at high WS [58,59].
In addition, this study analyzed the correlation between the daily average NO2 concentrations and meteorological factors from 2017 to 2022 (Table S2). From a seasonal perspective, WS (−0.18 to −0.57) and RH (−0.30 to −0.60, except in winter) exhibited relatively consistent correlations across all seasons, whereas T and AP showed seasonal variations. Previous studies have indicated that the strength and correlation of meteorological factors affecting NO2 concentrations vary depending on the season [60] or the study period [61]. From an annual perspective, NO2 concentrations showed a significant negative correlation with WS (−0.43), T (−0.45), and RH (−0.38), while exhibiting a positive correlation with AP (0.46). These results are consistent with findings from Handan [62], as well as studies in Shijiazhuang, Foshan and Ya’an regarding WS, T and AP, although no significant correlation with RH was observed in these regions [60,63,64]. The possible reasons for these findings include higher NO2 emissions in winter, while elevated T in summer enhances photochemical consumption; low WS hinders pollutant dispersion; high RH may promote the heterogeneous reaction of NO2 [65]; and high AP leads to descending airflows and suppresses pollutant dispersion.
In summary, high NO2 concentrations in Dongying tend to occur under meteorological conditions characterized by relatively low T (−5 to 15 °C), moderate RH (30–80%), southwesterly WD, and WS below 1 m/s.
The factor importance obtained after building a random forest model based on meteorological data is shown in Figure 15. Overall, the main factors influencing the hourly NO2 concentrations in Dongying City in 2022 were BLH, while the dominant factors for the daily average NO2 concentrations were BLH, WS, and UR. Studies have shown that a decrease in BLH is a key reason for the significant increase in NO2 concentrations at night and across seasons [66,67]. From the difference between NO2-HH and NO2-NHH, the importance of BLH significantly increased during the spring and winter for NO2-HH (with correlations of −0.43 and −0.36, and importance contribution differences of 10% and 12%, respectively). This is because BLH is generally lower in spring and winter, which facilitates the occurrence of high NO2 values, thus contributing to the main cause of NO2-HH formation. In summer, the importance of WD increased significantly (correlation of 0.21, importance contribution difference of 10%), likely due to the transport of NO2 air masses in Dongying City, which is a major factor in the formation of NO2-HH. In autumn, the importance of T increased significantly (correlation of −0.46, importance contribution difference of 4%), which is related to Dongying City’s low-temperature environment, making it conducive to the formation of NO2-HH. From the difference between NO2-HD and NO2-NHD, the importance of BLH significantly increased, indicating that BLH is the primary factor for the occurrence of NO2-HD.

3.3.2. Chemical Generation

The chemical reactions between NO, NO2, VOCs, and O3 affect the concentration of NO2. As shown in Figure 16, compared to NO2-NHH periods, all types of VOCs increase during NO2-HH events, with alkanes and halogenated hydrocarbons showing a more pronounced increase, while OVOCs increase to a lesser extent. This suggests that the significant increase in VOCs during NO2-HH events, particularly alkynes, alkanes, and alkenes, may be associated with the formation of NO2-HH. In terms of changes in pollutant concentrations, except for a marked decrease in O3 concentration during NO2-HH events, concentrations of other pollutants are higher, with NO showing the greatest increase. This is related to NO2-related chemical reactions, particularly the titration reaction between NO and O3 and the series of nighttime chemical reactions involving NO2 [3]. The balance of these reactions significantly influences hourly NO2 concentration levels. Overall, NO2-HH events are more likely to occur when VOCs and NO concentrations are high, and O3 concentration is low.
As shown in Figure 17, on NO2-HH event days, VOCs and NO concentrations increase significantly during nighttime and morning rush hours, exhibiting a unimodal pattern, with more pronounced photochemical consumption at noon. In contrast, on NO2-NHH days, VOCs and NO concentrations remain relatively stable at night, with a smaller increase during the early morning rush and less photochemical consumption at noon. The high concentrations of VOCs and NO in Dongying contribute to intense photochemical reactions during the day, leading to higher NO2 levels. On NO2-HH event days, the peak NO concentration in the evening is higher, which rapidly reduces nighttime O3 levels through titration reactions, while the NO2 concentration remains stable after a rapid increase. Xia et al. [2] found that an increase in the diurnal variation of NO2 is accompanied by a larger diurnal variation in O3, which is consistent with the variations in NO2 and O3 on NO2-HH event days in Dongying. Additionally, studies have shown that when NO concentration is high, NO3 is primarily removed through reaction with NO to form NO2, which suppresses the nighttime NO2 net consumption rate about NO3. Therefore, the NO3- formation rate is lower during the evening peak of NO2-HH event days. The stability of NO2 in the early morning indicates that on NO2-HH event days, there is ample NO, and NO2 is in a dynamic equilibrium between generation and consumption, with O3 continuously depleted and NO3 increasing. Conversely, on NO2-NHH days, after the NO2 concentration rises during the evening peak, it shows a decreasing trend along with VOCs in the early morning. This is due to insufficient NO at night and higher O3 concentration, which dominate the NO2 net consumption reactions. Overall, daytime NO2 concentration are primarily influenced by intense photochemical reactions, with higher VOCs and NO concentrations leading to higher daytime NO2 levels. During nighttime and morning rush hours, NO and O3 significantly affect NO2 concentration.
The factor importance obtained after building a random forest model based on pollutant data is shown in Figure 18. Overall, the main pollutants influencing the hourly NO2 concentrations in Dongying City were NO, O3, and Aromatics, while the dominant factors for the daily NO2 concentrations were NO, Aromatics, Alkenes, and O3. From the difference between NO2-HH and NO2-NHH, the importance of O3 and NO increased for NO2-HH, except in winter, while the importance of Aromatics decreased across all seasons. Other pollutants showed no consistent pattern. This suggests that NO2-HH in spring, summer, and autumn is primarily driven by the titration reaction between NO and O3, while the day–night variation in Aromatics is related to the concentrations of oxidants OH and NO3 [68]. The weakening of reactions with NO3 reduces the net consumption of NO2. From the difference between NO2-HD and NO2-NHD, the importance of Alkenes decreased, while that of Aromatics increased. This is because Alkenes are key participants in the nighttime chemical reaction chain, consuming NO3 and leading to net consumption of NO2 [69]. Both Alkenes and Aromatics exhibit strong photochemical activity during the day, participating in photochemical chain reactions to produce NO2 [70].
Overall, daytime NO2 concentration are primarily influenced by intense photochemical reactions, with higher VOCs and NO concentrations leading to higher daytime NO2 levels. During nighttime and morning rush hours, NO and O3 significantly affect NO2 concentration. The titration reaction between NO with O3 is the main cause for NO2-HH in spring, summer and autumn, and photochemical reactions of Aromatics have a significant influence on NO2-HD.

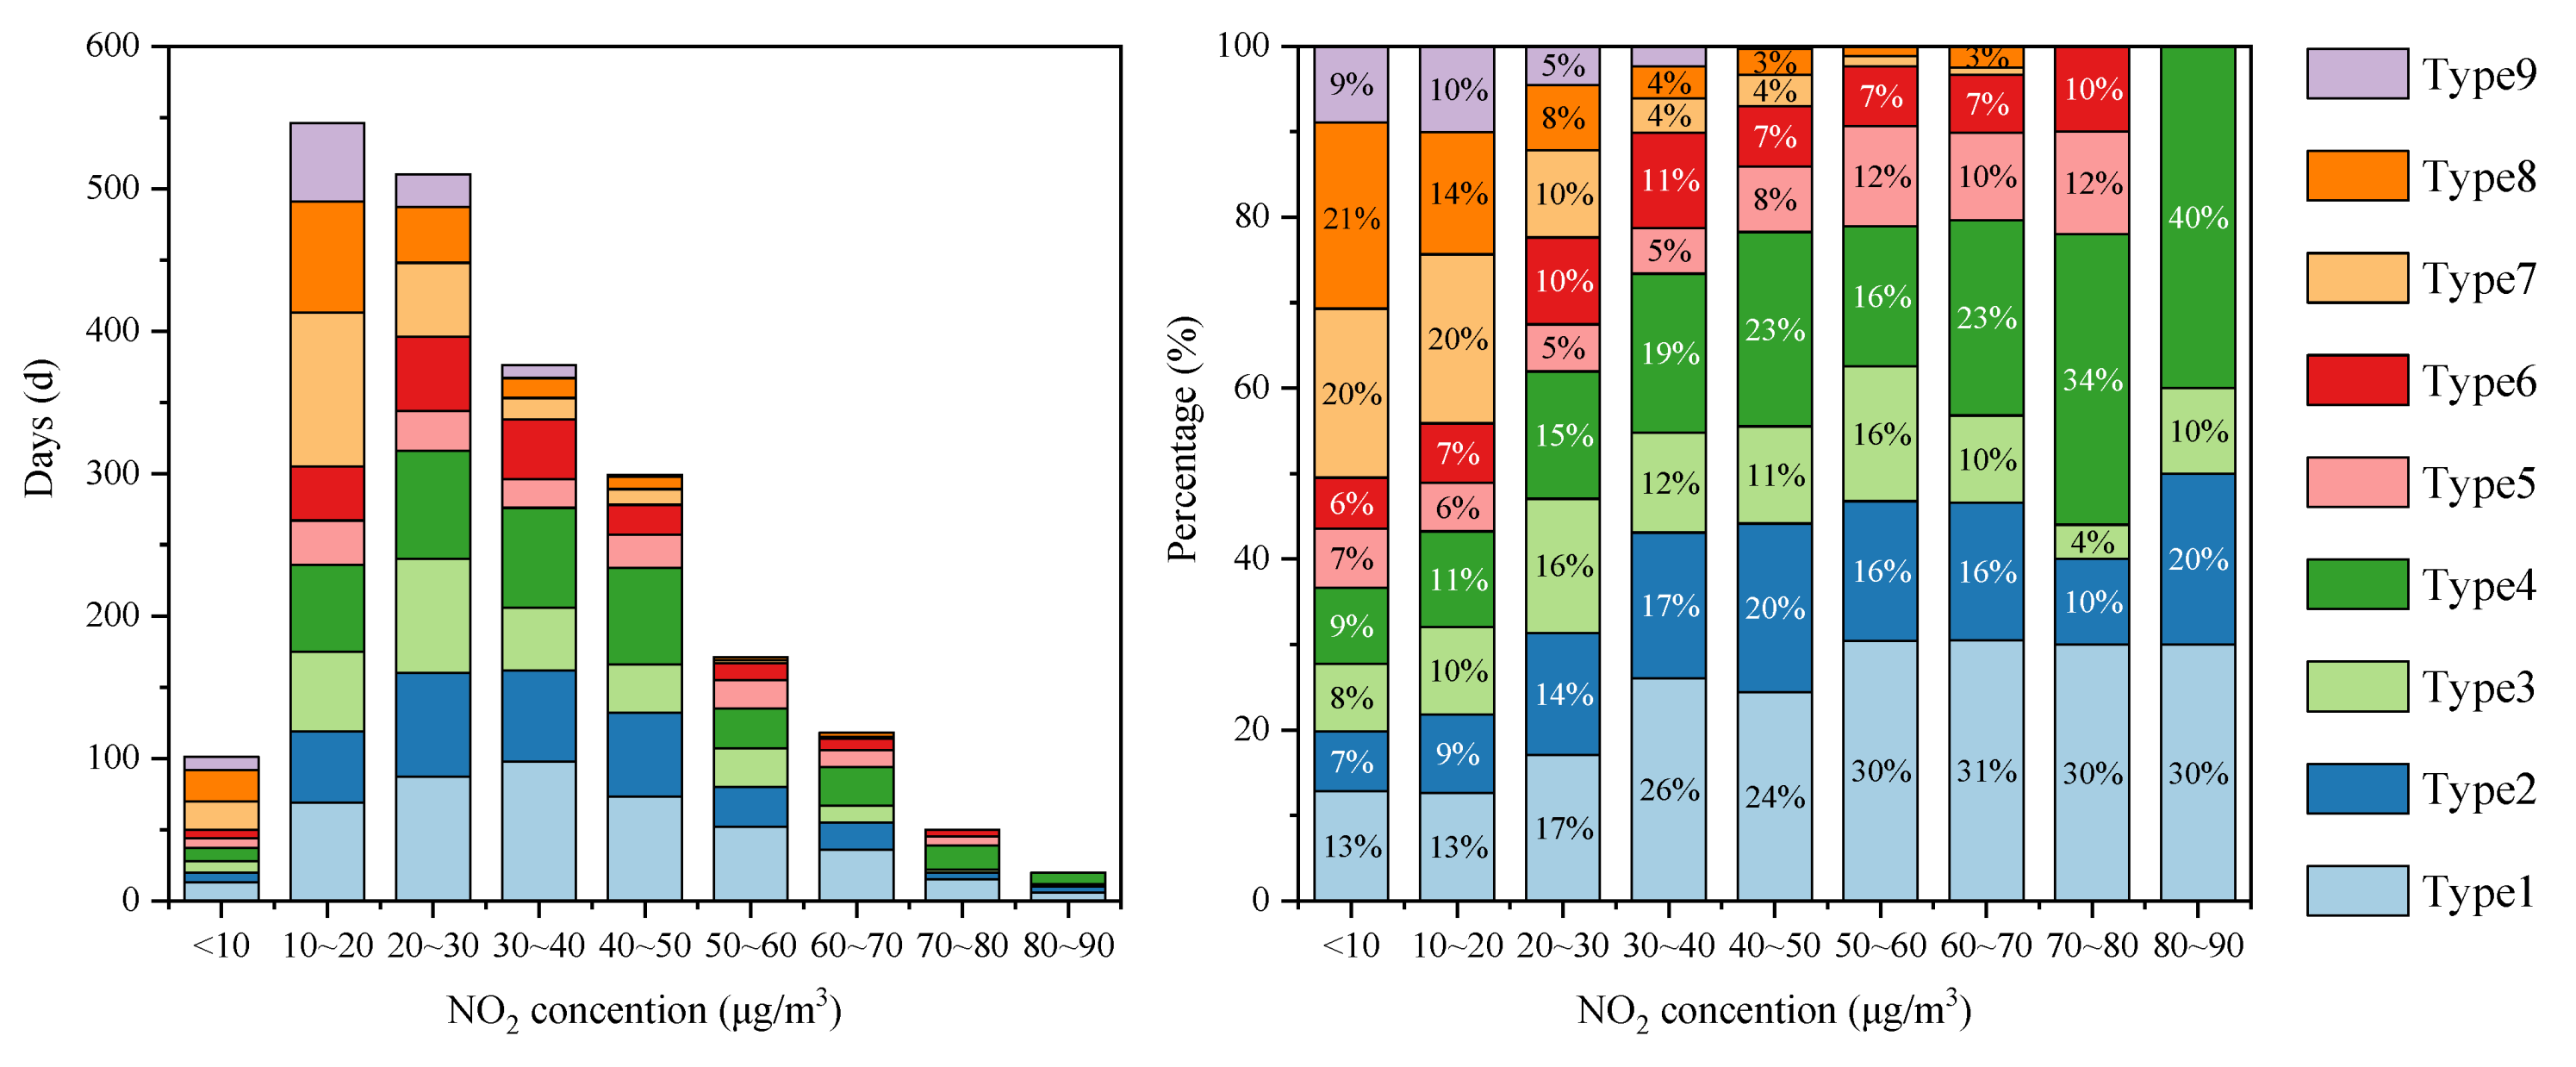
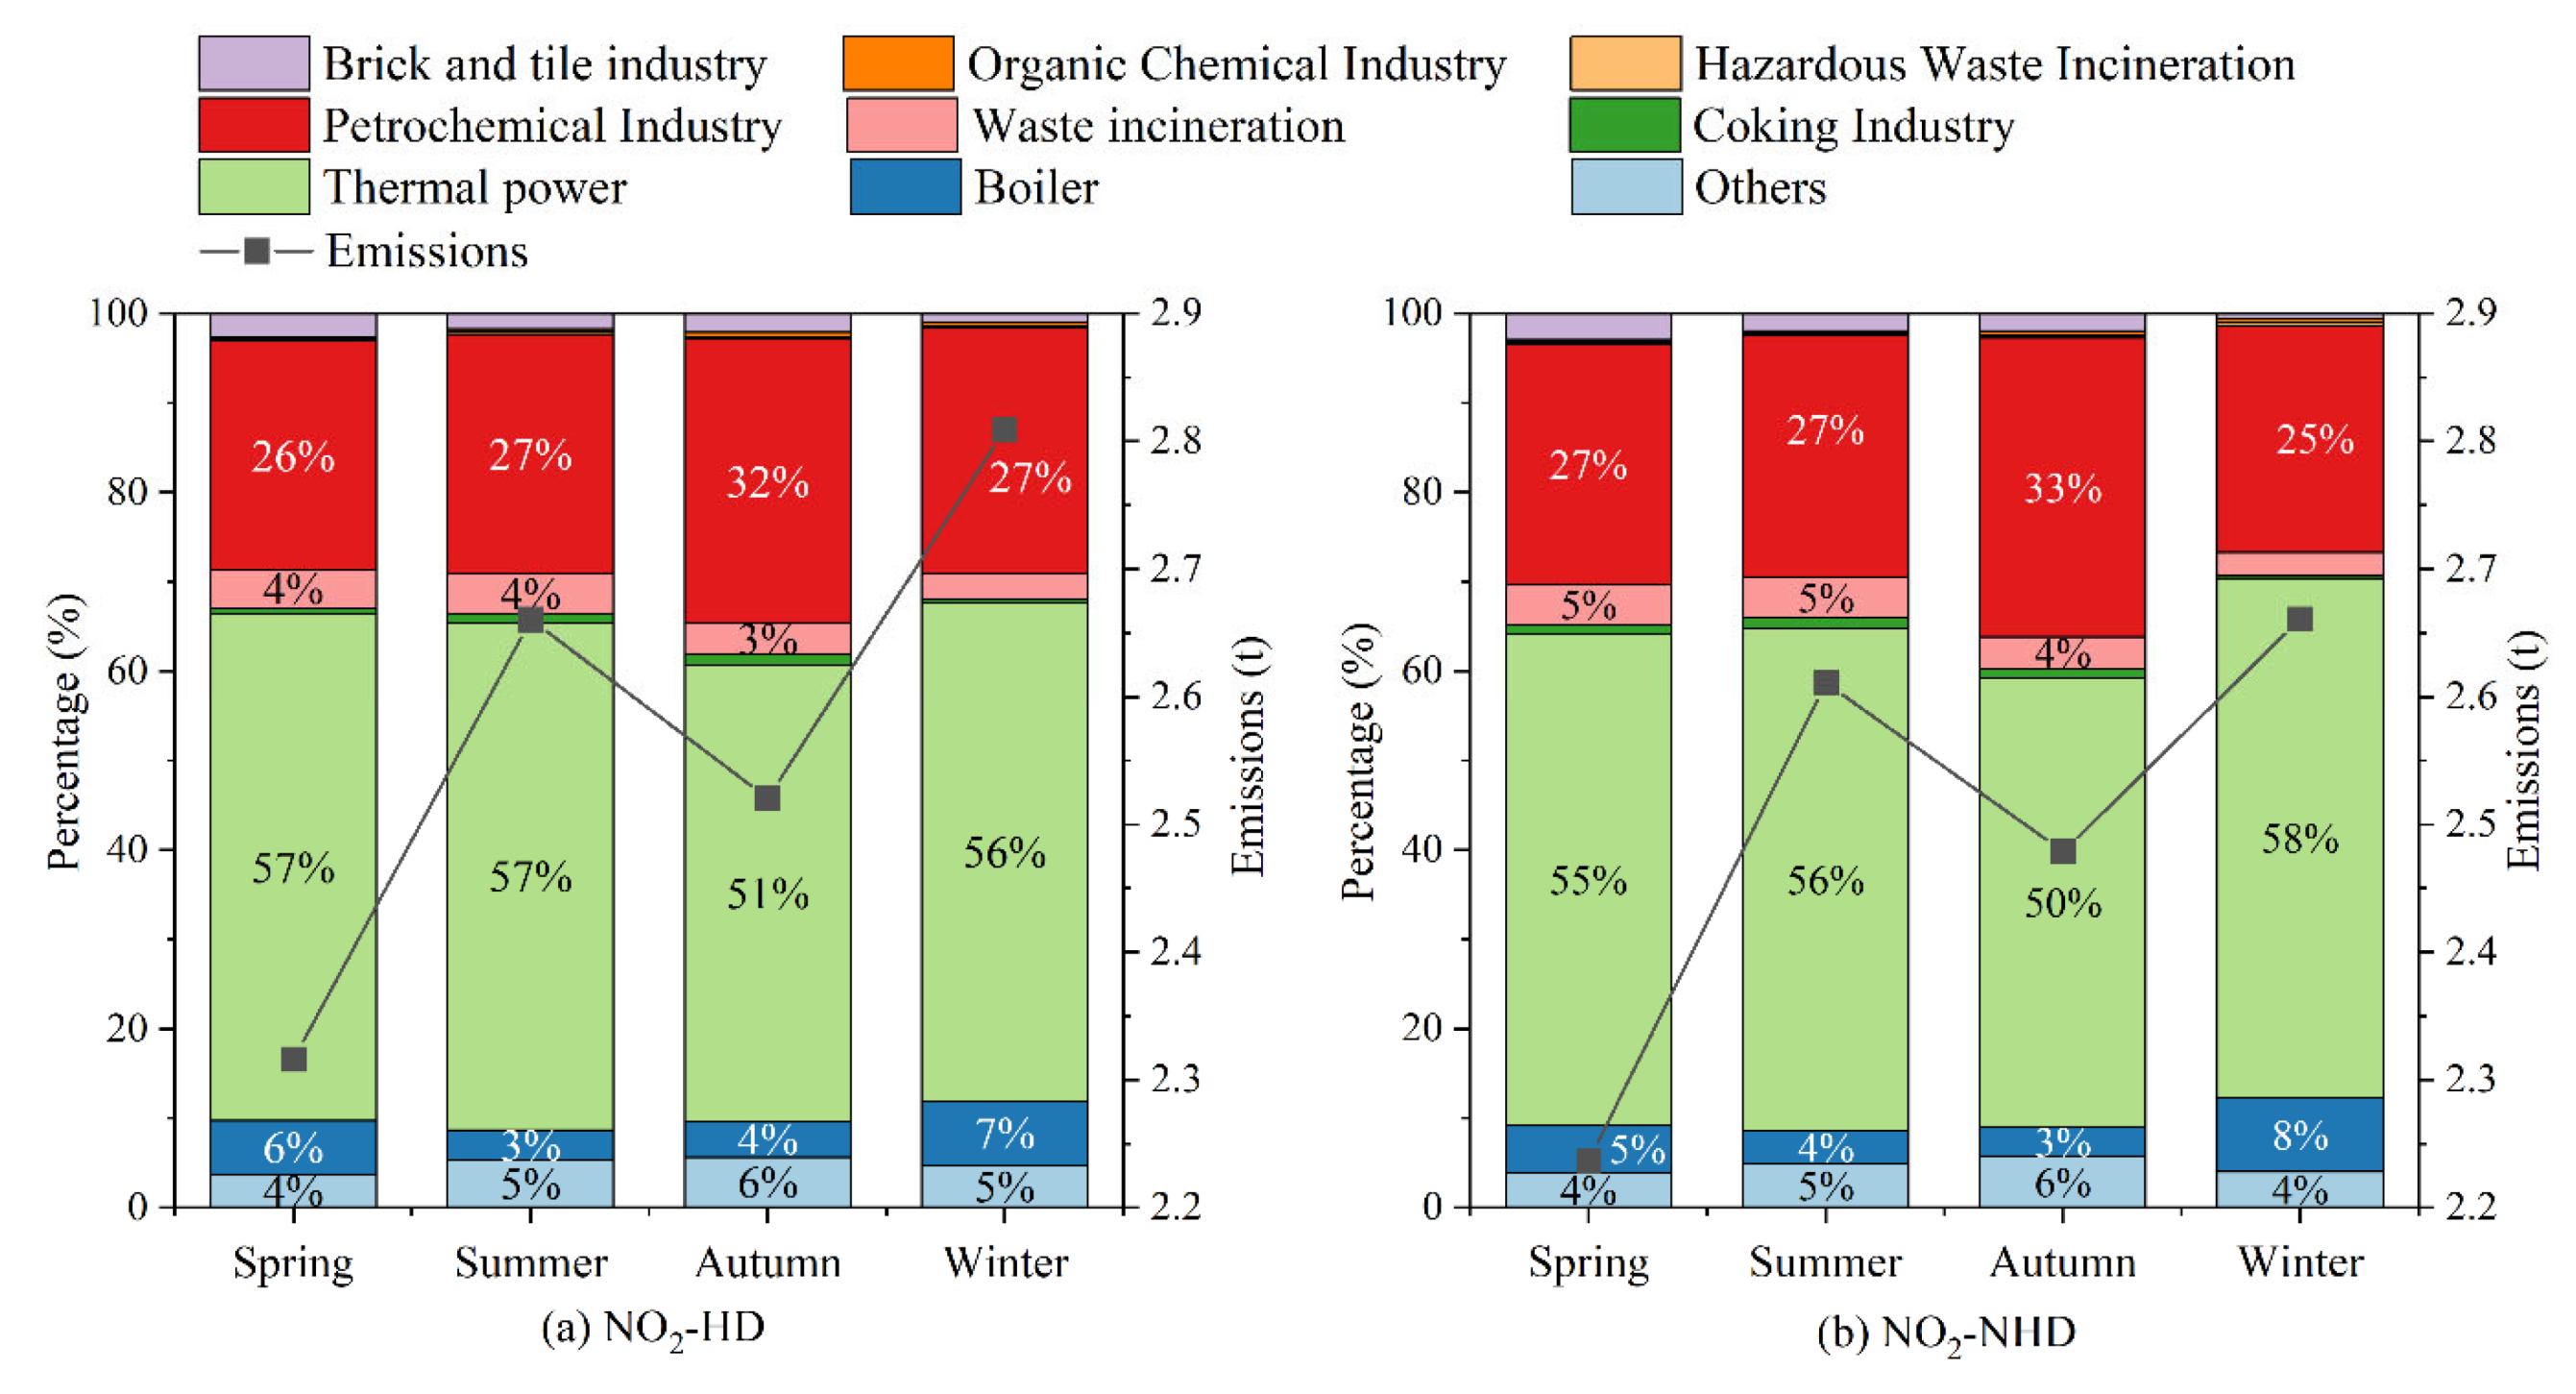
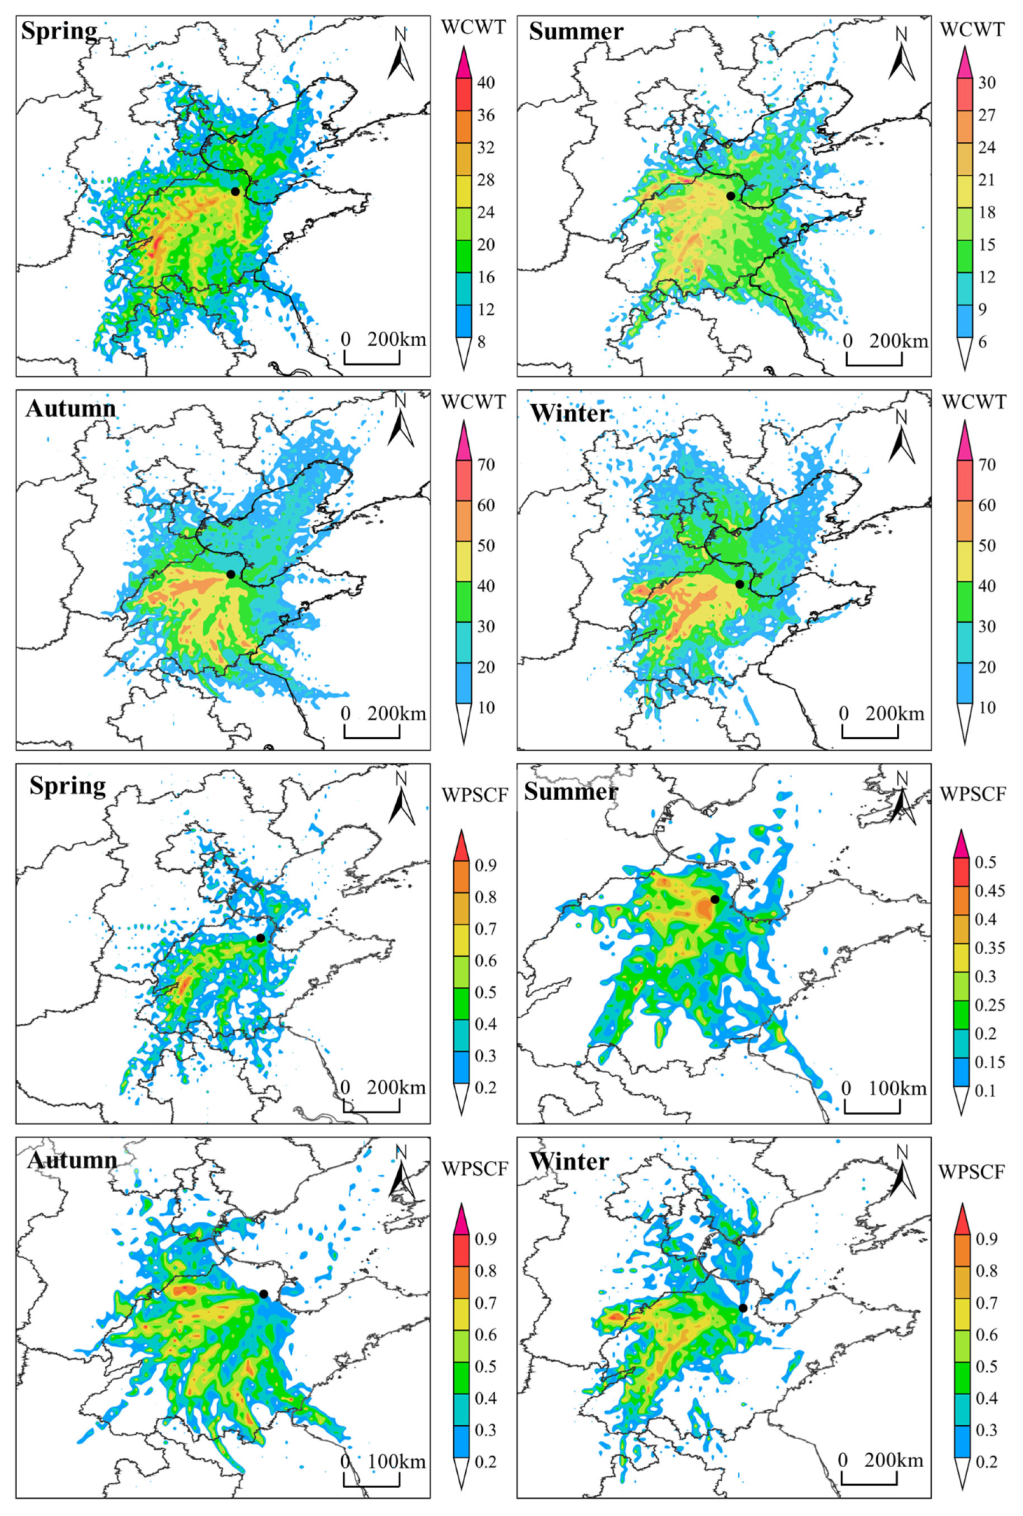
3.3.3. Sources Analysis

As shown in Figure 19, NOx emissions in Dongying are generally higher on NO2-HD days compared to NO2-NHD days across all seasons, with the greatest difference in winter and the smallest in summer. This indicates that local NOx emissions have a significant impact on NO2-HD in Dongying. Seasonal variations in NOx emissions are highest in winter and lowest in spring, which differs from the seasonal variations in NO2 concentration, suggesting that NO2 distribution may be influenced by additional factors. Industry-specific NOx emissions data reveal that thermal power (51–57%) and petrochemical industry (26–32%) are the largest contributors to NOx emissions across all seasons. Compared to NO2-NHD days, on NO2-HD days, the proportion of emissions from thermal power increases in spring, summer, and autumn, while the proportion from the petrochemical industry increases in winter. Therefore, thermal power and petrochemical industry are likely major sources affecting NO2-HD. In summary, local emissions (thermal power and petrochemical industry) have a certain impact on NO2-HD in Dongying.
Cluster analysis (Figure 20 and Figure S12) reveals significant seasonal differences in the direction, speed, and altitude of air masses at Dongying sites. In spring, northwest trajectory 3 accounts for 43.1%, with the shortest trajectory, indicating slower air mass movement and a higher potential for local pollutant accumulation. This trajectory also operates at a lower altitude, facilitating local horizontal pollutant transport. The corresponding average NO2 concentration for this trajectory was 21.1 μg/m3, contributing 48.1%. Southwest trajectory 2, which accounts for 34.9%, has a relatively short trajectory and the lowest altitude, leading to pollutant transport from southern cities in Shandong Province. Additionally, trajectory 1, with a lower proportion, has a higher altitude and exerts minimal impact on Dongying in spring. In summer, the southeastward trajectory had the highest share (44.9%) and contribution (45.7%). The average concentration for this trajectory matched the summer average NO2 concentration, indicating that this trajectory is the primary source of air masses maintaining summer NO2 levels. Trajectory 3 had the lowest share (23.1%) but the highest average concentration (18.4 μg/m3), which facilitates the formation of high NO2 values. Additionally, Dongying City in summer may be affected by the transport of air masses from the Bohai Bay (32%). Similarly, in autumn and winter, the local influence on Dongying City is significantly stronger, primarily from air masses coming from the south and southwest. This is related to air mass transport and pollutant accumulation [71]. The lifespan of NO2 is relatively short (1–2 days), primarily influenced by local transport rather than long-distance transport [72].
The distribution of WPSCF and WCWT in Dongying in 2022 is shown in Figure 21. From the WPSCF distribution, in spring, the WPSCF values for the southwestern regions of Dongying and the small area around the Bohai are relatively high, with a focus on cities in western Shandong Province, such as Jinan, Binzhou, and Taian, with western Taian having the highest potential impact on NO2-HH. In summer, the WPSCF values for nearby cities of Dongying, particularly Binzhou and Zibo, are higher, indicating a significant influence from nearby cities. In autumn, potential source regions affecting NO2-HH in Dongying are more widely distributed, primarily in central Dezhou, Jinan, Taian, and parts of Linyi. In winter, the main potential source regions affecting NO2-HH in Dongying are located in northeastern Handan, southwestern Dezhou, and central areas of Jinan and Taian. From the WCWT distribution, the distribution of WCWT values is quite similar to that of WPSCF values, with the areas of high concentration contribution aligning well with the potential source regions that significantly impact NO2-HH at the observation site. In spring, autumn, and winter, areas with WPSCF values greater than 0.5 generally correspond to areas with high WCWT values, while in summer, areas with WPSCF values greater than 0.25 align with areas of high WCWT values. This correspondence is related to the NO2 threshold settings in the seasonal PSCF analysis. In addition to the regions corresponding to the high WPSCF values, there are some areas with high WCWT values in the Bohai Sea of China during spring and summer and in the northwest of Dongying during winter.
In summary, the distribution of high WCWT and WPSCF values is quite similar and aligns closely with the main air mass transport pathways. NO2 regional transport in Dongying primarily occurs within Shandong Province. The potential source regions that contribute most significantly to the occurrence probability and concentration of NO2-HH at the Dongying site are mainly located in the western and southwestern parts of Shandong Province (with wider distribution in autumn and winter), including Jinan, Binzhou, Taian, and Zibo. Additionally, during spring and summer, there is a certain influence from the Bohai Sea of China.
Dongying City is located in the Bohai Bay region, which has a unique geographical location and meteorological conditions [19,55]. In the future, building on outstanding international research, it is highly necessary to conduct long-term and large-scale studies on NO2 to provide scientific support for regional NO2 control and air quality improvement.

4. Conclusions

In this study, we explored the effects of NO2 on the ambient air quality in Dongying, a typical petrochemical city in Bohai Bay of China, from 2017 to 2023 and the impacts of high NO2 values on the concentrations of O3, PM2.5 and PM2.5-bounded secondary components, and atmospheric oxidation capacity in 2022, and investigated the reasons for the formation of high NO2 values in Dongying.
(1)
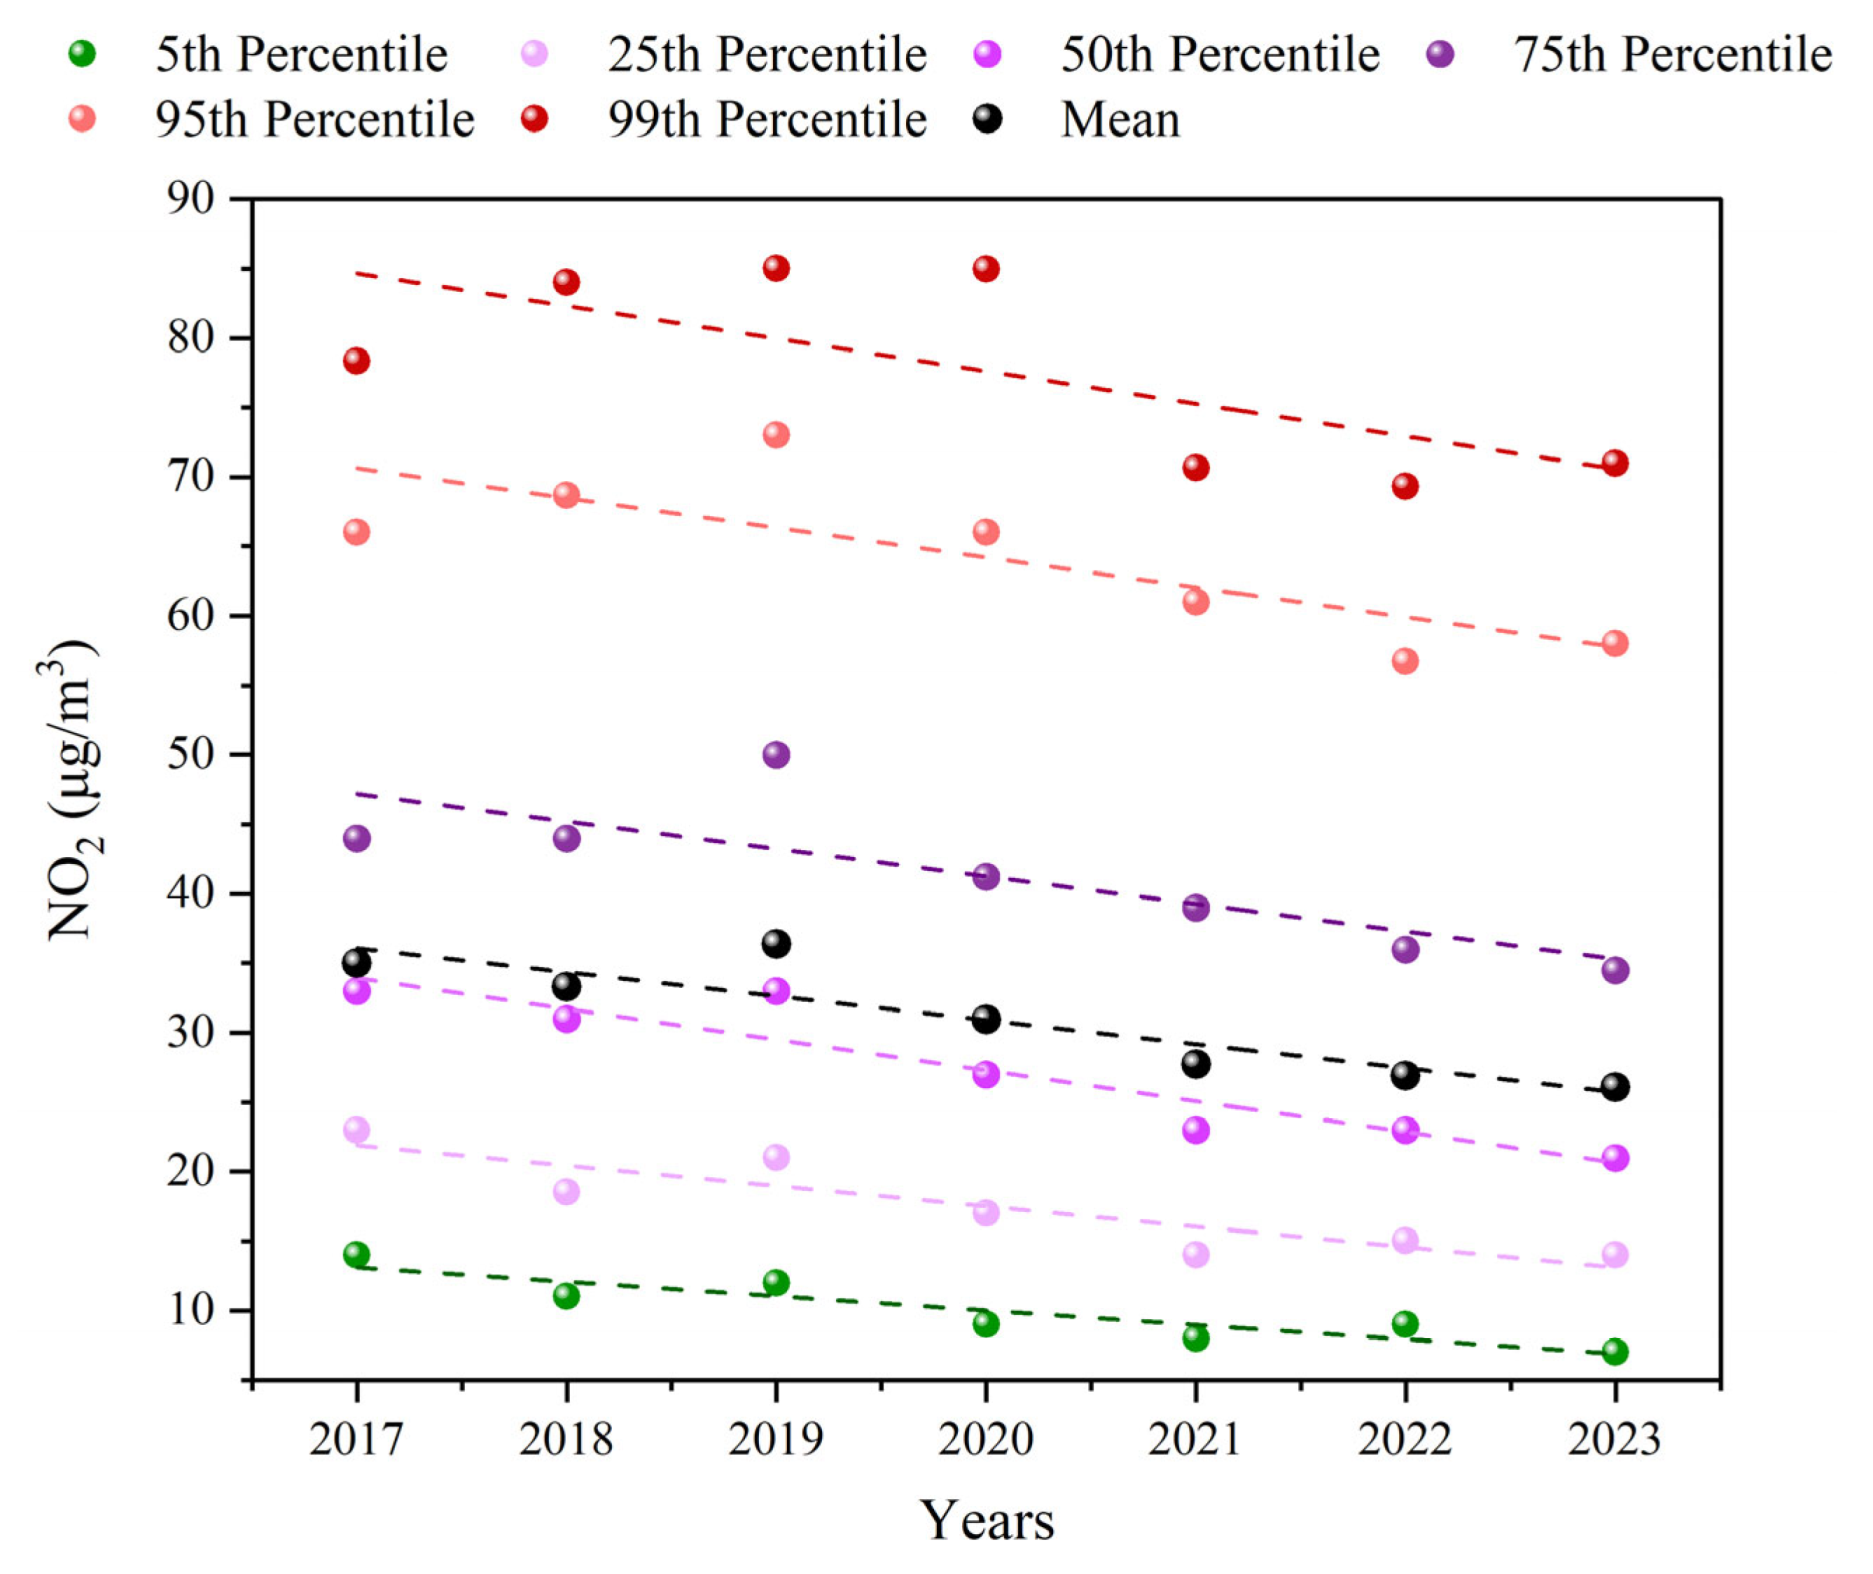
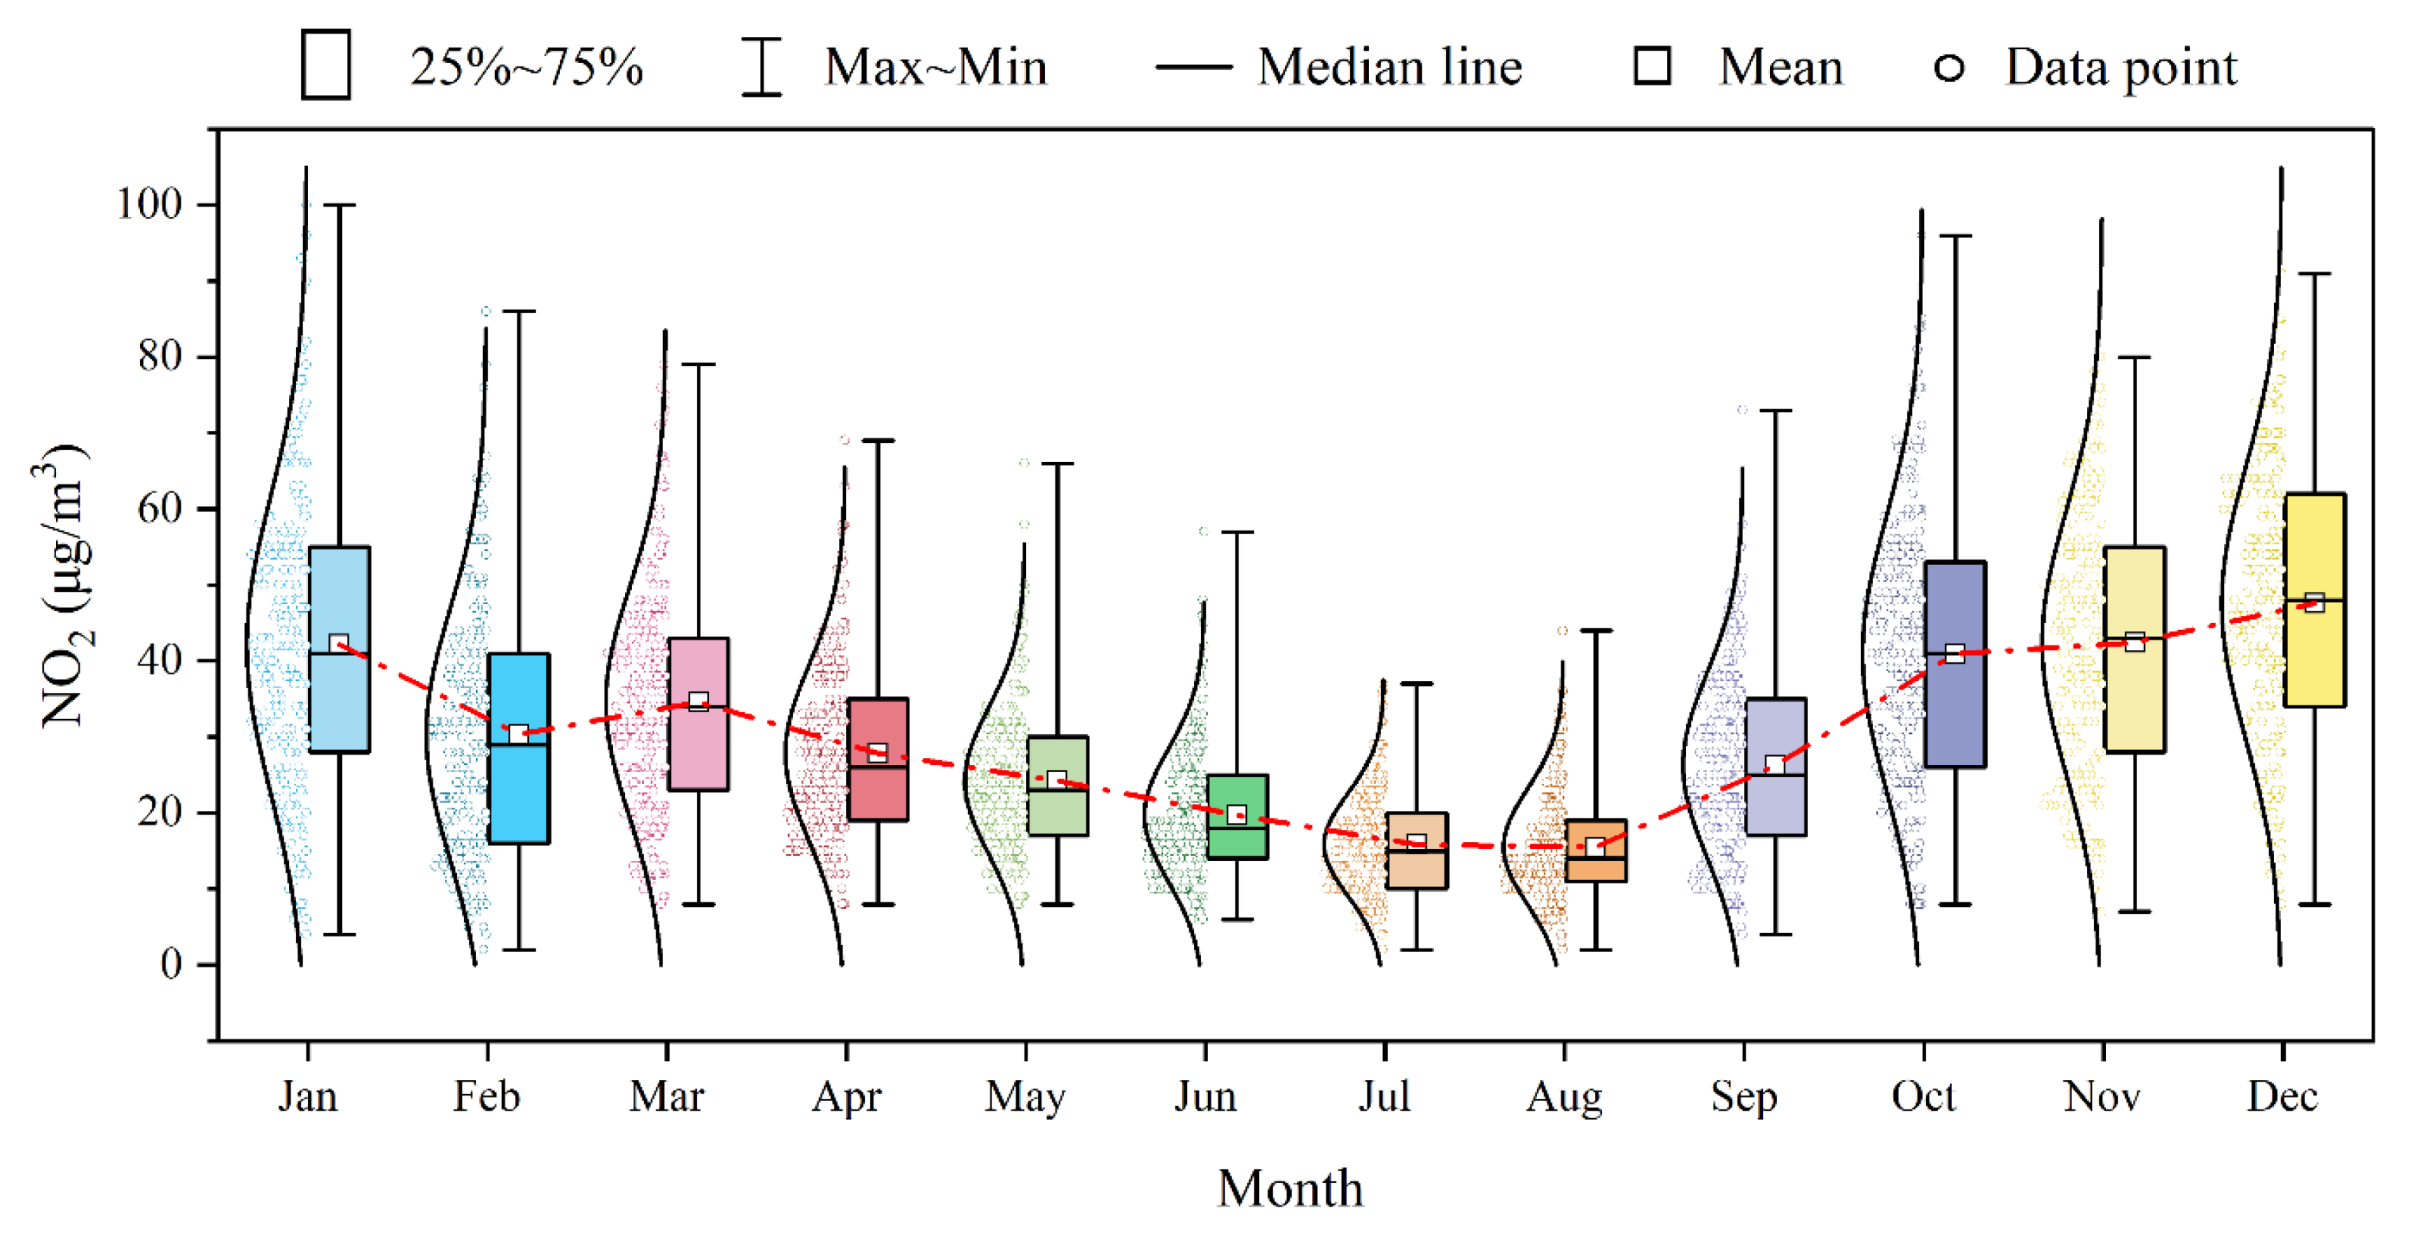
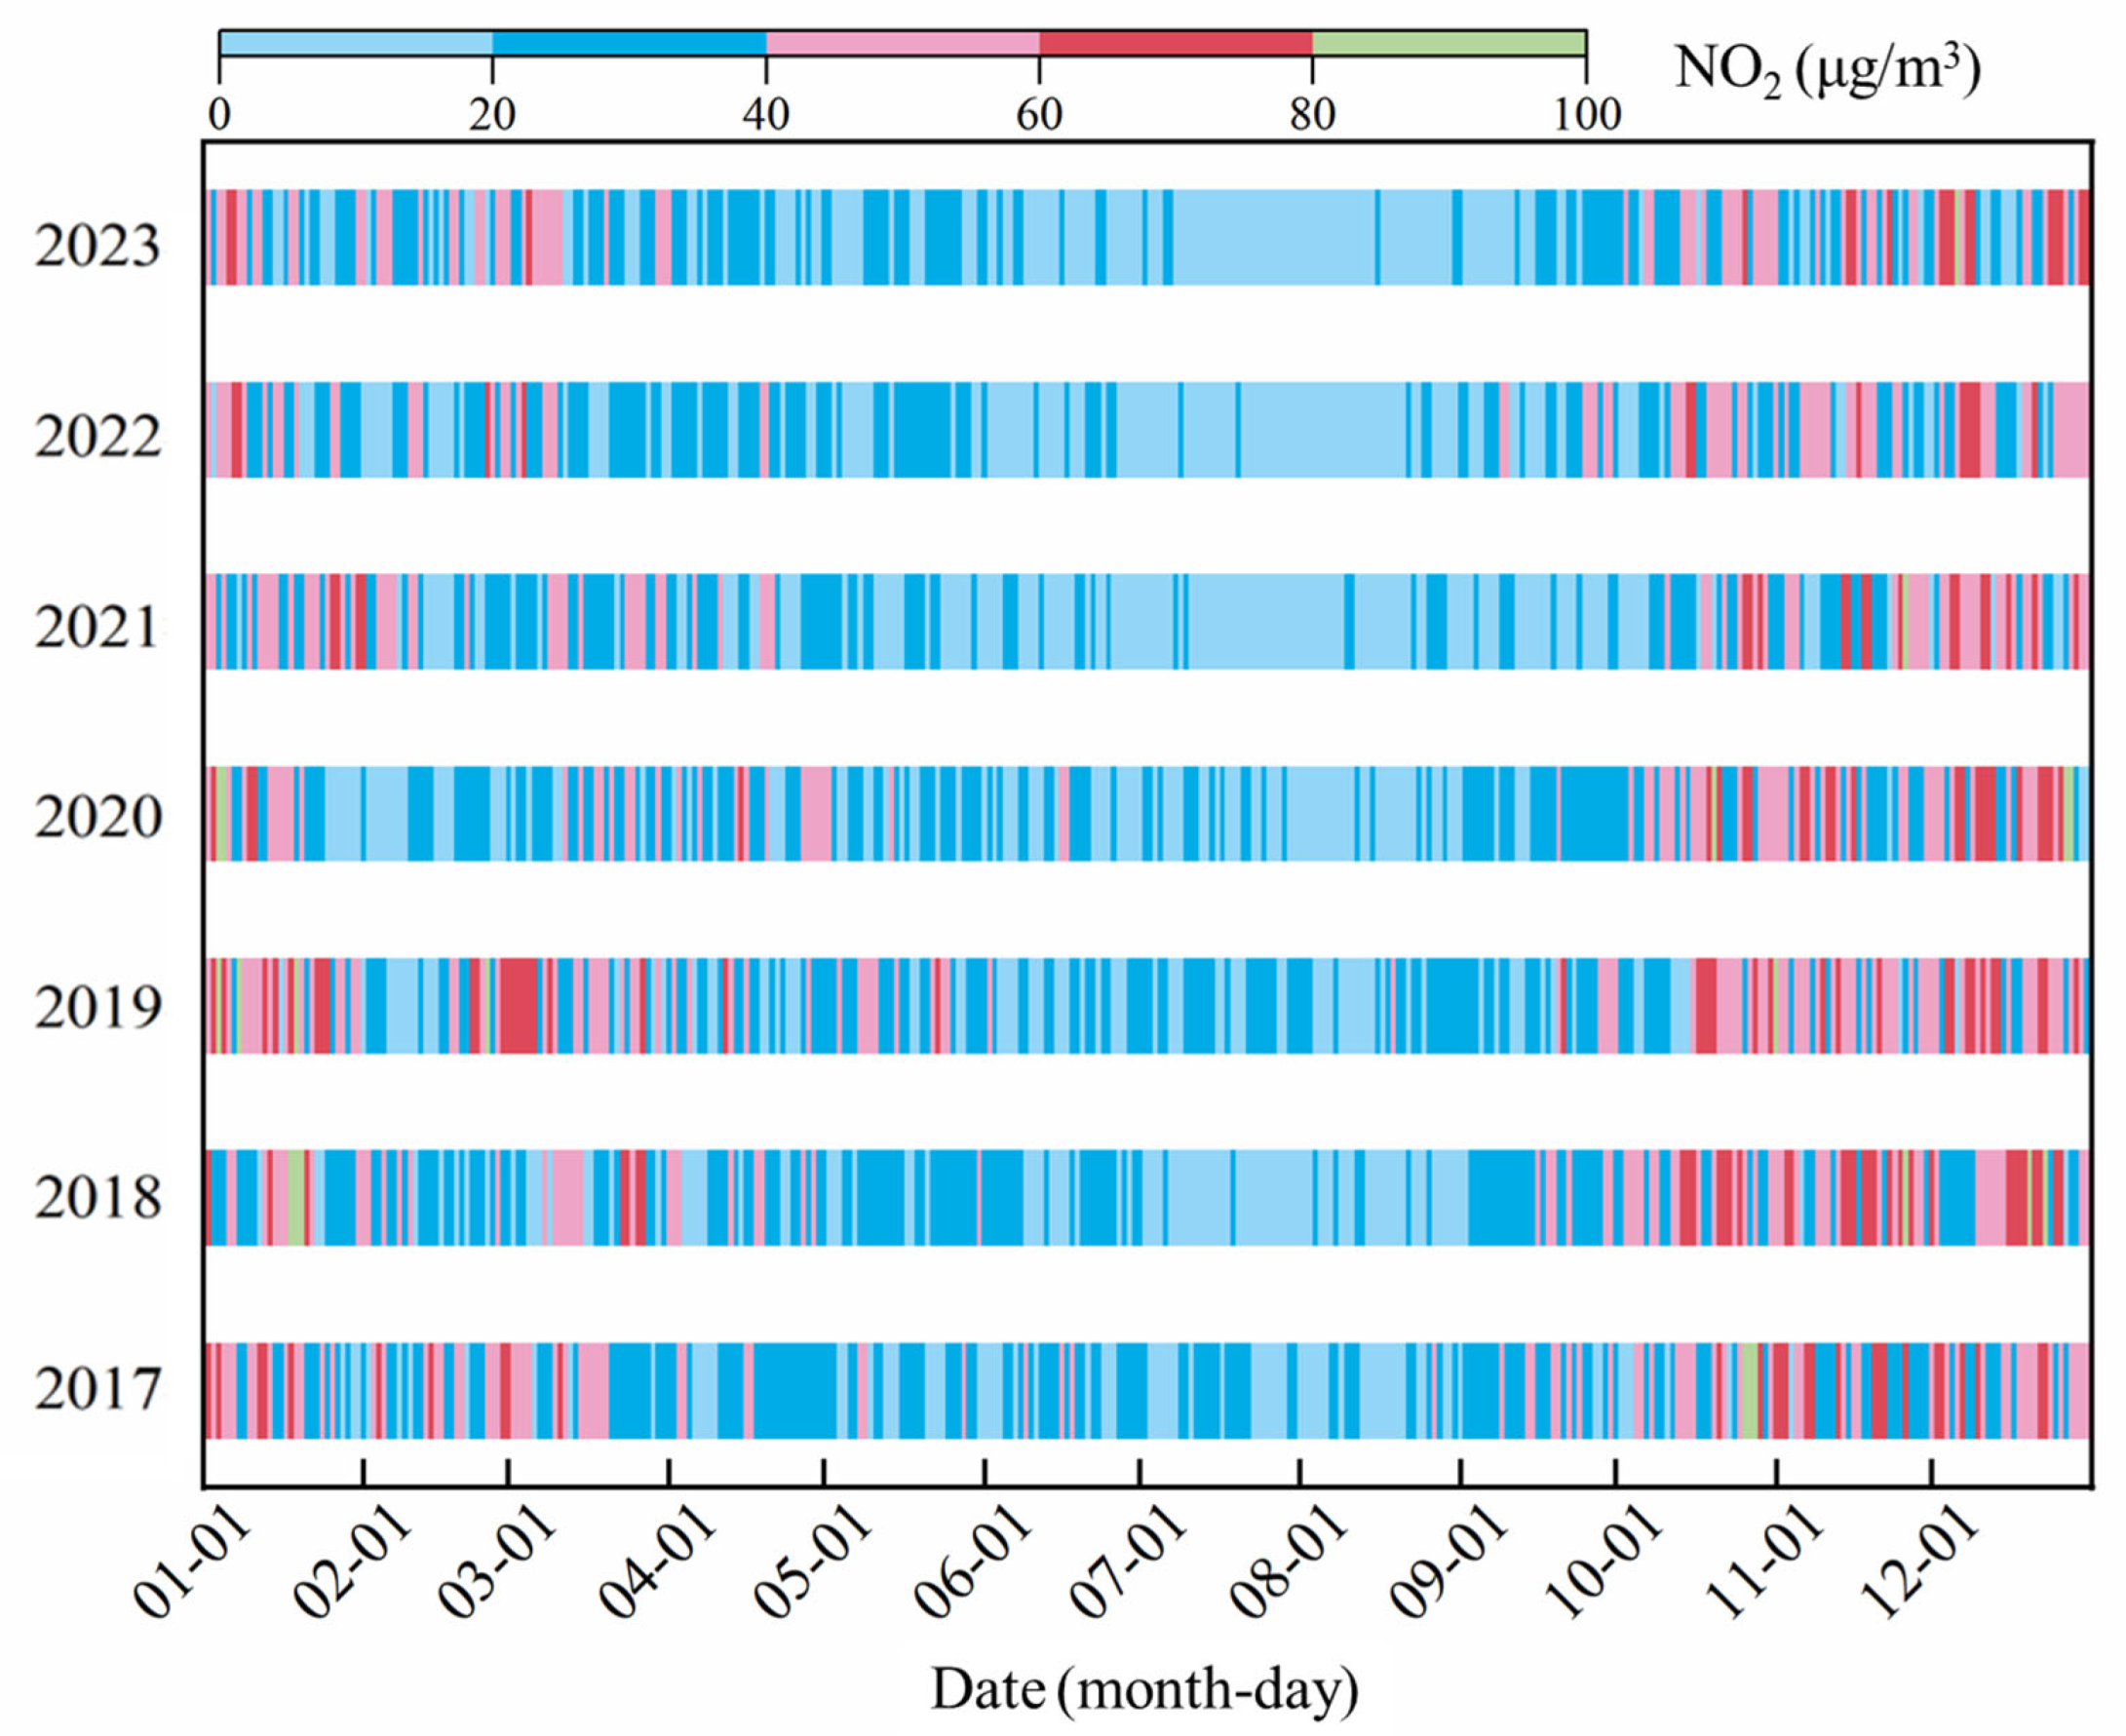
From 2017 to 2023, the annual assessment values of NO2 concentrations in Dongying exhibited a trend of initially decreasing and then stabilizing, with monthly variation characterized by a “U” distribution, diurnal variation characterized by a “single-peak, single-valley” distribution, and spatial variation characterized by a “high in the south-central part and low in the north” distribution. Higher daily NO2 concentrations mainly occurred during January-April and September-December each year, and higher hourly NO2 concentrations mainly occurred during the nighttime and morning rush hours.
(2)
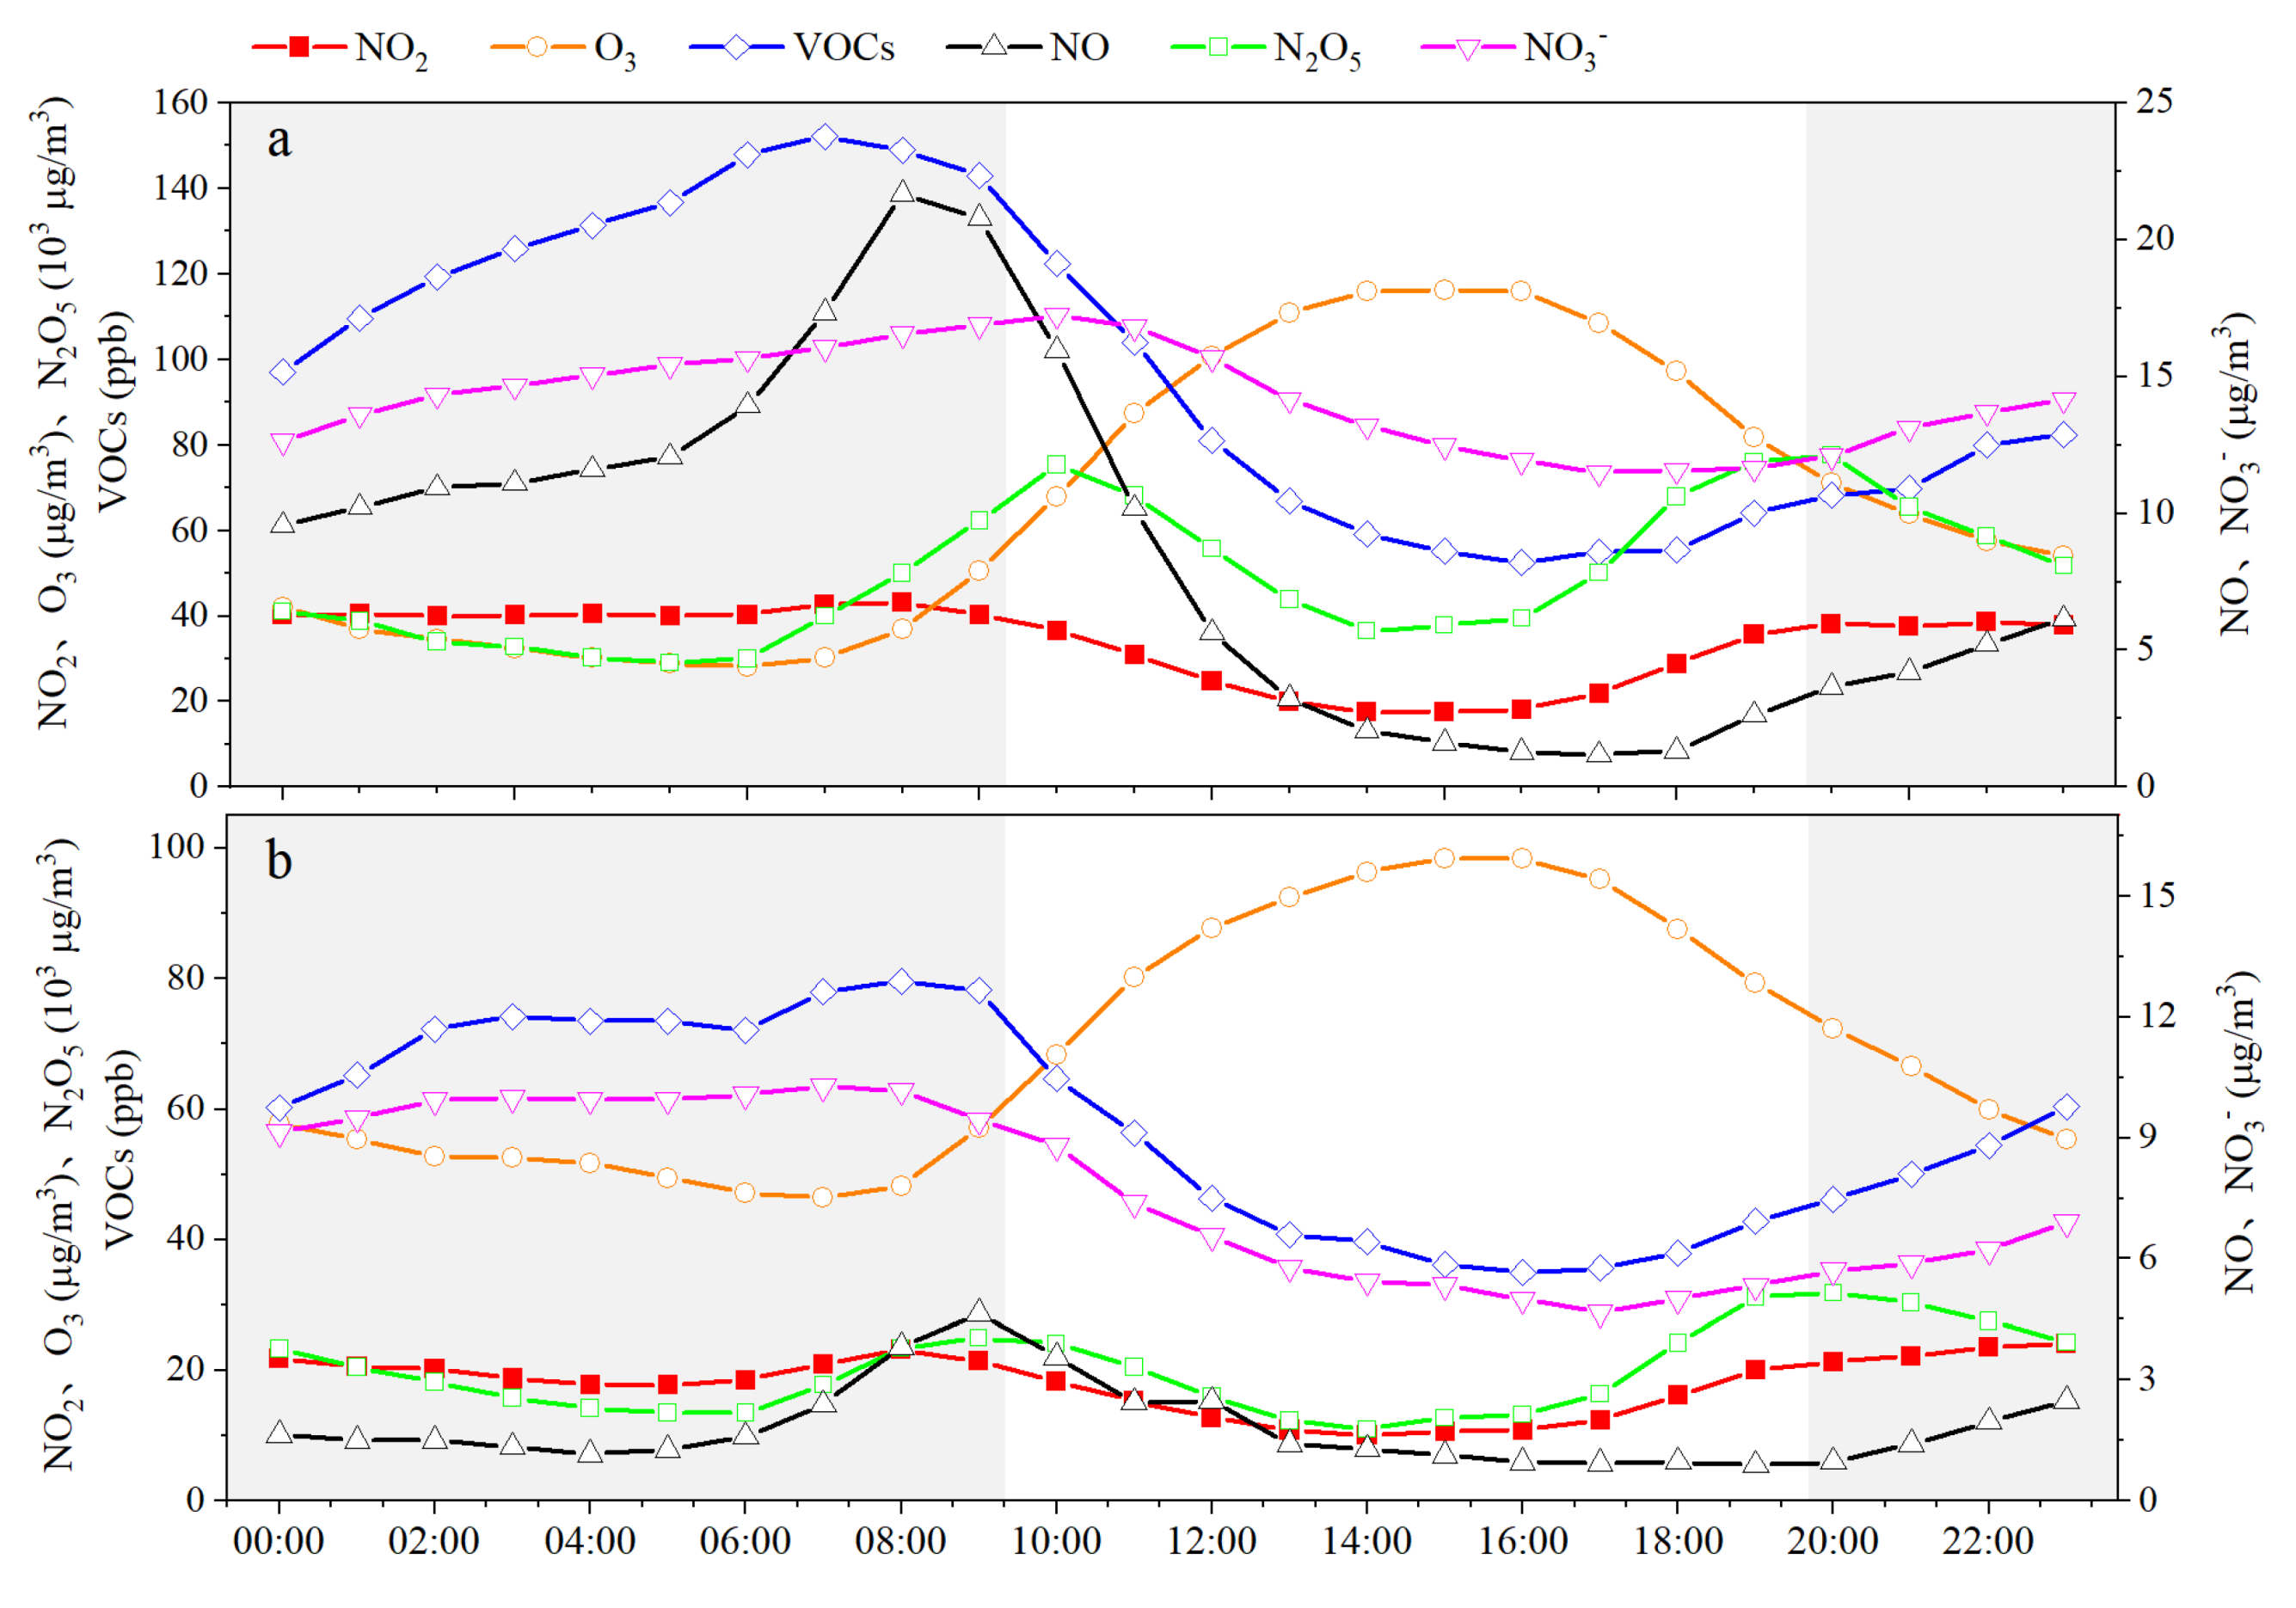
NO2 is a contributing factor to the increase in various pollutant concentrations, thereby affecting air quality levels. High hourly NO2 values (NO2-HH) events promoted the increase in the concentrations of PM2.5 and PM2.5-bounded NO3-, SO42- and SOC, and OX during the nighttime and morning rush hours, and they also facilitated the increase in the concentrations of O3, PM2.5 and PM2.5-bounded NO3-, SO42- and SOC, and OX, as well as NOR and SOR values during the daytime. High daily NO2 values (NO2-HD) could promote the increase in the concentrations of O3 (MDA8-O3), PM2.5 and PM2.5-bounded NO3-, SO42- and SOC, and OX on the same day.
(3)
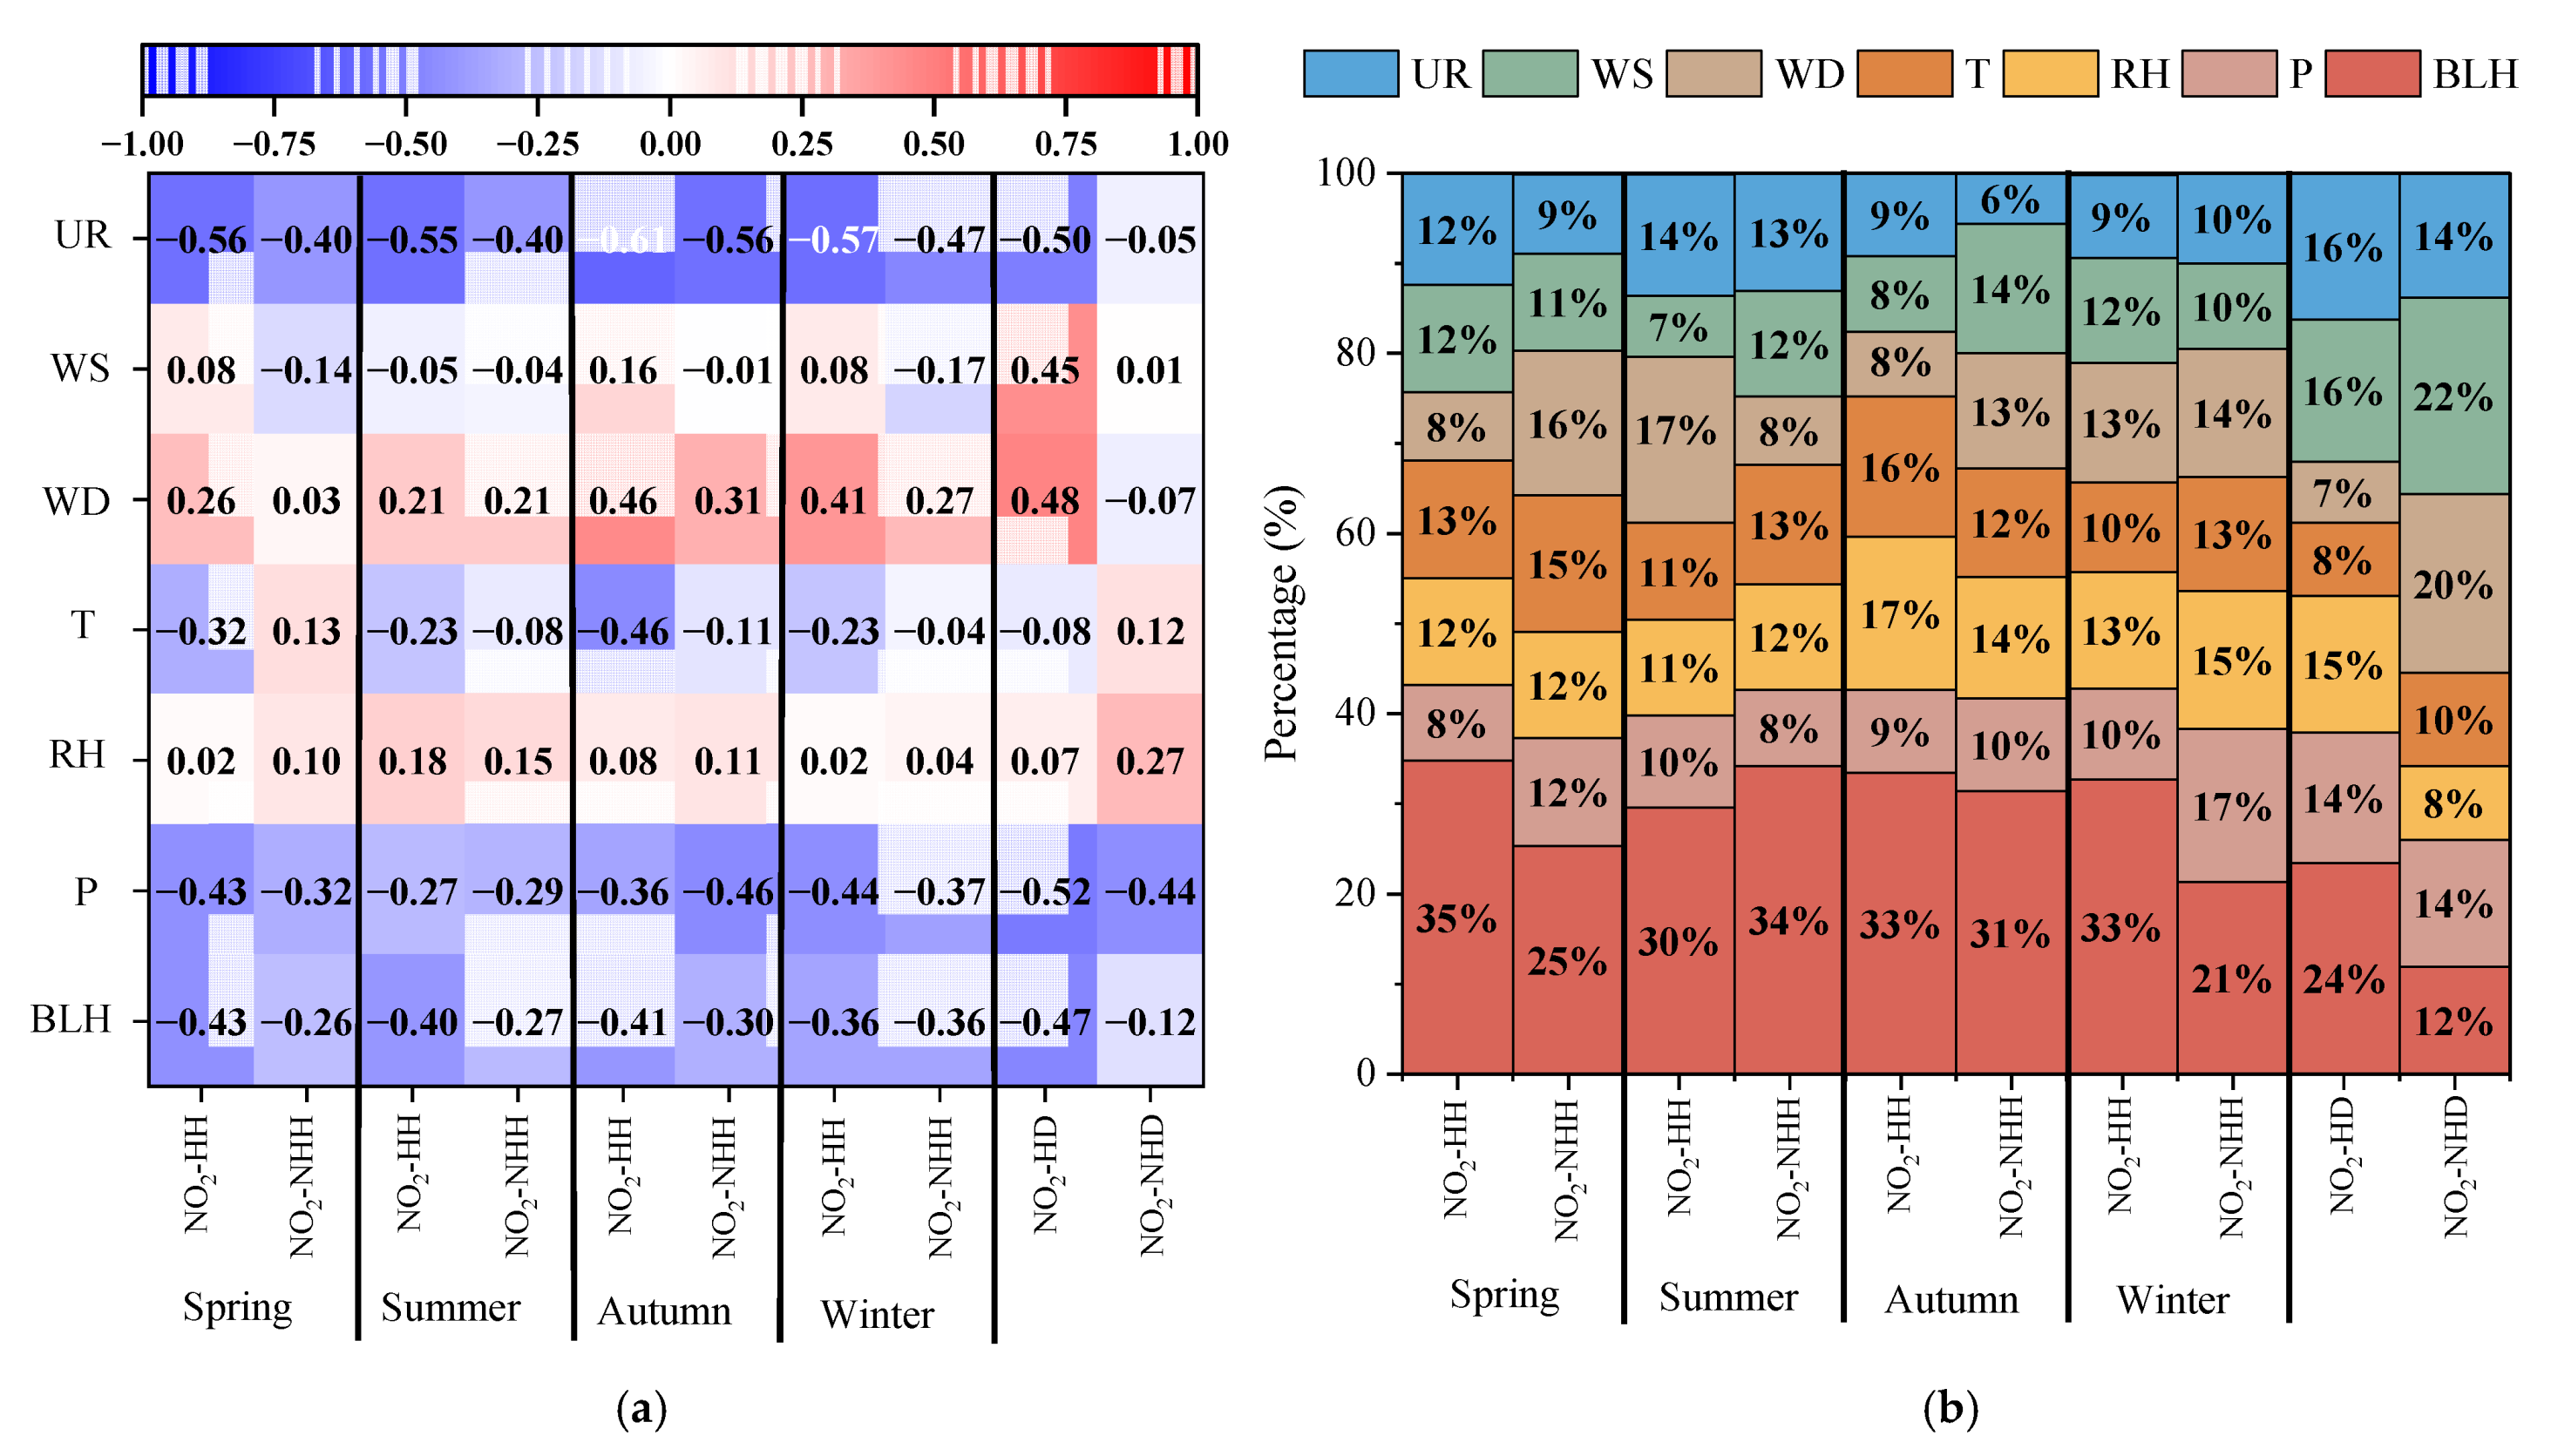
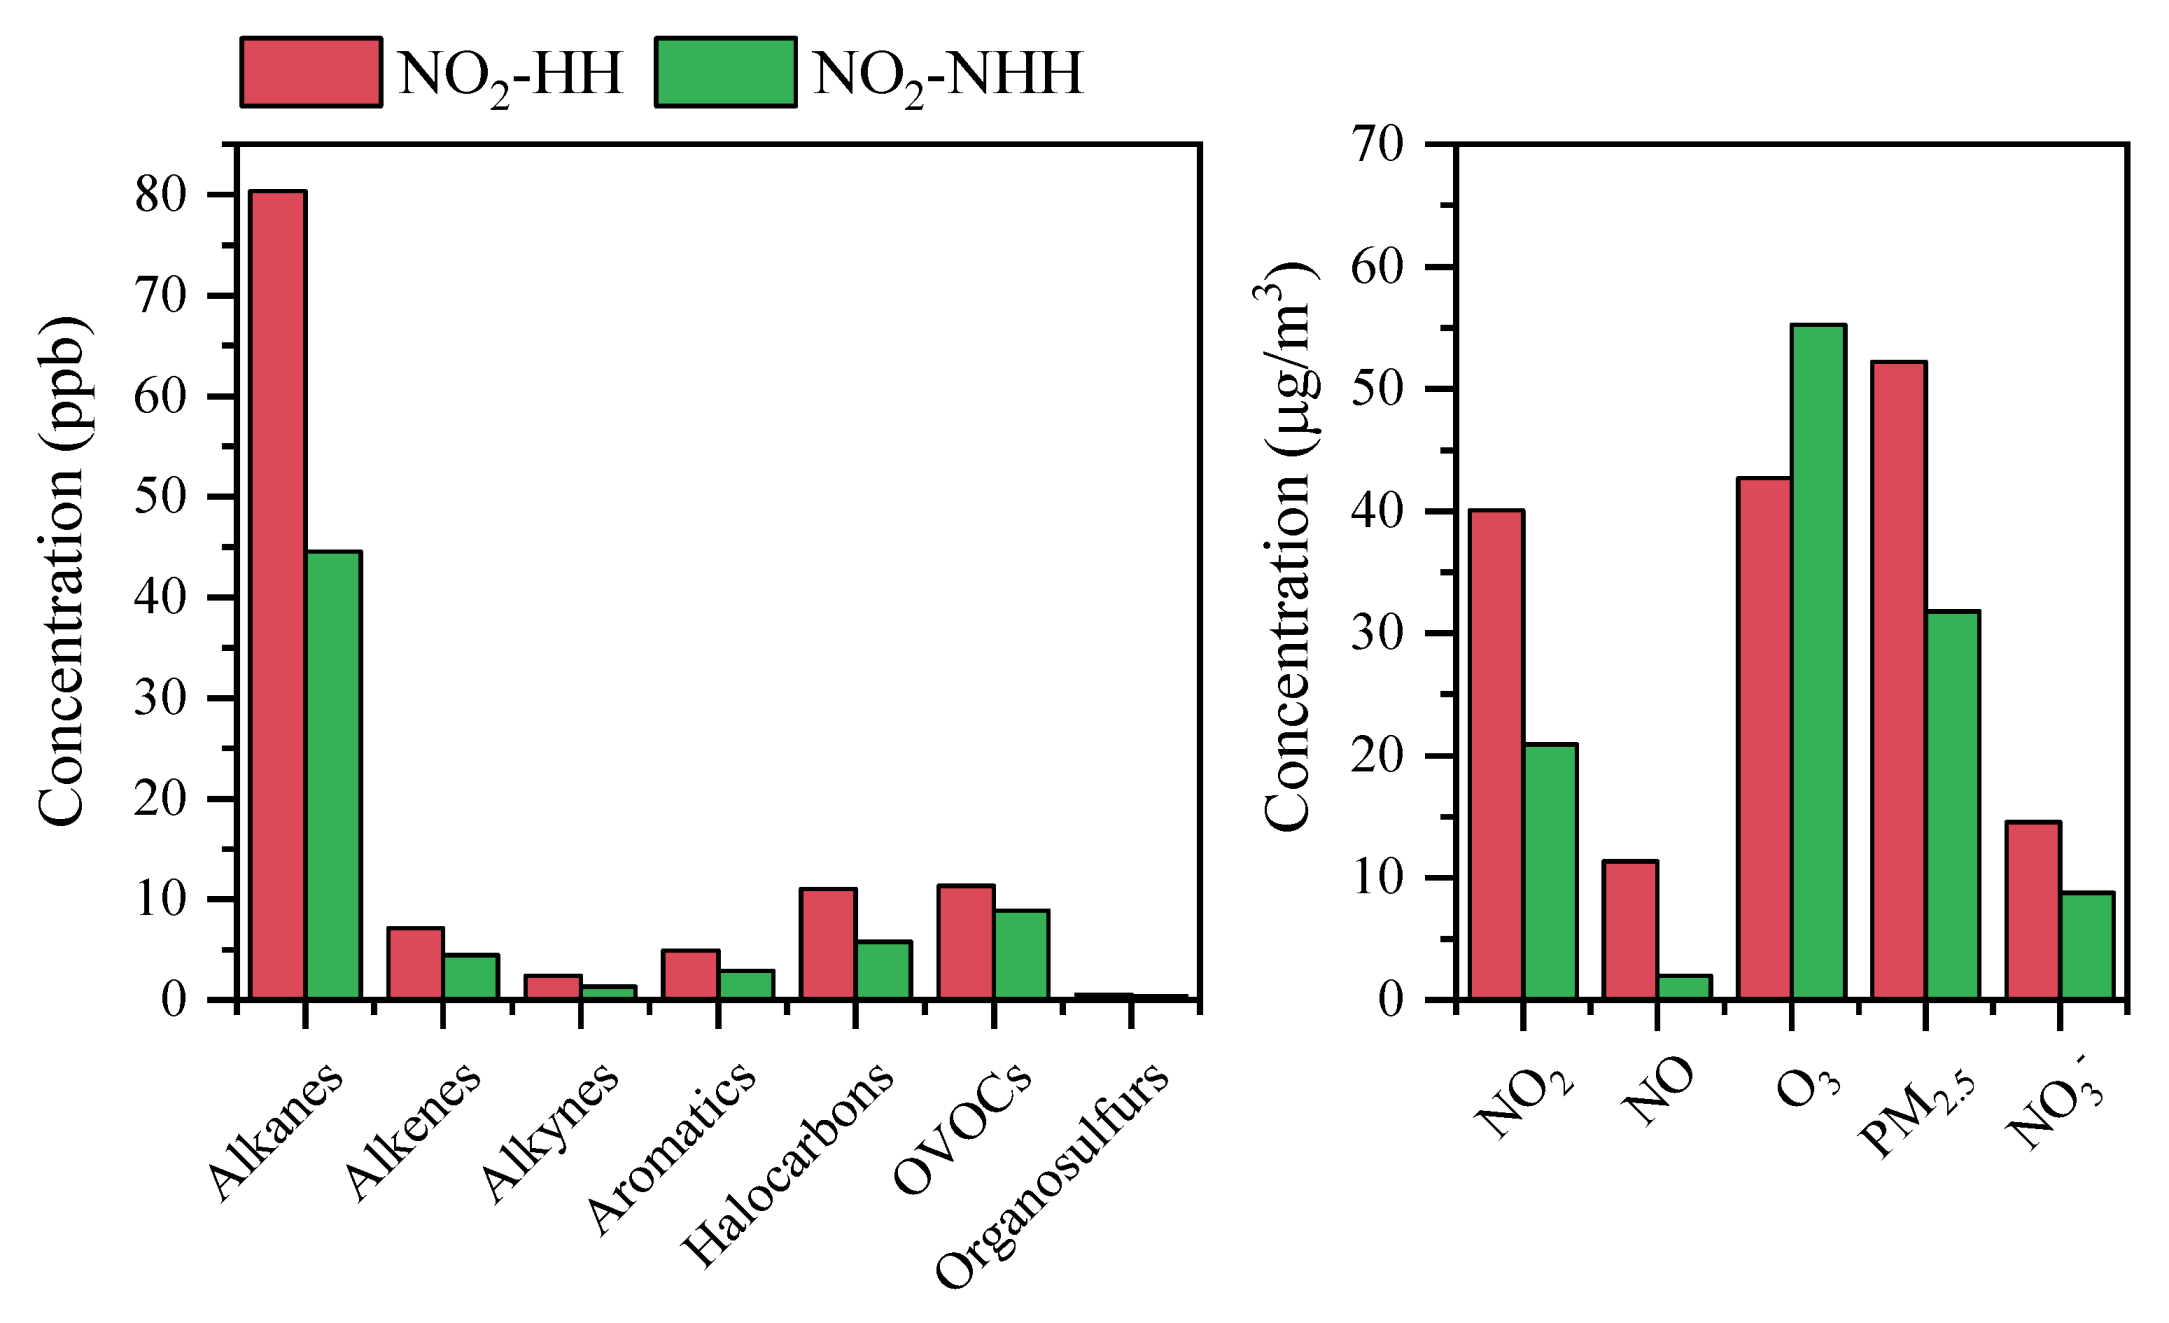
The occurrence of high NO2 values was affected by the combination of unfavorable meteorological conditions, local emissions and regional air pollution transports, and localized atmospheric chemical generation. High-pressure and uniform-pressure weather patterns, along with low temperatures (−5~15 °C), moderate humidity (30~80%), wind speeds below 1 m/s, and southwesterly winds, are conducive to high daily NO2 values. In 2022, land–sea breeze circulation significantly contributed to high NO2 concentrations. Random forest analysis indicates that in 2022, BLH in spring (−0.43) and winter (−0.36), WD in summer (0.21), and T (−0.46) in autumn were the primary factors contributing to NO2-HH, while BLH (−0.47) is the main cause for NO2-HD. The titration reaction between NO with O3 is the main cause for NO2-HH in spring, summer and fall, and photochemical reactions of Aromatics have a significant influence on NO2-HD. NOx emissions from the thermal power and petrochemical industry in Dongying and air pollution transports from western and southwestern Shandong Province (throughout the year) and from the Bohai Sea (during spring and summer) had serious adverse impact on high NO2 values.
It is recommended that Dongying strengthens its control over NOX emissions from local thermal power and petrochemical industries, and actively promotes the establishment of an air pollution prevention and control mechanism in collaboration with cities in western and southwestern Shandong Province and the Bohai Bay region of China to effectively reduce NO2 concentrations and prevent high NO2 values, thereby continuously improving air quality.

Supplementary Materials

The following supporting information can be downloaded at: https://www.mdpi.com/article/10.3390/toxics13030208/s1, Figure S1: Conceptual diagram of NO2 sources, sinks, and impacts; Figure S2: Box plots of daily average concentrations (a) and hourly concentrations (b) of NO2 in Dongying for each season in 2022; Figure S3: Technical roadmap of analyzing the impact of NO2 on air quality in Dongying; Figure S4: Technical roadmap of analyzing the causes of high NO2 values in Dongying in 2022; Figure S5: Comparison of diurnal variations of NO2 concentrations in Dongying from 2017 to 2023; Figure S6: Percentages of days with different NO2 air quality levels and number of days with NO2 as the primary pollutant in Dongying from 2017 to 2023; Figure S7: Comparison of monthly distribution of NO2-HD days in Dongying in 2022; Figure S8: Comparison of seasonal distribution of NO2-HH in Dongying in 2022; Figure S9: Differences in the daytime concentrations of O3, PM2.5 and PM2.5-bounded secondary components between NO2-HH events and NO2-NHH periods in Dongying in 2022; Figure S10: Differences in the daytime concentrations of OX, and values of NOR and SOR between NO2-HH events and NO2-NHH periods in Dongying in 2022; Figure S11: Classification of 925-hPa synoptic patterns in Dongying from 2017 to 2022; Figure S12: Mean barometric pressure variation curves in the vertical direction during the movement of clustered trajectories in each season in 2022; Text S1: Data sources; Text S2: Data quality control; Text S3: Synoptic classification method; Text S4: HYSPLIT mode; Text S5: Backward trajectory clustering analysis; Text S6: PSCF analysis; Text S7: CWT analysis; Text S8: Analysis of impact of high NO2 values on daytime O3, PM2.5, and atmospheric oxidation capacity in Dongying in 2022; Table S1: Data types and data sources for each part of analysis in this study; Table S2: Correlation between NO2 concentration and meteorological factors in different seasons in Dongying from 2017 to 2022 [73,74,75,76,77,78,79,80,81,82,83,84,85,86].

Author Contributions

X.G.: Formal analysis, Investigation, Methodology, Visualization and Writing—original draft. C.A.: Validation and Writing—review and editing. Y.Y.: Software. Y.J.: Methodology. W.W.: Methodology. L.X.: Methodology. F.S.: Data curation. J.L.: Data curation. R.G.: Project administration, Supervision, and Methodology. L.T.: Resources. H.L.: Conceptualization, Methodology, Supervision, Validation, Funding acquisition, Writing—review and editing. All authors have read and agreed to the published version of the manuscript.

Funding

This work was supported by the Ministry of Ecology and Environment of China under the project (DQGG202121) and the Dongying Ecological and Environmental Bureau (2021DFKY-0779).

Institutional Review Board Statement

Not applicable.

Informed Consent Statement

Not applicable.

Data Availability Statement

The raw data supporting the conclusions of this article will be made available by the authors on request.

Conflicts of Interest

Author Luyao Tan was employed by the company Ltd. of Shandong Environmental Protection Industry Corp. The remaining authors declare that the research was conducted in the absence of any commercial or financial relationships that could be construed as a potential conflict of interest.

References

  1. Tang, X.Y.; Zhang, Y.H.; Shao, M. Atmospheric Environmental Chemistry; Higher Education Press: Beijing, China, 2024. [Google Scholar]
  2. Xia, N.; Du, E.Z.; Guo, Z.D.; Vries, W.D. The diurnal cycle of summer tropospheric ozone concentrations across Chinese cities: Spatial patterns and main drivers. Environ. Pollut. 2021, 286, 117547. [Google Scholar] [CrossRef] [PubMed]
  3. Yan, Y.H.; Wang, S.S.; Zhu, J.; Guo, Y.L.; Tang, G.Q.; Liu, B.X.; AN, X.X.; Wang, Y.S.; Zhou, B. Vertically increased NO3 radical in the nocturnal boundary layer. Sci. Total Environ. 2021, 763, 142969. [Google Scholar] [CrossRef]
  4. Lai, H.K.; Hedley, A.J.; Thach, T.Q.; Wong, C.M. A method to derive the relationship between the annual and short-term air quality limits-Analysis using the WHO Air Quality Guidelines for health protection. Environ. Int. 2013, 59, 86–91. [Google Scholar] [CrossRef]
  5. Zong, Z.; Tian, C.; Li, J.; Syed, J.H.; Zhang, W.; Fang, Y.; Jiang, Y.; Nasir, J.; Mansha, M.; Rizvi, S.H.H.; et al. Isotopic Interpretation of Particulate Nitrate in the Metropolitan City of Karachi, Pakistan: Insight into the Oceanic Contribution to NOx. Environ. Sci. Technol. 2020, 54, 7787–7797. [Google Scholar] [CrossRef] [PubMed]
  6. Richter, A.; Burrows, J.P.; Nuss, H.; Granier, C.; Niemeier, U. Increase in tropospheric nitrogen dioxide over China observed from space. Nature 2005, 437, 129–132. [Google Scholar] [CrossRef]
  7. Zhu, Y.J.; Zhan, Y.; Wang, B.; Li, Z.; Qin, Y.Q.; Zhang, K.S. Spatiotemporally mapping of the relationship between NO2 pollution and urbanization for a megacity in Southwest China during 2005–2016. Chemosphere 2019, 220, 155–162. [Google Scholar] [CrossRef]
  8. Lalitaporn, P.; Kurata, G.; Matsuoka, Y.; Thongboonchoo, N.; Surapipith, V. Long-term analysis of NO2, CO, and AOD seasonal variability using satellite observations over Asia and intercomparison with emission inventories and model. Air Qual. Atmos. Health. 2013, 6, 655–672. [Google Scholar] [CrossRef]
  9. Guan, Q.D.; Zuo, X.Q.; Li, S.H. Analysis of Distribution Characteristics and Driving Factors of Nitrogen Dioxide Concentration in China. Geomat. Spat. Inf. Technol. 2021, 44, 85–89+97. [Google Scholar]
  10. Nishanth, T.; Praseed, K.M.; Kumar, M.K.S.; Valsaraj, K.T. Observational Study of Surface O3, NOx, CH4 and Total NMHCs at Kannur, India. Aerosol Air Qual. Res. 2014, 14, 1074–1088. [Google Scholar] [CrossRef]
  11. Gao, J.H.; Zhu, B.; Wang, Y.Z.; Kang, H.Q. Distribution and long-term variation of tropospheric NO2 over China during 2005 to 2013. China Environ. Sci. (Chin. Ed.). 2015, 35, 2307–2318. [Google Scholar]
  12. Yang, G.F.; Li, S.Y.; Li, W.L. Spatial and temporal distribution characteristics of nitrogen dioxide concentration in Chinese cities. Environ. Sci. Technol. 2019, 42, 200–206. [Google Scholar]
  13. Wang, Y.J.; Yaluk, E.A.; Chen, H.; Jiang, S.; Huang, L.; Zhu, A.S.; Xiao, S.L.; Xue, J.; Lu, G.B.; Bian, J.T.; et al. The Importance of NOx Control for Peak Ozone Mitigation Based on a Sensitivity Study Using CMAQ-HDDM-3D Model During a Typical Episode Over the Yangtze River Delta Region, China. J. Geophys. Res. Atmos. 2022, 127, e2022JD036555. [Google Scholar] [CrossRef]
  14. Cheng, N.; Li, Y.; Sun, F.; Chen, C.; Wang, B.; Li, Q.; Wei, P.; Cheng, B. Ground-Level NO2 in Urban Beijing: Trends, Distribution, and Effects of Emission Reduction Measures. Aerosol Air Qual. Res. 2018, 18, 343–356. [Google Scholar] [CrossRef]
  15. Wang, Y.J.; Jiang, S.; Huang, L.; Lu, G.B.; Kasemsan, M.; Yaluk, E.A.; Liu, H.Q.; Liao, J.Q.; Bian, J.T.; Zhang, K.; et al. Differences between VOCs and NOx transport contributions, their impacts on O3, and implications for O3 pollution mitigation based on CMAQ simulation over the Yangtze River Delta, China. Sci. Total Environ. 2023, 872, 162118. [Google Scholar] [CrossRef]
  16. Yu, H.L.; Lin, Y.C.; Kuo, Y.M. A time series analysis of multiple ambient pollutants to investigate the underlying air pollution dynamics and interactions. Chemosphere 2015, 134, 571–580. [Google Scholar] [CrossRef]
  17. Tang, Z.Y.; Xu, J.C.; Zhang, Y.B.; Luo, H.; Yang, X.C. Analysis of Vehicle Exhaust Pollutants and Meteorological Conditions in Xi’an. Meteorol. Environ. Sci. 2020, 43, 70–78. [Google Scholar]
  18. Xiao, B.; Jia, H.W.; Xu, J.J.; Kang, Y.M.; Zhong, K. Effects of land and sea breeze on pollutant diffusion in northern Shanghai. China Environ. Sci. 2022, 42, 1552–1561. [Google Scholar]
  19. Long, Q.; Wang, F.; Wang, C.; Mi, X.Y. Characteristics of sea-land breeze and turbulence intensity on the north shore of Bohai Bay. J. Appl. Oceanogr. 2020, 39, 303–311. [Google Scholar]
  20. Bei, N.; Zhao, L.; Wu, J.; Li, X.; Feng, T.; Li, G. Impacts of sea-land and mountain-valley circulations on the air pollution in Beijing-Tianjin-Hebei (BTH): A case study. Environ. Pollut. 2018, 234, 429–438. [Google Scholar] [CrossRef]
  21. Guo, Y.H.; Wang, Z.F.; Kang, H.; Gu, C.; Wang, G.; Zhang, X.X.; Ji, Y.; Li, M. Impact of automobile vehicles exhaust emissions on metropolitan air quality: Analysis study on the air pollution change before and after the Spring Festival in Urumqi City, China. Acta Sci. Circumstantiae 2014, 34, 1109–1117. [Google Scholar]
  22. Zhang, H.F.; Wang, S.X.; Hao, J.M.; Wang, X.M.; Wang, S.L.; Chai, F.H.; Li, M. Air pollution and control action in Beijing. J. Clean. Prod. 2016, 112, 1519–1527. [Google Scholar] [CrossRef]
  23. Pan, Y.J.; Li, Y.; Chen, J.H.; Shi, J.C.; Tian, H.; Zhang, J.; Zhou, J.; Chen, X.; Liu, Z.; Qian, J. Method for High-resolution Emission Inventory for Road Vehicles in Chengdu Based on Traffic Flow Monitoring Data. Environ. Sci. 2020, 41, 3581–3590. [Google Scholar]
  24. OPCPC-CSES. Blue Book on the Prevention and Control of Ozone Pollution in China; Science publishing Company: Beijing, China, 2023. [Google Scholar]
  25. MEE. China Ecological Environment Status Bulletin; China Ministry of Ecology and Environment: Beijing, China, 2023. [Google Scholar]
  26. Li, Y.; Shi, G.; Chen, Z. Spatial and temporal distribution characteristics of ground-level nitrogen dioxide and ozone across China during 2015–2020. Environ. Res. Lett. 2021, 16, 124031. [Google Scholar] [CrossRef]
  27. Xu, H. Temporal and spatial distribution characteristics and pollution sources of NO2 pollution in Yangtze River Delta. Master’s Thesis, Anhui University, Anhui, China, 2021. [Google Scholar]
  28. Li, H.; Zhang, J.; Wen, B.; Huang, S.; Gao, S.; Li, H.; Zhao, Z.; Zhang, Y.; Fu, G.; Bai, J.; et al. Spatial-Temporal Distribution and Variation of NO2 and Its Sources and Chemical Sinks in Shanxi Province, China. Atmosphere 2022, 13, 1096. [Google Scholar] [CrossRef]
  29. MEE. China Ecological Environment Status Bulletin; China Ministry of Ecology and Environment: Beijing, China, 2022. [Google Scholar]
  30. Wang, N.N.; Zhu, C.Y.; Li, W.; Qiu, M.Y.; Wang, B.L.; Li, X.Y.; Jiang, B.D.; Qu, X.Y.; Li, Z.S.; Cheng, H.C. Air quality improvement assessment and exposure risk of Shandong Province in China during 2014 to 2020. Int. J. Environ. Sci. Technol. 2023, 20, 9495–9504. [Google Scholar] [CrossRef]
  31. Xing, H.; Zhu, L.; Chen, B.; Niu, J.; Li, X.; Feng, Y.; Fang, W. Spatial and temporal changes analysis of air quality before and after the COVID-19 in Shandong Province, China. Earth Sci. Inform. 2022, 15, 863–876. [Google Scholar] [CrossRef]
  32. Wu, L. Volatile Organic Compound Emissions from the Oilfield in the Yellow River Delta Region, Northern China and Their Impact on Regional Ozone Pollution. Master’s Thesis, Shandong University, Jinan, China, 2019. [Google Scholar]
  33. Fan, X.Y.; Lian, L.S.; Wang, M. Characteristics of air pollution and its relationship with meteorological factors in Bohai Rim urban agglomerations. J. Atmos. Environ. Opt. 2022, 17, 506–520. [Google Scholar]
  34. World Health Organization. WHO Global Air Quality Guidelines: Particulate Matter (PM2.5 and PM10). In Ozone, Nitrogen Dioxide, Sulfur Dioxide Carbon Monoxide; World Health Organization: Geneva, Switzerland, 2021; Volume 1302. [Google Scholar]
  35. Wei, Z.Z.; Huuang, B.Z.; Jiang, Y.D.; Guo, Y.; Wang, M. Comparative analysis of air quality evaluation by arithmetic method, percentile method and moving average method and the information it reveals. Environ. Sustain. Dev. 2020, 45, 123–133. [Google Scholar]
  36. Huang, L.; Liu, D.; Cai, D.J.; Chen, S.J.; Dong, H.; Lin, G.Z.; Wang, B.G.; Yang, J. Health risk assessment of exposure to multiple pollutants in Guangzhou. China Environ. Sci. (Chin. Ed.). 2022, 42, 5418–5426. [Google Scholar]
  37. Thomas, M.A.; Devasthale, A. Typical meteorological conditions associated with extreme nitrogen dioxide (NO2) pollution events over Scandinavia. Atmos. Chem. Phys. 2017, 17, 12071–12080. [Google Scholar] [CrossRef]
  38. Wangberg, I.; Etzkorn, T.; Barnes, I.; Platt, U.; Becker, K.H. Absolute determination of the temperature behavior of the NO2 + NO3 + (M)↔N2O5 + (M) equilibrium. J. Phys. Chem. A. 1997, 101, 9694–9698. [Google Scholar] [CrossRef]
  39. Zhao, D.; Xin, J.; Wang, W.; Jia, D.; Wang, Z.; Xiao, H.; Liu, C.; Zhou, J.; Tong, L.; Ma, Y.; et al. Effects of the sea-land breeze on coastal ozone pollution in the Yangtze River Delta, China. Sci. Total Environ. 2022, 807, 150306. [Google Scholar] [CrossRef] [PubMed]
  40. Chen, Y.; Yang, C.; Xu, L.; Fan, X.; Shi, J.; Zheng, R.; Hong, Y.; Li, M.; Liu, T.; Chen, G.; et al. Variations of chemical composition of NR-PM1 under the influence of sea land breeze in a coastal city of Southeast China. Atmos. Res. 2023, 285, 106626. [Google Scholar] [CrossRef]
  41. Breiman, L. Random Forests. Mach. Learn. 2001, 45, 5–32. [Google Scholar] [CrossRef]
  42. Lam, K.-L.; Cheng, W.-Y.; Su, Y.; Li, X.; Wu, X.; Wong, K.-H.; Kwan, H.-S.; Cheung, P.C.-K. Use of random forest analysis to quantify the importance of the structural characteristics of beta-glucans for prebiotic development. Food Hydrocoll. 2020, 108, 106001. [Google Scholar] [CrossRef]
  43. Xu, J.; Huang, X.; Wang, N.; Li, Y.; Ding, A. Understanding ozone pollution in the Yangtze River Delta of eastern China from the perspective of diurnal cycles. Sci. Total Environ. 2021, 752, 141928. [Google Scholar] [CrossRef]
  44. Bentéjac, C.; Csörgő, A.; Martínez-Muñoz, G. A comparative analysis of gradient boosting algorithms. Artif. Intell. Rev. 2021, 54, 1937–1967. [Google Scholar] [CrossRef]
  45. Ma, X.F.; Wang, Y.; Yan, S.M.; Feng, F. Transport Characteristics and Potential Source Areas of PM2.5 in Yangquan City Under Different Pollution Levels. Environ. Sci. 2024, 45, 3858–3869. [Google Scholar]
  46. Begum, B.A.; Kim, E.; Jeong, C.H.; Lee, D.W.; Hopke, P.K. Evaluation of the potential source contribution function using the 2002 Quebec forest fire episode. Atmos. Environ. 2005, 39, 3719–3724. [Google Scholar] [CrossRef]
  47. Hsu, Y.K.; Holsen, T.M.; Hopke, P.K. Comparison of hybrid receptor models to locate PCB sources in Chicago. Atmos. Environ. 2003, 37, 545–562. [Google Scholar] [CrossRef]
  48. Wang, Z.F.; Liu, W.; Fu, H.X.; Meng, H. Characteristics of Ozone and its Relationship with Meteorological Factors during 2014-2021 in Jinan and Qingdao, China. Res. Environ. Sci. 2023, 36, 673–683. [Google Scholar]
  49. Xiao, K.; Wang, Y.; Wu, G.; Fu, B.; Zhu, Y. Spatiotemporal Characteristics of Air Pollutants (PM10, PM2.5, SO2, NO2, O3, and CO) in the Inland Basin City of Chengdu, Southwest China. Atmosphere 2018, 9, 74. [Google Scholar] [CrossRef]
  50. Cai, K.; Li, S.S.; Zheng, F.B.; Yu, C.; Zhang, X.Y.; Liu, Y.; Li, Y.J. Spatio-temporal Variations in NO2 and PM2.5 over the Central Plains Economic Region of China during 2005-2015 Based on Satellite Observations. Aerosol Air Qual. Res. 2018, 18, 1221–1235. [Google Scholar] [CrossRef]
  51. Shareef, M.M.; Husain, T.; Alharbi, B. Analysis of Relationship between O3, NO, and NO2 in Riyadh, Saudi Arabia. Asian J. Atmos. Environ. 2018, 12, 17–29. [Google Scholar] [CrossRef]
  52. Notario, A.; Bravo, I.; Adame, J.A.; Díaz-de-Mera, Y.; Aranda, A.; Rodríguez, A.; Rodríguez, D. Analysis of NO, NO2, NOx, O3 and oxidant (OX = O3 + NO2) levels measured in a metropolitan area in the southwest of Iberian Peninsula. Atmos. Res. 2012, 104, 217–226. [Google Scholar] [CrossRef]
  53. An, C.; Yan, Y.X.; Gao, X.S.; Yan, X.Y.; Ji, Y.Y.; Shang, F.Y.; Li, J.D.; Tan, L.Y.; Gao, R.; Bi, F.; et al. A Comparative Investigation of the Characteristics of Nocturnal Ozone Enhancement Events and Their Effects on Ground-Level Ozone and PM2.5 in the Central City of the Yellow River Delta, China, in 2022 and 2023. Atmosphere 2024, 15, 475. [Google Scholar] [CrossRef]
  54. Gao, X.R.; Deng, X.J.; Tan, H.B.; Wang, C.L.; Wang, N.; Yue, D.L. Characteristics and analysis on regional pollution process and circulation weather types over Guangdong Province. Acta Sci. Circumstantiae 2018, 38, 1708–1716. [Google Scholar]
  55. Zheng, S.C.; Jiang, F.; Feng, S.Z.; Liu, H.; Wang, X.Y.; Tian, X.D.; Ying, C.Y.; Jia, M.W.; Shen, Y.; Lyu, X.P.; et al. Impact of Marine Shipping Emissions on Ozone Pollution During the Warm Seasons in China. J. Geophys. Res. Atmos. 2024, 12, e2024JD040864. [Google Scholar] [CrossRef]
  56. Luo, Z.Y.; Lv, Z.F.; Zhao, J.C.; Sun, H.T.; He, T.K.; Yi, W.; Zhang, Z.N.; He, K.B.; Liu, H. Shipping-related pollution decreased but mortality increased in Chinese port cities. Nat. Cities. 2024, 1, 295–304. [Google Scholar] [CrossRef]
  57. Huang, Y.X.; Guo, B.; Sun, H.X.; Liu, H.J.; Chen, S.X. Relative importance of meteorological variables on air quality and role of boundary layer height. Atmos. Environ. 2021, 267, 118737. [Google Scholar] [CrossRef]
  58. Deng, Y.Y.; Li, J.; Li, Y.Q.; Wu, R.R.; Xie, S.D. Characteristics of volatile organic compounds, NO2, and effects on ozone formation at a site with high ozone level in Chengdu. J. Environ. Sci. 2019, 75, 334–345. [Google Scholar] [CrossRef] [PubMed]
  59. Li, A.; Zhang, J.; Xie, P.H.; Hu, Z.K.; Xu, J.; Mou, F.S.; Wu, F.C.; Liu, J.G.; Liu, W.Q. Variation of temporal and spatial patterns of NO2 in Beijing using OMI and mobile DOAS. Sci. China Chem. 2015, 58, 1367–1376. [Google Scholar] [CrossRef]
  60. Ling, A.P. Correlation Analysis between Concentrations of SO2, NO2, CO and Meteorological Conditions in Ya’an. Geogr. Sci. Res. 2019, 8, 341–350. [Google Scholar]
  61. Yang, Y.; Wang, K.; Cui, C.; Liu, Y.H.; Huang, L.K. Analysis of relationship between air pollution and meteorological conditions of Harbin. Chin. J. Environ. Eng. 2015, 9, 5945–5950. [Google Scholar]
  62. Wang, Q.; Han, J.D.; Sun, Y.; Luo, J.H.; Sun, S.J.; Li, X.L.; Qi, T.Y. Spatio-temporal characteristics and source apportionment of NO2 in Handan. Environ. Chem. 2025, 44, 234–242. [Google Scholar]
  63. Wang, S.; Nie, S.S.; Feng, Y.P.; Cui, J.S.; Chen, J.; Liu, D.X.; Shi, W.Y. Spatio-Temporal Evolution Characteristics and Source Apportionment of and N in Shijiazhuang. Environ. Sci. 2021, 42, 2679–2690. [Google Scholar]
  64. Wang, M.Y.; Ding, H.; Xu, R.; Liu, Y.H. The correlation factors of the change of ambient air NO2 concentration: An analysis based on improved Apriori algorithm. J. Trop. Meteorol. 2022, 38, 890–900. [Google Scholar]
  65. Khoder, M.I. Atmospheric conversion of sulfur dioxide to particulate sulfate and nitrogen dioxide to particulate nitrate and gaseous nitric acid in an urban area. Chemosphere 2002, 49, 675–684. [Google Scholar] [CrossRef]
  66. Zheng, C.W.; Zhao, C.F.; Li, Y.P.; Wu, X.L.; Zhang, K.Y.; Gao, J.; Qiao, Q.; Ren, Y.Z.; Zhang, X.; Chai, F.H. Spatial and temporal distribution of NO2 and SO2 in Inner Mongolia urban agglomeration obtained from satellite remote sensing and ground observations. Atmos. Environ. 2018, 188, 50–59. [Google Scholar] [CrossRef]
  67. Zhang, L.S.; Lee, C.S.; Zhang, R.Q.; Chen, L.F. Spatial and temporal evaluation of long term trend (2005–2014) of OMI retrieved NO2 and SO2 concentration in Henan Province, China. Atmos. Environ. 2017, 154, 151–166. [Google Scholar] [CrossRef]
  68. Warneke, C.; De Gouw, J.A.; Goldan, P.D.; Kuster, W.C.; Williams, E.J.; Lerner, B.M.; Jakoubek, R.; Brown, S.S.; Stark, H.; Aldener, M.; et al. Comparison of daytime and nighttime oxidation of biogenic and anthropogenic VOCs along the New England coast in summer during New England Air Quality Study 2002. J. Geophys. Res.-Atmos. 2004, 109, D10309. [Google Scholar] [CrossRef]
  69. Salisbury, G.; Rickard, A.R.; Monks, P.S.; Allan, B.J.; Bauguitte, S.; Penkett, S.A.; Carslaw, N.; Lewis, A.C.; Creasey, D.J.; Heard, D.E.; et al. Production of peroxy radicals at night via reactions of ozone and the nitrate radical in the marine boundary layer. J. Geophys. Res.-Atmos. 2001, 106, 12669–12687. [Google Scholar] [CrossRef]
  70. Zhang, Y.; Xue, L.; Carter, W.P.L.; Pei, C.; Chen, T.; Mu, J.; Wang, Y.; Zhang, Q.; Wang, W. Development of ozone reactivity scales for volatile organic compounds in a Chinese megacity. Atmos. Chem. Phys. 2021, 21, 11053–11068. [Google Scholar] [CrossRef]
  71. Wang, Z.J.; Huo, J.; Du, H.Y.; Wang, D.W.; Li, J.; Zhang, C.B.; Zhang, T.; Wang, W.; Wang, H.B.; Yang, W.Y. Long term characteristics and potential sources of PM2.5 in Rizhao City from 2015 to 2019. China Environ. Sci. (Chin. Ed.) 2021, 41, 3969–3980. [Google Scholar]
  72. Cheng, M.M.; Jiang, H.; Guo, Z. Evaluation of long-term tropospheric NO2 columns and the effect of different ecosystem in Yangtze River Delta. Procedia Environ. Sci. 2012, 13, 1045–1056. [Google Scholar] [CrossRef]
  73. MEP. Ambient Air Quality Standards (GB 3095-2012); China Environmental Science Press: Beijing, China, 2012. [Google Scholar]
  74. MEP. Technical Regulation on Ambient Air Quality Index (on Trial) (HJ 633-2012); China Environmental Science Press: Beijing, China, 2012. [Google Scholar]
  75. MEP. Technical Regulation for Ambient Air Quality Assessment (on Trial) (HJ 663-2013); China Environmental Science Press: Beijing, China, 2013. [Google Scholar]
  76. Huth, R. A circulation classification scheme applicable in GCM studies. Theor. Appl. Climatol. 2000, 67, 1–18. [Google Scholar] [CrossRef]
  77. Tang, G.Q.; LI, X.; Wang, X.K.; Xin, J.Y.; Hu, B.; Wang, L.L.; Ren, Y.F.; Wang, Y.S. Effects of Synoptic Type on Surface Ozone Pollution in Beijing. Environ. Sci. 2010, 31, 573–578. [Google Scholar]
  78. Liu, Y.; Li, Y.h.; Hou, X.G.; Ma, W. Research on Density and Diffusion Trajectory of NO2 during Heavy Pollution Period in Urumqi. Environ. Sci. Technol. 2017, 40, 33–39. [Google Scholar]
  79. Li, Y.J.; An, X.Q.; Fan, G.Z. Transport pathway and potential source area of atmospheric particulates in Beijing. China Environ. Sci. 2019, 39, 915–927. [Google Scholar]
  80. Wang, Y.; Chai, F.H.; Wang, Y.H.; Liu, M. Transport Characteristics of Air Pollutants over the Yangtze Delta. Environ. Sci. 2008, 29, 1430–1435. [Google Scholar]
  81. Wang, Y.Q.; Zhang, X.Y.; Draxler, R.R. TrajStat: GIS-based software that uses various trajectory statistical analysis methods to identify potential sources from long-term air pollution measurement data. Environ. Model. Softw. 2009, 24, 938–939. [Google Scholar] [CrossRef]
  82. Wang, Z.F.; Zhang, W.J.; Li, M.; Lv, B.; Fu, H.X.; Sun, F.J.; Lv, C.; Bian, M. Analysis of Heavy Air Pollution Episode with Combined Sand Storm and High PM2.5 Occurred in Jinan in 2018. Res. Environ. Sci. 2021, 34, 2588–2598. [Google Scholar]
  83. Liu, N.; Yu, Y.; He, J.J.; Zhao, S.P. Analysis of Air Pollutant Transport in Winter in Lanzhou. Res. Environ. Sci. 2015, 28, 509–516. [Google Scholar]
  84. Kulshrestha, U.C.; Raman, R.S.; Kulshrestha, M.J.; Rao, T.N.; Hazarika, P.J. Secondary aerosol formation and identification of regional source locations by PSCF analysis in the Indo-Gangetic region of India. J. Atmos. Chem. 2009, 63, 33–47. [Google Scholar] [CrossRef]
  85. Hong, Q.Q.; Liu, C.; Hu, Q.H.; Xing, C.Z.; Tan, W.; Liu, H.R.; Huang, Y.; Zhu, Y.; Zhang, J.S.; Geng, T.Z.; et al. Evolution of the vertical structure of air pollutants during winter heavy pollution episodes: The role of regional transport and potential sources. Atmos. Res. 2019, 228, 206–222. [Google Scholar] [CrossRef]
  86. Xu, X.; Akhtar, U.S. Identification of potential regional sources of atmospheric total gaseous mercury in Windsor, Ontario, Canada using hybrid receptor modeling. Atmos. Chem. Phys. 2010, 10, 7073–7083. [Google Scholar] [CrossRef]
Figure 1. Geographical location of Dongying (a), and diagram of observation sites (b).
Toxics 13 00208 g001
Figure 2. Variations in different percentiles and the annual mean values of the daily average NO2 concentrations in Dongying from 2017 to 2023.
Toxics 13 00208 g002
Figure 3. Monthly variation in the daily average NO2 concentrations in Dongying from 2017 to 2023.
Toxics 13 00208 g003
Figure 4. NO2 concentrations calendar in Dongying from 2017 to 2023.
Toxics 13 00208 g004
Figure 5. Diurnal variation of NO2 concentrations in Dongying from 2017 to 2023. (“Year-N” represents the NO2 concentration during non-high NO2 concentrations periods of a specific year, “Year-Y” represents the NO2 concentration during high NO2 concentrations periods of a specific year, and “Year-A” represents the annual mean NO2 concentration of a specific year).
Toxics 13 00208 g005
Figure 6. Interannual variation of NO2 concentrations in different regions of Dongying from 2017 to 2023. (“Year-N” represents the NO2 concentration during non-high NO2 concentrations periods of a specific year, “Year-Y” represents the NO2 concentration during high NO2 concentrations periods of a specific year, and “Year-A” represents the annual mean NO2 concentration of a specific year. Blank sections indicate non-operational monitoring sites or missing data).
Toxics 13 00208 g006
Figure 7. Distribution of air pollution levels corresponding to NO2 daily average concentration ranges in Dongying from 2017 to 2023.
Toxics 13 00208 g007
Figure 8. Differences in the concentrations of O3, PM2.5 and PM2.5-bounded secondary components during nighttime to morning rush hours between NO2-HH events and NO2-NHH periods in Dongying in 2022.
Toxics 13 00208 g008
Figure 9. Differences in the concentrations of OX and N2O5, and values of NOR and SOR during nighttime to morning rush hours between NO2-HH events and NO2-NHH periods in Dongying in 2022.
Toxics 13 00208 g009
Figure 10. Differences in the concentrations of O3, PM2.5 and PM2.5-bounded secondary components on the same day between NO2-HD days and NO2-NHD days in Dongying in 2022.
Toxics 13 00208 g010
Figure 11. Differences in the concentrations of OX, and values of NOR and SOR on the same day between NO2-HD days and NO2-NHD days in Dongying in 2022.
Toxics 13 00208 g011
Figure 12. Frequencies and percentages of different synoptic patterns corresponding to NO2 daily average concentration ranges in Dongying from 2017 to 2022.
Toxics 13 00208 g012
Figure 13. The monthly (a) and daily (b) variation in NO2 concentrations on land–sea breeze and non-land–sea breeze days in Dongying in 2022.
Toxics 13 00208 g013
Figure 14. Variation of NO2 concentrations with T, RH, WS, and WD in Dongying from 2017 to 2022.
Toxics 13 00208 g014
Figure 15. The correlation between NO2 and meteorological factors (a), and the importance share of each factor (b) on days with NO2-HH events and NO2-NHH periods in each season of Dongying in 2022.
Toxics 13 00208 g015
Figure 16. Differences in concentrations of different types of VOCs and related pollutants during nighttime to morning rush hours between NO2-HH events and NO2-NHH periods in Dongying in 2022.
Toxics 13 00208 g016
Figure 17. Diurnal variations in different air pollutants on days with NO2-HH events (a) and NO2-NHH periods (b) in Dongying in 2022.
Toxics 13 00208 g017
Figure 18. The importance share of each pollutant’s influence on NO2 concentrations on days with NO2-HH events and NO2-NHH periods in each season of Dongying in 2022.
Toxics 13 00208 g018
Figure 19. Differences in emissions and percentages of NOx from different industry between NO2-HD days and NO2-NHD days for each season in Dongying in 2022.
Toxics 13 00208 g019
Figure 20. Cluster analysis of backward trajectories in Dongying in 2022. (The bar chart represents the average NO2 concentration (μg/m3) corresponding to each type of trajectory, and the pie chart represents the percentage contribution of NO2 concentration corresponding to each type of trajectory).
Toxics 13 00208 g020
Figure 21. Distribution of WPSCF and WCWT in Dongying in 2022 (The black dot represents Dongying Atmospheric Observatory).
Toxics 13 00208 g021
Table 1. Frequency and major characteristics of nine synoptic patterns of the 925-hPa geopotential height field in Dongying from 2017 to 2022.
Synoptic PatternFrequencyMajor Characteristics
Type120.5%Dongying near the offshore high-pressure rear, with dominant southeasterly wind, Tmax-mean of 21.8 °C, RH-mean of 56.6%, and Pre-mean of 1.4 mm.
Type214.1%High-pressure center over the Mongolian Plateau. Dongying under the front of the high-pressure, with dominant southeasterly wind, Tmax-mean of 10.4 °C, RH-mean of 53.9%, and Pre-mean of 0.8 mm.
Type312.1%High-pressure center over the North China Plain. Dongying inside the high-pressure, with dominant easterly wind, Tmax-mean of 16.9 °C, RH-mean of 64.0%, and Pre-mean of 1.4 mm.
Type416.6%High-pressure center over the North China Plain. Dongying under the top-front of the high-pressure, with dominant southwesterly wind, Tmax-mean of 14.5 °C, RH-mean of 57.0%, and Pre-mean of 0.9 mm.
Type56.7%Dongying under the control of a weak pressure field with sparse isobars and stable synoptic condition, with dominant southerly wind, Tmax-mean of 17.3 °C, RH-mean of 64.0%, and Pre-mean of 1.9 mm.
Type68.4%Dongying between a high- and low-pressure systems with dense isobars, with dominant southeasterly and southwesterly winds, Tmax-mean of 19.2 °C, RH-mean of 56.8%, and Pre-mean of 0.6 mm.
Type79.5%Dongying in the northwest of the western Pacific subtropical high, with dominant southeasterly wind, Tmax-mean of 29.2 °C, RH-mean of 72.4%, and Pre-mean of 8.0 mm.
Type87.6%Dongying near the inverted trough, with dominant southeasterly wind, Tmax-mean of 25.8 °C, RH-mean of 73.2%, and Pre-mean of 6.6 mm.
Type94.4%Dongying inside the low-pressure field, with dominant southeasterly wind, Tmax-mean of 29.3 °C, RH-mean of 69.1%, and Pre-mean of 2.1 mm.
Notes: Tmax-mean refers to the daily average maximum temperature; RH-mean refers to the daily average relative humidity; and Pre-mean refers to the daily average precipitation.
Disclaimer/Publisher’s Note: The statements, opinions and data contained in all publications are solely those of the individual author(s) and contributor(s) and not of MDPI and/or the editor(s). MDPI and/or the editor(s) disclaim responsibility for any injury to people or property resulting from any ideas, methods, instructions or products referred to in the content.

