
Urban Air Quality Shifts in China: Application of Additive Model and Transfer Learning to Major Cities


Abstract
:1. Introduction
2. Study Area and Datasets
2.1. Study Area
2.2. Datasets
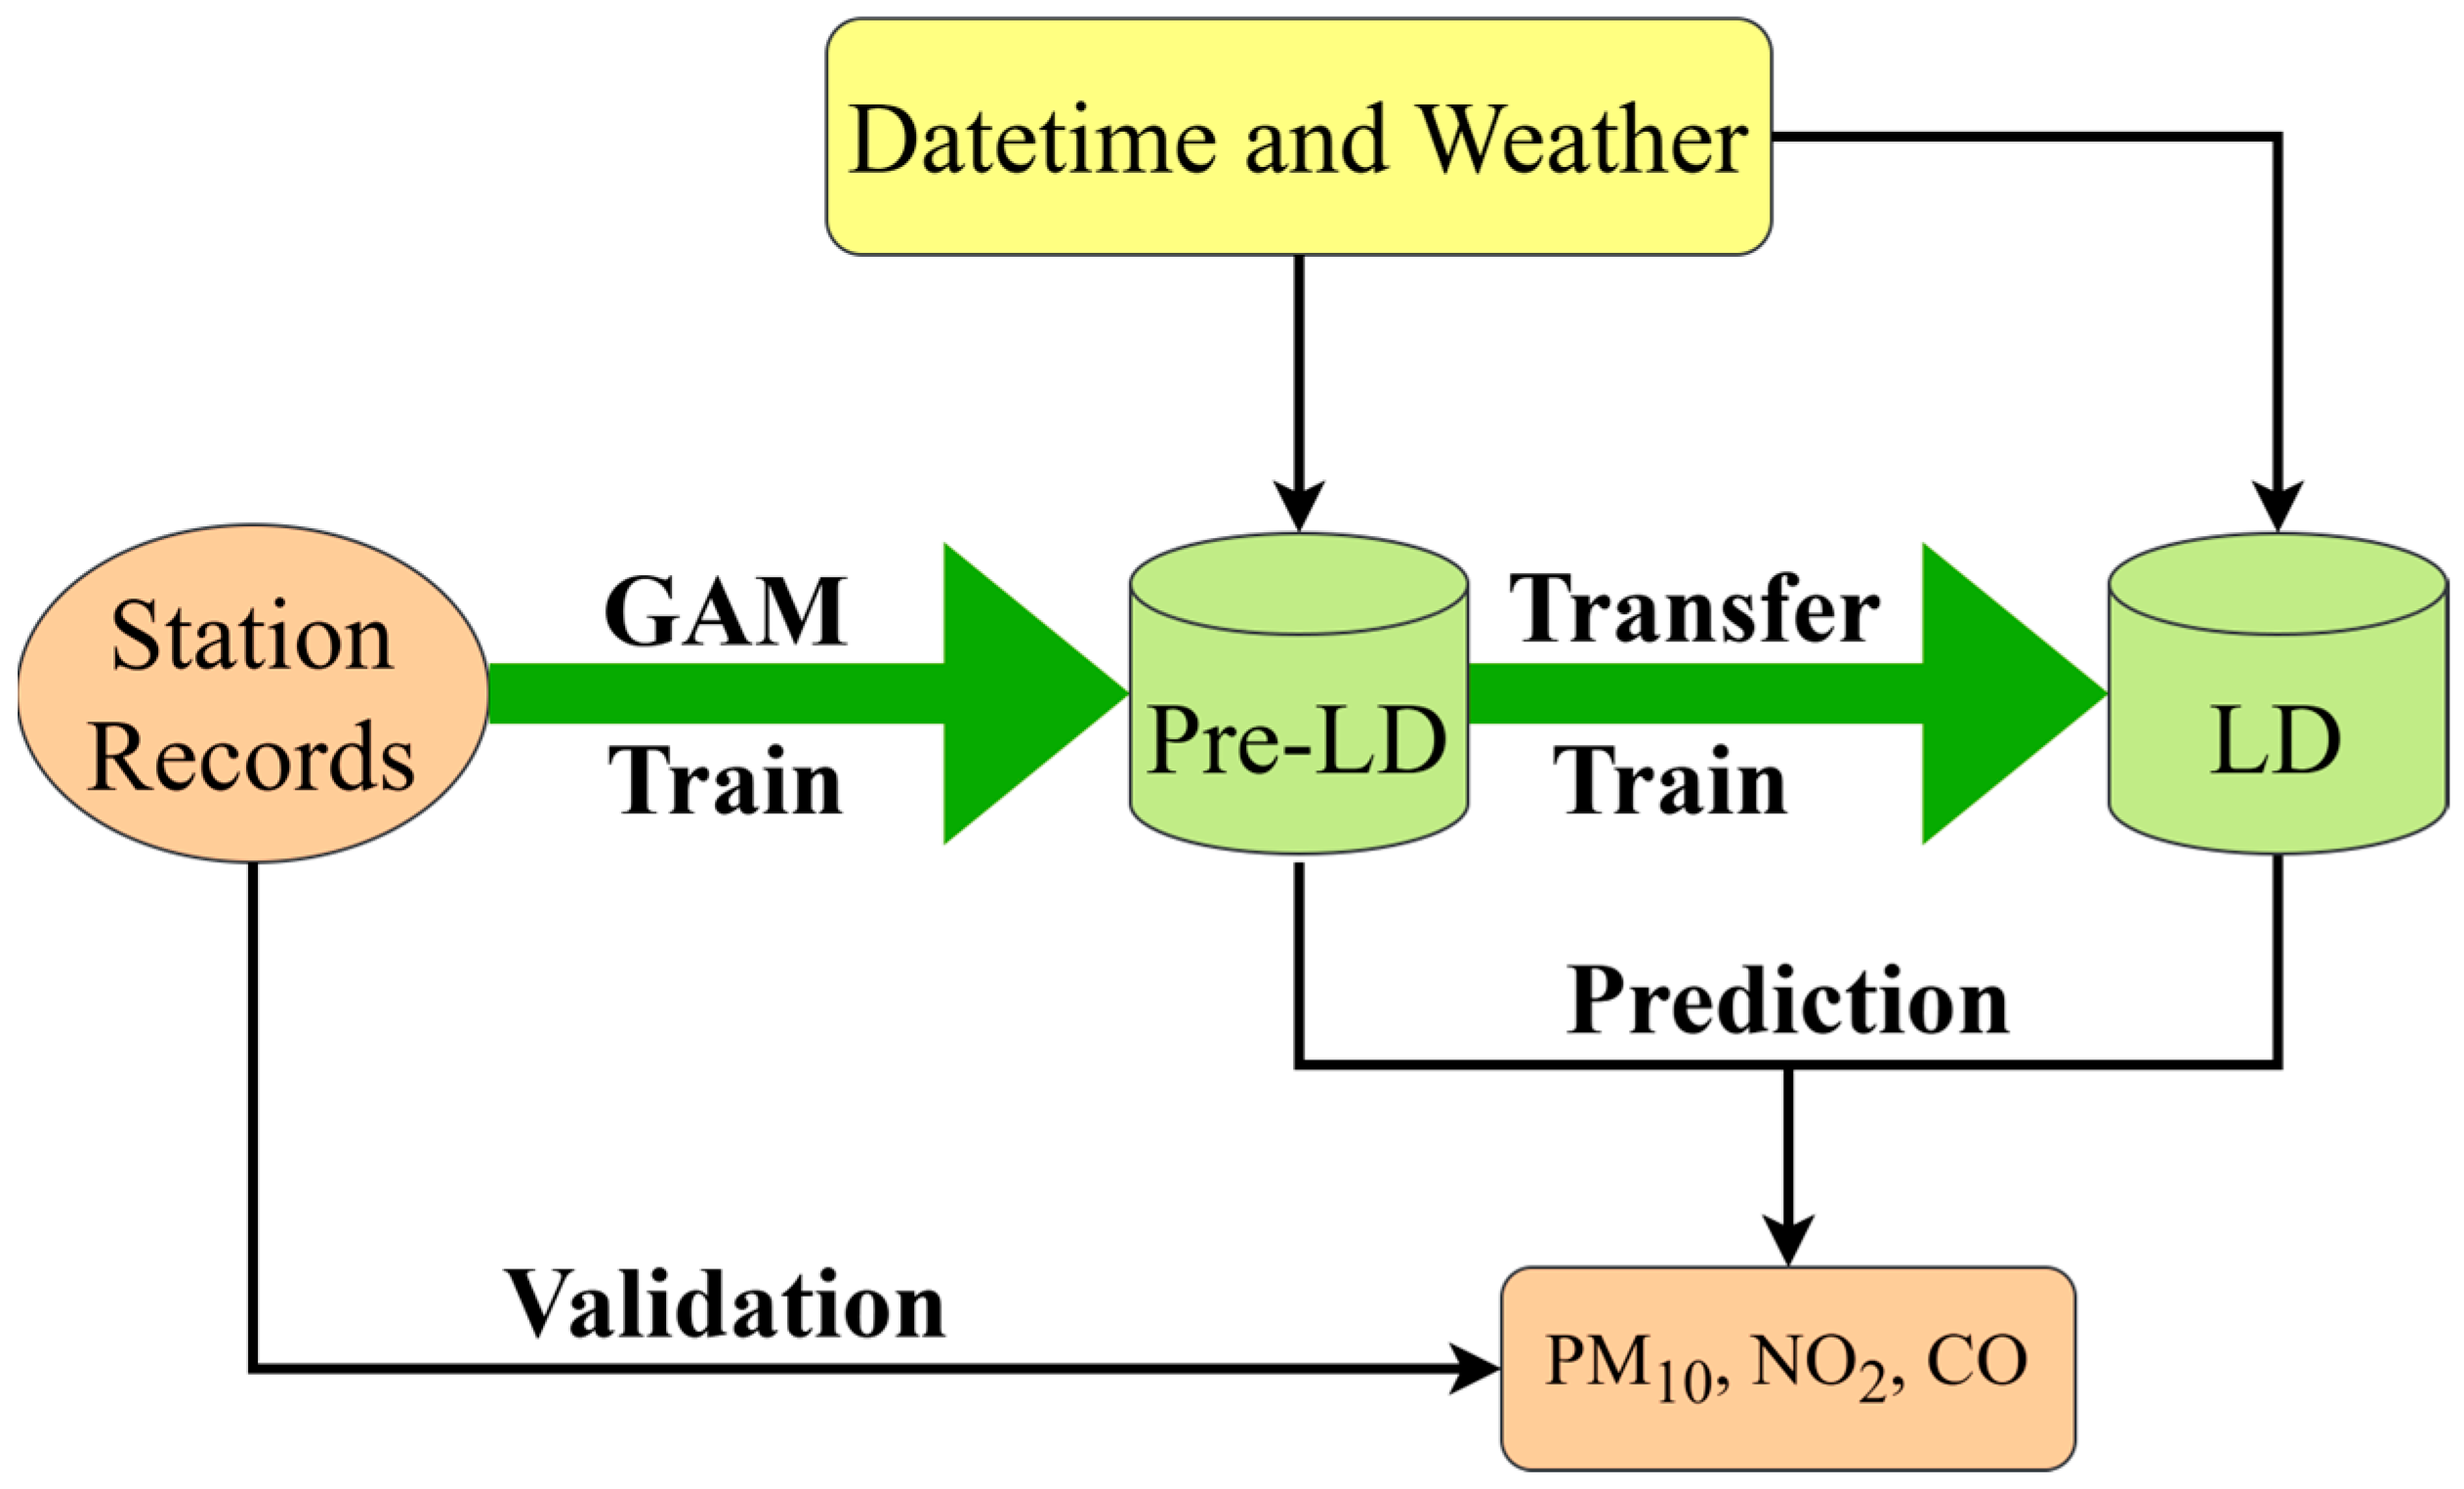
3. Methods
3.1. Pre-LD Model
3.2. LD Model
4. Results and Discussion
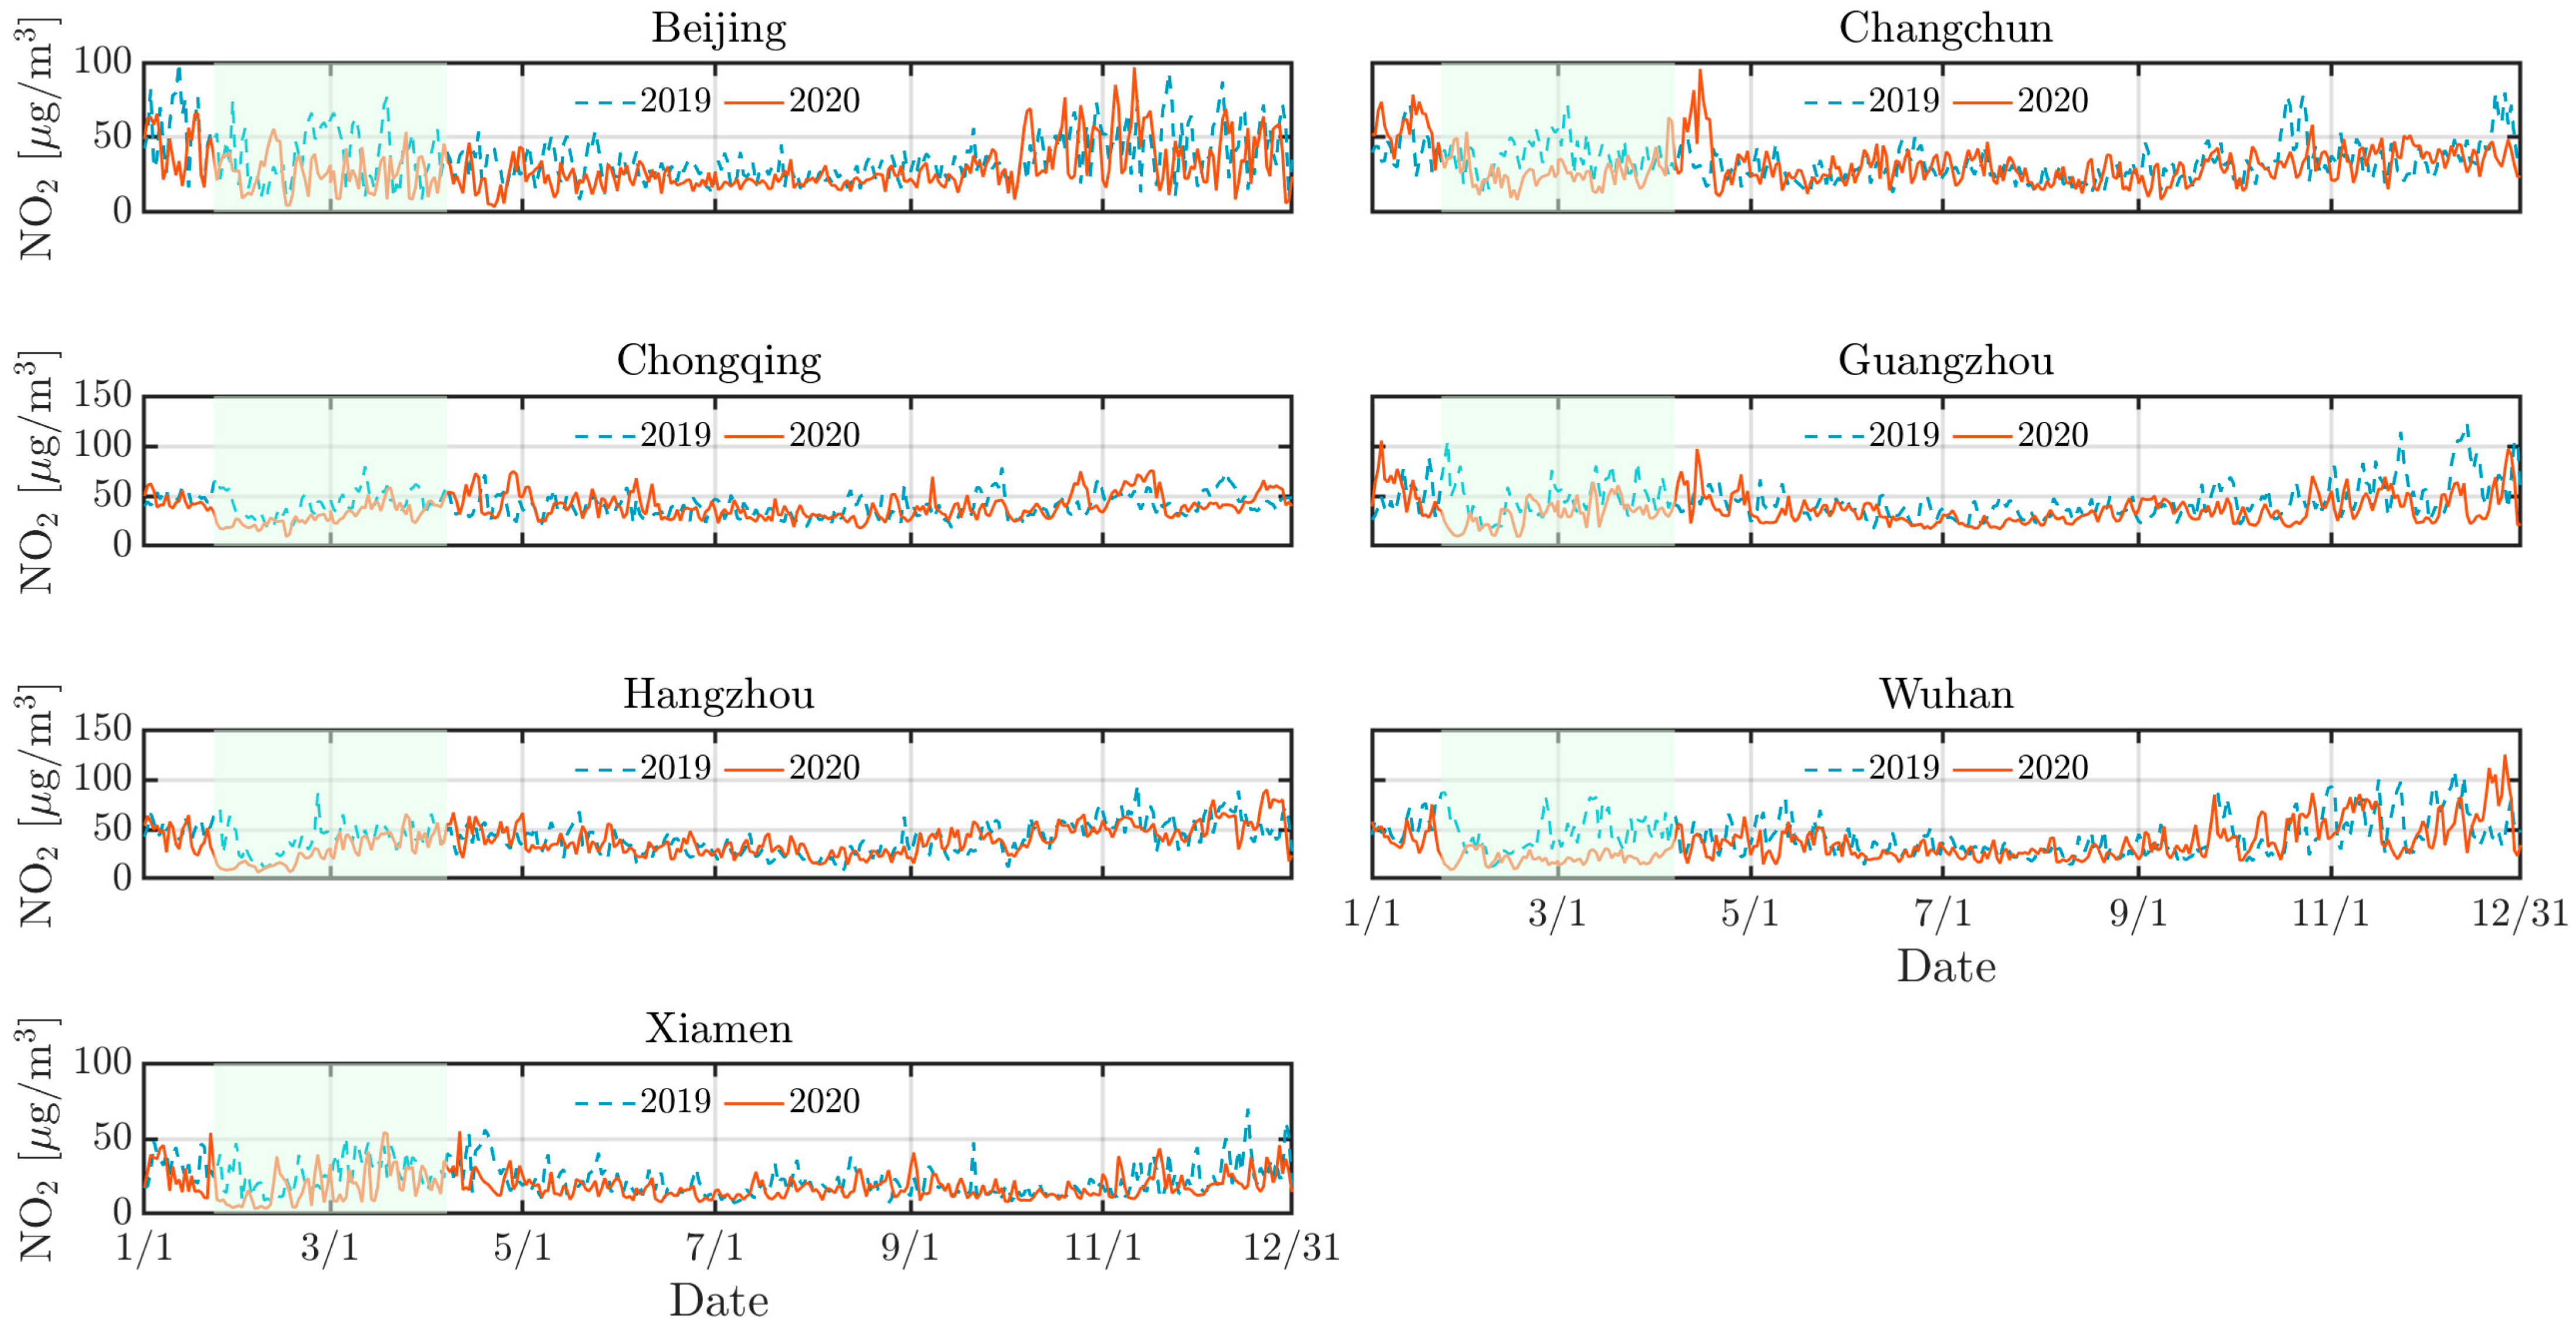
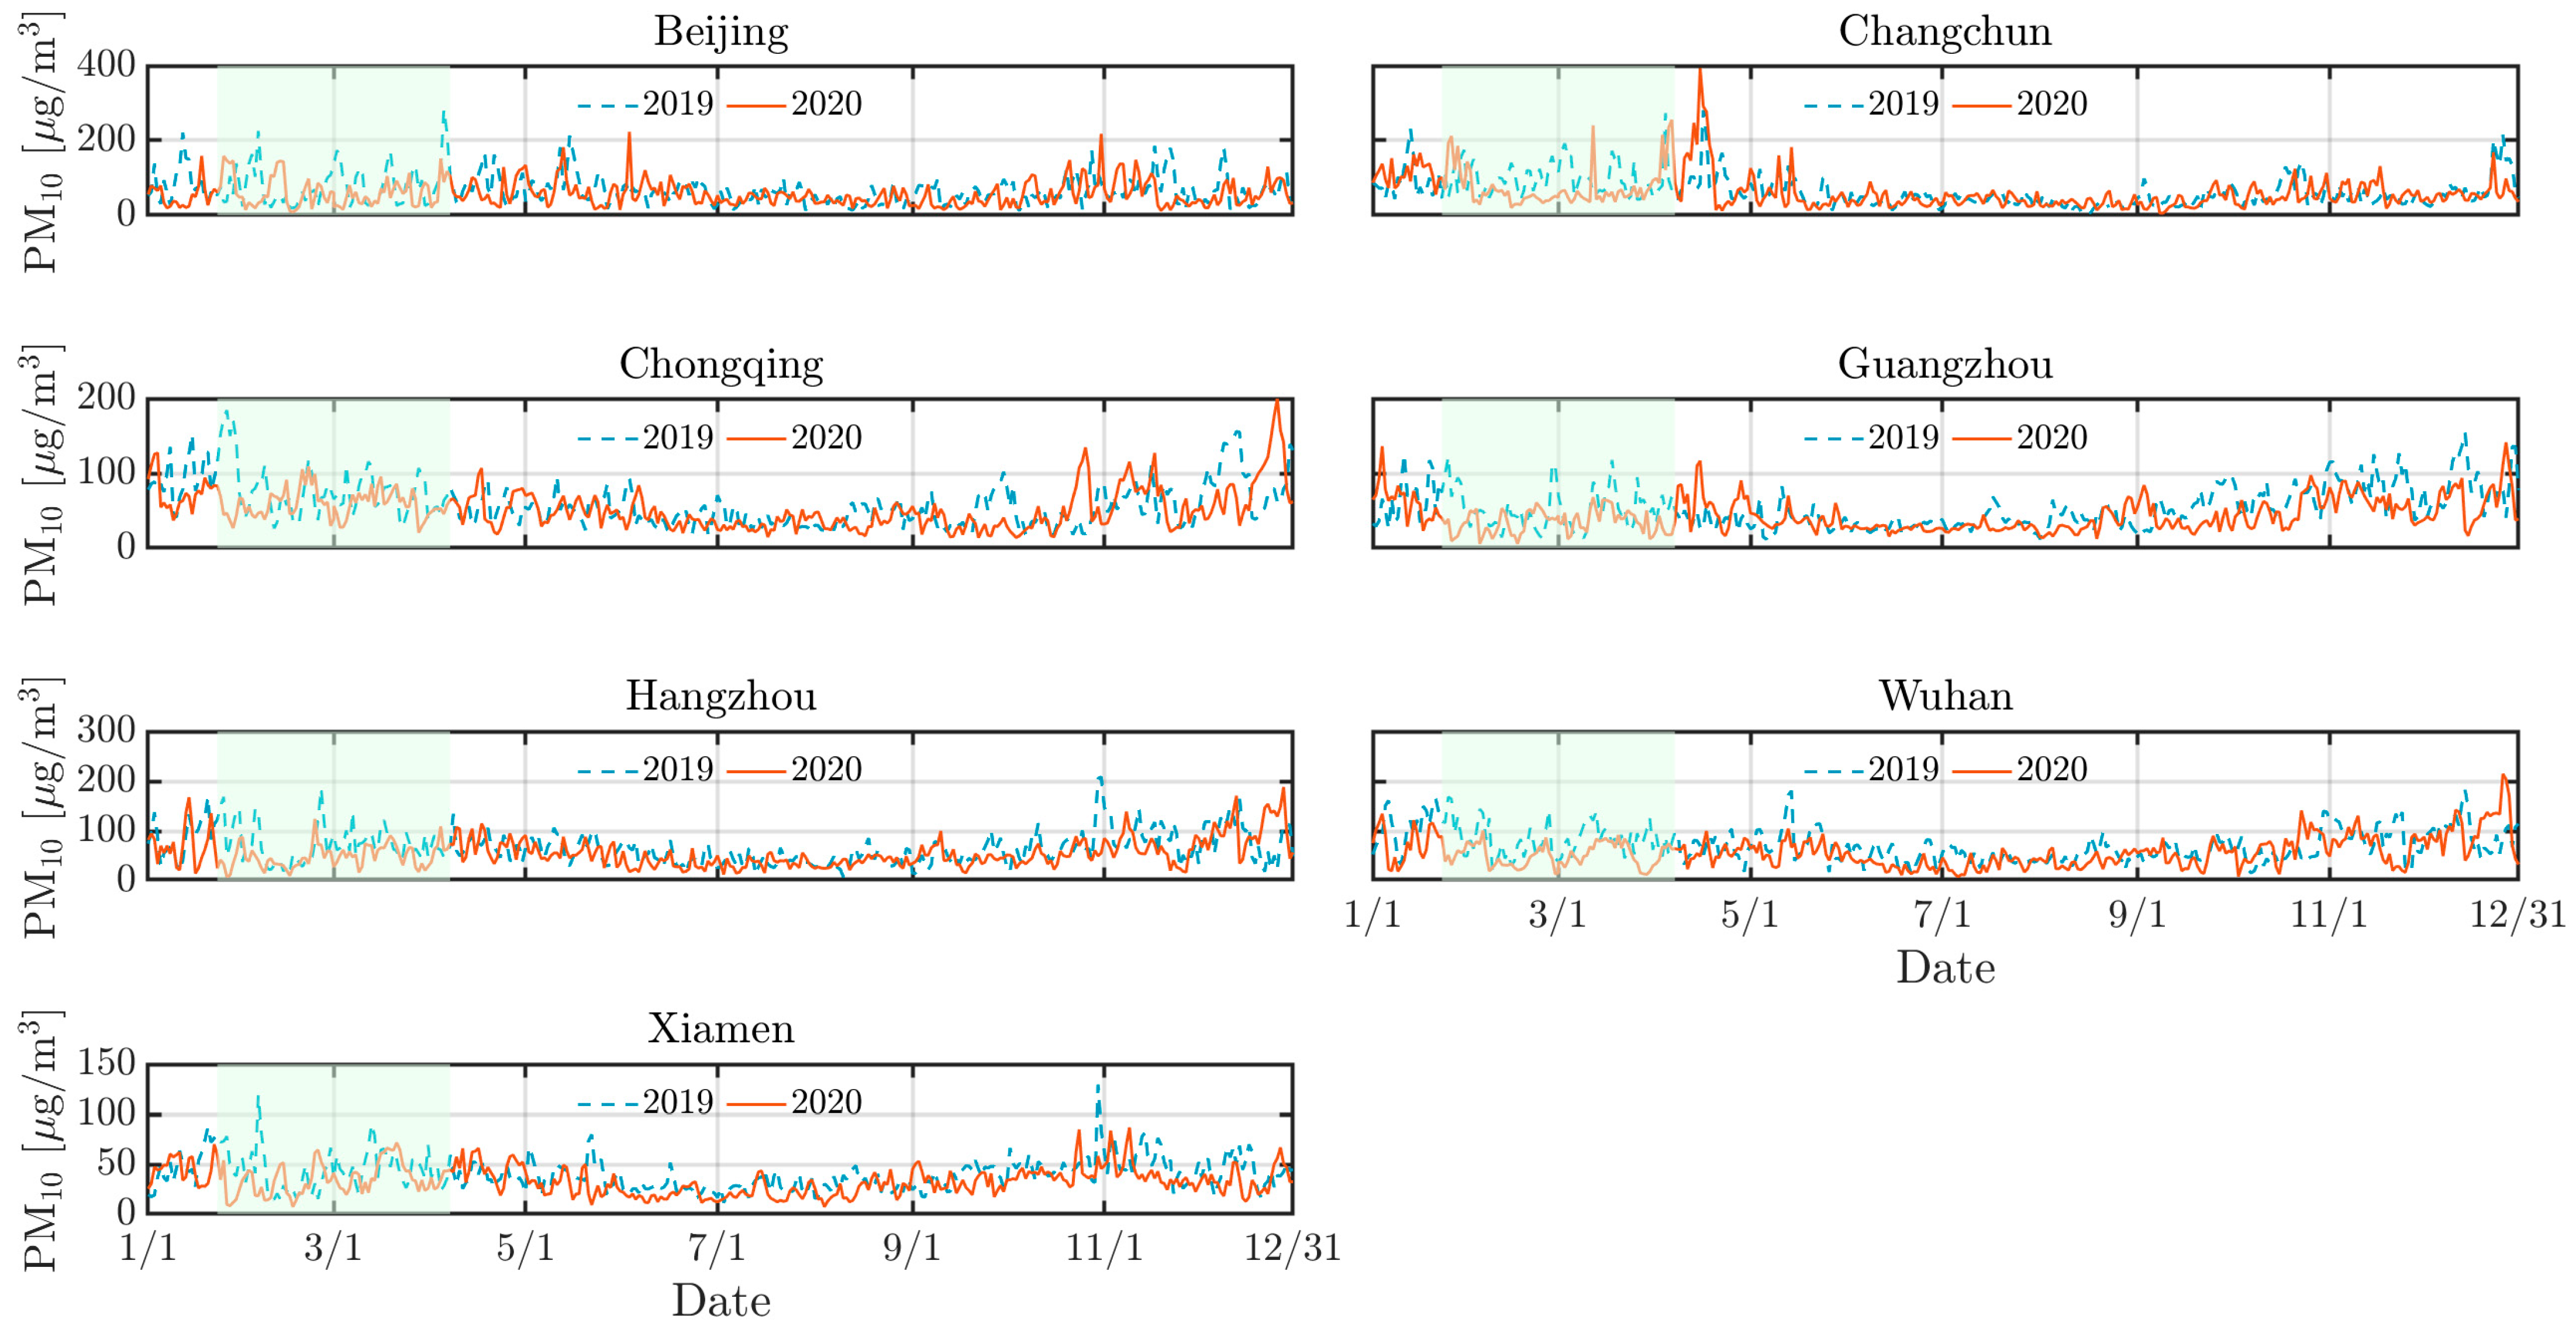
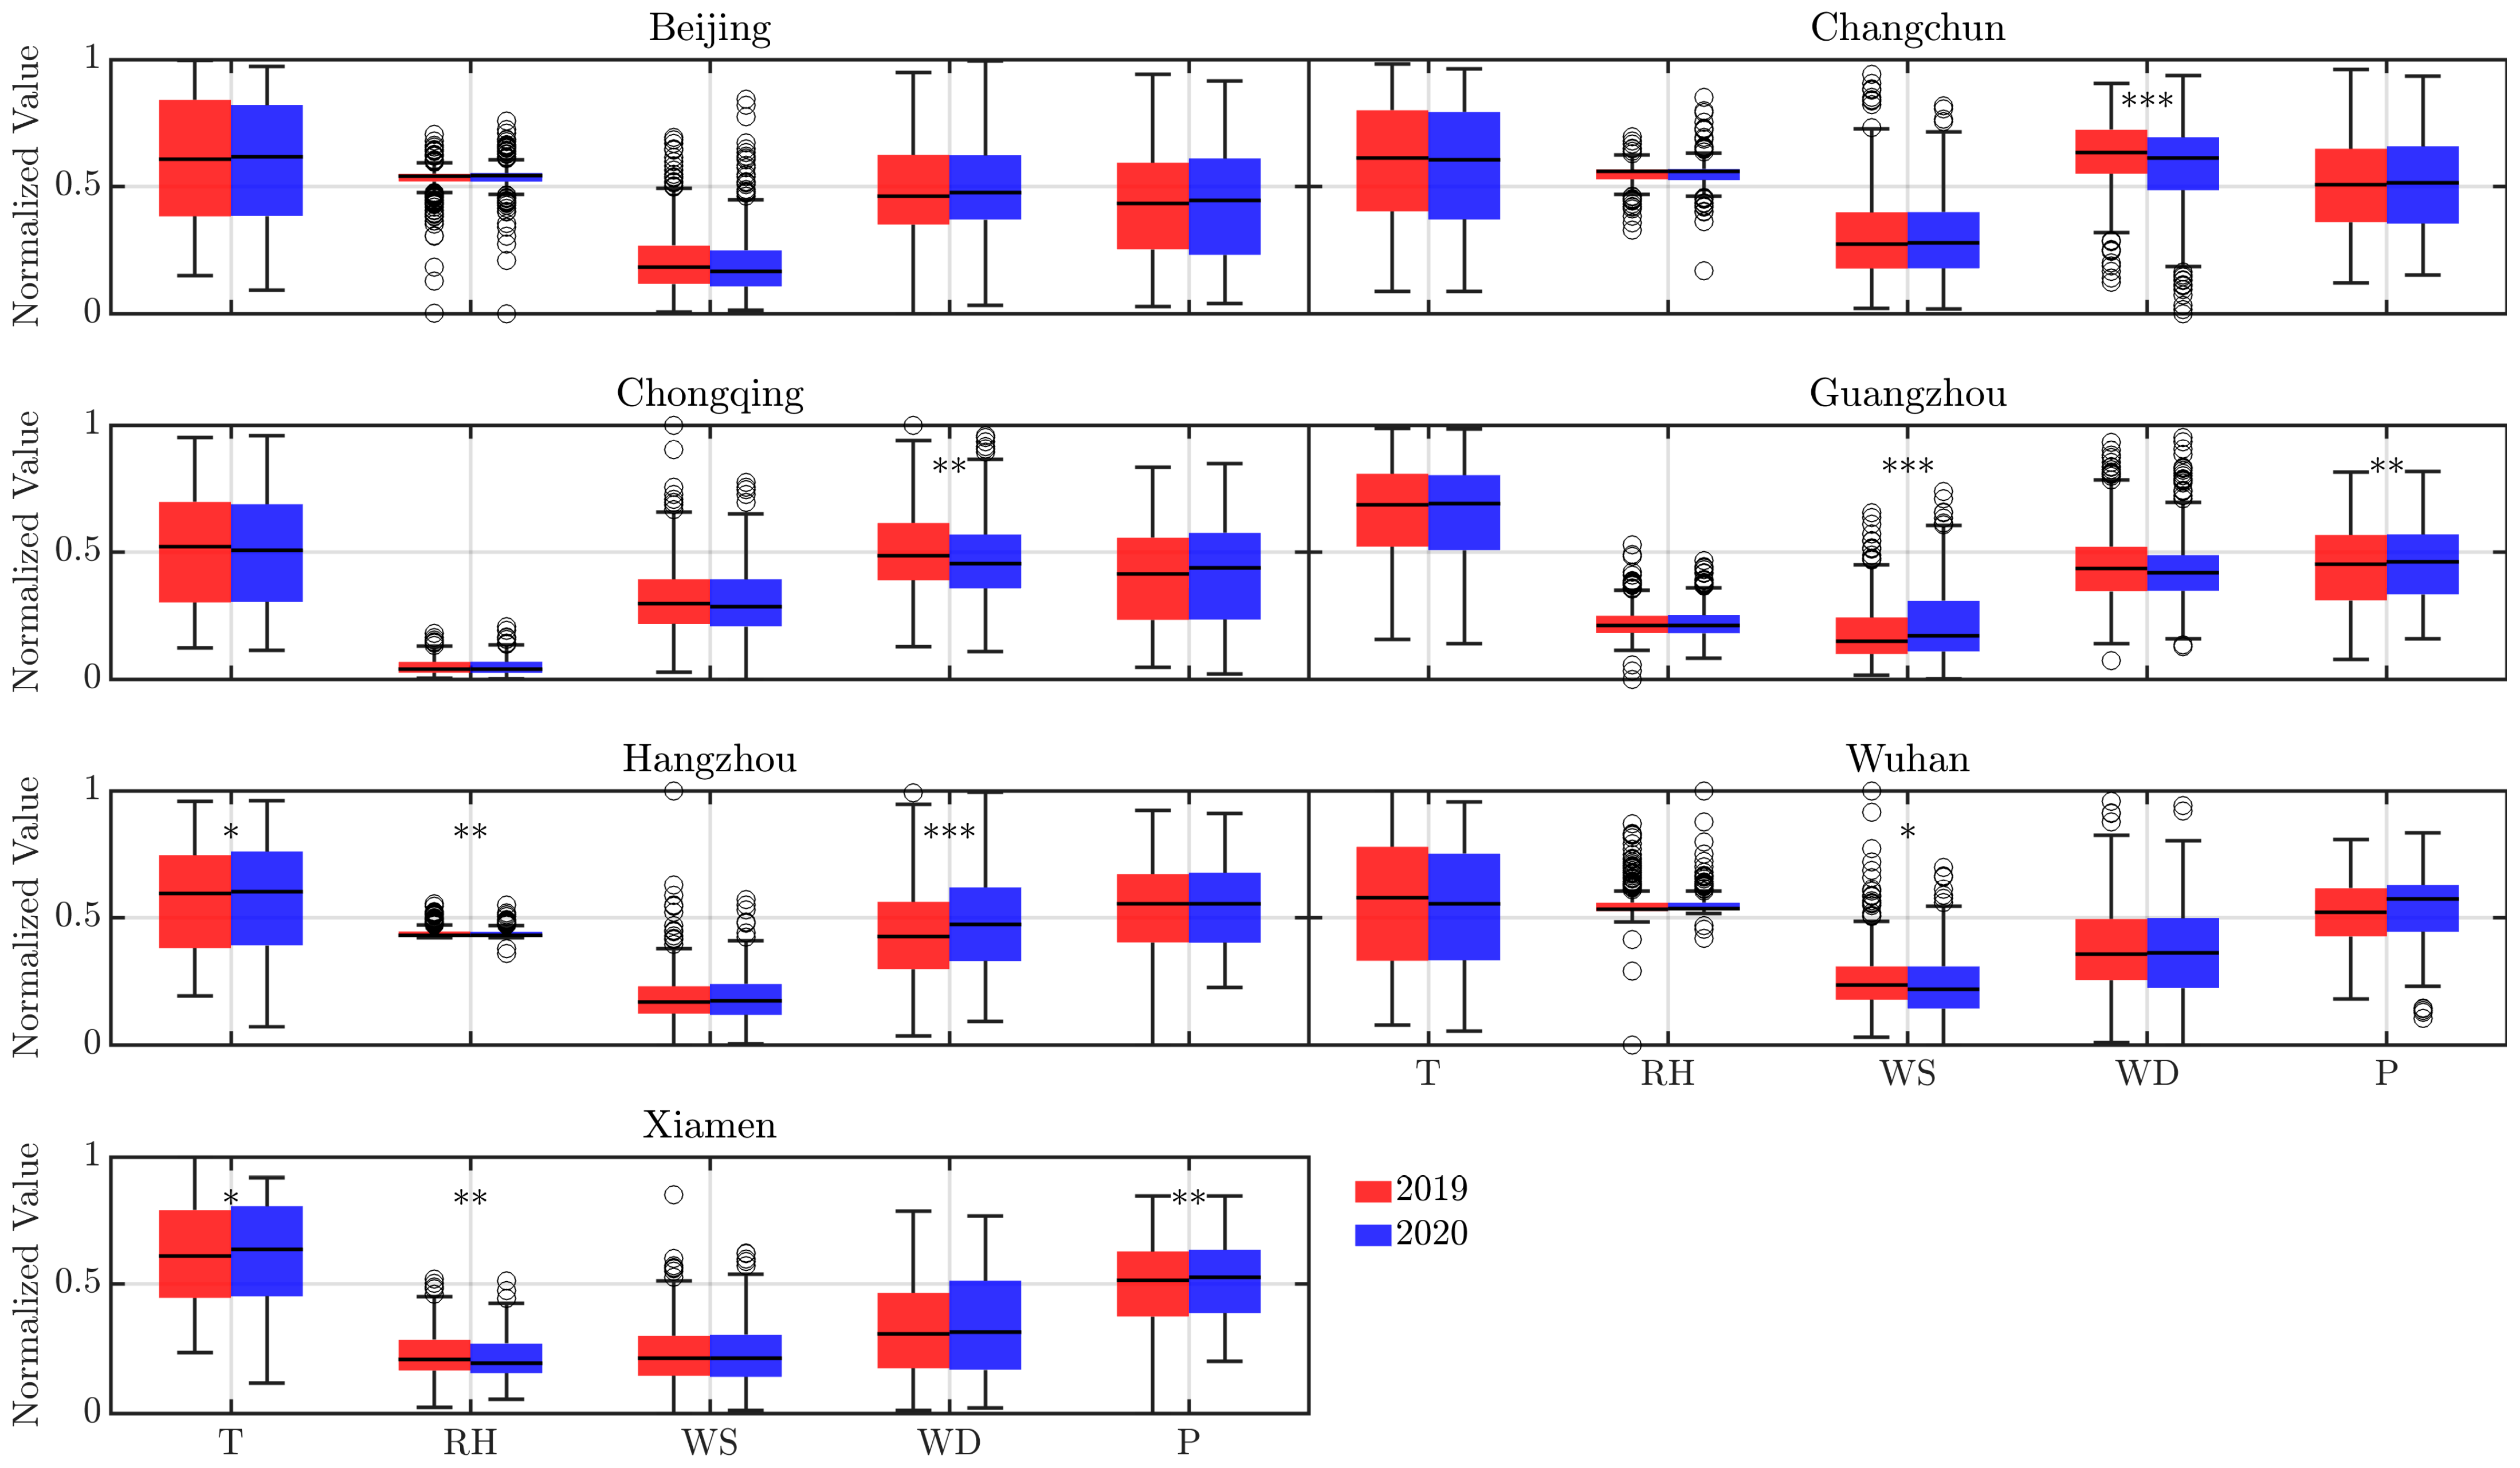
4.1. The Impact of Lockdown on Air Pollutants and Weather
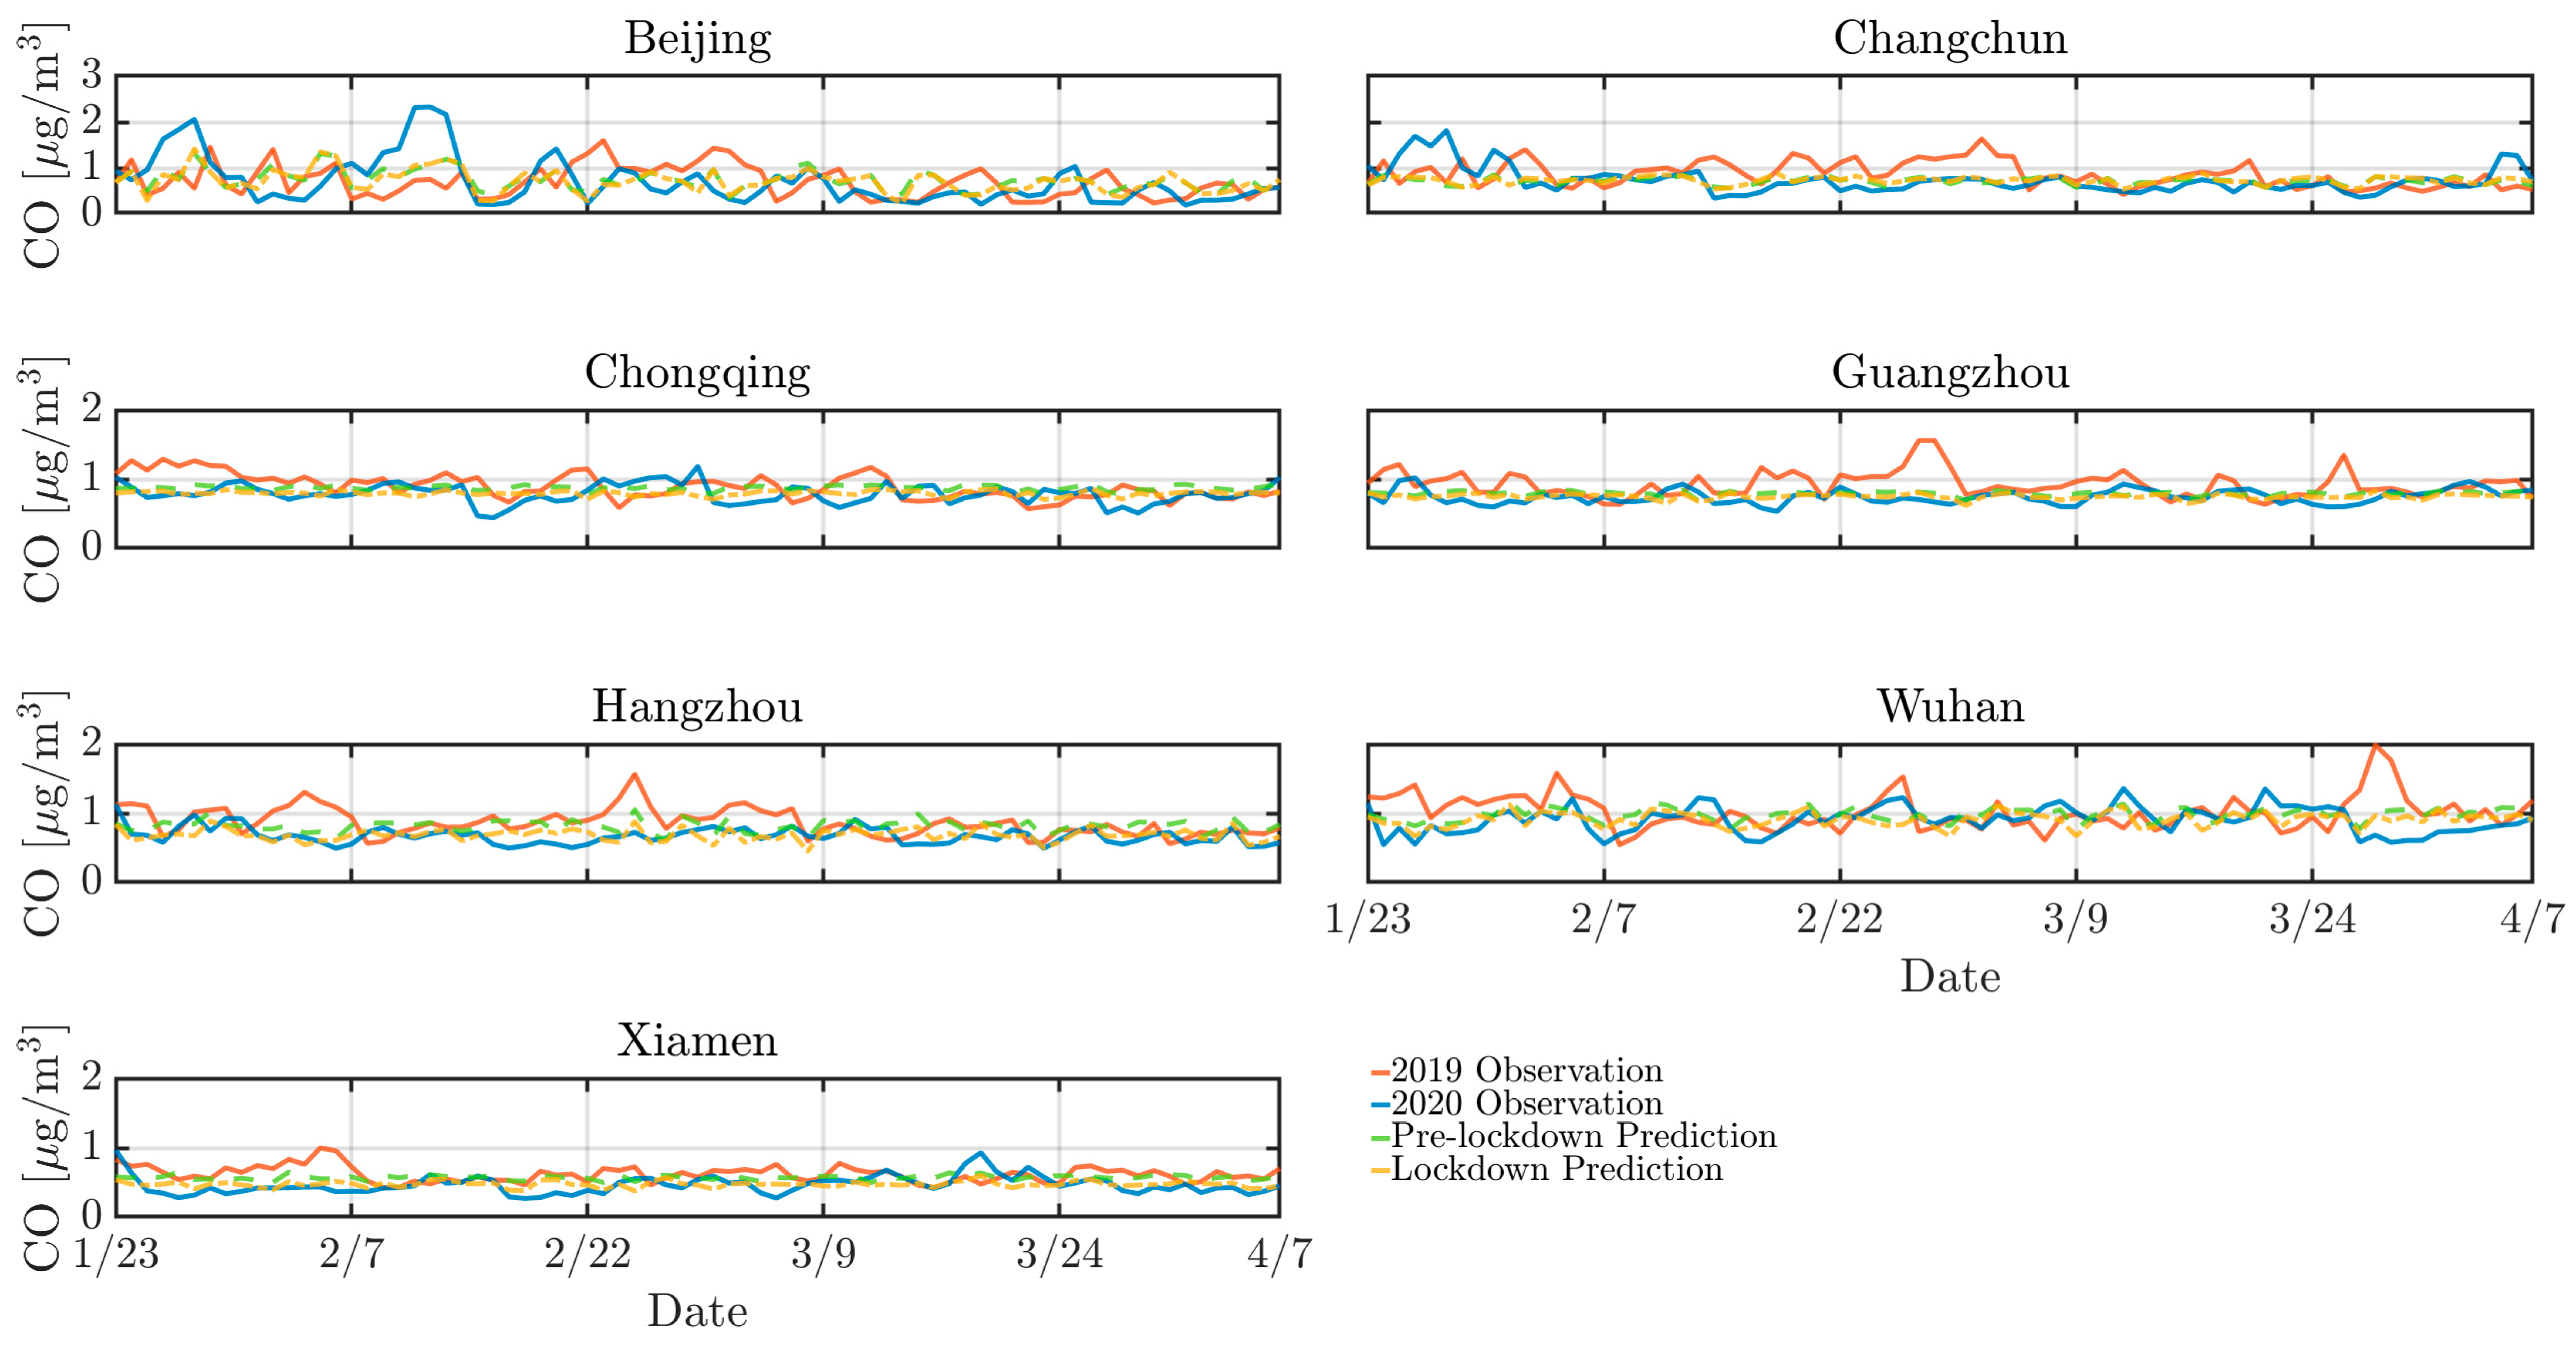
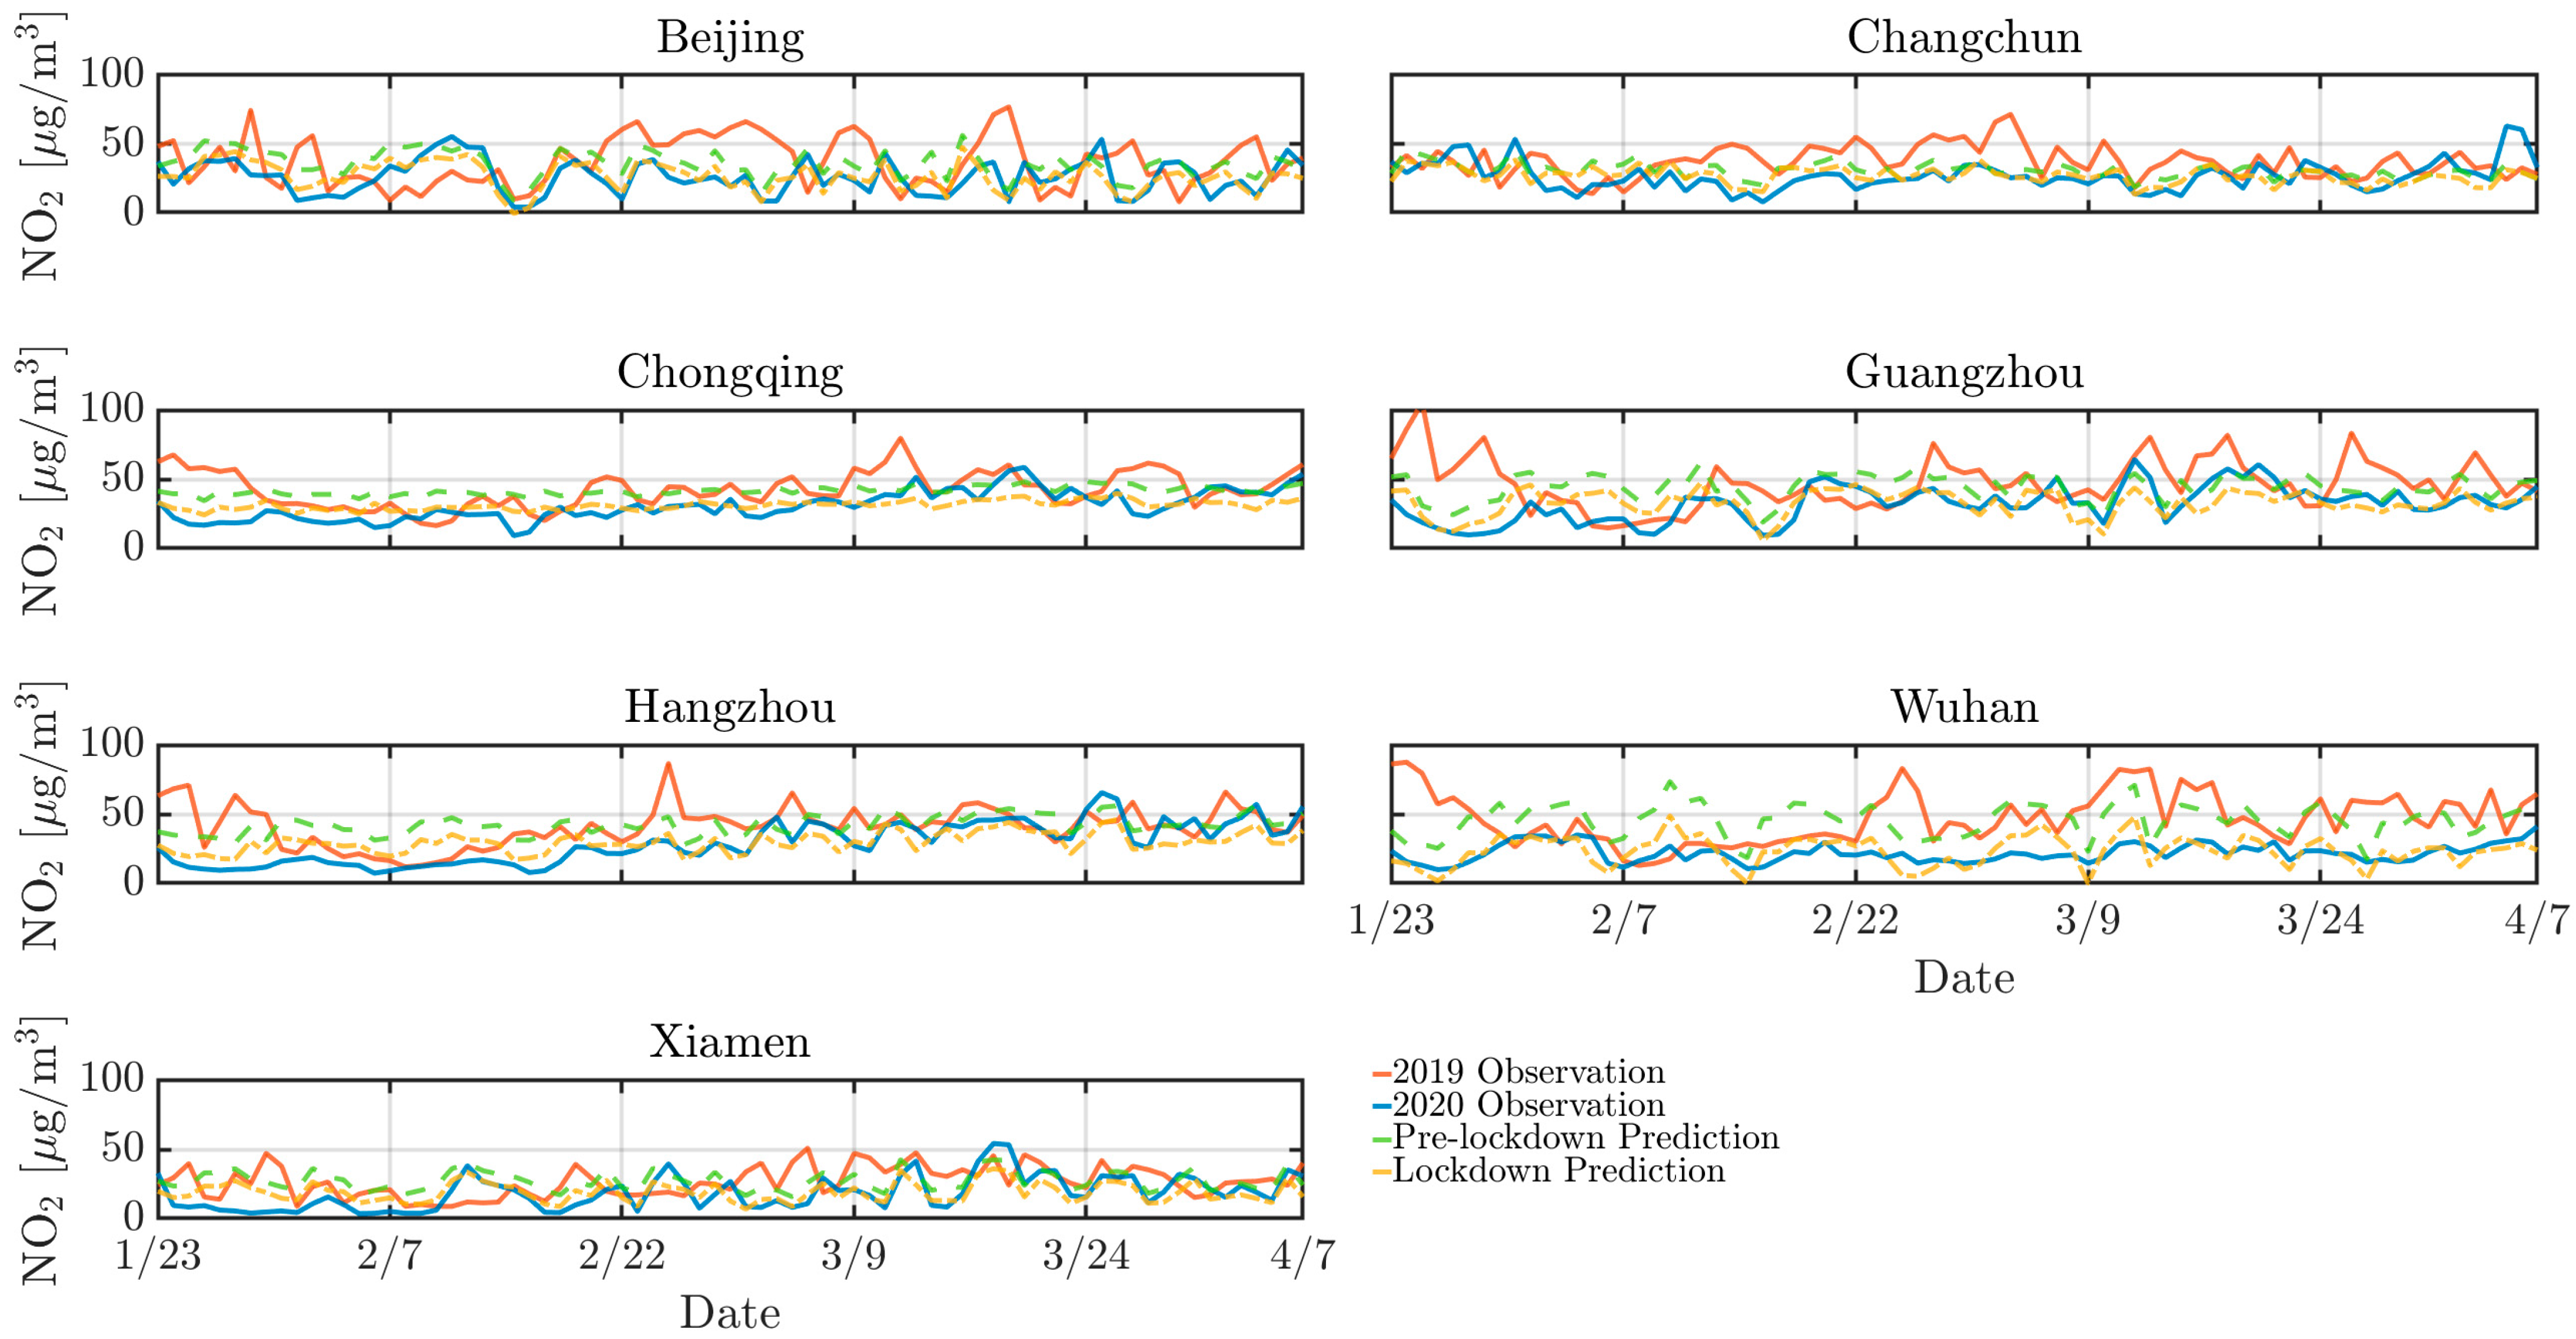
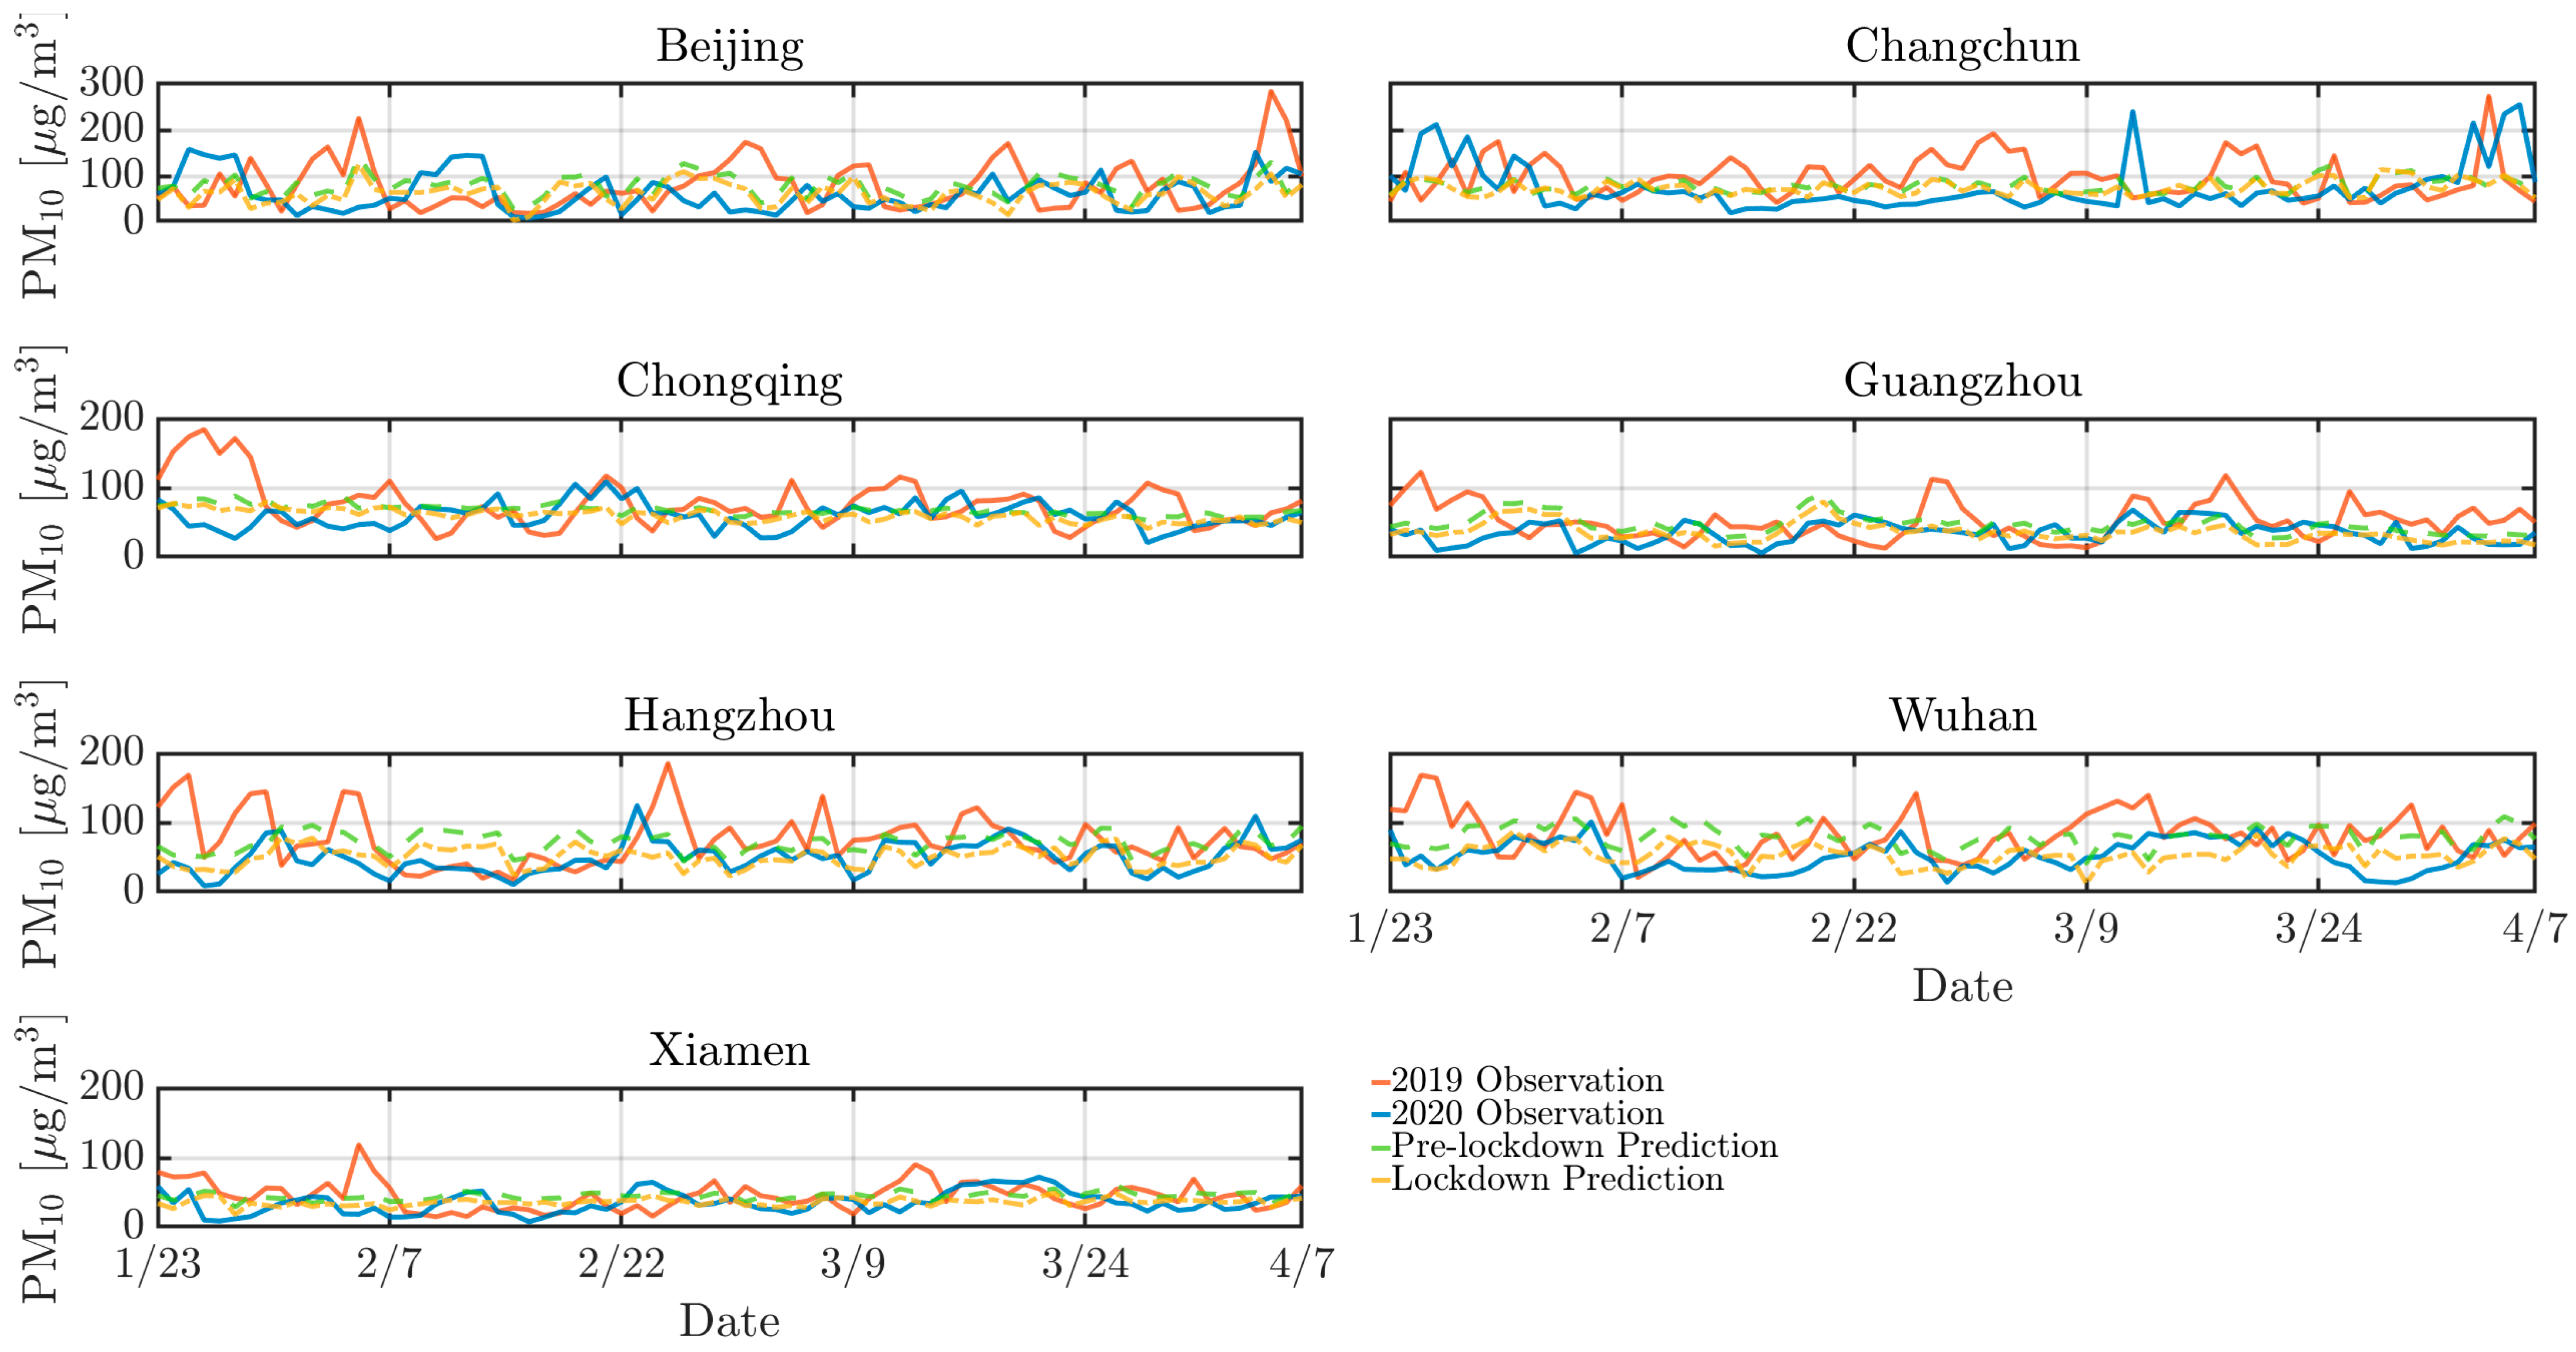
4.2. Model Predictions
5. Conclusions
Author Contributions
Funding
Institutional Review Board Statement
Informed Consent Statement
Data Availability Statement
Acknowledgments
Conflicts of Interest
References
- Neogi, S. Effects of Traffic-Related Air Pollution on Cognitive Function and Environmental Awareness of Adolescents. Glob. J. Res. Anal. 2023, 12, 97–99. [Google Scholar] [CrossRef]
- Lin, Y.-C.; Fan, K.-C.; Wu, C.-D.; Pan, W.-C.; Chen, J.-C.; Chao, Y.-P.; Lai, Y.-J.; Chiu, Y.-L.; Chuang, Y.-F. Yearly Change in Air Pollution and Brain Aging among Older Adults: A Community-Based Study in Taiwan. Environ. Int. 2024, 190, 108876. [Google Scholar] [CrossRef]
- Lu, X.; Yao, T.; Fung, J.C.H.; Lin, C. Estimation of Health and Economic Costs of Air Pollution over the Pearl River Delta Region in China. Sci. Total Environ. 2016, 566–567, 134–143. [Google Scholar] [CrossRef] [PubMed]
- Copat, C.; Cristaldi, A.; Fiore, M.; Grasso, A.; Zuccarello, P.; Signorelli, S.S.; Conti, G.O.; Ferrante, M. The Role of Air Pollution (PM and NO2) in COVID-19 Spread and Lethality: A Systematic Review. Environ. Res. 2020, 191, 110129. [Google Scholar] [CrossRef] [PubMed]
- Zhang, J.; Lim, Y.-H.; So, R.; Jørgensen, J.T.; Mortensen, L.H.; Napolitano, G.M.; Cole-Hunter, T.; Loft, S.; Bhatt, S.; Hoek, G.; et al. Long-Term Exposure to Air Pollution and Risk of SARS-CoV-2 Infection and COVID-19 Hospitalisation or Death: Danish Nationwide Cohort Study. Eur. Respir. J. 2023, 62, 2300280. [Google Scholar] [CrossRef]
- Comunian, S.; Dongo, D.; Milani, C.; Palestini, P. Air Pollution and COVID-19: The Role of Particulate Matter in the Spread and Increase of COVID-19’s Morbidity and Mortality. Int. J. Environ. Res. Public Health 2020, 17, 4487. [Google Scholar] [CrossRef]
- Ahmed, F.; Shafer, L.; Malla, P.; Hopkins, R.; Moreland, S.; Zviedrite, N.; Uzicanin, A. Systematic Review of Empiric Studies on Lockdowns, Workplace Closures, and Other Non-Pharmaceutical Interventions in Non-Healthcare Workplaces during the Initial Year of the COVID-19 Pandemic: Benefits and Selected Unintended Consequences. BMC Public Health 2024, 24, 884. [Google Scholar] [CrossRef]
- Murphy, C.; Lim, W.W.; Mills, C.; Wong, J.Y.; Chen, D.; Xie, Y.; Li, M.; Gould, S.; Xin, H.; Cheung, J.K.; et al. Effectiveness of Social Distancing Measures and Lockdowns for Reducing Transmission of COVID-19 in Non-Healthcare, Community-Based Settings. Philos. Trans. A Math. Phys. Eng. Sci. 2023, 381, 20230132. [Google Scholar] [CrossRef]
- Afrin, S.; Chowdhury, F.J.; Rahman, M.M. COVID-19 Pandemic: Rethinking Strategies for Resilient Urban Design, Perceptions, and Planning. Front. Sustain. Cities 2021, 3, 668263. [Google Scholar] [CrossRef]
- Sharifi, A.; Khavarian-Garmsir, A.R. The COVID-19 Pandemic: Impacts on Cities and Major Lessons for Urban Planning, Design, and Management. Sci. Total Environ. 2020, 749, 142391. [Google Scholar] [CrossRef]
- Briz-Redón, Á.; Belenguer-Sapiña, C.; Serrano-Aroca, Á. Changes in Air Pollution during COVID-19 Lockdown in Spain: A Multi-City Study. J. Environ. Sci. 2021, 101, 16–26. [Google Scholar] [CrossRef] [PubMed]
- Fu, F.; Purvis-Roberts, K.L.; Williams, B. Impact of the COVID-19 Pandemic Lockdown on Air Pollution in 20 Major Cities around the World. Atmosphere 2020, 11, 1189. [Google Scholar] [CrossRef]
- Ghahremanloo, M.; Lops, Y.; Choi, Y.; Mousavinezhad, S. Impact of the COVID-19 Outbreak on Air Pollution Levels in East Asia. Sci. Total Environ. 2021, 754, 142226. [Google Scholar] [CrossRef]
- Venter, Z.S.; Aunan, K.; Chowdhury, S.; Lelieveld, J. Air Pollution Declines during COVID-19 Lockdowns Mitigate the Global Health Burden. Environ. Res. 2021, 192, 110403. [Google Scholar] [CrossRef]
- Venter, Z.S.; Aunan, K.; Chowdhury, S.; Lelieveld, J. COVID-19 Lockdowns Cause Global Air Pollution Declines. Proc. Natl. Acad. Sci. USA 2020, 117, 18984–18990. [Google Scholar] [CrossRef]
- Świsłowski, P.; Ziembik, Z.; Rajfur, M. Air Quality during New Year’s Eve: A Biomonitoring Study with Moss. Atmosphere 2021, 12, 975. [Google Scholar] [CrossRef]
- Tsilimigkas, G.; Stathakis, D.; Pafi, M. Evaluating the Land Use Patterns of Medium-Sized Hellenic Cities. Urban. Res. Pract. 2016, 9, 181–203. [Google Scholar] [CrossRef]
- Dominici, F. On the Use of Generalized Additive Models in Time-Series Studies of Air Pollution and Health. Am. J. Epidemiol. 2002, 156, 193–203. [Google Scholar] [CrossRef]
- Ravindra, K.; Rattan, P.; Mor, S.; Aggarwal, A.N. Generalized Additive Models: Building Evidence of Air Pollution, Climate Change and Human Health. Environ. Int. 2019, 132, 104987. [Google Scholar] [CrossRef]
- Pearce, J.L.; Beringer, J.; Nicholls, N.; Hyndman, R.J.; Tapper, N.J. Tapper Quantifying the Influence of Local Meteorology on Air Quality Using Generalized Additive Models. Atmos. Environ. 2011, 45, 1328–1336. [Google Scholar] [CrossRef]
- Pan, S.J.; Yang, Q. A Survey on Transfer Learning. IEEE Trans. Knowl. Data Eng. 2010, 22, 1345–1359. [Google Scholar] [CrossRef]
- Bauwens, M.; Compernolle, S.; Stavrakou, T.; Müller, J.-F.; van Gent, J.; Eskes, H.; Levelt, P.F.; van der A, R.; Veefkind, J.P.; Vlietinck, J.; et al. Impact of Coronavirus Outbreak on NO2 Pollution Assessed Using TROPOMI and OMI Observations. Geophys. Res. Lett. 2020, 47, e2020GL087978. [Google Scholar] [CrossRef] [PubMed]
- Limpert, E.; Stahel, W.A.; Abbt, M. Log-Normal Distributions across the Sciences: Keys and Clues: On the Charms of Statistics, and How Mechanical Models Resembling Gambling Machines Offer a Link to a Handy Way to Characterize Log-Normal Distributions, Which Can Provide Deeper Insight into Variability and Probability—Normal or Log-Normal: That Is the Question. BioScience 2001, 51, 341–352. [Google Scholar] [CrossRef]
- Hastie, T.; Tibshirani, R. Generalized Additive Models. Stat. Sci. 1986, 1, 297–310. [Google Scholar] [CrossRef]
- Stone, C.J. Additive Regression and Other Nonparametric Models. Ann. Stat. 1985, 13, 689–705. [Google Scholar] [CrossRef]
- Ghasemi, A.; Amanollahi, J. Integration of ANFIS Model and Forward Selection Method for Air Quality Forecasting. Air Qual. Atmos. Health 2019, 12, 59–72. [Google Scholar] [CrossRef]
- Bozdogan, H. Model Selection and Akaike’s Information Criterion (AIC): The General Theory and Its Analytical Extensions. Psychometrika 1987, 52, 345–370. [Google Scholar] [CrossRef]
- Akaike, H. A New Look at the Statistical Model Identification. IEEE Trans. Autom. Control 1974, 19, 716–723. [Google Scholar] [CrossRef]
- Senaviratna, N.A.M.R.; Cooray, T.M.J.A. Diagnosing Multicollinearity of Logistic Regression Model. Asian J. Probab. Stat. 2019, 5, 1–9. [Google Scholar] [CrossRef]
- Kumari, P.; Toshniwal, D. Impact of Lockdown on Air Quality over Major Cities across the Globe during COVID-19 Pandemic. Urban. Clim. 2020, 34, 100719. [Google Scholar] [CrossRef]
- He, G.; Pan, Y.; Tanaka, T. The Short-Term Impacts of COVID-19 Lockdown on Urban Air Pollution in China. Nat. Sustain. 2020, 3, 1005–1011. [Google Scholar] [CrossRef]
- Wang, B.; Wang, B.; Lv, B.; Wang, R. Impact of Motor Vehicle Exhaust on the Air Quality of an Urban City. Aerosol Air Qual. Res. 2022, 22, 220213. [Google Scholar] [CrossRef]
- Bian, C.; Yuan, C.; Kuang, W.; Wu, D. Evaluation, Classification, and Influential Factors Analysis of Traffic Congestion in Chinese Cities Using the Online Map Data. Math. Probl. Eng. 2016, 2016, 1693729. [Google Scholar] [CrossRef]
- Zhang, Y.; Wei, J.; Tang, A.; Zheng, A.; Shao, Z.; Liu, X. Chemical Characteristics of PM2.5 during 2015 Spring Festival in Beijing, China. Aerosol Air Qual. Res. 2017, 17, 1169–1180. [Google Scholar] [CrossRef]
- Liu, T.; He, G.; Lau, A.K.H. Statistical Evidence on the Impact of Agricultural Straw Burning on Urban Air Quality in China. Sci. Total Environ. 2020, 711, 134633. [Google Scholar] [CrossRef]
- Liu, Z.; Lai, J.; Zhan, W.; Bechtel, B.; Voogt, J.; Quan, J.; Hu, L.; Fu, P.; Huang, F.; Li, L.; et al. Urban Heat Islands Significantly Reduced by COVID--19 Lockdown. Geophys. Res. Lett. 2022, 49, e2021GL096842. [Google Scholar] [CrossRef]
- Liu, T.; Duan, F.; Ma, Y.; Ma, T.; Zhang, Q.; Xu, Y.; Li, F.; Huang, T.; Kimoto, T.; Zhang, Q. Classification and Sources of Extremely Severe Sandstorms Mixed with Haze Pollution in Beijing. Environ. Pollut. 2023, 322, 121154. [Google Scholar] [CrossRef]
- Eklund, J.; Kapetanios, G. A Review of Forecasting Techniques for Large Datasets. Natl. Inst. Econ. Rev. 2008, 203, 109–115. [Google Scholar] [CrossRef]
- Lin, W.; He, Q.; Xiao, Y.; Yang, J. Do City Lockdowns Effectively Reduce Air Pollution? Technol. Forecast. Soc. Change 2023, 197, 122885. [Google Scholar] [CrossRef]
- Fan, C.; Li, Y.; Guang, J.; Li, Z.; Elnashar, A.; Allam, M.; de Leeuw, G. The Impact of the Control Measures during the COVID-19 Outbreak on Air Pollution in China. Remote Sens. 2020, 12, 1613. [Google Scholar] [CrossRef]


| Duration [Months] | Beijing | Changchun | Chongqing | Guangzhou | Hangzhou | Wuhan | Xiamen | ||||||||||||||
|---|---|---|---|---|---|---|---|---|---|---|---|---|---|---|---|---|---|---|---|---|---|
| CO * | NO2 *** | PM10 *** | CO ** | NO2 *** | PM10 * | CO *** | NO2 *** | PM10 *** | CO * | NO2 *** | PM10 *** | CO ** | NO2 *** | PM10 | CO | NO2 *** | PM10 *** | CO *** | NO2 *** | PM10 *** | |
| 3 | 0.39 | 16.06 | 52.94 | 0.29 | 14.81 | 42.77 | 0.18 | 13.66 | 21.46 | 0.17 | 15.82 | 19.13 | 0.19 | 14.34 | 29.75 | 0.28 | 19.78 | 28.11 | 0.13 | 11.19 | 15.62 |
| 6 | 0.42 | 17.29 | 59.02 | 0.32 | 15.28 | 47.87 | 0.20 | 14.39 | 24.75 | 0.20 | 16.52 | 20.69 | 0.21 | 15.18 | 32.94 | 0.31 | 20.88 | 31.66 | 0.15 | 11.97 | 17.45 |
| 9 | 0.44 | 18.16 | 62.93 | 0.33 | 15.61 | 50.03 | 0.21 | 14.78 | 26.20 | 0.21 | 17.07 | 21.70 | 0.23 | 15.49 | 34.25 | 0.33 | 21.30 | 34.04 | 0.15 | 12.37 | 18.59 |
| 12 | 0.46 | 18.86 | 72.76 | 0.34 | 15.74 | 50.14 | 0.21 | 15.16 | 27.35 | 0.21 | 17.59 | 22.53 | 0.23 | 15.92 | 34.80 | 0.34 | 22.03 | 36.77 | 0.16 | 12.64 | 19.47 |
| 18 | 0.48 | 19.27 | 81.34 | 0.35 | 16.05 | 50.74 | 0.23 | 15.80 | 29.76 | 0.21 | 18.76 | 23.87 | 0.23 | 16.44 | 35.44 | 0.33 | 23.22 | 41.02 | 0.16 | 13.32 | 21.24 |
| 24 | 0.50 | 19.78 | 85.90 | 0.38 | 16.72 | 60.48 | 0.24 | 16.03 | 31.72 | 0.21 | 19.72 | 24.95 | 0.24 | 16.83 | 36.26 | 0.34 | 24.00 | 45.20 | 0.16 | 14.29 | 22.31 |
| Model | Measure | Beijing | Changchun | Chongqing | Guangzhou | Hangzhou | Wuhan | Xiamen | ||||||||||||||
|---|---|---|---|---|---|---|---|---|---|---|---|---|---|---|---|---|---|---|---|---|---|---|
| CO | NO2 | PM10 | CO | NO2 | PM10 | CO | NO2 | PM10 | CO | NO2 | PM10 | CO | NO2 | PM10 | CO | NO2 | PM10 | CO | NO2 | PM10 | ||
| pre-LD | RMSE [µg/m3] | 0.44 | 18.24 | 69.15 | 0.34 | 15.70 | 50.34 | 0.21 | 14.97 | 26.87 | 0.20 | 17.58 | 22.14 | 0.22 | 15.70 | 33.91 | 0.32 | 21.87 | 36.13 | 0.15 | 12.63 | 19.11 |
| n-RMSE | 0.046 | 0.073 | 0.011 | 0.034 | 0.063 | 0.008 | 0.022 | 0.060 | 0.004 | 0.020 | 0.071 | 0.004 | 0.023 | 0.063 | 0.005 | 0.033 | 0.088 | 0.006 | 0.015 | 0.051 | 0.003 | |
| LD | RMSE [µg/m3] | 0.41 | 9.07 | 40.45 | 0.22 | 7.40 | 42.29 | 0.14 | 8.16 | 20.02 | 0.10 | 10.23 | 16.28 | 0.13 | 11.19 | 18.96 | 0.19 | 9.03 | 24.20 | 0.12 | 8.66 | 14.58 |
Disclaimer/Publisher’s Note: The statements, opinions and data contained in all publications are solely those of the individual author(s) and contributor(s) and not of MDPI and/or the editor(s). MDPI and/or the editor(s) disclaim responsibility for any injury to people or property resulting from any ideas, methods, instructions or products referred to in the content. |
© 2025 by the authors. Licensee MDPI, Basel, Switzerland. This article is an open access article distributed under the terms and conditions of the Creative Commons Attribution (CC BY) license (https://creativecommons.org/licenses/by/4.0/).
Share and Cite
Ji, Y.; Zhang, X.; Cao, Y. Urban Air Quality Shifts in China: Application of Additive Model and Transfer Learning to Major Cities. Toxics 2025, 13, 334. https://doi.org/10.3390/toxics13050334
Ji Y, Zhang X, Cao Y. Urban Air Quality Shifts in China: Application of Additive Model and Transfer Learning to Major Cities. Toxics. 2025; 13(5):334. https://doi.org/10.3390/toxics13050334
Chicago/Turabian StyleJi, Yuchen, Xiaonan Zhang, and Yueqian Cao. 2025. "Urban Air Quality Shifts in China: Application of Additive Model and Transfer Learning to Major Cities" Toxics 13, no. 5: 334. https://doi.org/10.3390/toxics13050334
APA StyleJi, Y., Zhang, X., & Cao, Y. (2025). Urban Air Quality Shifts in China: Application of Additive Model and Transfer Learning to Major Cities. Toxics, 13(5), 334. https://doi.org/10.3390/toxics13050334