
Determination of Multiple Fluorescent Brighteners in Human Plasma Using Captiva EMR-Lipid Clean-Up and LC-MS/MS Analysis

 ,
,  and
and
Abstract
:1. Introduction
2. Materials and Methods
2.1. Chemicals and Reagents
2.2. Study Population and Sample Collection
2.3. Standard Solutions
2.4. Sample Preparation
2.5. Instrument Analysis
2.6. Validation Procedure
2.7. Data Analysis
3. Results and Discussion
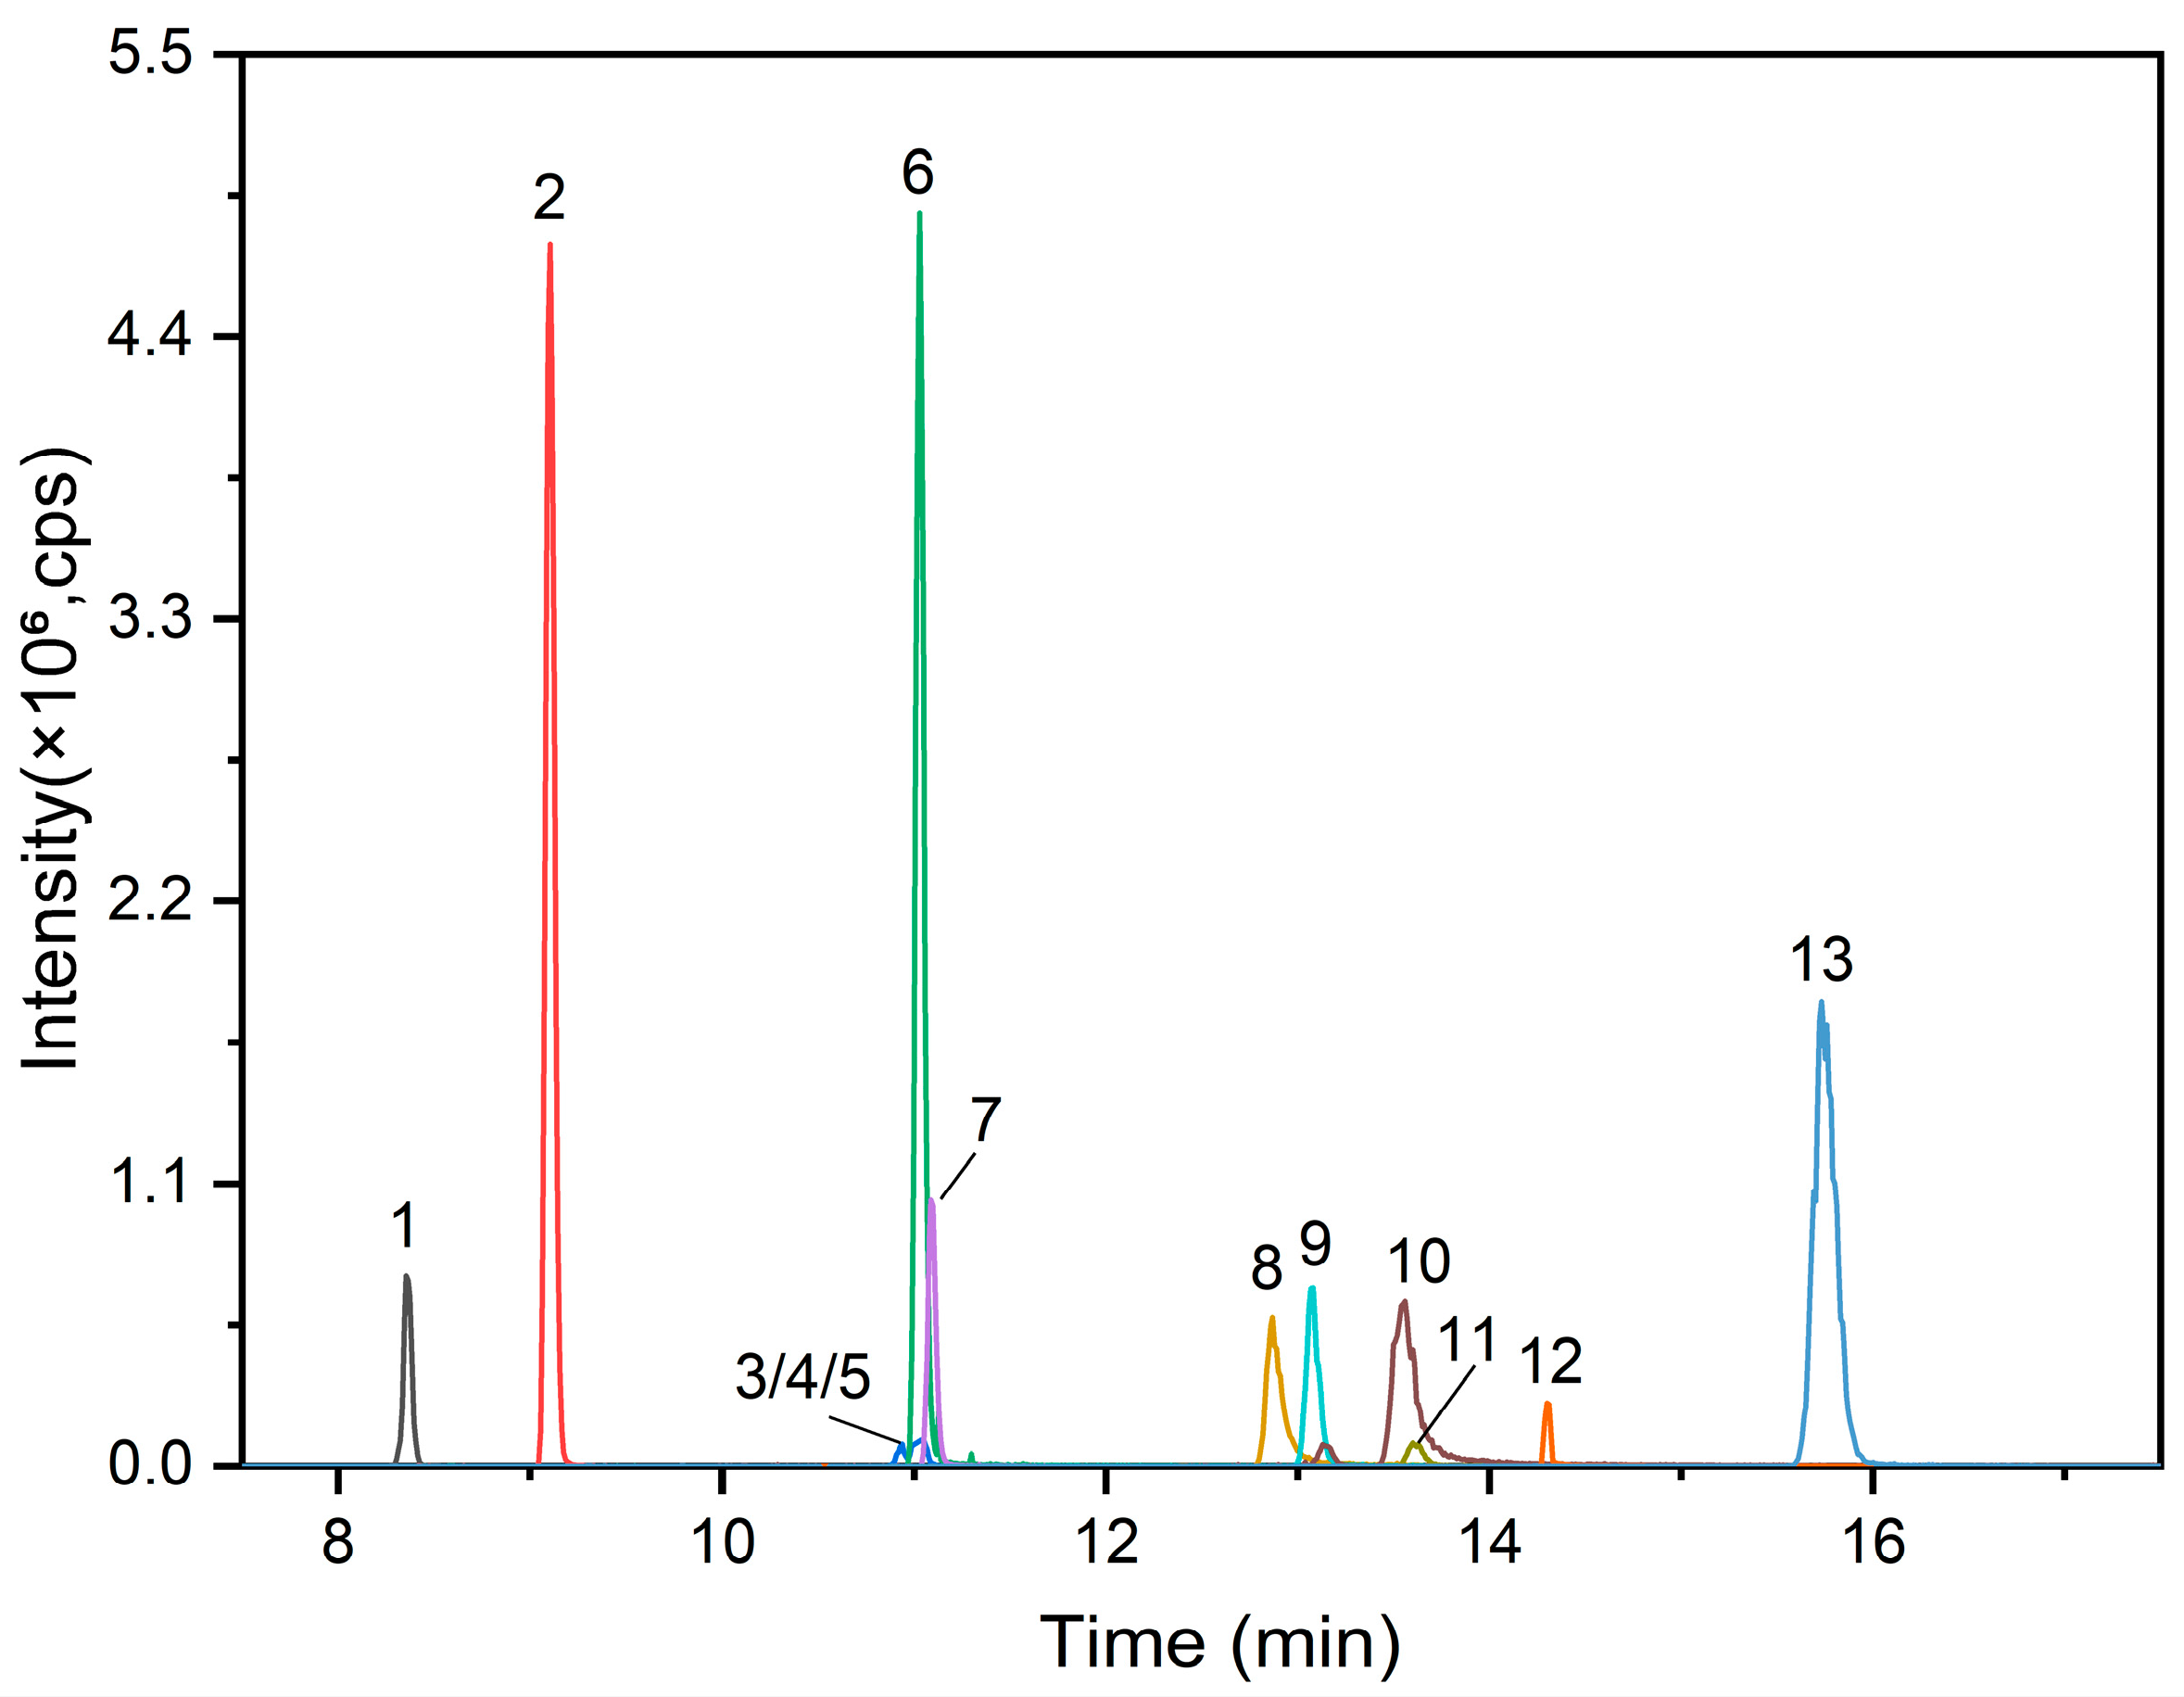
3.1. Optimization of Instrument Conditions
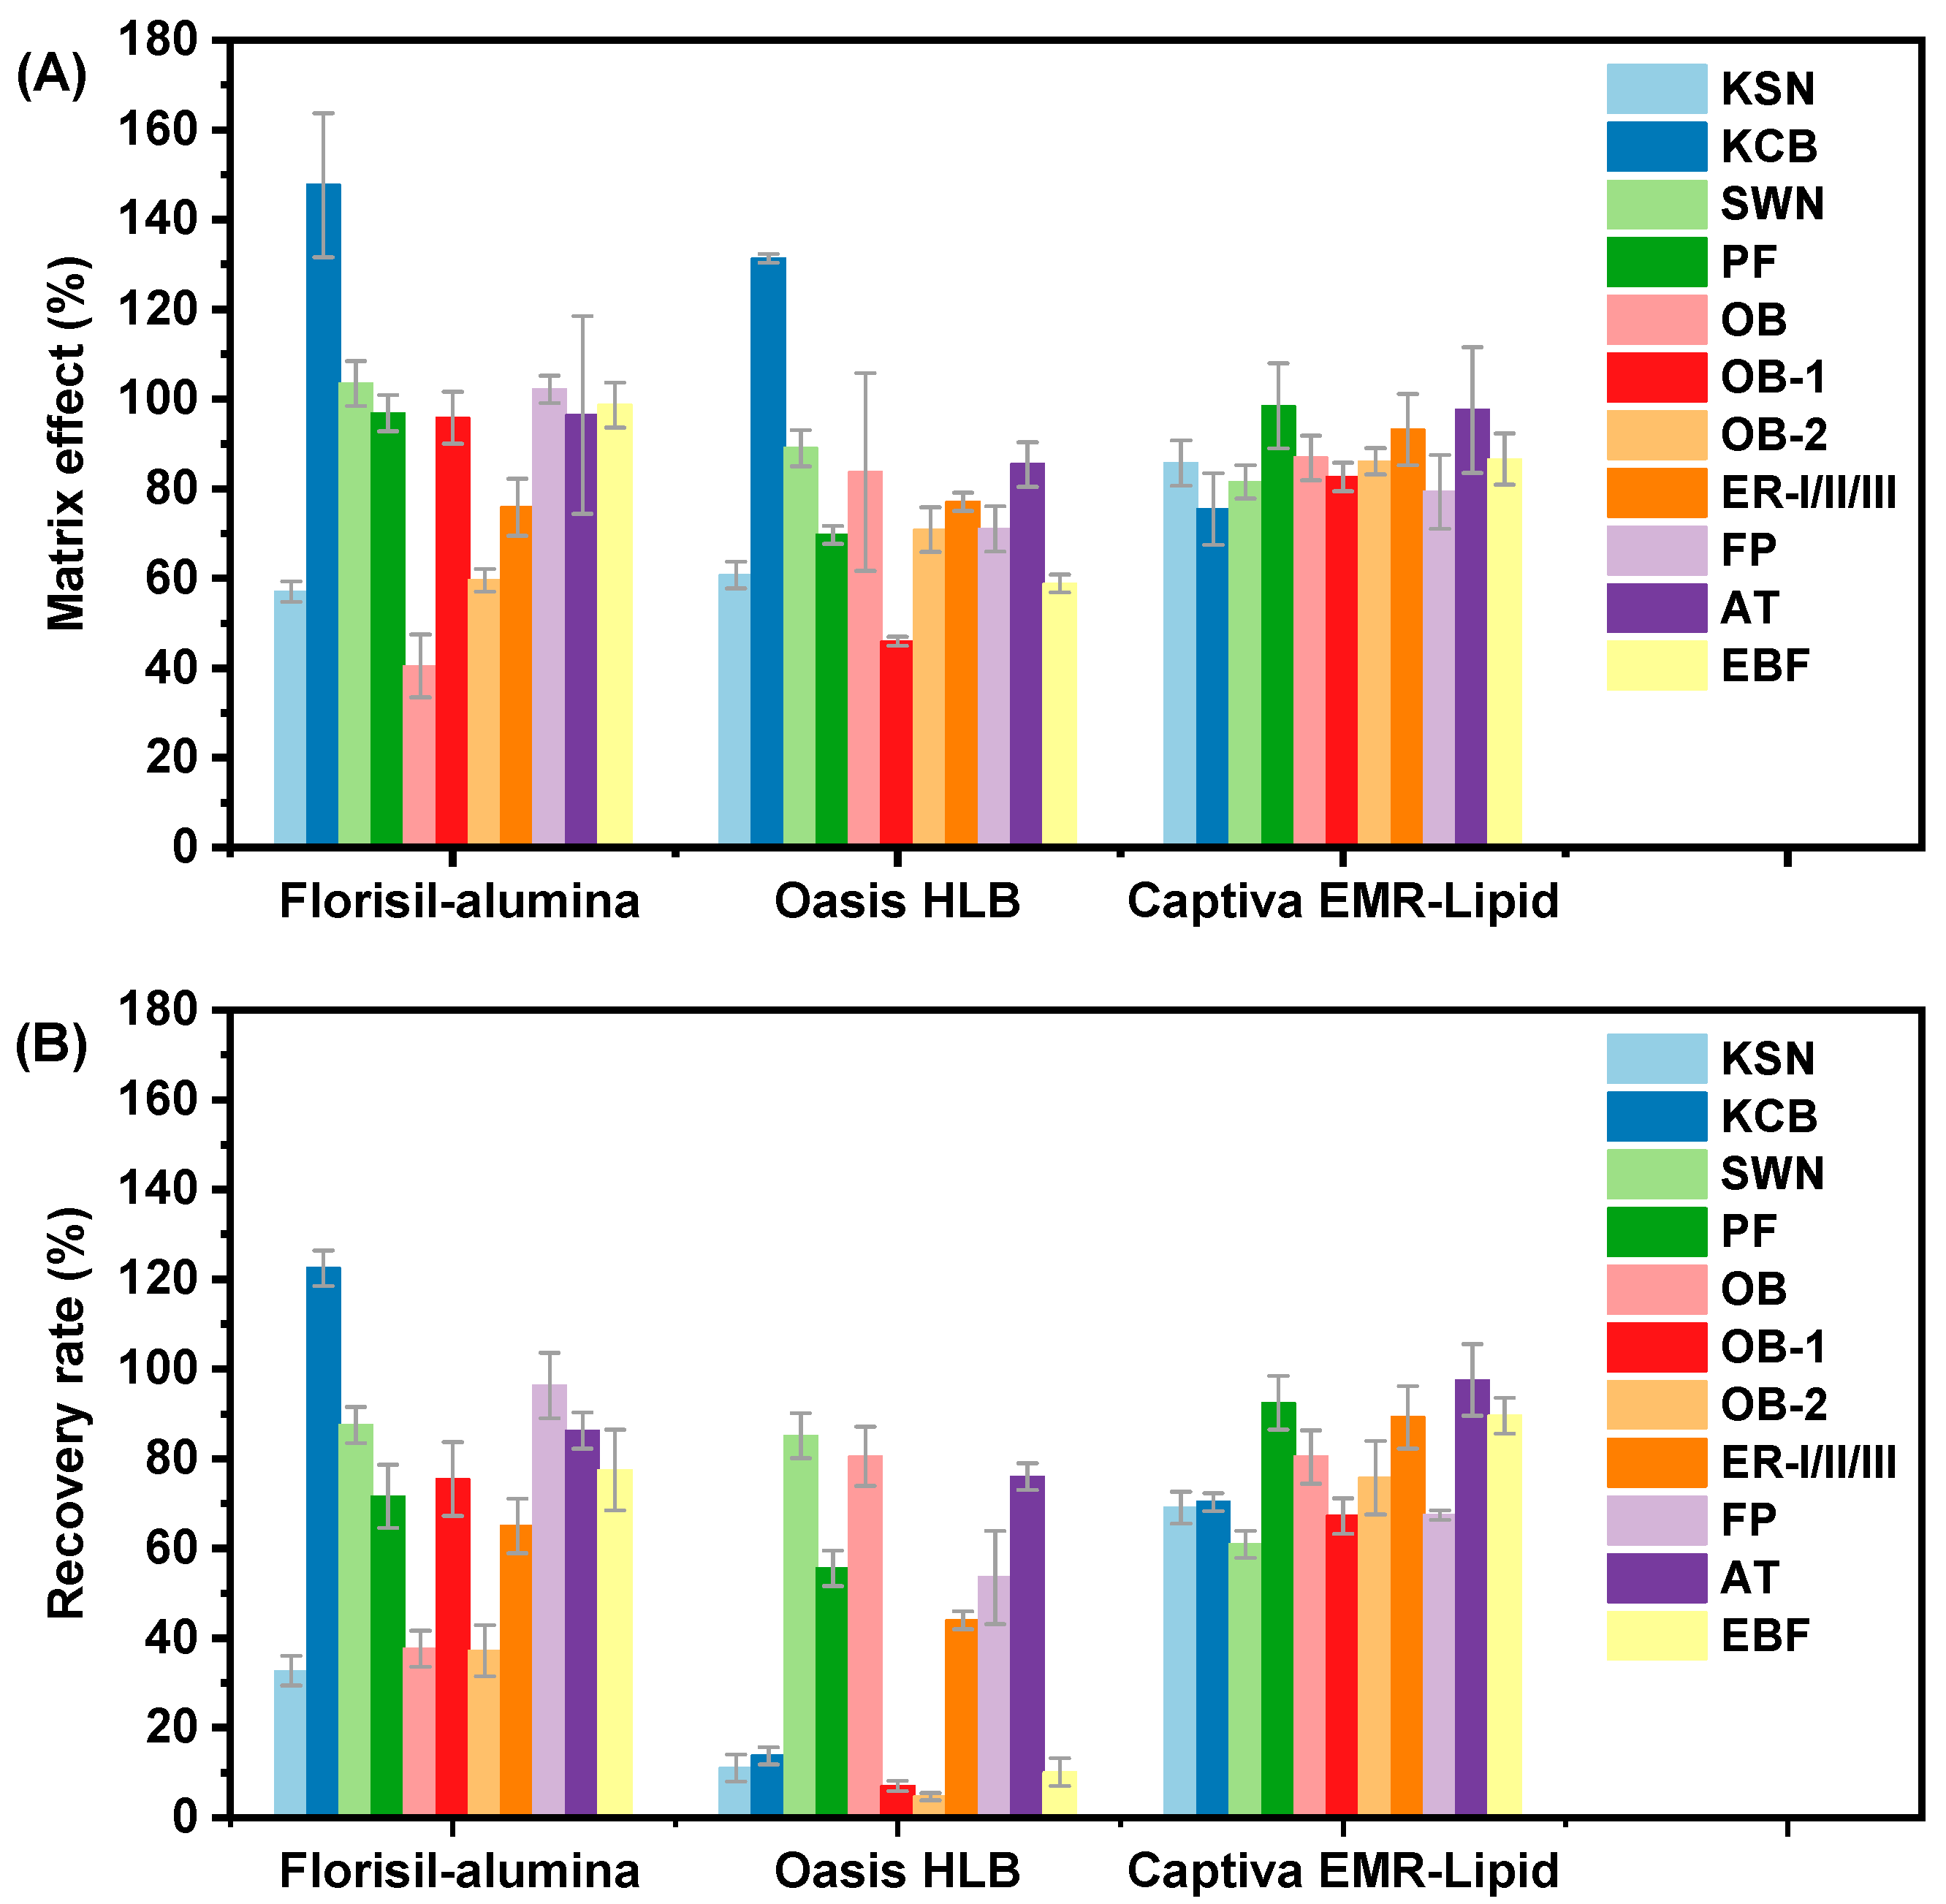
3.2. Optimization of Clean-Up Procedure
3.3. Method Validation
3.4. Analysis of FBs in Human Plasma Samples
4. Conclusions
Author Contributions
Funding
Institutional Review Board Statement
Informed Consent Statement
Data Availability Statement
Acknowledgments
Conflicts of Interest
Appendix A

| Chemical Name | Abbreviation | CAS NO. | Molecular Formula | Chemical Structure | LogKow |
|---|---|---|---|---|---|
| 4-(2-Benzoxazolyl)-4′-(5-methyl-2-benzoxazolyl)stilbene | KSN; FB368 | 5242-49-9 | C29H20N2O2 |  | 8.05 |
| 1,4-Bis(2-benzoxazolyl)naphthalene | KCB; FB 367 | 5089-22-5 | C24H14N2O2 |  | 6.15 |
| 7-Diethylamino-4-methylcoumarin | SWN; FB 52; FB 140 | 91-44-1 | C14H17NO2 | 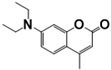 | 3.22 |
| 1,2-Bis(5-methyl-2-benzoxazolyl)ethylene | PF; DT; FB 135 | 1041-00-5 | C18H14N2O2 |  | 5.07 |
| 2,5-Bis(5-tert-butyl-2-benzoxazolyl)thiophene | OB; FB 184 | 7128-64-5 | C26H26N2O2S |  | 8.61 |
| 4,4′-Bis(2-benzoxazolyl)stilbene | OB-1; FB 393 | 1533-45-5 | C28H18N2O2 | 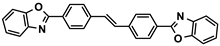 | 7.5 |
| 4,4′-Bis(5-methyl-2-benzoxazolyl)stilbene | OB-2 | 2397-00-4 | C30H22N2O2 |  | 8.6 |
| 1,4-Bis(2-cyanostyryl)benzene | ER-I; FB 199 | 13001-39-3 | C24H16N2 | 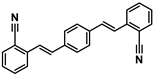 | 6.15 |
| 1-(2-Cyanostyryl)-4-(4-cyanostyryl)benzene | ER-II | 13001-38-2 | C24H16N2 | 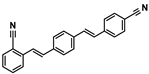 | 6.15 |
| 1,4-Bis(4-cyanostyryl)benzene | ER-III | 13001-40-6 | C24H16N2 | 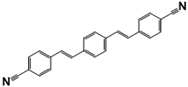 | 6.15 |
| 4,4′-Bis(2-methoxystyryl)biphenyl | FP; FB 378 | 40470-68-6 | C30H26O2 | 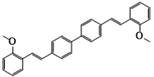 | 8.98 |
| 4-Methoxy-N-methyl-1,8-naphthalimide | AT; FB 162 | 3271-05-4 | C14 H11NO3 |  | 2.28 |
| 2,2′-(2,5-Thiophenediyl)bis-benzoxazole | EBF; FB 185 | 2866-43-5 | C18H10N2O2S | 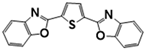 | 4.79 |
| Analyte | Precursor Ion | Product Ion | CE 1 (eV) | DP 2 (V) |
|---|---|---|---|---|
| KSN | 429.1 | 221.3 * 321.1 | 52 54 | 30 30 |
| KCB | 363.1 | 65 * 269.2 | 78 56 | 220 220 |
| SWN | 232.1 | 160.1 * 188.1 | 48 40 | 161 188 |
| PF | 291.1 | 107 * 77.1 | 37 73 | 210 210 |
| OB | 431.2 | 385.1 * 399.2 | 80 75 | 86 86 |
| OB-1 | 415.1 | 415.1 * 321.2 | 50 55 | 30 30 |
| OB-2 | 443.3 | 335.2 * 336.2 | 55 49 | 30 30 |
| ER-I/II/III | 331.1 | 315.9 * 217.1 | 33 40 | 100 100 |
| FP | 419.2 | 119.1 * 91.1 | 37 57 | 80 80 |
| AT | 242 | 127.2 * 185 | 45 28 | 182 183 |
| EBF | 319.1 | 65.1 * 226 | 65 46 | 75 76 |
References
- Han, Y.; Luo, Y.; Chen, L.; Huang, Z.; Ji, X. Application and Progress in determination method of Fluorescent Brightener in Textiles. China Fiber Insp. 2016, 12, 68–70. [Google Scholar]
- Cardamone, J.M.; Marmer, W.N. The Whitening of Textiles. In Chemistry of the Textiles Industry; Carr, C.M., Ed.; Springer: Dordrecht, The Netherlands, 1995; pp. 46–101. ISBN 978-94-011-0595-8. [Google Scholar]
- Murray, S.G. Dyes and Fluorescent Whitening Agents for Paper. In Paper Chemistry; Roberts, J.C., Ed.; Springer: Dordrecht, The Netherlands, 1996; pp. 161–193. ISBN 978-94-011-0605-4. [Google Scholar]
- Wu, Z.; Xu, Y.; Li, M.; Guo, X.; Xian, Y.; Dong, H. Simultaneous Determination of Fluorescent Whitening Agents (FWAs) and Photoinitiators (PIs) in Food Packaging Coated Paper Products by the UPLC-MS/MS Method Using ESI Positive and Negative Switching Modes. Anal. Methods 2016, 8, 1052–1059. [Google Scholar] [CrossRef]
- Wu, Y.; Xian, Y.; Guo, X.; Chen, L.; Zhao, X.; Wang, B.; Wang, L. Development and Validation of a Screening and Quantification Method for Simultaneous Determination of Seven Fluorescent Whitening Agents in Commercial Flour Using UPLC–MS/MS. Food Chem. 2018, 243, 162–167. [Google Scholar] [CrossRef] [PubMed]
- Wu, Q.; He, B.; Guo, R.; Cui, J.; Yan, S.; Liu, D.; Yao, B. Fluorescent Whitening Agents in Baiyangdian Lake in North China: Analysis, Occurrence, Distribution and Ecological Risk Assessment. Environ. Pollut. 2021, 291, 118235. [Google Scholar] [CrossRef] [PubMed]
- Fluorescent Whitening Agent Manufacturers: Industry Overview, Production Status and Development Trend-Lianda Fluorescent Technology Co. Available online: https://www.csldhg.com/tech/510.html (accessed on 22 February 2025).
- Jung, H.; Seok, S.-H.; Han, J.-H.; Abdelkader, T.S.; Kim, T.-H.; Chang, S.-N.; Ko, A.-S.; Choi, S.-K.; Lee, C.-R.; Seo, J.-E.; et al. Effect of Fluorescent Whitening Agent on the Transcription of Cell Damage-Related Genes in Zebrafish Embryos. J. Appl. Toxicol. 2012, 32, 654–661. [Google Scholar] [CrossRef] [PubMed]
- Gloxhuber, C.; Bloching, H. Toxicologic Properties of Fluorescent Whitening Agents. Clin. Toxicol. 1978, 13, 171–203. [Google Scholar] [CrossRef] [PubMed]
- Gloxhuber, C.; Hecht, G.; Kimmerle, G. Toxikologische Untersuchungen mit Aufhellern (Blankophor®-Typen). Arch. Toxikol. 1962, 19, 302–312. [Google Scholar] [CrossRef]
- Bingham, E.; Falk, H.L. Combined Action of Optical Brighteners and Ultraviolet Light in the Production of Tumours. Food Cosmet. Toxicol. 1970, 8, 173–176. [Google Scholar] [CrossRef]
- US EPA. Assessing and Managing Chemicals Under TSCA. Available online: https://www.epa.gov/assessing-and-managing-chemicals-under-tsca (accessed on 22 February 2025).
- GB 43631-2023; National Standardization Technical Committee of Paper Industry Basic Safety Technical Specification for Paper Products for Infants, Toddlers and Children. Standards Press of China: Beijing, China, 2023.
- GB/T 27728-2011; National Standardization Technical Committee of Paper Industry Wipe. Standards Press of China: Beijing, China, 2011.
- Zeng, L.; Han, X.; Pang, S.; Ge, J.; Feng, Z.; Li, J.; Du, B. Nationwide Occurrence and Unexpected Severe Pollution of Fluorescent Brighteners in the Sludge of China: An Emerging Anthropogenic Marker. Environ. Sci. Technol. 2023, 57, 3156–3165. [Google Scholar] [CrossRef]
- Chen, H.; Han, X.; Zhu, C.; Du, B.; Tan, L.; He, R.; Shen, M.; Liu, L.-Y.; Zeng, L. Identification of Fluorescent Brighteners as Another Emerging Class of Abundant, Ubiquitous Pollutants in the Indoor Environment. Environ. Sci. Technol. 2022, 56, 10131–10140. [Google Scholar] [CrossRef] [PubMed]
- Pan, Q.; Xie, J.; Lin, L.; Hong, M.-S.; Wang, X.-C.; Sun, S.-Q.; Xu, C.-H. Direct Identification and Quantitation of Fluorescent Whitening Agent in Wheat Flour Based on Multi-Molecular Infrared (MM-IR) Spectroscopy and Stereomicroscopy. Spectrochim. Acta Part A Mol. Biomol. Spectrosc. 2021, 250, 119353. [Google Scholar] [CrossRef] [PubMed]
- Stoll, J.-M.A.; Giger, W. Determination of Detergent-Derived Fluorescent Whitening Agent Isomers in Lake Sediments and Surface Waters by Liquid Chromatography. Anal. Chem. 1997, 69, 2594–2599. [Google Scholar] [CrossRef] [PubMed]
- Liao, H. Simultaneous Determination of Four Fluorescent Whitening Agents (Including Trans and Cis Isomers) in Facial Mask by Dispersive Solid-Phase Extraction Combined with Ultra High Performance Liquid Chromatography and Diode Array Detection. J. Sep. Sci. 2016, 39, 3683–3689. [Google Scholar] [CrossRef] [PubMed]
- Xia, L.; Chen, X.; Xiao, X.; Li, G. Magnetic-Covalent Organic Polymer Solid-Phase Extraction Coupled with High-Performance Liquid Chromatography for the Sensitive Determination of Fluorescent Whitening Agents in Cosmetics. J. Sep. Sci. 2018, 41, 3733–3741. [Google Scholar] [CrossRef] [PubMed]
- Żwir-Ferenc, A.; Biziuk, M. Solid Phase Extraction Technique—Trends, Opportunities and Applications. Pol. J. Environ. Stud. 2006, 15, 677–690. [Google Scholar]
- Oasis HLB 3 cc Vac Cartridge, 60 mg Sorbent per Cartridge, 30 μm, 100/pk. Available online: https://www.waters.com/nextgen/us/en/shop/sample-preparation--filtration/wat094226-oasis-hlb-3-cc-vac-cartridge-60-mg-sorbent-per-cartridge-30--m-1.html (accessed on 7 March 2025).
- Deng, M.; Liang, X.; Du, B.; Luo, D.; Chen, H.; Zhu, C.; Zeng, L. Beyond Classic Phthalates: Occurrence of Multiple Emerging Phthalate Alternatives and Their Metabolites in Human Milk and Implications for Combined Exposure in Infants. Environ. Sci. Technol. Lett. 2021, 8, 705–712. [Google Scholar] [CrossRef]
- Sun, Y.; Xie, H.; Du, B.; Li, J.; Liu, L.-Y.; Guo, Y.; Zeng, L. Widening the Lens on UV Filters: Newfound Ubiquity of Triazine UV Filters in Breast Milk from South China and Implications for Augmented “Cocktail” Exposure in Infants. Environ. Sci. Technol. Lett. 2022, 9, 844–850. [Google Scholar] [CrossRef]
- Captiva EMR-Lipid|HF|Lipid & Matrix Removal|Agilent. Available online: https://www.agilent.com/en/product/sample-preparation/filtration/captiva-emr-lipid#features (accessed on 5 March 2025).
| Analyte | Linear Range (ng/mL) | R2 | MDL (ng/mL) | MQL (ng/mL) | Blank (ng/mL) | ME (%) | Recovery Rate (%) | RSD (%) |
|---|---|---|---|---|---|---|---|---|
| KSN | 0.070–50 | 0.998 | 0.021 | 0.070 | nd 1 | 81 | 69 | 5 |
| KCB | 0.233–50 | 0.995 | 0.070 | 0.233 | nd | 72 | 70 | 3 |
| SWN | 0.019–50 | 0.995 | 0.006 | 0.019 | nd | 73 | 61 | 5 |
| PF | 0.017–50 | 0.998 | 0.005 | 0.017 | nd | 100 | 92 | 6 |
| OB | 0.011–50 | 0.996 | 0.007 | 0.022 | 0.017 | 83 | 80 | 7 |
| OB-1 | 0.024–50 | 0.992 | 0.007 | 0.024 | nd | 79 | 67 | 6 |
| OB-2 | 0.261–50 | 0.992 | 0.078 | 0.261 | nd | 87 | 76 | 11 |
| ER-I/II/III | 0.116–50 | 0.995 | 0.035 | 0.116 | nd | 91 | 89 | 8 |
| FP | 0.348–50 | 0.992 | 0.105 | 0.348 | nd | 79 | 67 | 1 |
| AT | 0.012–50 | 0.999 | 0.004 | 0.012 | nd | 94 | 98 | 8 |
| EBF | 0.015–50 | 0.997 | 0.005 | 0.017 | 0.016 | 85 | 90 | 4 |
| Analyte | DF 1 (%) | GM 2 | Median | Mean | Range | AP 3 (%) |
|---|---|---|---|---|---|---|
| OB-1 | 100 | 0.058 | 0.061 | 0.069 | <MQL to 0.132 | 28.0 |
| EBF | 50 | <MQL | <MQL | <MQL | <MQL to 0.021 | 2.8 |
| KSN | 50 | <MQL | <MQL | <MQL | <MQL to 0.151 | 18.5 |
| ER-I/II/III | 40 | <MQL | <MQL | <MQL | <MQL to 0.131 | 17.5 |
| OB | 20 | <MQL | <MQL | <MQL | <MQL to 0.033 | 2.6 |
| SWN | 10 | <MQL | <MQL | <MQL | <MQL to 0.023 | 1.8 |
| FP | 10 | <MQL | <MQL | <MQL | <MQL to 0.405 | 28.7 |
| AT | 10 | <MQL | <MQL | <MQL | <MQL | - |
| KCB | 0 | <MQL | <MQL | <MQL | <MQL | - |
| PF | 0 | <MQL | <MQL | <MQL | <MQL | - |
| OB-2 | 0 | <MQL | <MQL | <MQL | <MQL | - |
| ∑13FBs | - | 0.333 | 0.320 | 0.354 | 0.221 to 0.684 | 100 |
Disclaimer/Publisher’s Note: The statements, opinions and data contained in all publications are solely those of the individual author(s) and contributor(s) and not of MDPI and/or the editor(s). MDPI and/or the editor(s) disclaim responsibility for any injury to people or property resulting from any ideas, methods, instructions or products referred to in the content. |
© 2025 by the authors. Licensee MDPI, Basel, Switzerland. This article is an open access article distributed under the terms and conditions of the Creative Commons Attribution (CC BY) license (https://creativecommons.org/licenses/by/4.0/).
Share and Cite
Yan, Y.; Liang, B.; Yang, J.; Deng, Q.; Liang, X.; Chen, H.; Du, B.; Zeng, L. Determination of Multiple Fluorescent Brighteners in Human Plasma Using Captiva EMR-Lipid Clean-Up and LC-MS/MS Analysis. Toxics 2025, 13, 352. https://doi.org/10.3390/toxics13050352
Yan Y, Liang B, Yang J, Deng Q, Liang X, Chen H, Du B, Zeng L. Determination of Multiple Fluorescent Brighteners in Human Plasma Using Captiva EMR-Lipid Clean-Up and LC-MS/MS Analysis. Toxics. 2025; 13(5):352. https://doi.org/10.3390/toxics13050352
Chicago/Turabian StyleYan, Yubing, Bowen Liang, Jiawen Yang, Qing Deng, Xiaoying Liang, Hui Chen, Bibai Du, and Lixi Zeng. 2025. "Determination of Multiple Fluorescent Brighteners in Human Plasma Using Captiva EMR-Lipid Clean-Up and LC-MS/MS Analysis" Toxics 13, no. 5: 352. https://doi.org/10.3390/toxics13050352
APA StyleYan, Y., Liang, B., Yang, J., Deng, Q., Liang, X., Chen, H., Du, B., & Zeng, L. (2025). Determination of Multiple Fluorescent Brighteners in Human Plasma Using Captiva EMR-Lipid Clean-Up and LC-MS/MS Analysis. Toxics, 13(5), 352. https://doi.org/10.3390/toxics13050352