
Insights into Elemental Composition and Sources of Fine and Coarse Particulate Matter in Dense Traffic Areas in Toronto and Vancouver, Canada


Abstract
:1. Introduction
2. Experimental
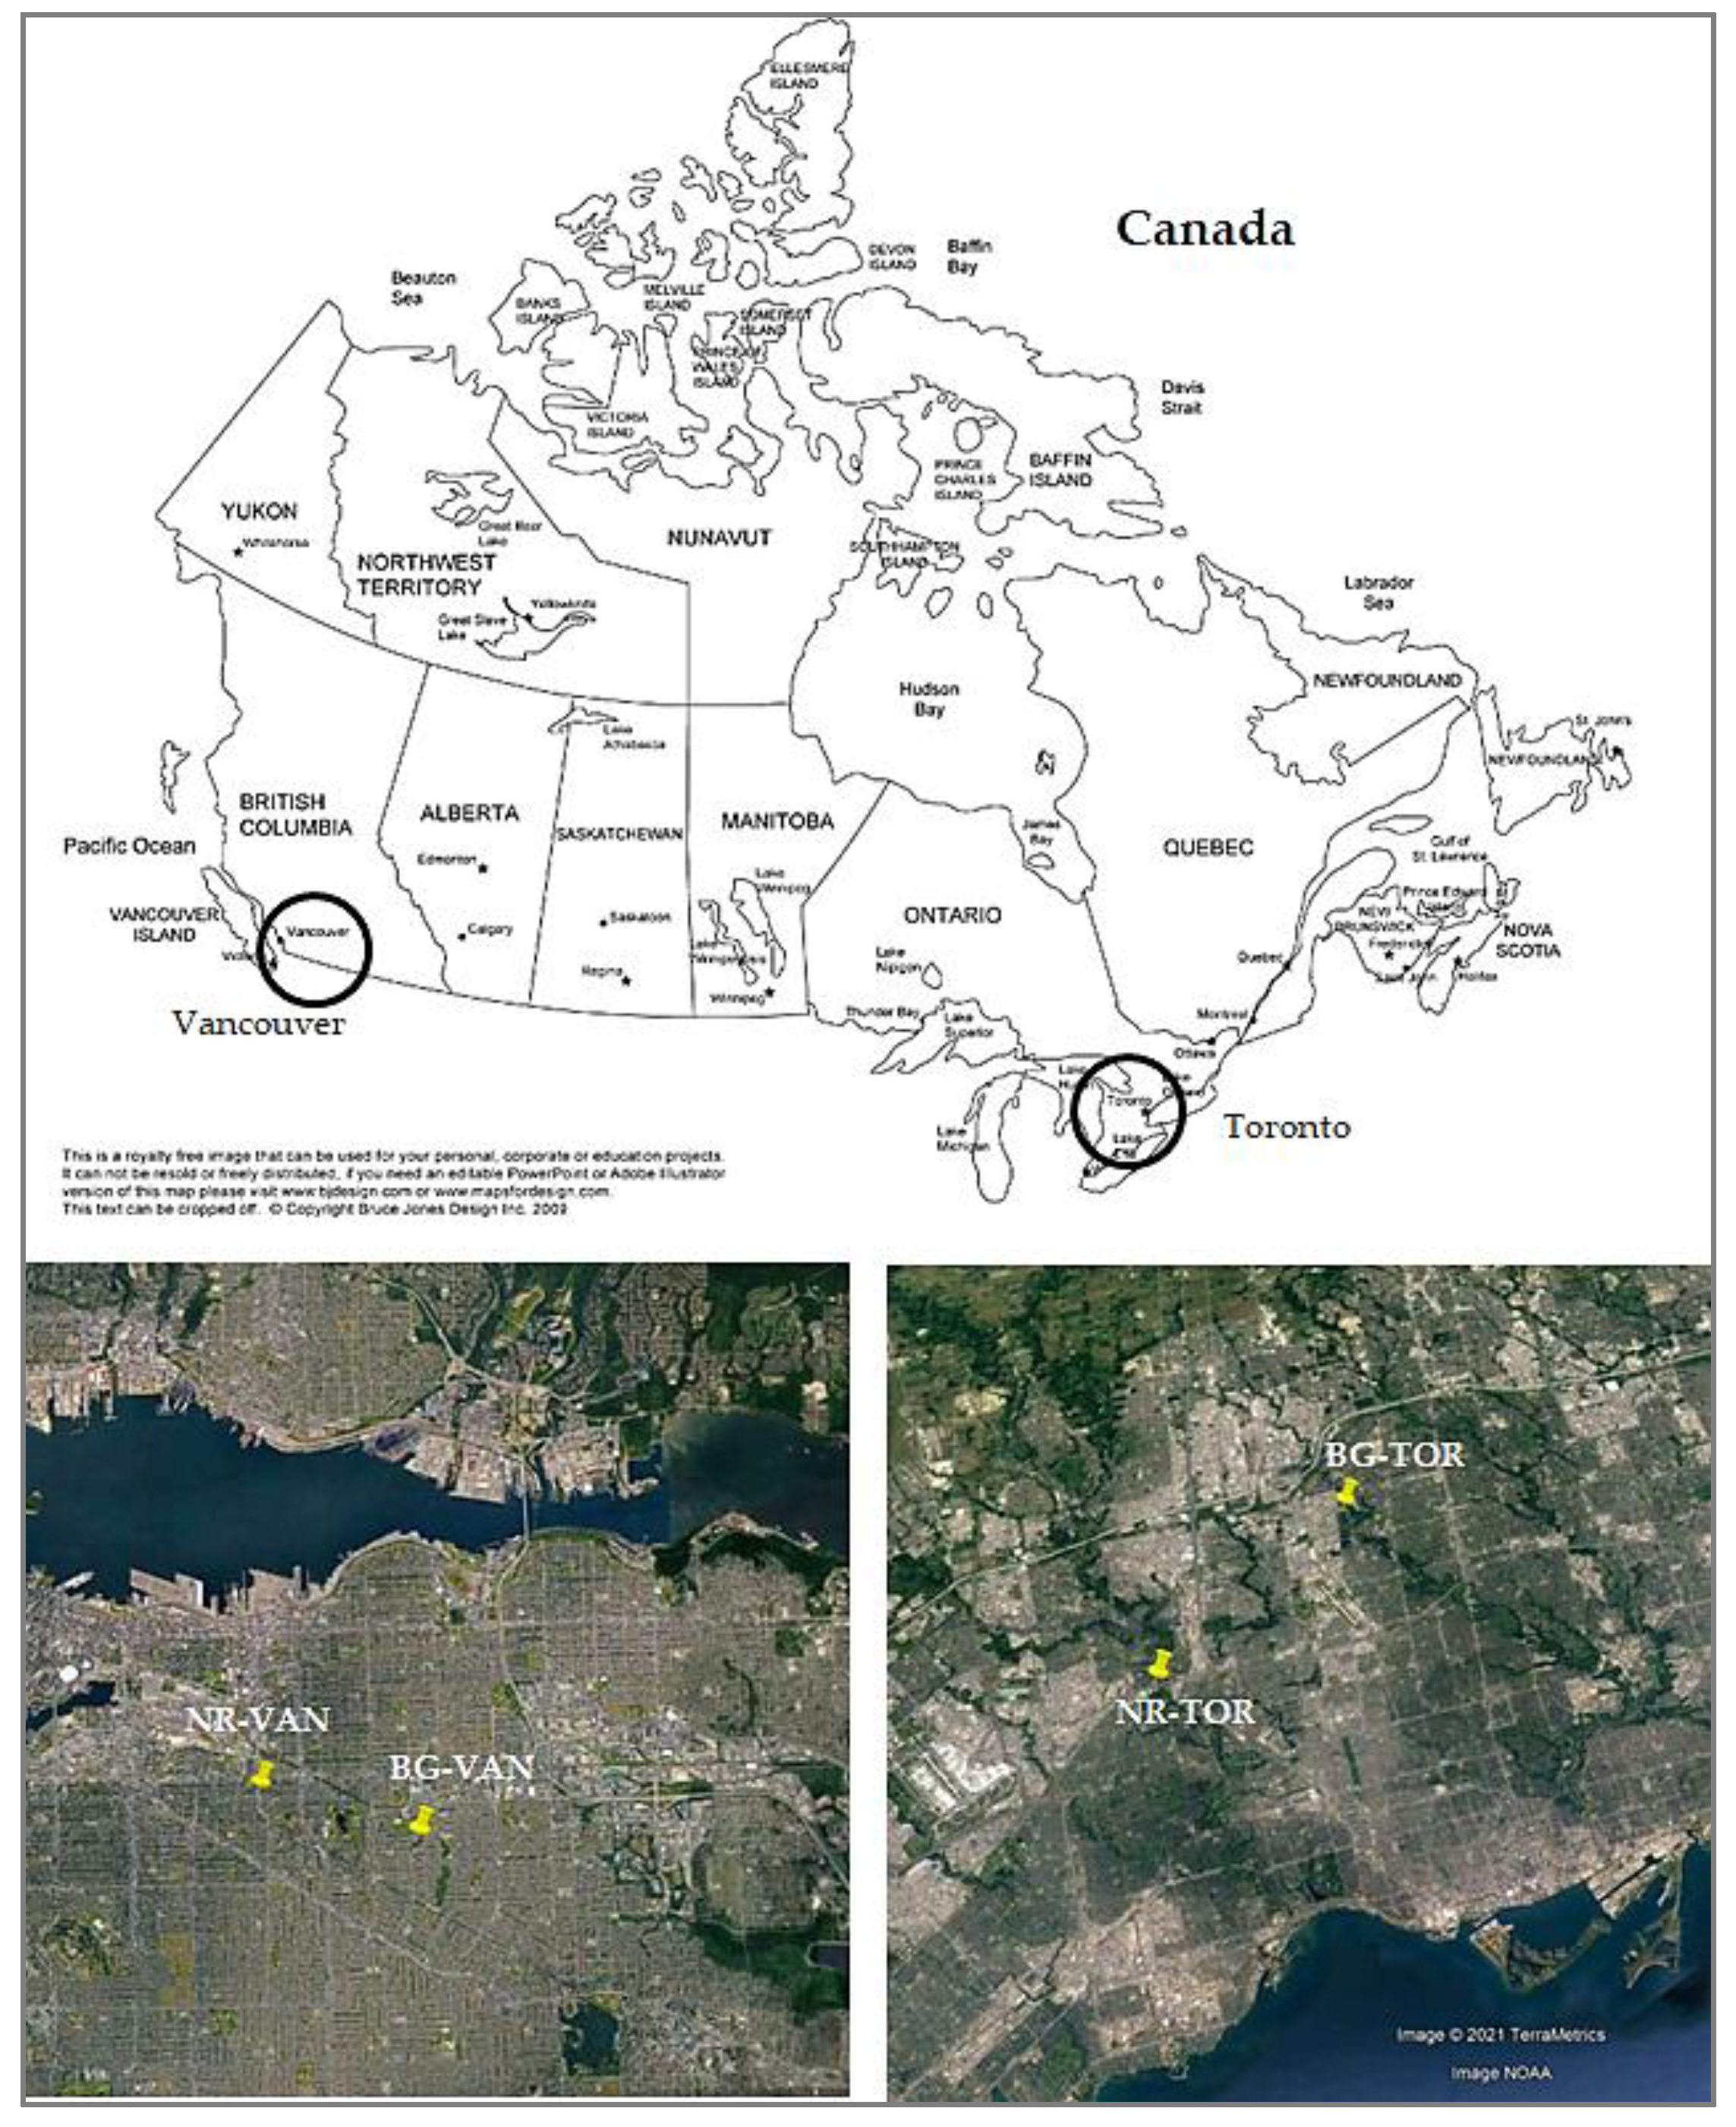
2.1. Sampling Sites
2.2. Sampling and Elemental Analysis
2.3. Data Analysis and Processing
2.4. Positive Matrix Factorization Analysis
3. Results and Discussion
3.1. PM Levels
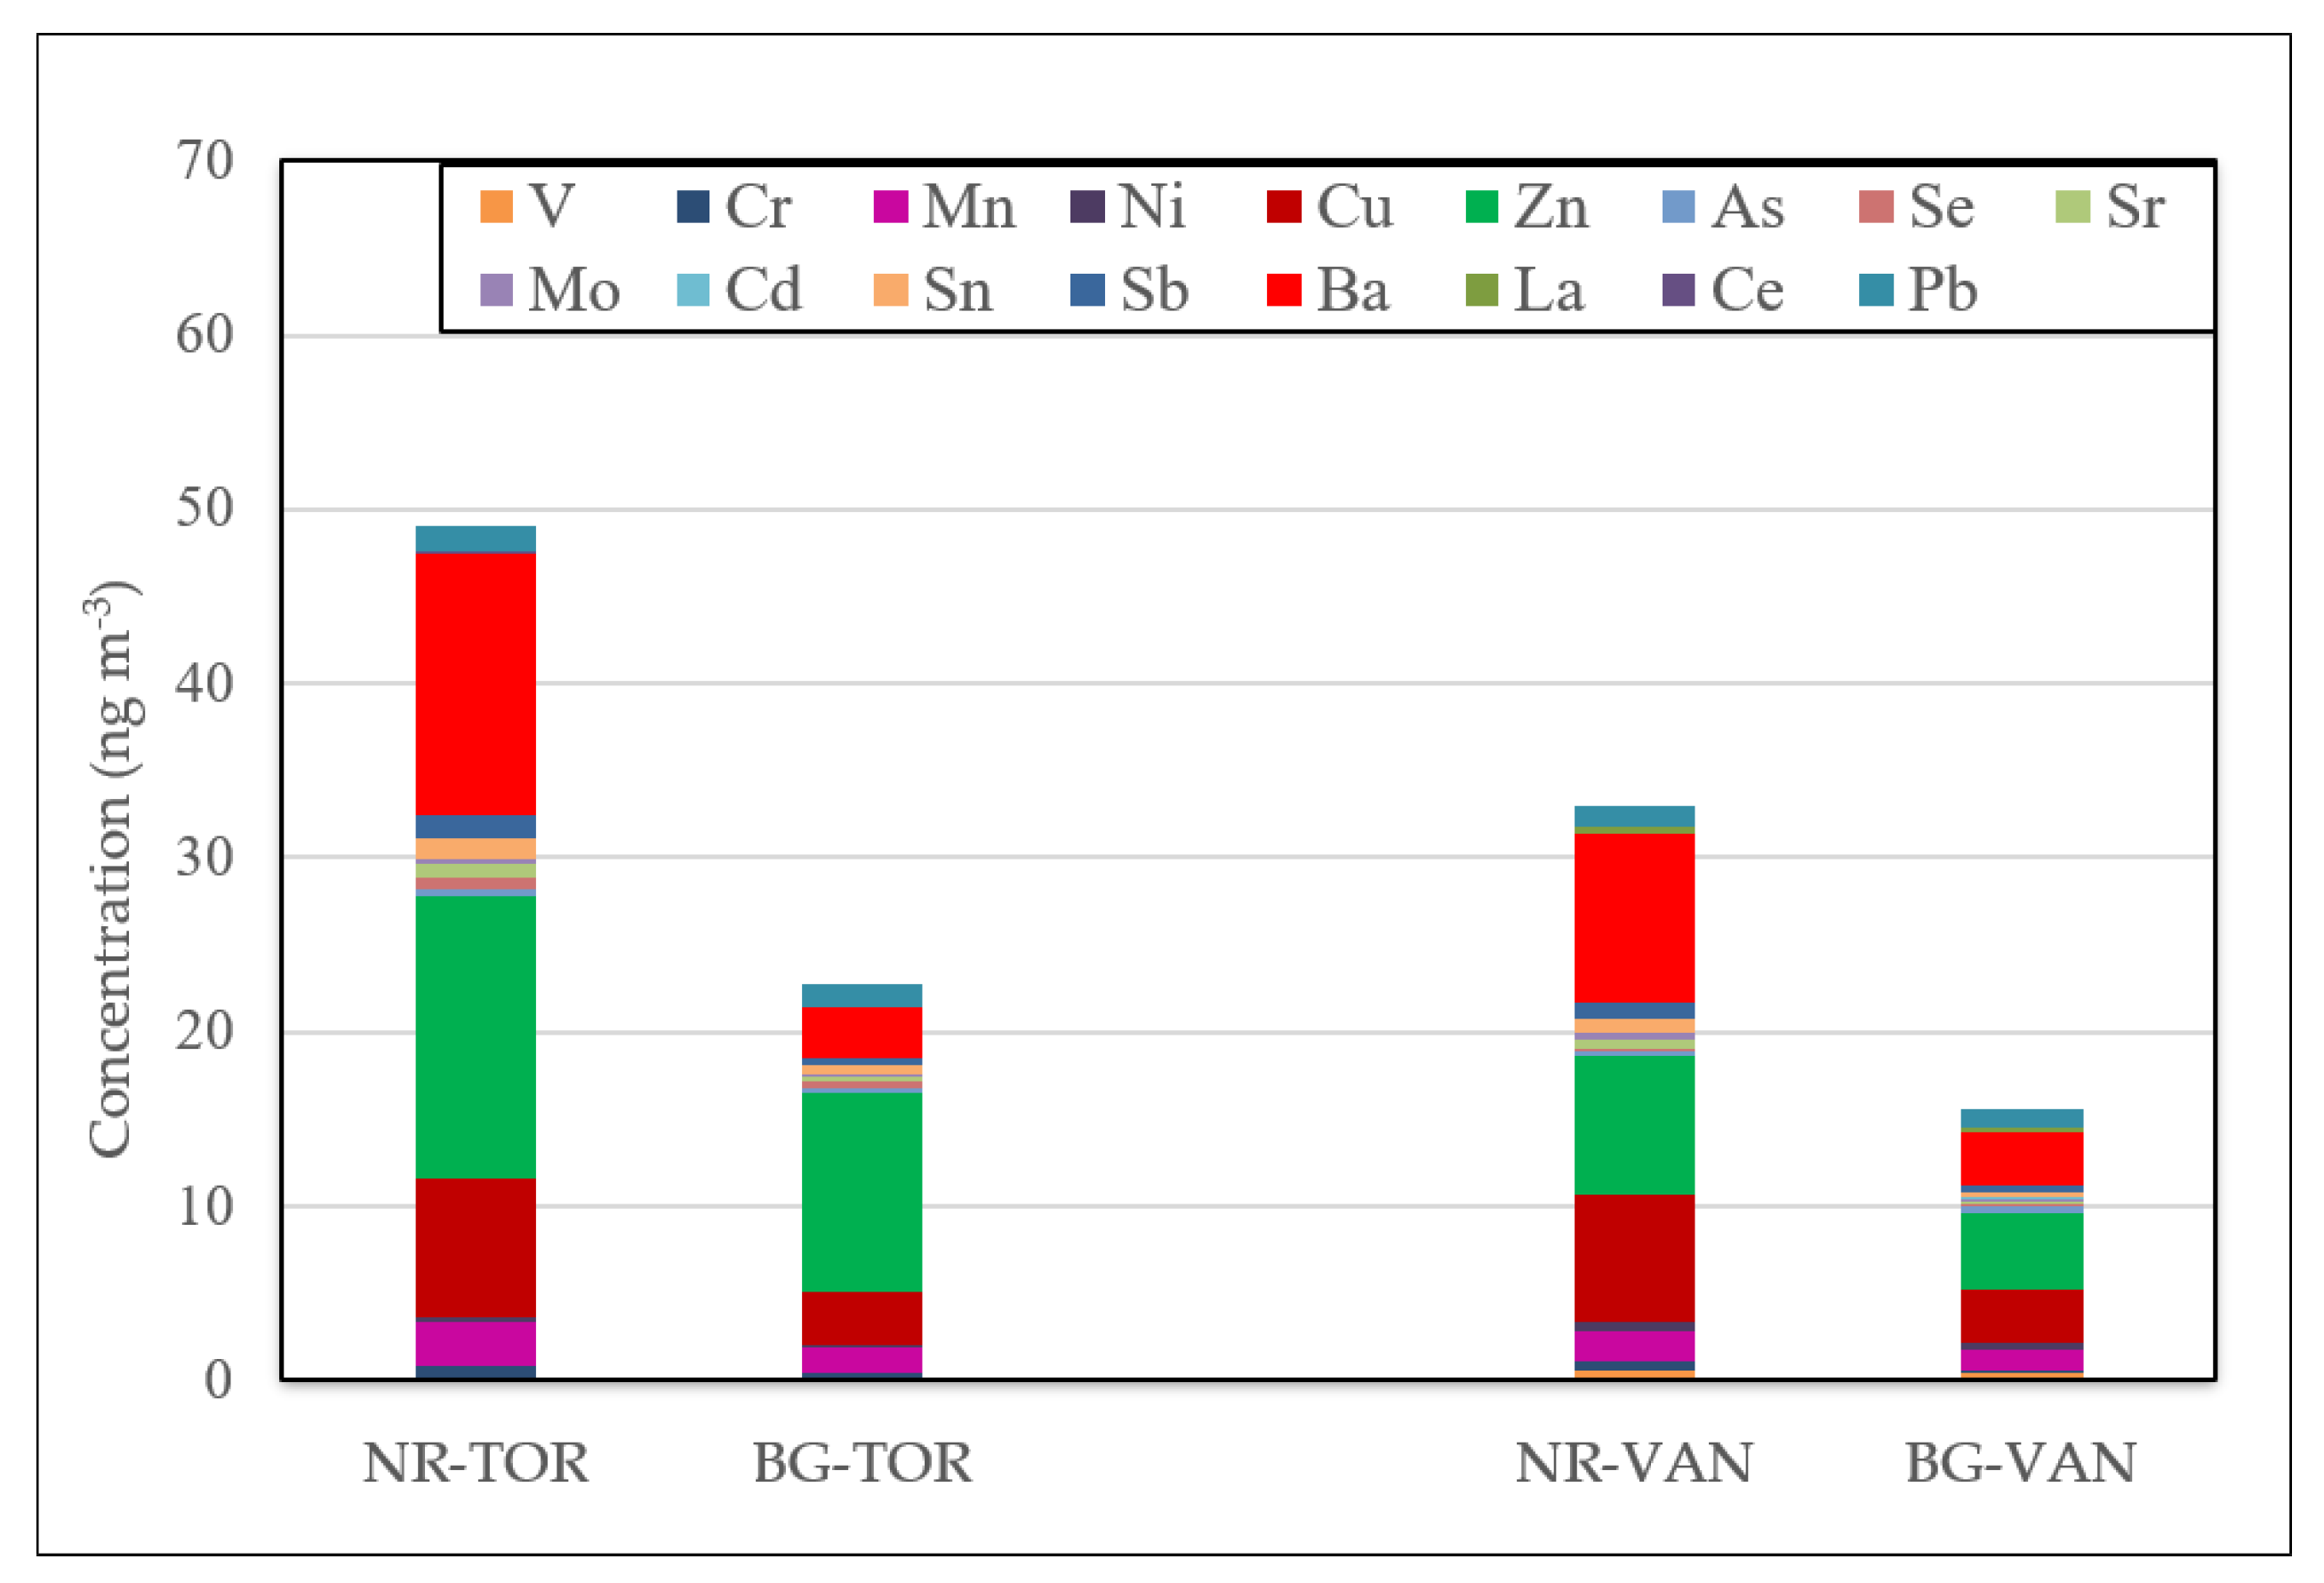
3.2. Elemental Concentrations
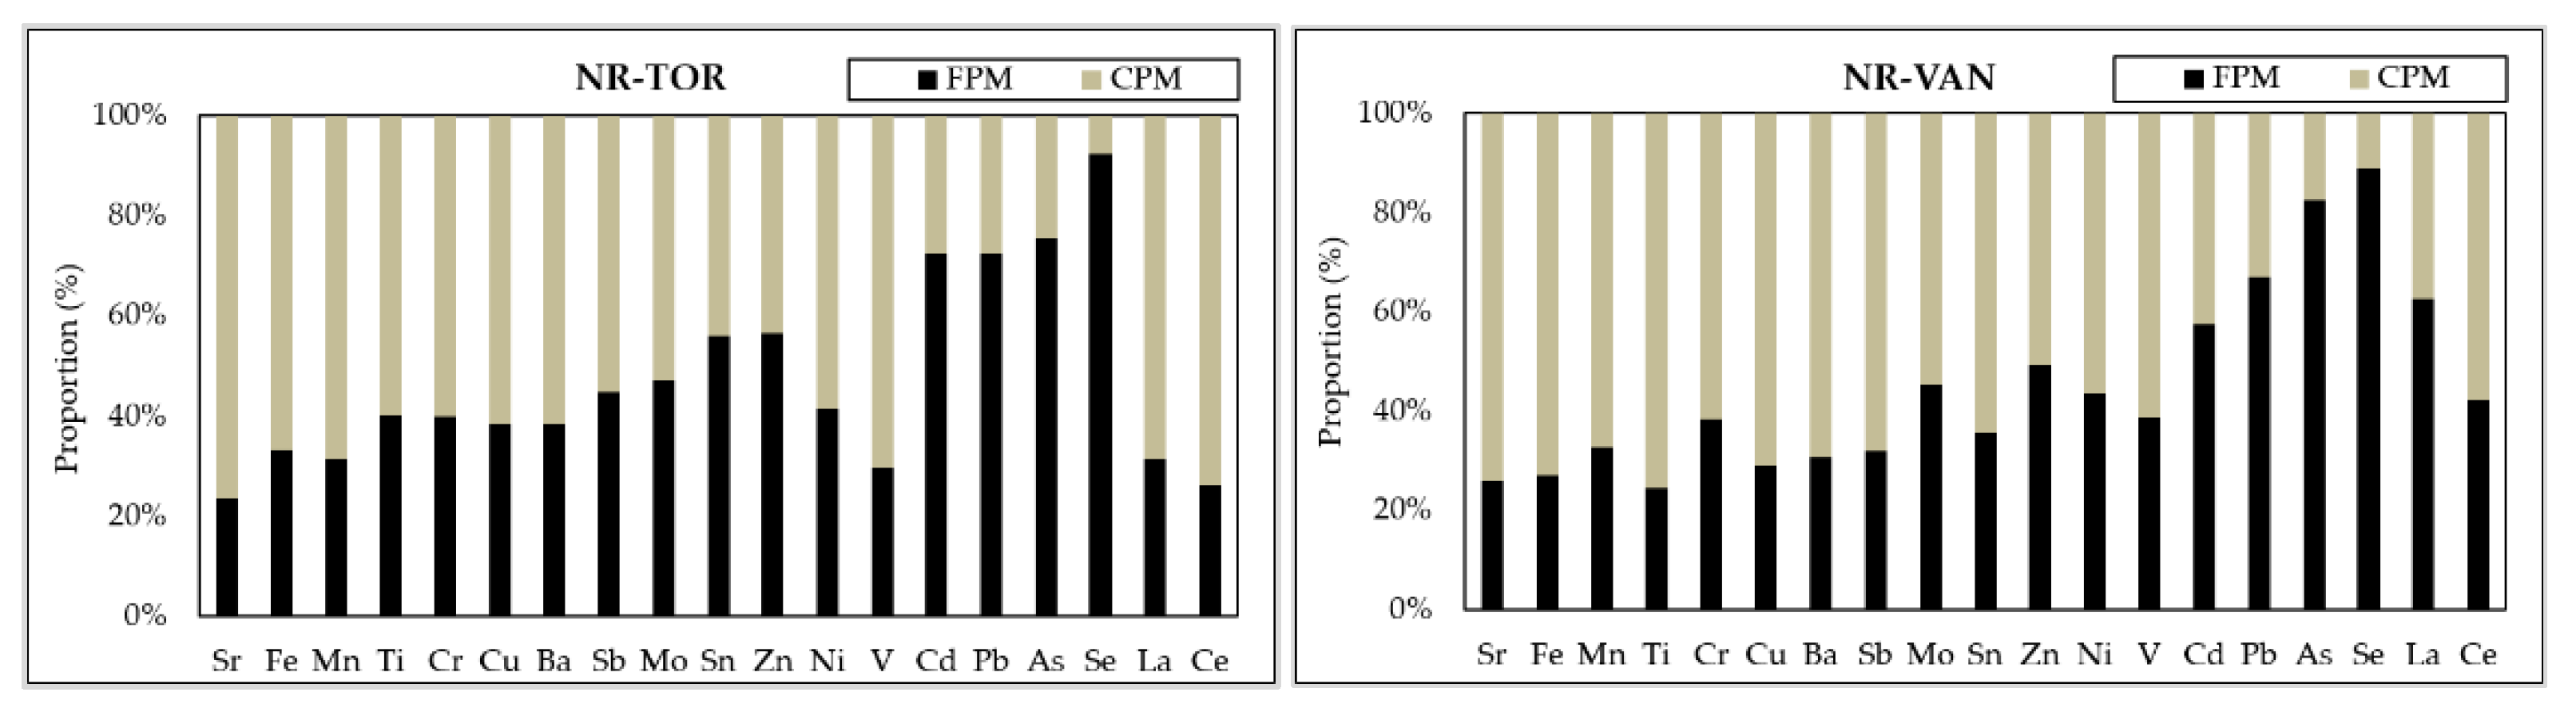
3.2.1. Fine/Coarse Distribution of Elements
3.2.2. Water-Soluble Metal(oids)
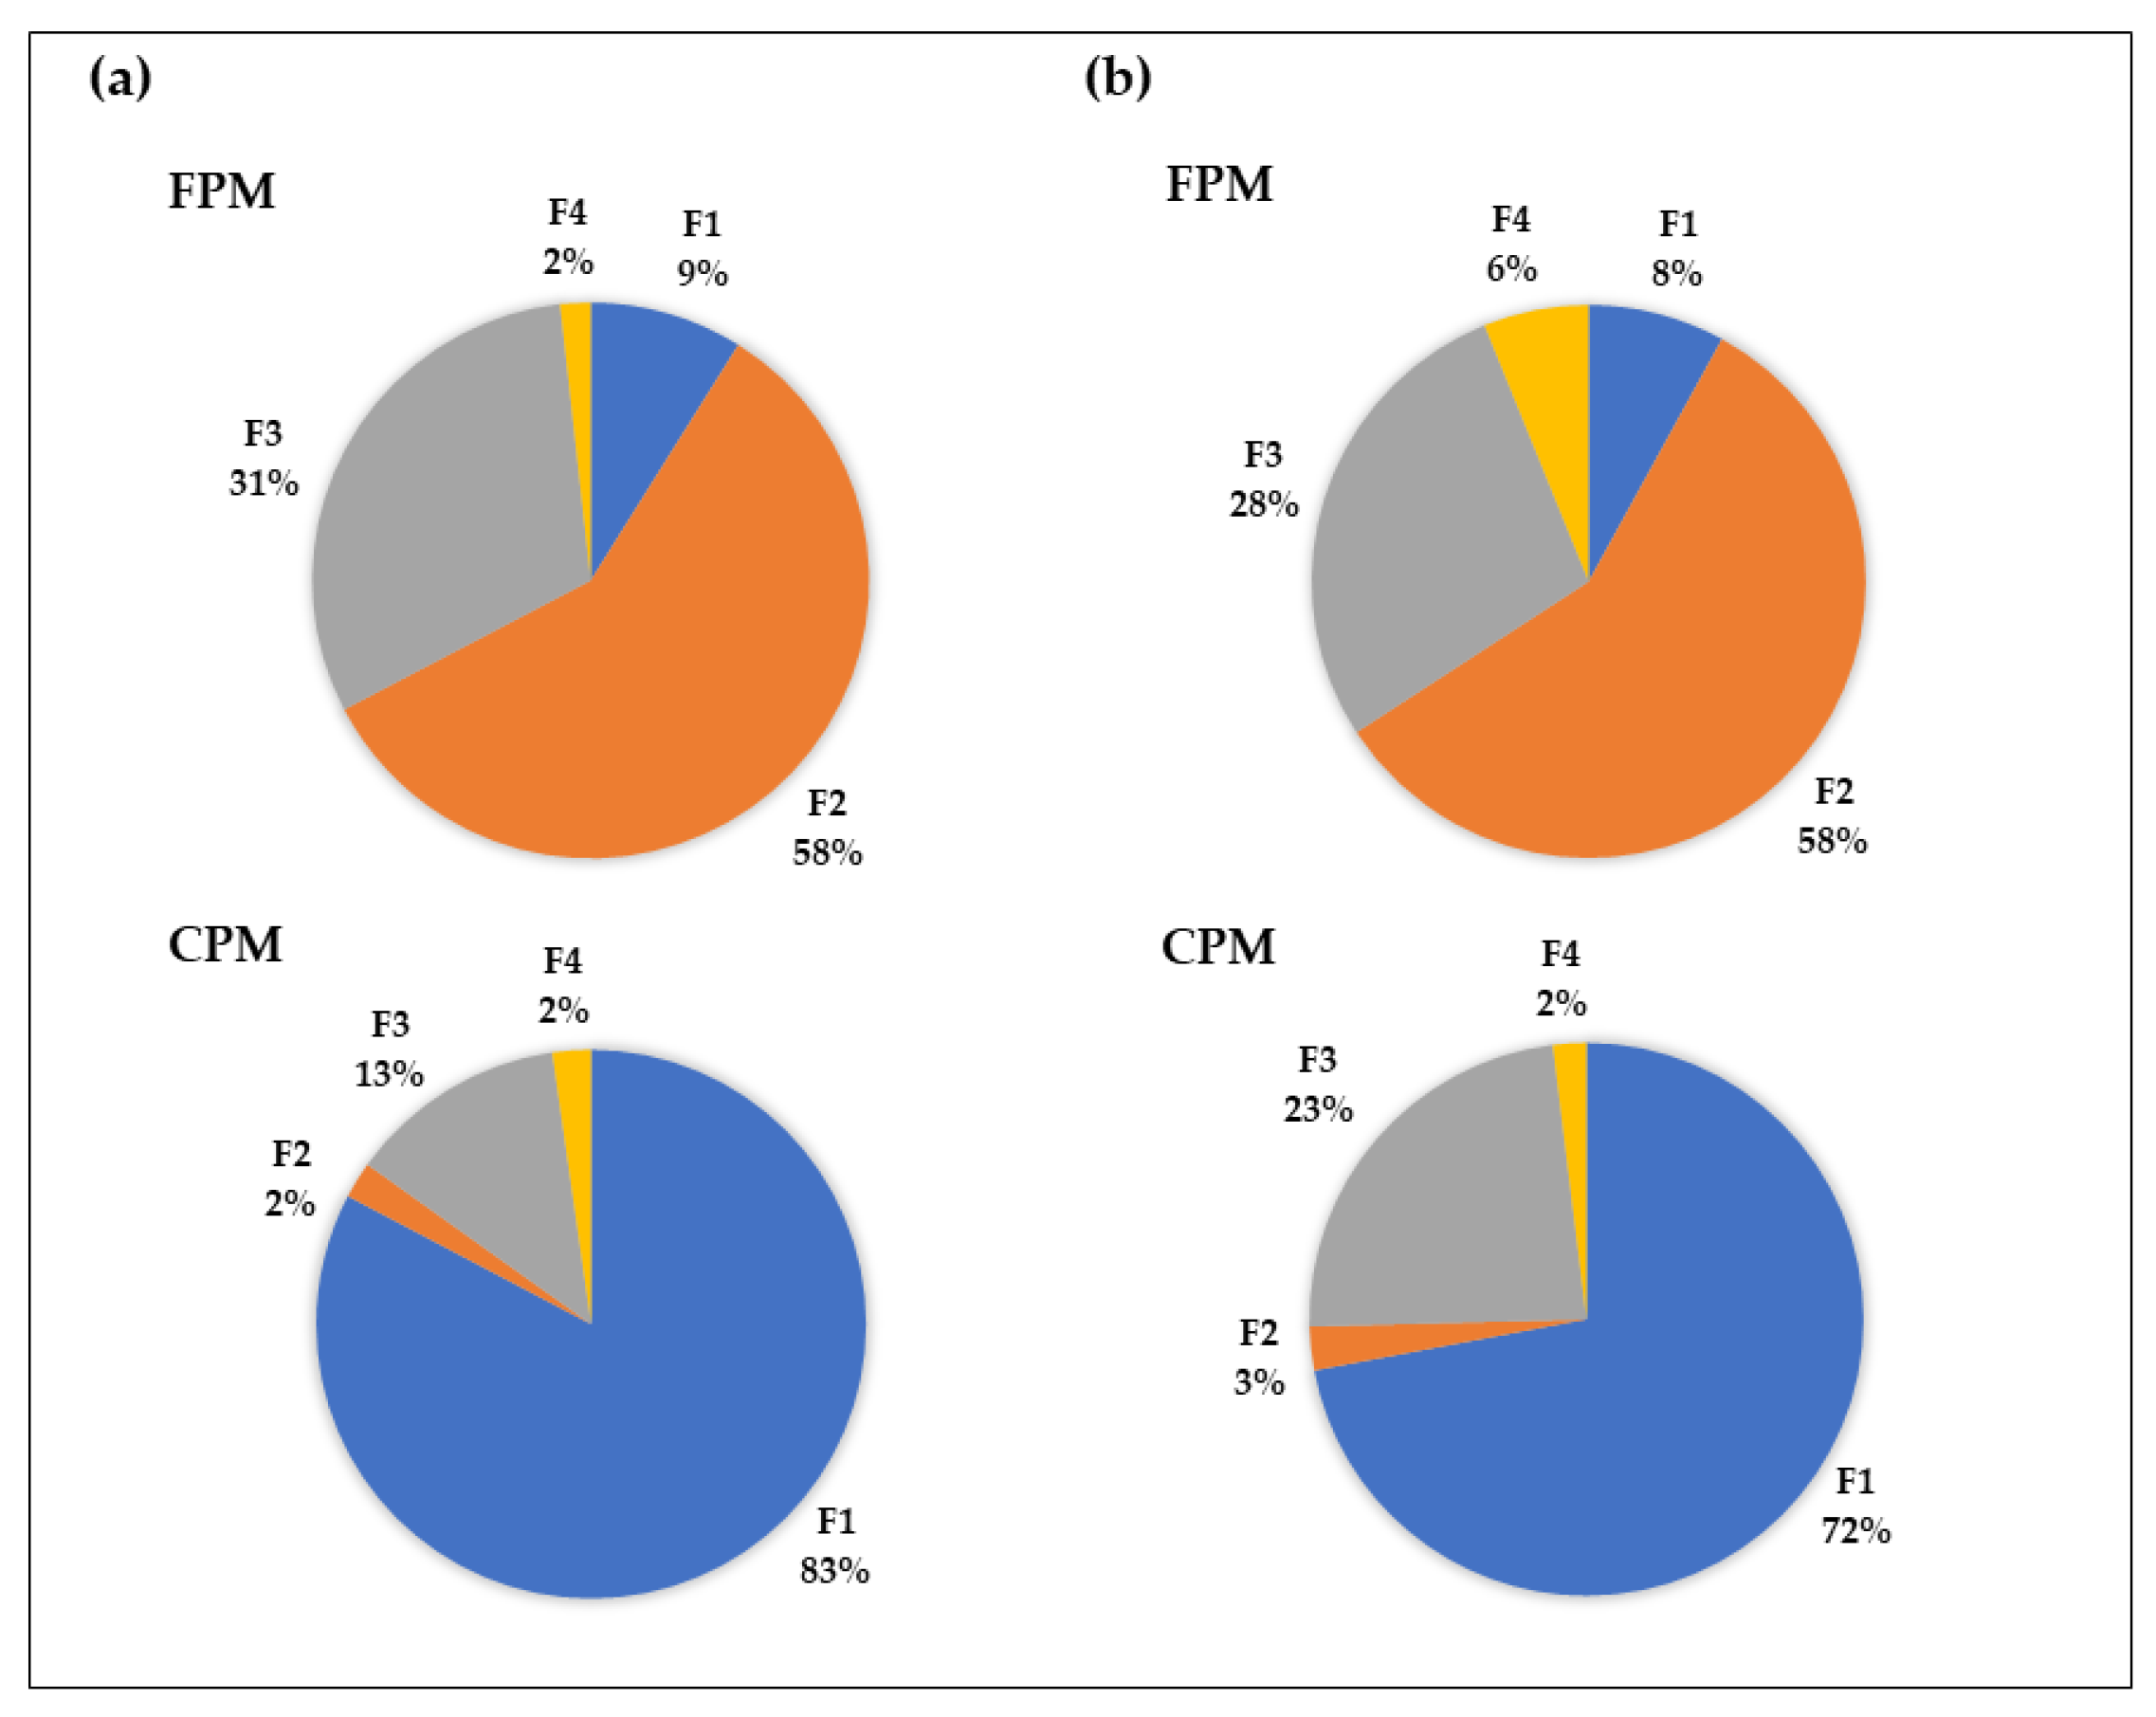
3.3. Source Identification and Apportionment of Trace Elements in Fine and Coarse PM
3.3.1. Factor 1: Non-Exhaust: Mineral/Road Dust
3.3.2. Factor 2: Regional/Local Industry
3.3.3. Factor 3: Non-Exhaust: Brake/Tire Wear
3.3.4. Factor 4: Unexplained
4. Conclusions
Supplementary Materials
Author Contributions
Funding
Institutional Review Board Statement
Informed Consent Statement
Data Availability Statement
Acknowledgments
Conflicts of Interest
References
- Health Effects Institute (HEI). Traffic-Related Air Pollution: A Critical Review of the Literature on Emissions, Exposure, and Health Effects, 101 Federal Street, Boston, MA, USA. 2010. Available online: https://www.healtheffects.org/publication/traffic-related-air-pollution-critical-review-literature-emissions-exposure-and-health (accessed on 31 May 2021).
- Bertollini, R.; Bose-O’Reilly, S.; Boufford, J.I.; Breysse, P.N.; Chiles, T.; Mahidol, C.; Cole-Seck, A.M.; Cropper, M.L.; Fobil, J.; Fuster, V.; et al. The Lancet Commission on pollution and health. Lancet 2017, 391, 462–512. [Google Scholar]
- Delfino, R.J.; Tjoa, T.; Gillen, D.L.; Staimer, N.; Polidori, A.; Arhami, M.; Jamner, L.; Sioutas, C.; Longhurst, J. Traffic-related air pollution and blood pressure in elderly subjects with coronary artery disease. Epidemiology 2010, 21, 396–404. [Google Scholar] [CrossRef] [PubMed] [Green Version]
- Brauer, M.; Reynolds, C.; Hystad, P. Traffic-related air pollution and health in Canada. CMAJ 2013, 185, 1557–1558. [Google Scholar] [CrossRef] [Green Version]
- Chen, H.; Goldberg, M.S.; Burnett, R.T.; Jerrett, M.; Wheeler, A.J.; Villeneuve, P.J. Long-term exposure to traffic-related air pollution and cardiovascular mortality. Epidemiology 2013, 24, 35–43. [Google Scholar] [CrossRef] [PubMed]
- Chen, H.; Kwong, J.C.; Copes, R.; Tu, K.; Villeneuve, P.J.; van Donkelaar, A.; Hystad, P.; Martin, R.V.; Murray, B.J.; Jessiman, B.; et al. Living near major roads and the incidence of dementia, Parkinson’s disease and multiple sclerosis: A population-based cohort study. Lancet 2017, 389, 718–726. [Google Scholar] [CrossRef]
- Thorpe, A.; Harrison, R.M. Sources and properties of non-exhaust particulate matter from road traffic: A review. Sci. Total Environ. 2008, 400, 270–282. [Google Scholar] [CrossRef]
- Pant, P.; Harrison, R.M. Estimation of contribution of road traffic emissions of particulate matter concentrations from field measurements: A review. Atmos. Environ. 2013, 77, 78–97. [Google Scholar] [CrossRef]
- Amato, F. Non-Exhaust Emissions—An Urban Air Quality Problem for Public Health, Impact and Mitigation Measures, 1st ed.; Academic Press: London, UK, 2018. [Google Scholar]
- OECD. Non-Exhaust Particulate Emissions from Road Transport: An Ignored Environmental Policy Challenge; OECD Publishing: Paris, France, 2020. [Google Scholar] [CrossRef]
- Harrison, R.M.; Allan, J.; Carruthers, D.; Heal, M.R.; Lewis, A.C.; Marner, B.; Murrells, T.; Williams, A. Non-exhaust vehicle emissions of particulate matter and VOC from road traffic: A review. Atmos. Environ. 2021, 262, 118592. [Google Scholar] [CrossRef]
- Harrison, R.M.; Vu, T.V.; Jafar, H.; Shi, Z. More mileage in reducing urban air pollution from road traffic. Environ. Int. 2021, 149, 106329. [Google Scholar] [CrossRef]
- Badaloni, C.; Cesaroni, G.; Cerza, F.; Davoli, M.; Brunekreef, B.; Forastiere, F. Effects of long-term exposure to particulate matter and metal components on mortality in the Rome longitudinal study. Environ. Int. 2017, 109, 146–154. [Google Scholar] [CrossRef]
- Eeftens, M.; Hoek, G.; Gruzieva, O.; Mölter, A.; Agius, R.; Beelen, R.; Brunekreef, B.; Custovic, A.; Cyrys, J.; Fuertes, E.; et al. Elemental composition of particulate matter and the association with lung function. Epidemiology 2014, 25, 648–657. [Google Scholar] [CrossRef] [Green Version]
- Thomson, E.M.; Breznan, D.; Karthikeyan, S.; MacKinnon-Roy, C.; Charland, J.-P.; Dabek-Zlotorzynska, E.; Celo, V.; Kumarathasan, P.J.R.; Vincent, R. Cytotoxic and inflammatory potential of size-fractionated particulate matter collected repeatedly within a small urban area. Part. Fibre Toxicol. 2015, 12, 1–19. [Google Scholar] [CrossRef] [PubMed] [Green Version]
- Valavanidis, A.; Fiotakis, K.; Vlachogianni, T. Airborne particulate matter and human health: Toxicological assessment and importance of size and composition of particles for oxidative damage and carcinogenic mechanisms. J. Environ. Sci. Health Part C Environ. Carcinog. Ecotoxicol. Rev. 2008, 26, 339–362. [Google Scholar] [CrossRef]
- Araujo, J.A. Particulate air pollution, systemic oxidative stress, inflammation, and atherosclerosis. Air Qual. Atmos. Health 2011, 4, 79–93. [Google Scholar] [CrossRef] [Green Version]
- Pardo, M.; Porat, Z.; Rudich, A.; Schauer, J.J.; Rudich, Y. Repeated exposures to roadside particulate matter extracts suppresses pulmonary defense mechanisms, resulting in lipid and protein oxidative damage. Environ. Pollut. 2016, 210, 227–237. [Google Scholar] [CrossRef]
- Shuster-Meiseles, T.; Shafer, M.M.; Heo, J.; Pardo, M.; Antkiewicz, D.S.; Schauer, J.J.; Rudich, A.; Rudich, Y. ROS-generating/ARE-activating capacity of metals in roadway particulate matter deposited in urban environment. Environ. Res. 2016, 146, 252–262. [Google Scholar] [CrossRef]
- Bates, J.T.; Fang, T.; Verma, V.; Zeng, L.; Weber, R.J.; Tolbert, P.E.; Abrams, J.Y.; Sarnat, S.E.; Klein, M.; Mulholland, J.A.; et al. Review of acellular assays of ambient particulate matter oxidative potential: Methods and relationships with composition, sources, and health effects. Environ. Sci. Technol. 2019, 58, 4003–4019. [Google Scholar] [CrossRef] [PubMed]
- Zhang, Z.; Weichenthal, S.; Kwong, J.C.; Burnett, R.T.; Hatzopoulou, M.; Jerrett, M.; Donkelaar, A.v.; Bai, L.; Martin, R.V.; Copes, R.; et al. Long-term exposure to iron and copper in fine particulate air pollution and their combined impact on reactive oxygen species concentration in lung fluid: A population-based cohort study of cardiovascular disease incidence and mortality in Toronto, Canada. Int. J. Epidemiol. 2020, 50, 589–601. [Google Scholar] [CrossRef] [PubMed]
- Szigeti, T.; Ovari, M.; Dunster, C.; Kelly, F.J.; Lucarelli, F.; Zaray, G. Changes in chemical composition and oxidative potential of urban PM2.5 between 2010 and 2013 in Hungary. Sci. Total Environ. 2015, 518–519, 534–544. [Google Scholar] [CrossRef]
- Shirmohammadi, F.; Hasheminassab, S.; Wang, D.; Saffari, A.; Schauer, J.J.; Shafer, M.M.; Delfino, R.J.; Sioutas, C. Oxidative potential of coarse particulate matter (PM10–2.5) and its relation to water solubility and sources of trace elements and metals in the Los Angeles Basin. Environ. Sci. Process. Impacts 2015, 17, 2110–2121. [Google Scholar] [CrossRef] [Green Version]
- Fang, T.; Guo, H.; Zeng, L.; Verma, V.; Nenes, A.; Weber, R.J. Highly acidic ambient particles, soluble metals, and oxidative potential: A link between sulfate and aerosol toxicity. Environ. Sci. Technol. 2017, 51, 2611–2620. [Google Scholar] [CrossRef]
- Shirmohammadi, F.; Wang, D.; Hasheminassab, S.; Verma, V.; Schauer, J.J.; Shafer, M.M.; Sioutas, C. Oxidative potential of on-road fine particulate matter (PM2.5) measured on major freeway of Los Angeles, CA, and a 10-year comparison with earlier studies. Atmos. Environ. 2017, 148, 102–114. [Google Scholar] [CrossRef]
- Mousavi, A.; Sowlat, M.H.; Sioutas, C. Diurnal and seasonal trends and source apportionment of redox-active metals in Los Angeles using a novel online metal monitor and Positive Matrix Factorization (PMF). Atmos. Environ. 2018, 174, 15–24. [Google Scholar] [CrossRef]
- Jeong, C.-H.; Traub, A.; Huang, A.; Hilker, N.; Wang, J.M.; Herod, D.; Dabek-Zlotorzynska, E.; Celo, V.; Evans, G. Long-term analysis of PM2.5 in Toronto during 2004–2017: Composition, sources, and oxidative potential. Environ. Pollut. 2020, 263, 114652. [Google Scholar] [CrossRef]
- Shahpoury, P.; Zhang, Z.W.; Arangio, A.; Celo, V.; Dabek-Zlotorzynska, E.; Harner, T.; Nenes, A. Oxidative potential of fine particulate matter—Implications of emission source sectors, particle chemical composition and acidity, and metal dissolution on oxidative potential of fine particulate matter and redox potential of the lung lining fluid. Environ. Int. 2021, 148, 106343. [Google Scholar] [CrossRef]
- Shivani; Gadi, R. Oxidative potential of ambient fine particulate matter for ranking of emission sources: An insight for emissions reductions. Air Qual. Atmos. Health 2021, 14, 1149–1153. [Google Scholar]
- Lough, G.C.; Schauer, J.J.; Park, J.-S.; Shafer, M.M.; DeMinter, J.T.; Weinstein, J.P. Emissions of metals associated with motor vehicle roadways. Environ. Sci. Technol. 2005, 39, 826–836. [Google Scholar] [CrossRef] [PubMed]
- Hays, M.D.; Cho, S.-H.; Baldauf, R.; Schauer, J.J.; Shafer, M. Particle size distributions of metal and non-metal elements in an urban near-highway environment. Atmos. Environ. 2011, 45, 925–934. [Google Scholar] [CrossRef]
- Harrison, R.M.; Jones, A.M.; Gietl, J.; Yin, J.; Green, D.C. Estimation of the contributions of brake dust, tire wear, and resuspension to nonexhaust traffic particles derived from atmospheric measurements. Environ. Sci. Technol. 2012, 46, 6523–6529. [Google Scholar] [CrossRef]
- Kam, W.; Liacos, J.W.; Schauer, J.J.; Delfino, R.J.; Sioutas, C. Size-segregated composition of particulate matter (PM) in major roadways and surface streets. Atmos. Environ. 2012, 55, 90–97. [Google Scholar]
- Enroth, J.; Saarikoski, S.; Niemi, J.; Kusa, A.; Jezek, I.; Mocnik, G.; Carbone, S.; Kuuluvainen, H.; Ronkko, T.; Hillamo, R.; et al. Chemical and physical characterization of traffic particles in four different highway environment in the Helsinki metropolitan area. Atmos. Chem. Phys. 2016, 16, 5497–5512. [Google Scholar] [CrossRef] [Green Version]
- Cahill, T.A.; Barnes, D.E.; Lawton, J.A.; Miller, R.; Spada, N.; Willis, R.D.; Kimbrough, S. Transition metals in coarse, fine, very fine and ultra-fine particles from an interstate highway transect near Detroit. Atmos. Environ. 2016, 145, 158–175. [Google Scholar] [CrossRef]
- Lawrence, S.; Sokhi, R.; Ravindra, K. Quantification of vehicle fleet PM10 particulate matter emission factors from exhaust and non-exhaust sources using tunnel measurement techniques. Environ. Pollut. 2016, 210, 419–428. [Google Scholar] [CrossRef]
- Crilley, L.R.; Lucarelli, F.; Bloss, W.J.; Harrison, R.M.; Beddows, D.C.; Calzolai, G.; Nava, S.; Valli, G.; Bernardoni, V.; Vecchi, R. Source apportionment of fine and coarse particles at a roadside and urban background site in London during the 2012 summer ClearfLo campaign. Environ. Pollut. 2017, 220, 766–778. [Google Scholar] [CrossRef] [PubMed] [Green Version]
- Oliveira, C.; Pio, C.; Caseiro, A.; Santos, P.; Nunes, T.; Mao, H.; Luahana, L.; Sokhi, R.S. Road traffic impact on urban atmospheric aerosol loading at Oporto, Portugal. Atmos. Environ. 2010, 44, 3147–3158. [Google Scholar] [CrossRef]
- Oakes, M.M.; Burke, J.M.; Norris, G.A.; Kovalcik, K.D.; Pancras, J.P.; Landis, M.S. Near-road enhancement and solubility of fine and coarse particulate matter trace elements near a major interstate in Detroit, Michigan. Atmos. Environ. 2016, 145, 213–224. [Google Scholar] [CrossRef]
- Jeong, C.-H.; Wang, J.M.; Hilker, N.; Debosz, J.; Sofowote, U.; Su, Y.; Noble, M.; Healy, R.M.; Munoz, T.; Dabek-Zlotorzynska, E.; et al. Temporal and spatial variability of traffic-related PM2.5 sources: Comparison of exhaust and non-exhaust emissions. Atmos. Environ. 2019, 198, 55–69. [Google Scholar] [CrossRef]
- Sofowote, U.M.; Di Federico, L.M.; Healy, R.M.; Debosz, J.; Su, Y.; Wang, J.; Munoz, A. Heavy metals in the near-road environment: Results of semi-continuous monitoring of ambient particulate matter in the greater Toronto and Hamilton area. Atmos. Environ. X 2019, 1, 1000005. [Google Scholar] [CrossRef]
- Dabek-Zlotorzynska, E.; Celo, V.; Ding, L.; Herod, D.; Jeong, C.H.; Evans, G.; Hilker, N. Characteristics and sources of PM2.5 and reactive gases near roadways in two metropolitan areas in Canada. Atmos. Environ. 2019, 218, 116980. [Google Scholar] [CrossRef]
- Farahani, V.J.; Soleimanian, E.; Pirhadi, M.; Sioutas, C. Long-term trends in concentrations and sources of PM2.5–bound metals and elements in central Los Angeles. Atmos. Environ. 2021, 253, 118361. [Google Scholar] [CrossRef]
- Lipsett, M.J.; Tsai, F.C.; Roger, L.; Woo, M.; Ostro, B.D. Coarse particles and heart rate variability among older adults with coronary artery disease in the Coachella Valle, California. Environ. Health Prospect. 2006, 114, 1215–1220. [Google Scholar] [CrossRef] [PubMed] [Green Version]
- Perez, L.; Medina-Ramón, M.; Künzli, N.; Alastuey, A.; Pey, J.; Pérez, N.; Garcia, R.; Tobias, A.; Querol, X.; Sunyer, J. Size fractionate particulate matter, vehicle traffic, and case-specific daily mortality in Barcelona, Spain. Environ. Sci. Technol. 2009, 43, 4707–4714. [Google Scholar] [CrossRef] [PubMed]
- Cheung, K.; Shafer, M.M.; Schauer, J.J.; Sioutas, C. Diurnal trends in oxidative potential of coarse particulate matter in the Los Angeles Basin and their relation to sources and chemical composition. Environ. Sci. Technol. 2012, 46, 3779–3787. [Google Scholar] [CrossRef] [PubMed]
- Wang, J.M.; Jeong, C.-H.; Hilker, N.; Shairsingh, K.K.; Healy, R.M.; Sofowote, U.; Debosz, J.; Su, Y.; McGaughey, M.; Doerksen, G.; et al. Near-road air pollutant measurements: Accounting for inter-site variability using emission Factors. Environ. Sci. Technol. 2018, 52, 9495–9504. [Google Scholar] [CrossRef] [PubMed]
- Celo, V.; Dabek-Zlotorzynska, E.; Mathieu, D.; Okonskaia, I. Validation of simple microwave-assisted acid digestion method using microvessels for analysis of trace elements in atmospheric PM2.5 in monitoring and fingerprinting studies. Open Chem. Biomed. Methods J. 2010, 3, 141–150. [Google Scholar]
- Wang, X.; Chow, J.C.; Kohl, S.D.; Percy, K.E.; Legge, A.H.; Watson, J.G. Characterization of PM2.5 and PM10 fugitive dust source profiles in the Athabasca Oil Sands Region. J. Air Waste Manag. Assoc. 2015, 65, 1421–1433. [Google Scholar] [CrossRef] [Green Version]
- Paatero, P.; Tapper, U. Positive matrix factorization: A non-negative factor model with optimal utilization of error estimates of data values. Environmetrics 1994, 5, 111–126. [Google Scholar] [CrossRef]
- Brown, S.G.; Eberly, S.; Paatero, P.; Norris, G.A. Methods for estimating uncertainty in PMF solutions: Examples with ambient air and water quality data and guidance on reporting PMF results. Sci. Total Environ. 2015, 518–519, 626–635. [Google Scholar] [CrossRef] [Green Version]
- Hopke, P.K. Review of receptor modeling methods for source apportionment. J. Air Waste Manag. Assoc. 2016, 66, 237–259. [Google Scholar] [CrossRef]
- Clements, N.; Eav, J.; Xie, M.; Hannigan, M.P.; Miller, S.L.; Navidi, W.; Peel, J.L.; Schauer, J.J.; Shafer, M.M.; Milford, J.B. Concentrations and source insights for trace elements in fine and coarse particulate matter. Atmos. Environ. 2014, 89, 373–381. [Google Scholar] [CrossRef]
- Scerri, M.M.; Genga, A.; Iacobellis, S.; Delmaire, G.; Giove, A.; Siciliano, M.; Siciliano, T.; Weinbruch, S. Investigating the plausibility of a PMF source apportionment solution derived using a small dataset: A case study from a receptor in a rural site in Apulia—South-East Italy. Chemosphere 2019, 236, 124376. [Google Scholar] [CrossRef]
- Norris, G.; Duvall, R.; Brown, S.; Bai, S. EPA Positive Matrix Factorization (PMF) 5.0 Fundamentals and User Guide; U.S. Environment Protection Agency: Washington, DC, USA, 2014. Available online: http://www.epa.gov/sites/production/files/2015-02/documents/pmf_5.0_user_guide.pdf (accessed on 31 May 2021).
- Standards Development Branch, Ontario Ministry of the Environment and Climate Change. Ontario’s Ambient Air Quality Criteria—Sorted by Contaminant Name. 2012. Available online: http://www.airqualityontario.com/downloads/AmbientAirQualityCriteria.pdf (accessed on 31 August 2021).
- Grigoratos, T.; Martini, G. Brake wear particle emissions: A review. Environ. Sci. Pollut. Res. Int. 2015, 22, 2491–2504. [Google Scholar] [CrossRef] [PubMed] [Green Version]
- Kukutschová, J.; Moravec, P.; Tomášek, V.; Matějka, V.; Smolík, J.; Schwarz, J.; Seidlerová, J.; Šafářová, K.; Filip, P. On airborne nano/micro-sized wear particles released from low-metallic automotive brakes. Environ. Pollut. 2011, 159, 998–1006. [Google Scholar] [CrossRef] [PubMed]
- Kukutschová, J.; Filip, P. Chapter 6: Review of Brake Wear Emissions: A Review of Brake Emission Measurement Studies: Identification of Gaps and Future Needs. In Non-Exhaust Emissions—An Urban Air Quality Problem for Public Health, Impact and Mitigation Measures; Amato, F., Ed.; Academic Press: San Diego, CA, USA, 2018; pp. 123–146. [Google Scholar]
- US EPA. Risk Assessment Guidance for Superfund Volume 1: Human Health Evaluation Manual (Part A); Office of Emergency and Remedial Response: Washington, DC, USA, 1989. [Google Scholar]
- Gietl, J.K.; Lawrence, R.; Thorpe, A.J.; Harrison, R.M. Identification of brake wear particles and derivation of a quantitative tracer for brake dust at a major road. Atmos. Environ. 2010, 44, 141–146. [Google Scholar] [CrossRef]
- Goddard, S.L.; Williams, K.R.; Robins, C.; Brown, R.J.C. Determination of antimony and barium in UK air quality samples as indicators of non-exhaust traffic emissions. Environ. Monit. Assess. 2019, 191, 641. [Google Scholar] [CrossRef] [PubMed]
- Sternbeck, J.; Sjodin, A.; Andreasson, K. Metal emissions from road traffic and the influence of resuspension—results from two tunnel studies. Atmos. Environ. 2002, 36, 4735–4744. [Google Scholar] [CrossRef]
- Sanders, P.G.; Xu, N.; Dalka, T.M.; Maricq, M.M. Airborne brake wear debris: Size distributions, composition, and a comparison of dynamometer and vehicle tests. Environ. Sci. Technol. 2003, 37, 4060–4069. [Google Scholar] [CrossRef] [PubMed]
- Wang, J.M.; Jeong, C.-H.; Hilker, N.; Healy, R.M.; Sofowote, U.; Debosz, J.; Su, Y.; Munoz, A.; Evans, G.J. Quantifying metal emissions from vehicular traffic using real world emission factors. Environ. Pollut. 2021, 268, 115805. [Google Scholar] [CrossRef]
- Hagino, H.; Oyama, M.; Sasaki, S. Laboratory testing of airborne brake wear particle emissions using a dynamometer system under urban city driving cycles. Atmos. Environ. 2016, 131, 269–278. [Google Scholar] [CrossRef] [Green Version]
- Kulkarni, P.; Chellam, S.; Fraser, M.P. Tracking petroleum refinery emission events using lanthanum and lanthanides as elemental markers for PM2.5. Environ. Sci. Technol. 2007, 41, 6748–6754. [Google Scholar] [CrossRef]
- Celo, V.; Dabek-Zlotorzynska, E.; Zhao, J.; Bowman, D. Concentration and source origin of lanthanoids in the Canadian atmospheric particulate matter: A case study. Atmos. Pollut. Res. 2012, 3, 270–278. [Google Scholar] [CrossRef] [Green Version]
- Celo, V.; Dabek-Zlotorzynska, E.; McCurdy, M. Chemical characterization of exhaust emissions from selected Canadian marine vessels: The case of trace metals and Lanthanoids. Environ. Sci. Technol. 2015, 49, 5220–5226. [Google Scholar] [CrossRef]
- Jeong, C.-H.; McGuire, M.L.; Herod, D.; Dann, T.; Dabek-Zlotorzynska, E.; Wang, D.; Ding, L.; Celo, V.; Mathieu, D.; Evans, G. Receptor model based identification of PM2.5 sources in Canadian cities. Atmos. Pollut. Res. 2011, 2, 158–171. [Google Scholar] [CrossRef] [Green Version]
- Sofowote, U.M.; Su, Y.; Dabek-Zlotorzynska, E.; Rastogi, A.K.; Brook, J.; Hopke, P.K. Sources and temporal variations of constrained PMF factors obtained from multiple-year receptor modeling of ambient PM2.5 data from five speciation sites in Ontario, Canada. Atmos. Environ. 2015, 108, 140–150. [Google Scholar] [CrossRef]
- Bukowiecki, N.; Lienemann, P.; Hill, M.; Furger, M.; Richard, A.; Amato, F.; Prévôt, A.S.H.; Baltensperger, U.; Buchmann, B.; Gehrig, R. PM10 emission factors for non-exhaust particles generated by road traffic in an urban street canyon and along a freeway in Switzerland. Atmos. Environ. 2010, 44, 2330–2340. [Google Scholar] [CrossRef]
- Hjortenkrans, D.; Bergbäck, B.; Häggerud, A. New metal emission patterns in road traffic environments. Environ. Monit. Assess. 2006, 117, 85–98. [Google Scholar] [CrossRef] [PubMed]
- Murakami, M.; Nakajima, F.; Furumai, H.; Tomiyasu, B.; Owari, M. Identification of particles containing chromium and lead in road dust and soakaway sediment by electron probe microanalyser. Chemosphere 2007, 67, 2000–2010. [Google Scholar] [CrossRef] [PubMed]
- Zwozdziak, A.; Gini, M.I.; Samek, L.; Rogula-Kozlowska, W.; Sowka, I.; Eleftheriadis, K. Implications of the aerosol size distribution modal structure of trace and major elements on human exposure, inhaled dose and relevance to the PM2.5 and PM10 metrics in a European pollution hotspot urban area. J. Aerosol Sci. 2017, 103, 38–52. [Google Scholar] [CrossRef]
- Varrica, D.; Bardelli, F.; Dongarra, G.; Tamburo, E. Speciation of Sb in airborne particulate matter, vehicle brake linings, and brake pad wear residues. Atmos. Environ. 2013, 64, 18–24. [Google Scholar] [CrossRef]
- Kim, S.H.; Shim, W.; Kwon, S.U.; Lee, J.J.; Seo, M.W.; Kim, J.K.; Pee, J.H.; Kim, J.Y. The impact of composition in nonsteel and lowsteel type friction materials on airborne brake wear particulate emission. Tribol. Lett. 2020, 68, 118. [Google Scholar] [CrossRef]
- Moreno, T.; Querol, X.; Alastuey, A.; Gibbons, W. Identification of FCC refinery atmospheric pollution events using lanthanoid- and vanadium-bearing aerosols. Atmos. Environ. 2008, 42, 7851–7861. [Google Scholar] [CrossRef]
- Moreno, T.; Querol, X.; Alastuey, A.; Pey, J.; Cruz Minguillon, M.; Perez, N.; Bernabe, R.; Blanco, S.; Cardenas, B.; Gibbons, W. Lanthanoid geochemistry of urban atmospheric particulate matter. Environ. Sci. Technol. 2008, 42, 6502–6507. [Google Scholar] [CrossRef] [PubMed]
- Gantt, B.; Hoque, S.; Willis, R.D.; Fahey, K.M.; Delgado-Saborit, J.M.; Harrison, R.; Erdakos, G.B.; Bhave, P.V.; Zhang, K.M.; Kovalcik, K.; et al. Near-road modeling and measurement of Cerium-containing particles generated by nanoparticle diesel fuel additive use. Environ. Sci. Technol. 2014, 48, 10607–10613. [Google Scholar] [CrossRef] [PubMed]
- Gantt, B.; Hoque, S.; Fahey, K.M.; Willis, R.D.; Delgado-Saborit, J.M.; Harrison, R.M.; Zhang, K.M.; Jefferson, D.A.; Kalberer, M.; Bunker, K.L.; et al. Factors Affecting the Ambient Physicochemical Properties of Cerium-Containing Particles Generated by Nanoparticle Diesel Fuel Additive Use. Aerosol Sci. Technol. 2015, 49, 371–380. [Google Scholar] [CrossRef] [Green Version]
- Grigoratos, T. Chapter 4: Regulation on Brake/Tire Composition. In Non-Exhaust Emissions—An Urban Air Quality Problem for Public Health, Impact and Mitigation Measures; Amato, F., Ed.; Academic Press: London, UK, 2018; pp. 89–100. [Google Scholar]
- Penkała, M.; Ogrodnik, P.; Rogula-Kozłowska, W. Particulate matter from the road surface abrasion as a problem of non-exhaust emission control. Environments 2018, 5, 9. [Google Scholar] [CrossRef] [Green Version]
- Grieshop, A.P.; Lipsky, E.M.; Pekney, N.J.; Takahama, S.; Robinson, A.L. Fine particle emission factors from vehicles in a highway tunnel: Effects of fleet composition and season. Atmos. Environ. 2006, 40, 287–298. [Google Scholar] [CrossRef]


| Site (NAPS ID) | Site Name | Latitude, Longitude | Site Type/Traffic Density (Veh/Day) | Measurement Period |
|---|---|---|---|---|
| Toronto, ON (060438) a | NR-TOR | 43.711, −79.543 | Highway Open Terrain (365,000–411,600) | 29 July 2015– 30 June 2017 |
| Toronto, ON (060440) a | BG-TOR | 43.781, −79.467 | Urban Background (traffic not allowed) | 18 May 2015–27 April 2017 |
| Vancouver, BC (100141) a,c | NR-VAN | 49.260, −123.078 | Urban Road Street Canyon (~30,000) | 11 July 2015– 30 June 2017 |
| Vancouver, BC (100142) b | BG-VAN | 49.253, −123.049 | Urban Background (traffic not allowed) | 11 July 2015– 28 August 2016 |
| NR-TOR (n = 229) | BG-TOR (n = 113) | NR-VAN (n = 186) | BG-VAN (n = 70) | |||||||||||||
|---|---|---|---|---|---|---|---|---|---|---|---|---|---|---|---|---|
| Mean | Median | S.D. | Max. | Mean | Median | S.D. | Max. | Mean | Median | S.D. | Max. | Mean | Median | S.D. | Max. | |
| PM2.5 | 8.2 | 7.2 | 4.3 | 28.7 | 6.2 | 5.2 | 4.1 | 27.1 | 6.6 | 5.7 | 3.3 | 20.7 | 4.6 | 4.1 | 2.4 | 14.4 |
| Al-XRF | 21 | 8 | 20 | 95 | 19 | 8 | 17 | 81 | 22 | 9 | 22 | 105 | 18 | 11 | 19 | 112 |
| Si-XRF | 56 | 49 | 37 | 197 | 35 | 26 | 33 | 186 | 41 | 33 | 30 | 170 | 31 | 24 | 28 | 178 |
| K-XRF | 50 | 42 | 49 | 592 | 39 | 32 | 25 | 135 | 39 | 29 | 42 | 416 | 38 | 26 | 59 | 462 |
| Ca-XRF | 89 | 76 | 55 | 289 | 48 | 42 | 32 | 153 | 35 | 31 | 20 | 156 | 26 | 22 | 21 | 163 |
| Ti-XRF | 7 | 7 | 4 | 18 | 3.6 | 3.2 | 3 | 10 | 5.6 | 4.9 | 3 | 17 | 2.8 | 2.7 | 2 | 9 |
| Fe-XRF | 174 | 140 | 116 | 517 | 61 | 46 | 52 | 256 | 131 | 109 | 83 | 427 | 56 | 39 | 45 | 238 |
| V | 0.2 | 0.1 | 0.1 | 0.6 | 0.12 | 0.09 | 0.1 | 0.6 | 0.71 | 0.53 | 0.7 | 4.3 | 0.54 | 0.38 | 0.7 | 4.6 |
| Cr | 0.8 | 0.7 | 0.4 | 2.9 | 0.43 | 0.37 | 0.3 | 1.7 | 0.71 | 0.6 | 0.4 | 2.5 | 0.4 | 0.19 | 0.6 | 4.3 |
| Mn | 3.2 | 2.8 | 2.2 | 15 | 1.9 | 1.5 | 1.6 | 8.9 | 2.1 | 1.7 | 1.5 | 10.7 | 1.5 | 1.2 | 1.2 | 6.4 |
| Ni | 0.3 | 0.3 | 0.2 | 1.1 | 0.21 | 0.09 | 0.2 | 0.7 | 0.59 | 0.47 | 0.4 | 3.4 | 0.5 | 0.4 | 0.5 | 2.5 |
| Cu | 8.9 | 8 | 5.6 | 26.9 | 3.6 | 3 | 2 | 11.7 | 9 | 7.4 | 6 | 33.9 | 4.2 | 3.1 | 3.6 | 18.5 |
| Zn | 23.1 | 16.2 | 23 | 155 | 24.7 | 11.4 | 24 | 142 | 9.9 | 7.9 | 6 | 31 | 6.3 | 4.4 | 5 | 27 |
| As | 0.55 | 0.45 | 0.4 | 2.3 | 0.45 | 0.32 | 0.4 | 1.6 | 0.45 | 0.34 | 0.5 | 3.8 | 0.38 | 0.31 | 0.3 | 1.7 |
| Se | 0.71 | 0.57 | 0.8 | 7.5 | 0.58 | 0.37 | 0.5 | 3 | 0.15 | 0.14 | 0.1 | 0.5 | 0.14 | 0.13 | 0.1 | 0.3 |
| Sr | 1.19 | 0.8 | 4.4 | 56.4 | 0.39 | 0.3 | 0.4 | 3 | 0.64 | 0.49 | 0.9 | 10.5 | 0.51 | 0.14 | 1.6 | 12.8 |
| Mo | 0.35 | 0.31 | 0.2 | 1.38 | 0.18 | 0.15 | 0.15 | 0.74 | 0.44 | 0.38 | 0.26 | 1.44 | 0.22 | 0.18 | 0.15 | 0.64 |
| Cd | 0.09 | 0.06 | 0.34 | 4.49 | 0.09 | 0.05 | 0.34 | 2.96 | 0.06 | 0.04 | 0.07 | 0.5 | 0.08 | 0.04 | 0.12 | 0.7 |
| Sn | 1.32 | 1.15 | 0.8 | 4.4 | 0.71 | 0.52 | 0.6 | 3.3 | 0.86 | 0.71 | 0.6 | 3.5 | 0.41 | 0.31 | 0.4 | 2 |
| Sb | 1.45 | 1.32 | 0.84 | 4.85 | 0.55 | 0.41 | 0.54 | 4.08 | 1.17 | 0.98 | 0.72 | 4.08 | 0.56 | 0.47 | 0.38 | 1.82 |
| Ba | 17.6 | 15 | 13.1 | 57.4 | 3.6 | 2.8 | 2.7 | 13.6 | 11.4 | 9.7 | 6.8 | 40.5 | 4.3 | 3 | 5.5 | 41.9 |
| La | 0.04 | 0.03 | 0.02 | 0.14 | 0.03 | 0.02 | 0.03 | 0.17 | 0.59 | 0.35 | 0.66 | 3.23 | 0.41 | 0.27 | 0.48 | 2.68 |
| Ce | 0.06 | 0.06 | 0.03 | 0.18 | 0.03 | 0.02 | 0.02 | 0.13 | 0.19 | 0.11 | 0.23 | 1.9 | 0.11 | 0.06 | 0.15 | 0.72 |
| Pb | 1.9 | 1.5 | 1.5 | 9.4 | 2 | 1.3 | 1.3 | 7.1 | 1.5 | 1.1 | 1.3 | 9.8 | 1.6 | 0.97 | 2.4 | 17.9 |
| Total | 456 | 397 | 245 | 1219 | 245 | 214 | 153 | 755 | 315 | 264 | 171 | 967 | 194 | 155 | 125 | 699 |
| NR-TOR (n = 229) | BG-TOR (n = 113) | NR-VAN (n = 186) | BG-VAN (n = 70) | |||||||||||||
|---|---|---|---|---|---|---|---|---|---|---|---|---|---|---|---|---|
| Mean | Median | S.D. | Max. | Mean | Median | S.D. | Max. | Mean | Median | S.D. | Max. | Mean | Median | S.D. | Max. | |
| PM10-2.5 | 8.7 | 5.9 | 9.6 | 73.5 | 5.9 | 4.9 | 3.9 | 21.0 | 6.4 | 5.5 | 4.0 | 32.2 | 4.5 | 4.6 | 2.0 | 9.4 |
| Al-XRF | 153 | 110 | 154 | 823 | 138 | 100 | 123 | 618 | 191 | 148 | 167 | 1000 | 108 | 70 | 94 | 308 |
| Si-XRF | 388 | 302 | 359 | 2270 | 340 | 222 | 300 | 1637 | 438 | 317 | 346 | 2200 | 264 | 219 | 188 | 695 |
| K-XRF | 47 | 37 | 37 | 221 | 44 | 39 | 31 | 165 | 43 | 38 | 24 | 153 | 37 | 35 | 18 | 109 |
| Ca-XRF | 488 | 346 | 454 | 2280 | 404 | 311 | 319 | 1501 | 149 | 120 | 107 | 607 | 108 | 88 | 69 | 333 |
| Ti-XRF | 14 | 11 | 11 | 52 | 11 | 8 | 8 | 35 | 17 | 15 | 10 | 56 | 8 | 7 | 5 | 25 |
| Mn-XRF | 5 | 3 | 4 | 17 | 3 | 2 | 3 | 10 | 4 | 3 | 3 | 14 | 2 | 1 | 1 | 6 |
| Fe-XRF | 297 | 221 | 237 | 1040 | 144 | 111 | 109 | 451 | 383 | 330 | 230 | 1242 | 156 | 128 | 113 | 591 |
| Zn_XRF | 11 | 8 | 9 | 50 | 12 | 6 | 20 | 104 | 9 | 7 | 6 | 40 | 4 | 3 | 3 | 14 |
| Total | 1383 | 942 | 1221 | 6067 | 971 | 710 | 849 | 4331 | 1233 | 995 | 948 | 5680 | 687 | 534 | 477 | 1836 |
Publisher’s Note: MDPI stays neutral with regard to jurisdictional claims in published maps and institutional affiliations. |
© 2021 by the authors. Licensee MDPI, Basel, Switzerland. This article is an open access article distributed under the terms and conditions of the Creative Commons Attribution (CC BY) license (https://creativecommons.org/licenses/by/4.0/).
Share and Cite
Celo, V.; Yassine, M.M.; Dabek-Zlotorzynska, E. Insights into Elemental Composition and Sources of Fine and Coarse Particulate Matter in Dense Traffic Areas in Toronto and Vancouver, Canada. Toxics 2021, 9, 264. https://doi.org/10.3390/toxics9100264
Celo V, Yassine MM, Dabek-Zlotorzynska E. Insights into Elemental Composition and Sources of Fine and Coarse Particulate Matter in Dense Traffic Areas in Toronto and Vancouver, Canada. Toxics. 2021; 9(10):264. https://doi.org/10.3390/toxics9100264
Chicago/Turabian StyleCelo, Valbona, Mahmoud M. Yassine, and Ewa Dabek-Zlotorzynska. 2021. "Insights into Elemental Composition and Sources of Fine and Coarse Particulate Matter in Dense Traffic Areas in Toronto and Vancouver, Canada" Toxics 9, no. 10: 264. https://doi.org/10.3390/toxics9100264
APA StyleCelo, V., Yassine, M. M., & Dabek-Zlotorzynska, E. (2021). Insights into Elemental Composition and Sources of Fine and Coarse Particulate Matter in Dense Traffic Areas in Toronto and Vancouver, Canada. Toxics, 9(10), 264. https://doi.org/10.3390/toxics9100264